

Abstract
Interleukin-10 (IL-10) is the most potent anti-inflammatory cytokine in the body and plays an essential role in determining outcomes of many inflammatory diseases. Cellular metabolism is a critical determinant of immune cell function; however, it is currently unclear whether metabolic processes are specifically involved in IL-10 production. In this study, we aimed to find the central metabolic molecule regulating IL-10 production of macrophages, which are the main producers of IL-10. Transcriptomic analysis identified that metabolic changes were predominantly enriched in Kupffer cells at the early inflammatory phase of a mouse endotoxemia model. Among them, pyruvate dehydrogenase kinase (PDK)-dependent acute glycolysis was negatively involved in IL-10 production. Inhibition or knockdown of PDK selectively increased macrophage IL-10 expression. Mechanistically, PDK inhibition increased IL-10 production via profound phosphorylation of adenosine monophosphate (AMP)-activated protein kinase alpha 1 (AMPKα1) by restricting glucose uptake in lipopolysaccharide-stimulated macrophages. AMPKα1 consequently activated p38 mitogen-activated protein kinase, c-Jun N-terminal kinase, and cyclic AMP-responsive element-binding protein to regulate IL-10 production. Our study uncovers a previously unknown regulatory mechanism of IL-10 in activated macrophages involving an immunometabolic function of PDK.
Keywords: macrophage, pyruvate dehydrogenase kinase, AMP-activated protein kinase, interleukin-10
Introduction
Interleukin-10 (IL-10) is the primary anti-inflammatory cytokine with a crucial role in preventing inflammatory and autoimmune pathologies (Moore et al., 2001; Hawrylowicz and O'Garra, 2005). IL-10-deficient mice develop inflammatory bowel disease following colonization of the gut by particular microorganisms (Kuhn et al., 1993; Sellon et al., 1998), and they show other exaggerated inflammatory responses to microbial challenge. IL-10 exerts its effect via the IL-10 receptor and activation of signal transducer and activator of transcription 3 (STAT3) (Moore et al., 2001; Murray, 2006). STAT3 translocates to the nucleus and promotes the expression of a defined set of genes encoding anti-inflammatory mediators. Mounting evidence suggests that IL-10 is a non-redundant cytokine that regulates appropriate immune responses (Moore et al., 2001), and elucidating the mechanisms underlying IL-10 expression and production is of paramount importance for discovering key molecular regulators controlling processes involved in various pathologies. However, pharmacologic administration of IL-10 has not proven effective (Fedorak et al., 2000; Schreiber et al., 2000), and little is known about the other effective intervention strategies that can control IL-10 in inflammatory diseases.
IL-10 production is associated with many immune cells including macrophages, regulatory T cells, dendritic cells (DCs), natural killer cells and B cells (Mosser and Edwards, 2008). Several layers of regulation of IL-10 expression exist, including chromatin structure modifications of the Il10 locus by extracellular signal-regulated kinases (ERK) (Lucas et al., 2005; Saraiva et al., 2005), enhancement of Il10 transcription by nuclear factor-κBp50 (NF-κBp50) homodimers, CCAAT/enhancer binding protein-β (C/EBPβ), or cyclic adenosine monophosphate (cAMP)-responsive element-binding protein (CREB) (Cao et al., 2006; Csoka et al., 2007; Ananieva et al., 2008), and posttranscriptional mechanisms (Stoecklin et al., 2008). Myeloid cell-specific signaling cascades are mainly initiated after the activation of Toll-like receptors (TLRs) through Toll/IL-1 receptor (TIR) domain-containing adaptor molecules such as myeloid differentiation primary response protein 88 (MyD88) and TIR domain-containing adaptor protein-inducing interferon-β (TRIF), leading to the production of IL-10 and proinflammatory cytokines (Boonstra et al., 2006). The amount of IL-10 produced correlates with the strength of ERK activation, which is higher in macrophages than in DCs or lymphocytes (Agrawal et al., 2006).
Recent studies of macrophage cellular metabolism showed profound alterations in metabolic profiles during activation (Pearce and Pearce, 2013; Ganeshan and Chawla, 2014; Kelly and O'Neill, 2015; O'Neill and Pearce, 2016; Na et al., 2018). For instance, M1 macrophages activated with lipopolysaccharide (LPS) undergo metabolic changes toward glycolysis, while M2 macrophages primed with IL-4 commit to oxidative phosphorylation (Vats et al., 2006; Rodriguez-Prados et al., 2010). Both suggest that metabolic changes during macrophage activation are key components of macrophage polarization and instrumental to their function in inflammation (Kelly and O'Neill, 2015; Na et al., 2018). IL-10 production has long been considered one of typical features of ‘M2-like’ resident macrophages in our body (Davies et al., 2013), so it will enhance our understanding of key regulatory mechanisms of IL-10 expression in macrophages especially with a focus on cellular metabolic features.
Here we show that pyruvate dehydrogenase kinase (PDK), a key regulatory enzyme for glucose metabolism, is a negative regulator of IL-10 production in LPS-stimulated macrophages. Blocking PDK activity with a genetic approach and treating with dichloroacetate (DCA) in activated macrophages increased IL-10 production primarily through phosphorylation of AMP-activated protein kinase alpha 1 (AMPKα1) via restriction of glucose uptake and increasing the AMP/adenosine triphosphate (ATP) ratio. The resulting activation of ERK1/2, p38 mitogen-activated protein kinase (MAPK), c-Jun N-terminal kinase (JNK), and CREB enhances IL-10 production and limits overt inflammatory cascades in endotoxin-challenged mice. Our data reveal a new immunometabolic role for PDK in macrophage IL-10 production.
Results
Activated Kupffer cells increase their glycolytic metabolism via PDK activation
Although there is growing evidence that metabolic changes are involved in innate immune responses (Pearce and Pearce, 2013; Pearce et al., 2013; Everts et al., 2014), it is not clear whether this metabolic event participates in in situ tissue-resident macrophage activation. Kupffer cells are known as major sources of systemic IL-10 (Emmanuilidis et al., 2001; Traeger et al., 2010), so we first sought to determine the early responses of Kupffer cells after TLR activation to identify potential key metabolic events involving IL-10 production. We isolated Kupffer cells (Supplementary Figure S1) from bolus LPS-injected mice at 1 and 4 h and performed quantitative RNA sequencing (Figure 1A and B). The transcriptome analysis identified 5627 (2893, increased; 2734, decreased) differentially expressed genes (DEGs) in Kupffer cells in LPS-injected mice compared to naïve mice. Various cytokines and chemokines were induced as early as 1 h after LPS injection (Figure 1A). Gene ontology analysis of DEGs revealed that the primary changes were in metabolic processes, indicating that global metabolic preparation is required to support innate immune responses (Figure 1B). In accordance with this, we found that various genes involved in glycolysis were increased after LPS stimulation (Figure 1A). Because glycolytic genes were enriched, we determined whether Kupffer cells induce acute glycolysis after LPS stimulation. We injected 2-deoxyglucose (2-DG) just before LPS administration and analyzed total 2-DG uptake levels for 1 h from each cellular component (Figure 1C). Basal glucose uptake by monocytes and macrophages was higher than CD8+ T cells and endothelial cells, and glucose uptake was significantly increased after LPS challenge in macrophages only.
Figure 1.
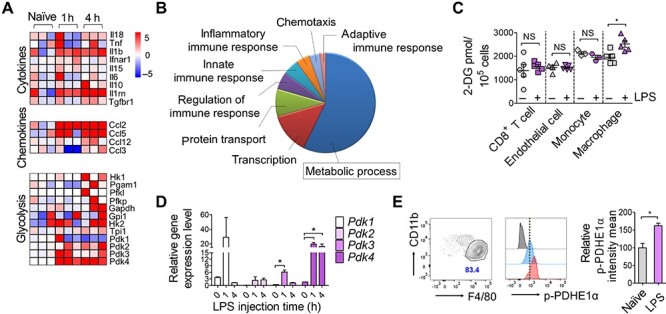
Kupffer cells increase glycolytic metabolism during early endotoxemia. (A and B) Genome-wide transcriptional profiles of Kupffer cells from naïve and LPS-injected mice 1 and 4 h after administration of Escherichia coli LPS (20 mg/kg body weight). (A) Heat maps representing genes (labels to the right of plots) clustered in Gene Ontology Biological Process (GOBP) cytokine, chemokine, and glycolysis (labels to the left of plots) with scaled log2 intensity. Warm color (red) denotes an increase in gene expression whereas cold color (blue) indicates a decrease compared to average level of gene expression in naïve macrophages. (B) Pie chart representing differential GOBP associated with increased genes in LPS-affected macrophages 4 h after LPS injection compared to naïve macrophages. (C) Glucose uptake analysis of CD8+ T cells, endothelial cells, monocytes, and macrophages isolated from LPS- or mock-treated mice. 2-DG was injected 15 min before LPS administration. Cells were isolated from liver (macrophages and endothelial cells, sorted) or spleen (CD8+ T cells and monocytes, isolated with magnetic kit) 1 h after LPS injection. 2-DG uptake was measured using a glucose uptake fluorometric assay kit in lysates of 105 cells. n = 3–5 biological replicates. *P < 0.05, t-test. (D) Gene expression of Pdk1–Pdk4 in LPS-stimulated Kupffer cells determined using quantitative real-time PCR (qPCR). Cells were isolated 1 and 4 h after LPS stimulation. n = 3–5 biological replicates. *P < 0.05, t-test. (E) p-PDHE1α protein content in Kupffer cells isolated from LPS-injected mice (1 h) determined using flow cytometry. Gating of CD45+CD11blowLy6G−Ly6C−CD64+F4/80high Kupffer cells and relative geomean intensities for p-PDHE1α staining are presented as dot plot and histogram respectively. Quantitative graph for the intensities of p-PDHE1α are shown in right. n = 3 biological replicates. *P < 0.05, t-test.
Among known glycolytic enzymes, PDK is the final determinant between oxidative phosphorylation and lactic acid production by regulating pyruvate dehydrogenase (PDH) activity to convert pyruvate into acetyl-coA or lactic acid (Roche and Hiromasa, 2007). PDK-mediated phosphorylation of the pyruvate dehydrogenase E1 component subunit alpha (PDHE1α) at three serine sites appeared to cause PDH suppression (Peterson and Schreiber, 1999), suppress pyruvate oxidation and promote its conversion to lactate via lactate dehydrogenase (LDH) (Kaplon et al., 2013). Because Pdk was upregulated in the RNA sequencing data (Figure 1A), we reconfirmed Pdk gene expression using qPCR in Kupffer cells. Gene expression levels of all Pdk isoforms (Pdk1–Pdk4) showed an increasing trend as early as 1 h after LPS injection (Figure 1D). We also measured the phosphorylation of PDHE1α using flow cytometry. Kupffer cells showed increased PDHE1α phosphorylation 2 h after LPS stimulation (Figure 1E). Collectively, these results validated the previously observed acute glycolysis in activated Kupffer cells, one of tissue-resident macrophages. They rapidly uptake glucose after LPS challenge, and PDKs are upregulated and activated.
PDK activity is required for early glycolytic changes in LPS-stimulated macrophages
To examine whether PDK activation is a typical phenomenon in LPS-stimulated macrophages other than Kupffer cells, we investigated PDK expression in mouse bone marrow-derived macrophages (BMDMs). We found that both the gene expression levels of Pdk1–Pdk4 and the protein expression levels of PDK1–PDK4 were increased in BMDMs after LPS stimulation (Figure 2A and B). LPS treatment also phosphorylated PDHE1α in Kupffer cells 1 h after LPS stimulation (Figure 2C). To reveal the specific contribution of each PDK isoform in glycolysis induction, we introduced siRNAs for each Pdk in BMDMs (Figure 2D) and determined the extracellular acidification rate (ECAR) in Pdk knockdown macrophages (Figure 2E–H). LPS stimulation acutely induced aerobic glycolysis with lactic acid production within 60 min, but Pdk knockdown macrophages did not fully induce acute glycolysis. The ECAR curve was most repressed in Pdk4 knockdown macrophages, indicating that it plays the most significant role in acute glycolysis in stimulated macrophages.
Figure 2.

PDK activity is required for early glycolytic switch in LPS-stimulated macrophages. (A) Gene transcripts of Pdk1–Pdk4 in BMDMs determined using qPCR. BMDMs were treated with LPS (100 ng/ml) for the indicated time periods. *P < 0.05, **P < 0.005, ***P < 0.001 by t-test. (B) Protein expression of PDK1–PDK4 in BMDMs determined using western blotting. (C) Western blots for p-PDHE1α, total PDHE1α, and actin in BMDMs. (D) Gene knockdown efficiencies were obtained using qPCR (left) and western blotting (right). Relative band densities are shown above the lane. *P < 0.05, **P < 0.005 by t-test. (E–H) ECAR curves of BMDMs transfected with siRNA for Pdk1 (E), Pdk2 (F), Pdk3 (G), and Pdk4 (H) or scrambled control analyzed using flux analyzer. Basal levels of unstimulated control BMDMs were the baseline and others were presented as relative percentages compared to control. ECAR was recorded after adding LPS. ***P < 0.001 by two-way ANOVA. n = 3 biological replicates.
PDK inhibition increases IL-10 production in LPS-stimulated macrophages
PDK1 is known to be an inducer of macrophage M1 polarization, and knockdown of PDK1 leads to reduced synthesis of IL-6, IL-12, TNFα, IL-1β, and inducible nitric oxide synthase in activated macrophages (Tan et al., 2015). However, the exact underlying signaling mechanism has not yet been reported. IL-10 can act as a general inhibitor of inflammatory cytokine expression, so we assumed that PDK is involved in IL-10 production in activated macrophages. To first inhibit the activities of all PDK isoforms, we used DCA, which is the most appropriate and available agent to inhibit PDK activity that is well-established for its favorable pharmacokinetic and safety profiles in patients with congenital mitochondrial defects (Lewis et al., 1998; Stacpoole et al., 2003). We indirectly confirmed whether DCA inhibits PDK activity at the minimal toxic concentration (data not shown) by determining whether phosphorylation of PDHE1α is inhibited. As a result, DCA effectively inhibited LPS-mediated PDHE1α phosphorylation (Figure 3A). In addition, DCA significantly inhibited LPS-mediated acute glycolysis (Figure 3B). To examine whether the reduced glycolysis by DCA treatment comes out from reduced glucose uptake, we analyzed the extent of glucose uptake for 1 h of LPS stimulation with or without DCA. As expected, DCA significantly decreased glucose uptake both in naïve and LPS-stimulated macrophages compared to untreated controls (Figure 3C). Next, we investigated the effect of DCA on cytokine productions. We found that DCA significantly increased Il10 gene expression and protein synthesis in LPS-stimulated macrophages (Figure 3D and E). In contrast, major pro-inflammatory cytokines synthesized by macrophages like IL-1β, IL-6, and IL-12p70 were inhibited in the presence of DCA (Figure 3F), possibly via inhibition of NF-κB activity (Figure 3G). Finally, knockdown of each PDK isoform significantly increased IL-10 production in LPS-stimulated macrophages (Figure 3H). Taken together, these results show that PDK inhibition specifically alters cytokine production in LPS-stimulated macrophages by increasing anti-inflammatory IL-10 production and decreasing pro-inflammatory cytokines.
Figure 3.

PDK inhibition increases IL-10 production in LPS-stimulated macrophages. (A) Protein levels of p-PDHE1α in LPS-stimulated BMDMs were determined using western blotting. BMDMs were pretreated with DCA (40 mM) for 1 h followed by LPS stimulation (100 ng/ml) for 2 h. Relative band intensities are indicated as a quantitative graph in right from three independent experiments. (B) ECAR of DCA-pretreated BMDMs as analyzed using a flux analyzer. ***P < 0.001 by two-way ANOVA. n = 3 biological replicates. (C) Glucose uptake of DCA-treated BMDMs after LPS stimulation. BMDMs were incubated with 10 mM glucose media for 1 h and treated with DCA before LPS stimulation. n = 3 biological replicates. *P < 0.05 by t-test. (D) Gene transcripts of Il10 were analyzed in BMDMs pretreated with DCA or not and determined by qPCR. LPS treatment lasted for 2 h. (E) IL-10 production by BMDMs pretreated with DCA or not determined by ELISA. Cells were stimulated with LPS for 24 h and culture supernatants were analyzed. (F) IL-1β, IL-6, and IL-12p70 production in DCA-pretreated BMDMs after LPS stimulation determined using ELISA. Cells were stimulated with LPS for 24 h and culture supernatants were analyzed. (G) NF-κB activity of LPS-stimulated RAW264.7 cells with various concentrations of DCA treatment. Cells were co-transfected with NF-κB luciferase reporter and β-galactosidase plasmids and pretreated with the indicated concentration of DCA followed by LPS stimulation for 8 h. Luciferase enzyme activity was determined and normalized to galactosidase activity. n = 3 biological replicates. *P < 0.05, ***P < 0.001, t-test. (H) BMDMs were transfected with siRNA for Pdk1–Pdk4 for 48 h and stimulated with LPS for 24 h. IL-10 production was determined using ELISA. n = 3 biological replicates. **P < 0.005, ***P < 0.001, t-test.
DCA activates AMPKα1 phosphorylation by restricting glucose uptake
Next, we sought to find which exact signaling pathways are involved in IL-10 regulation after DCA treatment. First, because PDK inhibition restricted cellular glucose uptake (Figure 3C), we determined whether DCA can alter the AMP/ATP ratio. DCA increased the ratio of AMP/ATP after 10 min of treatment (Figure 4A). Increased AMP concentration can directly act as an AMPKα1 agonist (Mihaylova and Shaw, 2011), which is a sensor for the cellular energy state, also known to be involved in IL-10 production (Sag et al., 2008). We found that DCA profoundly induced AMPKα1 phosphorylation from 10 min of treatment (Figure 4B). Acetyl-CoA carboxylase (ACC), a downstream target of AMPKα1, was also phosphorylated after 30 min of DCA treatment. In addition to inducing AMPKα1 phosphorylation in naïve state macrophages, DCA treatment also increased the level of AMPKα1 phosphorylation in LPS-stimulated macrophages (Figure 4C).
Figure 4.

PDK inhibition by DCA treatment phosphorylates AMPKα1 by increasing the AMP/ATP ratio. (A) AMP/ATP ratio changes in BMDMs by DCA treatment determined using luminescence-based detection kit. n = 3 biological replicates. *P < 0.05, ***P < 0.001, t-test. (B) Immunoblotting analysis of phosphorylated AMPKα1, total AMPKα1, phosphorylated ACC, and total ACC in BMDMs treated with DCA for the indicated time periods. Relative band intensities of phosphorylated AMPKα1 per total AMPKα1 were quantitated by ImageJ and presented as a graph. (C) Immunoblotting analysis of phosphorylated AMPKα1, total AMPKα1, and actin in LPS-stimulated BMDMs. DCA was pretreated for 24 h before LPS stimulation. Representative for three independent experiments. (D) IL-10 production in BMDMs obtained from WT or AMPKα1−/− mice determined by ELISA. Cells were pretreated with DCA followed by stimulation with LPS for 24 h. n = 3–6 biological replicates. **P < 0.005, t-test.
To determine AMPKα1 contribution to IL-10 production, we compared IL-10 production in BMDMs isolated from wild-type (WT) and LysM-Cre AMPKα1-floxed mice (AMPKα1−/− mice). As expected, PDK inhibition by DCA treatment did not further increase IL-10 production in LPS-stimulated AMPKα1-deficient macrophages (Figure 4D), indicating AMPKα1 involvement in its mode of action.
AMPKα1 phosphorylation by DCA treatment is involved in the activation of p38, JNK, and CREB
Next, we screened several molecules besides AMPK known to be related to IL-10 production, including MAPKs (Zhang et al., 2006; Na et al., 2015) and CREB (Ruffell et al., 2009). We found that DCA alone induced ERK1/2, p38, c-Jun N-terminal kinase (JNK), and CREB phosphorylation (Figure 5A) as early as 10 min after DCA treatment. DCA pre-treatment for 24 h also increased phosphorylation of ERK1/2, JNK, and CREB in LPS-stimulated macrophages (Figure 5B; Supplementary Figure S2). Inhibitors for each MAPK abrogated DCA-mediated increase in IL-10 production (Figure 5C–E). Dominant-negative CREB overexpression also blocked DCA effect (Figure 5F), confirming its contribution to IL-10 expression in DCA-treated LPS-stimulated macrophages. Finally, AMPKα1-deficient macrophages did not show significantly increased phosphorylation of ERK1/2, p38, and JNK or CREB (Figure 5F). Taken together, these results showed that PDK inhibition increased IL-10 production by phosphorylating MAPKs and CREB in activated macrophages. This was at least partially mediated by AMPKα1 phosphorylation.
Figure 5.
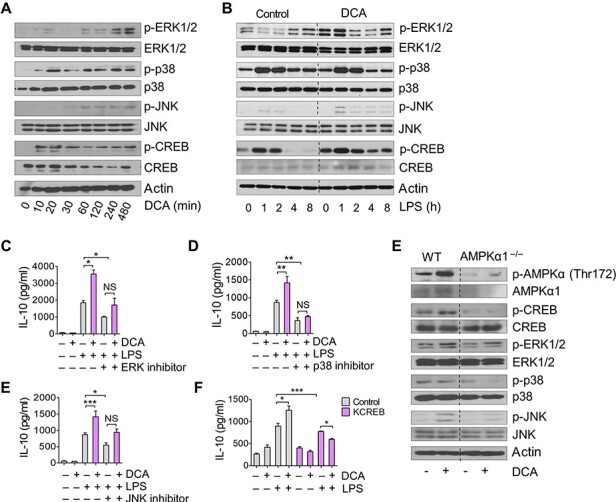
DCA increases phosphorylated MAPKs and CREB. (A) Immunoblotting analysis of phosphorylated ERK1/2, p38, JNK, CREB, and their corresponding total proteins in BMDMs. Cells were treated with DCA for the indicated time periods. (B) Immunoblotting analysis of phosphorylated ERK1/2, p38, JNK, CREB, and their corresponding total proteins in LPS-stimulated BMDMs. Cells were pretreated with DCA or not. (C–E) IL-10 production in BMDMs treated with inhibitors for MAPKs. BMDMs were untreated or pretreated with 1 μM PD98059 (ERK inhibitor, C), 0.5 μM SB203580 (p38 inhibitor, D), or 0.5 μM SP600125 (JNK inhibitor, E) 1 h before being treated with DCA. Cells were stimulated with LPS for 24 h for ELISA. (F) IL-10 production in Raw264.7 cells transfected with dominant-negative CREB vector as determined using qPCR and ELISA. DCA was applied for 1 h followed by LPS stimulation for 24 h. n = 3 biological replicates. *P < 0.05, **P < 0.005, ***P < 0.001, t-test. (G) Immunoblotting analyses for phosphorylated AMPKα1, CREB, ERK1/2, p38, JNK, and their corresponding total in BMDMs obtained from WT or AMPKα1−/− mice. Cells were treated with DCA for 2 h. Data are representative of at least three independent experiments.
PDK inhibition increases serum IL-10 in endotoxin-challenged mice
Finally, we tested whether PDK inhibition could also increase IL-10 in vivo. Mice received DCA (100 mg/kg weight) intraperitoneally (i.p.) 2 h before LPS injection, and Kupffer cells were isolated 90 min after LPS injection. Like our in vitro assays, Kupffer cells from DCA-injected mice showed significantly increased gene expression of Il10 (Figure 6A). Serum IL-10 content was also increased in DCA-injected mice (Figure 6B), in contrast to the decrease in the pro-inflammatory cytokines TNFα, IL-1β, IL-6, and IL-12p70 (Figure 6C). Functionally supporting these cytokine responses by PDK inhibition, DCA treatment completely rescued endotoxin-challenged mice from death compared to PBS-treated control mice that only survived at a rate of up to 40% (Figure 6D). Spleen weights were lower and body weights were higher in DCA-injected mice compared to control mice (Figure 6E and F), indicating that DCA alleviated the systemic inflammatory state of endotoxemia. To assess organ damage caused by systemic immune reaction in endotoxemia, we determined the serum levels of alanine transaminase (ALT), aspartate transaminase (AST), and creatinine. DCA significantly reduced ALT, AST, and creatinine levels in LPS-injected mice compared to PBS (Figure 6G–I). These findings agreed with histopathology findings (Figure 6J) showing no severe inflammation with tissue necrosis in the livers of DCA-treated mice. These results collectively showed that metabolic rewiring via PDK inhibition effectively increased macrophage IL-10 production and could ameliorate systemic tissue damaging inflammatory reactions.
Figure 6.
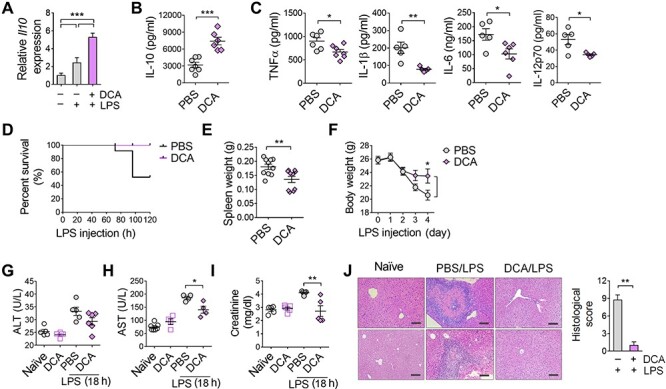
DCA treatment increases blood IL-10 in LPS-injected mice. (A) Gene expression of Il10 in Kupffer cells isolated from naïve or LPS-injected mice. DCA was injected 2 h before LPS injection and mice were sacrificed 90 min after LPS injection. ***P < 0.001, t-test. (B) Production of IL-10 levels in sera obtained from mice after 3 h of LPS injection, as quantified by ELISA. ***P < 0.001, t-test. (C) Production of TNFα, IL-1β, IL-6, and IL-12p70 levels in sera obtained from mice 3 h after LPS injection as quantified by ELISA. *P < 0.05, **P < 0.005, t-test. (D) Survival curve of mice (n = 10 per group) given a daily i.p. injection of DCA (100 mg/kg) or PBS starting 2 h before LPS (20 mg/kg) injection for 5 days. Curve comparison significance (P-value) is 0.0004 analyzed by log-rank (Mantel–Cox) test. (E) Spleen weights were measured immediately after sacrificing mice. (F) Body weights were measured daily. (G–I) ALT (G), AST (H), and creatinine (I) levels in sera obtained from mice 18 h after LPS injection. (J) Histopathology of livers from naïve and septic mice. Histological scoring is indicated in right. Data are representative of three independent experiments. Scale bar, 100 μm. **P < 0.005, t-test.
Discussion
The results presented in this study reveal a critical role for PDK in IL-10 production in activated macrophages. PDK inhibition effectively restricted glucose uptake by macrophages, increased the AMP/ATP ratio, and phosphorylated AMPKα1. This consequently activated ERK1/2, p38, JNK, and CREB, which were all involved in the IL-10 production increase (Figure 7). Due to the key role of IL-10 in immune responses, our report on PDK involvement in IL-10 synthesis will provide valuable insight for understanding an important regulatory mechanism for IL-10 regarding cellular metabolism in macrophages.
Figure 7.
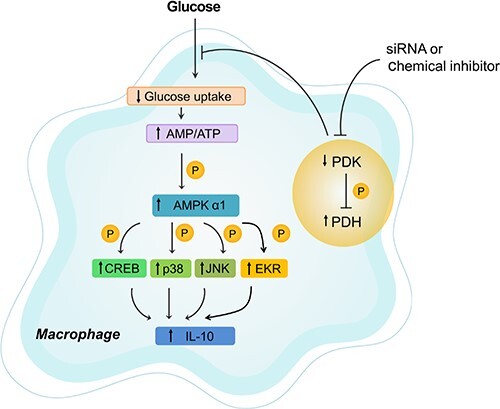
Schematic depiction showing PDK inhibition-mediated anti-inflammatory effects on macrophages. DCA inhibits the activity of PDK and ultimately activates PDH. This action converts glucose flux to mitochondrial respiration from lactate production in stimulated macrophages, leading to an increase of the AMP/ATP ratio and AMPKα1 phosphorylation, subsequent activation of CREB and MAPKs, and finally increased IL-10 production.
Actively proliferating cells have a demand for biosynthetic precursors and adequate energy supported by an increase in glucose uptake, glycolysis, amino acid transport, and glutaminolysis (Fox et al., 2005; Vander Heiden et al., 2009). PDK creates a metabolic profile that favors glycolysis to meet the demand, and it is activated in a variety of cancer cells (Michelakis et al., 2010) and activated Th17 cells (Gerriets et al., 2015). Therefore, PDK has been considered as a novel therapeutic target in oncology to restrict cancer cell proliferation (Sutendra and Michelakis, 2013) and in immune-mediated disorders. PDK inhibition by DCA treatment has been shown to reduce proinflammatory cytokine production in murine arthritis, colitis, and encephalomyelitis models largely by inhibiting Th17 cell proliferation and inducing regulatory T cell differentiation (Bian et al., 2009; Eleftheriadis et al., 2013; Gerriets et al., 2015). In case of fewer proliferative macrophages, the cellular metabolic shift determines functional characteristics rather than proliferation, since pro-inflammatory M1 macrophages are prefer glycolytic metabolism to produce large amounts of inflammatory cytokines (Na et al., 2018). Our results describing the expression of PDK in LPS-challenged Kupffer cells and the IL-10 production increase after PDK inhibition agree with previous reports that PDK1 is required for macrophage M1 polarization (Tan et al., 2015). PDK2/4 double knockout mice also did not produce sufficient levels of TNFα, IL-1β, and IL-6 in complete Freud’s adjuvant-injected mouse paw compared to WT mice (Jha et al., 2015), and this might have been mediated by the defect in M1 macrophage polarization. However, underlying signaling pathways regarding PDK activation and cytokine production have not been handled elsewhere, and here we provide the first important clue.
The most important finding of this study was that PDK inhibition activated AMPKα1 in macrophages. AMPK is a central metabolic signaling molecule that senses cellular energy changes like increased AMP. It participates in shaping M2 macrophage phenotypes by increasing Akt and CREB activity (Sag et al., 2008) or fatty acid β-oxidation (Steinberg and Schertzer, 2014) and inhibiting NF-κB activity (Yeung et al., 2004; Ak and Levine, 2010). Our results on the involvement of AMPKα1 with MAPKs and CREB phosphorylation are mechanistically supported by earlier reports (Meisse et al., 2002; Li et al., 2005; Sag et al., 2008; Hu et al., 2017). In addition to those findings, we further revealed here that PDK acts as an upstream negative signaling molecule of AMPKα1 in activated macrophages.
Because DCA strongly phosphorylated AMPKα1 from 10 min to 8 h after treatment (Figure 4B), we hypothesized two underlying mechanisms for this: disturbance in the AMP/ATP ratio or mitochondrial reactive oxygen species (mROS) production. First, we confirmed that the AMP/ATP ratio significantly increased 10 min after DCA treatment (Figure 4A), likely due to inhibition of glucose uptake and glycolysis. This might act directly as agonist of AMPKα1 phosphorylation. Next, we questioned whether these results could be obtained by inhibiting LDH, which can produce similar metabolic results of decreased ECAR and increased OCR that are considered key metabolic signatures of M2 macrophages (Tan et al., 2015) (Supplementary Figure S3A and B). We tested whether the LDH inhibitors Fx11 (Le et al., 2010) and GSK (Xie et al., 2014) could have similar effects with DCA, and we found that they did not increase the AMP/ATP ratio (Supplementary Figure S3C) nor AMPKα1 phosphorylation (Supplementary Figure S3D). The different effects of PDK and LDH inhibition were most obvious in cytokine production because Fx11 inhibited the synthesis of IL-10 (Supplementary Figure S4A and B). Although more studies are needed to decipher the exact underlying mechanisms, metabolic changes by PDK inhibition specifically activated AMPKα1 and enhanced IL-10 production in macrophages by increasing the AMP/ATP ratio rather than modulating ECAR/OCR.
The other hypothesis for AMPKα1 activation by PDK inhibition was the involvement of mROS. Inhibition of PDK increased mitochondrial respiration, which can cause mROS production (Li et al., 2017). Because mROS are known to induce AMPKα1 phosphorylation (Rabinovitch et al., 2017), we investigated DCA-mediated mROS production and its involvement in AMPKα1 activation. Within 30 min of treatment, DCA profoundly increased mROS according to mitoSOX staining (Supplementary Figure S5A). MitoTEMPO, an inhibitor of mROS, effectively reduced mROS production (Supplementary Figure S5B) but did not abrogate AMPKα1 phosphorylation in DCA treated macrophages (Supplementary Figure S5C). MitoTEMPO also could not revert IL-10 upregulation caused by DCA (Supplementary Figure S5D). Collectively, DCA increases mROS; however, mROS does not contribute to AMPKα1 phosphorylation nor IL-10 production.
Based on the profound IL-10 production in PDK inhibited macrophages both in vitro and in vivo, possible clinical implications of PDK inhibition could be conferred. The increase in blood IL-10 at the early phase of endotoxemia by DCA treatment completely protected mice from lethality (Figure 6D), and treatment with recombinant IL-10 improved survival rates of LPS-challenged mice in a previous study (Howard et al., 1993). In fact, the role of IL-10 in protecting the host from excessive inflammation was clear in the early phase of sepsis based on several reports (Emmanuilidis et al., 2001; Traeger et al., 2010). In addition, complete depletion of macrophages using clodronate liposomes increased mortality by reducing IL-10 in a sepsis model (Xiang et al., 2013). Therefore, beyond the recently reported therapeutic effect of DCA on sepsis by improving mitochondrial homeostasis (Xiang et al., 2013), we claim a new regulatory effect of PDK on IL-10 production in macrophages. This will add value to further investigations in various biological situations.
Taken together, this study highlights that glycolytic metabolism induced by PDK activation has a negative regulatory effect on IL-10 production in LPS-stimulated macrophages. Our findings pinpoint PDK as a molecular regulator that helps activated macrophages coordinate specific cytokine production within cellular metabolic events.
Materials and methods
Reagents
ERK inhibitor PD98059, p38 inhibitor SB203580, JNK inhibitor SP600125, and mitochondria-targeted antioxidant MitoTEMPO were all obtained from Cayman Chemicals. LPS obtained from E. coli, sodium DCA, and 2-DG were purchased from Sigma-Aldrich. Lactate dehydrogenase A inhibitor FX11 was purchased from Merck Millipore. GSK was obtained from Tocris Bioscience.
Mice and endotoxemia model
Animal experiments were conducted in accordance with the Institute for Experimental Animals College of Medicine and cared for according to the Guide for the Care and Use of Laboratory Animals prepared by the Institutional Animal Care and Use Committee of Seoul National University (accession number SNU-160202-4). Male C57BL/6J mice at 6 weeks of age were purchased from Jackson Laboratory and housed in cages with constant-flow air exchange supporting specific pathogen-free conditions. They were fed standard lab chow, and they had access to water ad libitum. To induce endotoxemia, mice at 7–12 weeks of age were injected (i.p.) with LPS (20 mg/kg) with or without DCA (100 mg/kg) and sacrificed at the indicated time points. Blood was collected through a heart puncture under deep anesthesia and liver was sampled for histopathology or macrophage isolation after cervical dislocation. Tissue was further processed for HE staining with formalin fixation and paraffin embedding. Histological grade was obtained as follows: leukocyte rolling in blood vessel 0–4, leukocyte infiltration into organ parenchyma 0–4, and tissue damage 0–4. Survival rates and animal weight were measured daily. Twelve-week-old AMPKα1−/− mice were provided by Dr B. Viollet (INSERM U1016, Institut Cochin, France) and used as a source of bone marrow cells. Littermate WT male mice were used as controls.
Kupffer cell isolation and RNA sequencing
To isolate Kupffer cells from livers, collected organs were digested with collagenase I (Sigma-Aldrich) and single cells were isolated. CD45+CD11b+Ly6G−F4/80+CD64+ Kupffer cells were sorted using FACSAria III (BD Biosciences) and prepared for further analysis. Sorting purity was assessed and confirmed to be up to 95%–98%. Total RNA was extracted using TRIzol reagent (Invitrogen) according to the manufacturer’s instructions. For control and test RNAs, the construction of the library was performed using the QuantSeq 3′ mRNA-Seq Library Prep Kit (Lexogen) according to the manufacturer’s instructions. High-throughput sequencing was performed using single-end 75 sequencing on a NextSeq 500 (Illumina). QuantSeq 3′ mRNA-Seq reads were aligned using Bowtie2 (Langmead and Salzberg, 2012). Bowtie2 indices were either generated from genome assembly sequence or representative transcript sequences for aligning to the genome and transcriptome. The alignment file was used for assembling transcripts, estimating their abundances, and detecting differential expression of genes. Differentially expressed genes were determined based on counts from unique and multiple alignments using coverage in Bedtools (Quinlan and Hall, 2010). The RT (Read Count) data were processed based on the global normalization method using the Genowiz™ version 4.0.5.6 (Ocimum Biosolutions). Gene classification was based on searches done by DAVID (http://david.abcc.ncifcrf.gov/) and Medline databases (http://www.ncbi.nlm.nih.gov/). Enriched terms that passed FDR < 20% were reported. All sequencing data can be found at the Gene Expression Omnibus (GEO) database (GEO10855).
Cells
Bone marrow cells were obtained from C57BL/6J male mice at 7–12 weeks of age and differentiated into BMDMs for 7 days in RPMI 1640 media containing 10% FBS, 1% penicillin/streptomycin, and 2 mM of L-glutamine (Thermo Fisher Scientific), and supplemented with fresh recombinant murine GM-CSF (25 ng/ml; Miltenyi Biotec) every 3 days. RAW264.7 cells were cultured in Dulbecco’s modified Eagle medium (DMEM) with 10% heat-inactivated fetal bovine serum (FBS; Thermo Fisher Scientific) and 1% penicillin/streptomycin (Thermo Fisher Scientific). All cells were cultured at 37°C in a humidified incubator containing 5% CO2.
PDK knockdown using siRNA
Murine Pdk1-specific, Pdk2-specific, Pdk3-specific, Pdk4-specific, and scrambled control siRNAs were obtained from Santa Cruz Biotechnology. Cells were transfected with siRNAs using Lipofectamine RNAiMAX (Invitrogen) according to the manufacturer’s instructions.
In vivo glucose uptake determination
Mice received a single i.p. injection of 2-DG (1500 mg/kg) 15 min before LPS (20 mg/kg) injection. Lung and spleen were sampled 1 h after LPS injection and digested with collagenase I for single-cell isolation. CD45+CD11b+Ly6G−F4/80+CD64+ Kupffer cells and CD45−CD31+ endothelial cells were sorted using FACS Aria III (BD Biosciences). CD8+ T cells and monocytes in the spleen were isolated using CD8+ T Cell Isolation Kit and Monocyte Isolation Kit (Miltenyi Biotec). A total of 105 isolated cells were analyzed for 2-DG content using a Glucose colorimetric/Fluorometric assay kit (BioVision) according to instructions provided by the manufacturer.
qPCR
For qPCR analysis, total RNA was solubilized in TRIzol reagent (Invitrogen) and extracted according to the manufacturer’s instructions. cDNA was synthesized from 1 mg of total RNA using reverse transcription, and the amount of mRNA was determined using real-time PCR analysis with the SYBR Green qPCR Pre Mix (Enzynomics) on an ABI real-time PCR 7500 machine (Applied Biosystems). Samples were normalized to TBP or 18S ribosomal RNA. The primer sequences are described in Supplementary Table S1.
Flow cytometry
Floating cells were prepared for FACS analysis. Cells were incubated for 20 min with antibodies diluted at the optimal concentrations in FACS buffer (PBS, 5% FBS, 5 mM EDTA, and 1% NaN3). LSRFortessa (BD Biosciences) was used for multiparameter analysis of stained cell suspensions followed by analysis with FlowJo software (Tree Star Inc.). Monoclonal antibodies to mouse CD45 (30-F11), Ly6G (1A8-Ly6g), Ly6C (HK1.4), F4/80 (BM8), CD11b (M1/70), CD3 (145-2C11), CD8α (53-6.7), and CD64 (X54-5/7.1, BD Biosciences) were all from eBioscience unless otherwise indicated. Phospho-PDHE1α (NB110-93479; Novus Biologicals) staining was performed after cell fixation and permeabilization followed by secondary Alexa Flour 488-conjugated goat anti-rabbit IgG (Invitrogen) staining.
Western blotting
Total cell lysates were prepared by harvesting cells in sample buffer (Biosesang) with protease inhibitor and phosphatase inhibitor (GenDepot), sonicated for 40 sec and heated to 99°C for 5 min. Proteins were resolved on 12% polyacrylamide gels (6% for ACC) and transferred to polyvinylidene difluoride membranes (Merck Millipore). The primary antibodies are listed in Supplementary Table S2.
Measuring cellular metabolic flux
XF24 Extracellular Flux Analyzer (Seahorse Biosciences) was used to determine the bioenergetics profile of intact cells. In brief, BMDMs were differentiated in XF24 analyzing plates, and the medium was changed before data acquisition with high glucose DMEM (Sigma-Aldrich) supplemented with 1 mM sodium pyruvate (Sigma-Aldrich) and 10% FBS. ECAR and oxygen consumption rate (OCR) were analyzed for 5 h.
In vitro glucose uptake assay
We used a glucose uptake fluorometric assay kit (BioVision) to measure the extent of glucose uptake in macrophages according to the manufacturer’s instructions. Briefly, BMDMs were incubated with 10 mM glucose medium for 1 h and treated with FX11 (50 μM) or GSK (100 nM) 1 h before LPS stimulation (100 ng/ml). After 6 h of LPS stimulation, glucose levels in culture supernatants were measured.
Cytokine measurements
IL-10, TNFα, IL-6, IL-12p70, and IL-1β in cell culture supernatants or serum were measured using mouse DuoSet ELISA kit (BD Biosciences) according to the manufacturer’s protocol.
NF-κB activity assay
Luciferase reporter constructs and a heat shock protein 70 (HSP70)-β-galactosidase reporter plasmid were provided by H.S. Youn (Soonchunhyang University, Korea). RAW264.7 cells were co-transfected with NF-κB luciferase reporter plasmid and HSP70-β-gal plasmid as an internal control using SuperFect transfection reagent (Qiagen) according to the manufacturer’s instructions. After 24 h, cells were stimulated with LPS (100 ng/ml) for 8 h before analysis. Luciferase and β-gal enzyme activities were determined using a commercial luciferase assay and β-gal enzyme systems (Promega) according to the manufacturer’s instructions. Relative luciferase activity (RLA) was normalized to β-gal activity.
AMP/ATP measurement
Total cell lysates were prepared by harvesting cells in Ultrapure water (Invitrogen) and before quickly homogenizing cells using sonication. After centrifuging for 5 min at 4°C at 13000 g, the supernatant was deproteinized using 4 M perchloric acid and neutralized using 2 M KCl. AMP-Glo™ Assay (Promega) and ENLITEN® ATP Assay System (Promega) were used to measure the amount of ATP and AMP in cell lysates.
Dominant-negative CREB overexpression
Raw 264.7 cells were plated at a density of 2 × 10⁵/ml. When the cells reached 60%–70% confluence, cells were transiently transfected with a dominant-negative CREB vector (pCMV-KCREB; TaKaRa Bio) using TransIT-LT1 Transfection reagent (Mirus Bio LLC) according to the manufacturer’s instructions. After 24 h of transfection, cells were treated with 10 mM DCA for 1 h before LPS treatment.
ALT, AST, and creatinine measurements
Hepatocellular damage was assessed by determining serum ALT and AST activities. Renal function was as assessed using serum creatinine concentration. ALT, AST, and creatinine levels were measured using ALT, AST, and creatinine Activity Assay Kit (Abcam) according to the manufacturer’s instructions.
Mitochondrial ROS measurement
To further quantify ROS, we used 5 μM MitoSOX Red (Molecular Probes), which is a specific superoxide marker in mitochondria. To further assay ROS production, cells grown on a 35-mm glass bottom-dish (iBidi) were incubated with 1 μM MitoTracker Green (Molecular Probes) for 15 min at 37°C. Fluorescent intensity and distribution were observed using a Leica DMI6000B.
Statistical analysis
All data, unless otherwise indicated, are shown as mean ± SEM and tested using two-tailed unpaired Student’s t-test or ANOVA using GraphPad Prism 5.
Funding
S.H.S. was supported by Promising-Pioneering Researcher Program through Seoul National University (SNU) in 2015. Y.R.N. was supported by Basic Science Research Program through the National Research Foundation of Korea (NRF) funded by the Ministry of Science, ICT & Future Planning (NRF-2015R1D1A1A02061958 and NRF-2017R1D1A1B04031161). J.-W.P. was supported by a grant from the National Research Foundation of Korea (2017R1A4A1015015). S.H.S. and J.J.H. were supported by the Korea Research Institute of Bioscience and Biotechnology Research Initiative Program (KGM4571922).
Conflict of interest: none declared.
Author contributions: Y.R.N. and S.H.S. designed the study and wrote the manuscript. Y.R.N. and D.J. performed and analyzed all experiments of this study. J.S. performed animal experiments. J.-W.P. supported research fund and provided a scientific review. All authors contributed to the review and/or revision of the manuscript. Y.R.N. and S.H.S. supervised the study.
Supplementary Material
References
- Agrawal, A., Dillon, S., Denning, T.L., et al. (2006). ERK1−/− mice exhibit Th1 cell polarization and increased susceptibility to experimental autoimmune encephalomyelitis. J. Immunol. 176, 5788–5796. [DOI] [PubMed] [Google Scholar]
- Ak, P., and Levine, A.J. (2010). p53 and NF-κB: different strategies for responding to stress lead to a functional antagonism. FASEB J. 24, 3643–3652. [DOI] [PubMed] [Google Scholar]
- Ananieva, O., Darragh, J., Johansen, C., et al. (2008). The kinases MSK1 and MSK2 act as negative regulators of Toll-like receptor signaling. Nat. Immunol. 9, 1028–1036. [DOI] [PubMed] [Google Scholar]
- Bian, L., Josefsson, E., Jonsson, I.M., et al. (2009). Dichloroacetate alleviates development of collagen II-induced arthritis in female DBA/1 mice. Arthritis Res. Ther. 11, R132. [DOI] [PMC free article] [PubMed] [Google Scholar]
- Boonstra, A., Rajsbaum, R., Holman, M., et al. (2006). Macrophages and myeloid dendritic cells, but not plasmacytoid dendritic cells, produce IL-10 in response to MyD88- and TRIF-dependent TLR signals, and TLR-independent signals. J. Immunol. 177, 7551–7558. [DOI] [PubMed] [Google Scholar]
- Cao, S., Zhang, X., Edwards, J.P., et al. (2006). NF-κB1 (p50) homodimers differentially regulate pro- and anti-inflammatory cytokines in macrophages. J. Biol. Chem. 281, 26041–26050. [DOI] [PMC free article] [PubMed] [Google Scholar]
- Csoka, B., Nemeth, Z.H., Virag, L., et al. (2007). A2A adenosine receptors and C/EBPβ are crucially required for IL-10 production by macrophages exposed to Escherichia coli. Blood 110, 2685–2695. [DOI] [PMC free article] [PubMed] [Google Scholar]
- Davies, L.C., Jenkins, S.J., Allen, J.E., et al. (2013). Tissue-resident macrophages. Nat. Immunol. 14, 986–995. [DOI] [PMC free article] [PubMed] [Google Scholar]
- Eleftheriadis, T., Pissas, G., Karioti, A., et al. (2013). Dichloroacetate at therapeutic concentration alters glucose metabolism and induces regulatory T-cell differentiation in alloreactive human lymphocytes. J. Basic Clin. Physiol. Pharmacol. 24, 271–276. [DOI] [PubMed] [Google Scholar]
- Emmanuilidis, K., Weighardt, H., Maier, S., et al. (2001). Critical role of Kupffer cell-derived IL-10 for host defense in septic peritonitis. J. Immunol. 167, 3919–3927. [DOI] [PubMed] [Google Scholar]
-
Everts, B., Amiel, E., Huang, S.C., et al. (2014). TLR-driven early glycolytic reprogramming via the kinases TBK1-IKK
 supports the anabolic demands of dendritic cell activation. Nat. Immunol. 15, 323–332. [DOI] [PMC free article] [PubMed] [Google Scholar]
 - Fedorak, R.N., Gangl, A., Elson, C.O., et al. (2000). Recombinant human interleukin 10 in the treatment of patients with mild to moderately active Crohn’s disease. The Interleukin 10 Inflammatory Bowel Disease Cooperative Study Group. Gastroenterology 119, 1473–1482. [DOI] [PubMed] [Google Scholar]
- Fox, C.J., Hammerman, P.S., and Thompson, C.B. (2005). Fuel feeds function: energy metabolism and the T-cell response. Nat. Rev. Immunol. 5, 844–852. [DOI] [PubMed] [Google Scholar]
- Ganeshan, K., and Chawla, A. (2014). Metabolic regulation of immune responses. Annu. Rev. Immunol. 32, 609–634. [DOI] [PMC free article] [PubMed] [Google Scholar]
- Gerriets, V.A., Kishton, R.J., Nichols, A.G., et al. (2015). Metabolic programming and PDHK1 control CD4+ T cell subsets and inflammation. J. Clin. Invest. 125, 194–207. [DOI] [PMC free article] [PubMed] [Google Scholar]
- Hawrylowicz, C.M., and O'Garra, A. (2005). Potential role of interleukin-10-secreting regulatory T cells in allergy and asthma. Nat. Rev. Immunol. 5, 271–283. [DOI] [PubMed] [Google Scholar]
- Howard, M., Muchamuel, T., Andrade, S., et al. (1993). Interleukin 10 protects mice from lethal endotoxemia. J. Exp. Med. 177, 1205–1208. [DOI] [PMC free article] [PubMed] [Google Scholar]
- Hu, K., Gong, X., Ai, Q., et al. (2017). Endogenous AMPK acts as a detrimental factor in fulminant hepatitis via potentiating JNK-dependent hepatocyte apoptosis. Cell Death Dis. 8, e2637. [DOI] [PMC free article] [PubMed] [Google Scholar]
- Jha, M.K., Song, G.J., Lee, M.G., et al. (2015). Metabolic connection of inflammatory pain: pivotal role of a pyruvate dehydrogenase kinase–pyruvate dehydrogenase–lactic acid axis. J. Neurosci. 35, 14353–14369. [DOI] [PMC free article] [PubMed] [Google Scholar]
- Kaplon, J., Zheng, L., Meissl, K., et al. (2013). A key role for mitochondrial gatekeeper pyruvate dehydrogenase in oncogene-induced senescence. Nature 498, 109–112. [DOI] [PubMed] [Google Scholar]
- Kelly, B., and O'Neill, L.A. (2015). Metabolic reprogramming in macrophages and dendritic cells in innate immunity. Cell Res. 25, 771–784. [DOI] [PMC free article] [PubMed] [Google Scholar]
- Kuhn, R., Lohler, J., Rennick, D., et al. (1993). Interleukin-10-deficient mice develop chronic enterocolitis. Cell 75, 263–274. [DOI] [PubMed] [Google Scholar]
- Langmead, B., and Salzberg, S. (2012). Fast gapped-read alignment with Bowtie 2. Nat. Methods 9, 357–359. [DOI] [PMC free article] [PubMed] [Google Scholar]
- Le, A., Cooper, C.R., Gouw, A.M., et al. (2010). Inhibition of lactate dehydrogenase A induces oxidative stress and inhibits tumor progression. Proc. Natl Acad. Sci. USA 107, 2037–2042. [DOI] [PMC free article] [PubMed] [Google Scholar]
- Lewis, J.F., DaCosta, M., Wargowich, T., et al. (1998). Effects of dichloroacetate in patients with congestive heart failure. Clin. Cardiol. 21, 888–892. [DOI] [PMC free article] [PubMed] [Google Scholar]
- Li, J., Diao, B., Guo, S., et al. (2017). VSIG4 inhibits proinflammatory macrophage activation by reprogramming mitochondrial pyruvate metabolism. Nat. Commun. 8, 1322. [DOI] [PMC free article] [PubMed] [Google Scholar]
- Li, J., Miller, E.J., Ninomiya-Tsuji, J., et al. (2005). AMP-activated protein kinase activates p38 mitogen-activated protein kinase by increasing recruitment of p38 MAPK to TAB1 in the ischemic heart. Circ. Res. 97, 872–879. [DOI] [PubMed] [Google Scholar]
-
Lucas, M., Zhang, X., Prasanna, V., et al. (2005). ERK activation following macrophage Fc
 R ligation leads to chromatin modifications at the IL-10 locus. J. Immunol. 175, 469–477. [DOI] [PubMed] [Google Scholar]
 - Meisse, D., Van de, M., Beauloye, C., et al. (2002). Sustained activation of AMP-activated protein kinase induces c-Jun N-terminal kinase activation and apoptosis in liver cells. FEBS Lett. 526, 38–42. [DOI] [PubMed] [Google Scholar]
- Michelakis, E.D., Sutendra, G., Dromparis, P., et al. (2010). Metabolic modulation of glioblastoma with dichloroacetate. Sci. Transl. Med. 2, 31ra34. [DOI] [PubMed] [Google Scholar]
- Mihaylova, M.M., and Shaw, R.J. (2011). The AMPK signalling pathway coordinates cell growth, autophagy and metabolism. Nat. Cell Biol. 13, 1016–1023. [DOI] [PMC free article] [PubMed] [Google Scholar]
- Moore, K.W., de Waal Malefyt, R., Coffman, R.L., et al. (2001). Interleukin-10 and the interleukin-10 receptor. Annu. Rev. Immunol. 19, 683–765. [DOI] [PubMed] [Google Scholar]
- Mosser, D.M., and Edwards, J.P. (2008). Exploring the full spectrum of macrophage activation. Nat. Rev. Immunol. 8, 958–969. [DOI] [PMC free article] [PubMed] [Google Scholar]
- Murray, P.J. (2006). Understanding and exploiting the endogenous interleukin-10/STAT3-mediated anti-inflammatory response. Curr. Opin. Pharmacol. 6, 379–386. [DOI] [PubMed] [Google Scholar]
- Na, Y.R., Je, S., and Seok, S.H. (2018). Metabolic features of macrophages in inflammatory diseases and cancer. Cancer Lett. 413, 46–58. [DOI] [PubMed] [Google Scholar]
- Na, Y.R., Jung, D., Yoon, B.R., et al. (2015). Endogenous prostaglandin E2 potentiates anti-inflammatory phenotype of macrophage through the CREB-C/EBP-β cascade. Eur. J. Immunol. 45, 2661–2671. [DOI] [PubMed] [Google Scholar]
- O'Neill, L.A., and Pearce, E.J. (2016). Immunometabolism governs dendritic cell and macrophage function. J. Exp. Med. 213, 15–23. [DOI] [PMC free article] [PubMed] [Google Scholar]
- Pearce, E.L., and Pearce, E.J. (2013). Metabolic pathways in immune cell activation and quiescence. Immunity 38, 633–643. [DOI] [PMC free article] [PubMed] [Google Scholar]
- Pearce, E.L., Poffenberger, M.C., Chang, C.H., et al. (2013). Fueling immunity: insights into metabolism and lymphocyte function. Science 342, 1242454. [DOI] [PMC free article] [PubMed] [Google Scholar]
- Peterson, R.T., and Schreiber, S.L. (1999). Kinase phosphorylation: keeping it all in the family. Curr. Biol. 9, R521–R524. [DOI] [PubMed] [Google Scholar]
- Quinlan, A.R., and Hall, I.M. (2010). BEDTools: a flexible suite of utilities for comparing genomic features. Bioinformatics 26, 841–842. [DOI] [PMC free article] [PubMed] [Google Scholar]
- Rabinovitch, R.C., Samborska, B., Faubert, B., et al. (2017). AMPK maintains cellular metabolic homeostasis through regulation of mitochondrial reactive oxygen species. Cell Rep. 21, 1–9. [DOI] [PubMed] [Google Scholar]
- Roche, T.E., and Hiromasa, Y. (2007). Pyruvate dehydrogenase kinase regulatory mechanisms and inhibition in treating diabetes, heart ischemia, and cancer. Cell. Mol. Life Sci. 64, 830–849. [DOI] [PMC free article] [PubMed] [Google Scholar]
- Rodriguez-Prados, J.C., Traves, P.G., Cuenca, J., et al. (2010). Substrate fate in activated macrophages: a comparison between innate, classic, and alternative activation. J. Immunol. 185, 605–614. [DOI] [PubMed] [Google Scholar]
- Ruffell, D., Mourkioti, F., Gambardella, A., et al. (2009). A CREB-C/EBPβ cascade induces M2 macrophage-specific gene expression and promotes muscle injury repair. Proc. Natl Acad. Sci. USA 106, 17475–17480. [DOI] [PMC free article] [PubMed] [Google Scholar]
- Sag, D., Carling, D., Stout, R.D., et al. (2008). Adenosine 5′-monophosphate-activated protein kinase promotes macrophage polarization to an anti-inflammatory functional phenotype. J. Immunol. 181, 8633–8641. [DOI] [PMC free article] [PubMed] [Google Scholar]
- Saraiva, M., Christensen, J.R., Tsytsykova, A.V., et al. (2005). Identification of a macrophage-specific chromatin signature in the IL-10 locus. J. Immunol. 175, 1041–1046. [DOI] [PubMed] [Google Scholar]
- Schreiber, S., Fedorak, R.N., Nielsen, O.H., et al. (2000). Safety and efficacy of recombinant human interleukin 10 in chronic active Crohn’s disease. Crohn’s Disease IL-10 Cooperative Study Group. Gastroenterology 119, 1461–1472. [DOI] [PubMed] [Google Scholar]
- Sellon, R.K., Tonkonogy, S., Schultz, M., et al. (1998). Resident enteric bacteria are necessary for development of spontaneous colitis and immune system activation in interleukin-10-deficient mice. Infect. Immun. 66, 5224–5231. [DOI] [PMC free article] [PubMed] [Google Scholar]
- Stacpoole, P.W., Nagaraja, N.V., and Hutson, A.D. (2003). Efficacy of dichloroacetate as a lactate-lowering drug. J. Clin. Pharmacol. 43, 683–691. [PubMed] [Google Scholar]
- Steinberg, G.R., and Schertzer, J.D. (2014). AMPK promotes macrophage fatty acid oxidative metabolism to mitigate inflammation: implications for diabetes and cardiovascular disease. Immunol. Cell Biol. 92, 340–345. [DOI] [PubMed] [Google Scholar]
- Stoecklin, G., Tenenbaum, S.A., Mayo, T., et al. (2008). Genome-wide analysis identifies interleukin-10 mRNA as target of tristetraprolin. J. Biol. Chem. 283, 11689–11699. [DOI] [PMC free article] [PubMed] [Google Scholar]
- Sutendra, G., and Michelakis, E.D. (2013). Pyruvate dehydrogenase kinase as a novel therapeutic target in oncology. Front. Oncol. 3, 38. [DOI] [PMC free article] [PubMed] [Google Scholar]
- Tan, Z., Xie, N., Cui, H., et al. (2015). Pyruvate dehydrogenase kinase 1 participates in macrophage polarization via regulating glucose metabolism. J. Immunol. 194, 6082–6089. [DOI] [PMC free article] [PubMed] [Google Scholar]
- Traeger, T., Mikulcak, M., Eipel, C., et al. (2010). Kupffer cell depletion reduces hepatic inflammation and apoptosis but decreases survival in abdominal sepsis. Eur. J. Gastroenterol. Hepatol. 22, 1039–1049. [DOI] [PubMed] [Google Scholar]
- Vander Heiden, M.G., Cantley, L.C., and Thompson, C.B. (2009). Understanding the Warburg effect: the metabolic requirements of cell proliferation. Science 324, 1029–1033. [DOI] [PMC free article] [PubMed] [Google Scholar]
- Vats, D., Mukundan, L., Odegaard, J.I., et al. (2006). Oxidative metabolism and PGC-1β attenuate macrophage-mediated inflammation. Cell Metab. 4, 13–24. [DOI] [PMC free article] [PubMed] [Google Scholar]
- Xiang, B., Zhang, G., Guo, L., et al. (2013). Platelets protect from septic shock by inhibiting macrophage-dependent inflammation via the cyclooxygenase 1 signalling pathway. Nat. Commun. 4, 2657. [DOI] [PMC free article] [PubMed] [Google Scholar]
- Xie, H., Hanai, J., Ren, J.G., et al. (2014). Targeting lactate dehydrogenase--a inhibits tumorigenesis and tumor progression in mouse models of lung cancer and impacts tumor-initiating cells. Cell Metab. 19, 795–809. [DOI] [PMC free article] [PubMed] [Google Scholar]
- Yeung, F., Hoberg, J.E., Ramsey, C.S., et al. (2004). Modulation of NF-κB-dependent transcription and cell survival by the SIRT1 deacetylase. EMBO J. 23, 2369–2380. [DOI] [PMC free article] [PubMed] [Google Scholar]
- Zhang, X., Edwards, J.P., and Mosser, D.M. (2006). Dynamic and transient remodeling of the macrophage IL-10 promoter during transcription. J. Immunol. 177, 1282–1288. [DOI] [PMC free article] [PubMed] [Google Scholar]
Associated Data
This section collects any data citations, data availability statements, or supplementary materials included in this article.