Abstract
Chitosan was deposited on fumed silica without the addition of cross-linkers or activating agents. The chitosan surface layer has a high affinity toward organic molecules, e.g., Acid Orange 8 (AO8) dye, robust to a broad range of simulated conditions (variance with respect to temperature, time, and concentration of solute). Experimental equilibrium data were analyzed by the generalized Langmuir equation taking into consideration the energetic heterogeneity of the adsorption system. The effect of temperature on dye uptake and adsorption rate was studied. According to the calculated thermodynamic functions ΔG°, ΔH°, and ΔS° from the equilibrium data at different temperatures, the adsorption of AO8 onto chitosan–fumed silica composite is exothermic and spontaneous. The studies of temperature effect on adsorption equilibrium show that the maximum adsorption capacity (determined from the Langmuir–Freundlich equation) of synthesized composite toward AO8 is about one-third higher in the case of an isotherm measured at 5 °C than this value obtained for the isotherm measured at 45 °C. The quantitative binding of dye molecules to chitosan coating on the surface of silica was proved by 1H MAS NMR. The deep kinetics study through the application of various theoretical models—the first-order equation, pseudo-first-order equation, second-order equation, pseudo-second-order equation, mixed first, second-order equation, and multiexponential equation—was applied for getting inside the mechanism of AO8 binding to the chitosan coating. Structural characteristics of chitosan-coated silica were obtained from the low-temperature adsorption/desorption isotherms of nitrogen and imaging by scanning electron microscopy. The effects of a synthetic route for polymer coating on thermal stability and the ability to degrade were studied by differential scanning calorimetry.
1. Introduction
In textile production, only 85% of the coloring matter gets fixed to cloths. The remaining 15% of dyes are discarded from dye baths as effluent. This results in producing billions of tonnes of waste waters daily, which cause groundwater depletion and present serious risks of irreparable damage to ecosystems.1 The sorption of dye onto agriculture and marine byproducts is becoming a potential alternative for inorganic/organic removal from aqueous solution. The utility of marine byproducts such as chitin and its derivative chitosan in water treatment is based on their abundancy, low cost, and efficiency as adsorbents. The biopolymer chitosan, which is produced through deacetylation of chitin, one of the most abundant native polysaccharides,2−4 has shown potential as a sorbent due to its polycationic structure and physicochemical properties.5,6 The combination of chitosan with inorganic sorbents, such as silica, provides adsorbent materials with extended pH tolerance, fast adsorption kinetics, and high capacity.7−12
There are many factors affecting dye removal from wastewaters, and temperature is playing a crucial role in the efficacy of the adsorption process.12−14 On a large industrial scale, the temperatures of wastewaters can significantly differ and depend on many factors, e.g., daily and seasonal conditions. Therefore, in the development of industrial-scale dye treatment processes, the influence of temperature has to be taken into account.7−11 Besides the influence of temperature on adsorption capacity, the temperature dependences of adsorption rate should be also considered in the studies of adsorption processes; however, such investigations are rare in the literature.15−17
The aim of our work is to investigate the influence of temperature on the ability of physically modified fumed silica with chitosan to adsorb azo dyes. Acid Orange 8 (AO8) was chosen for the study as this dye accounts for over 50% of the world’s annual dye production.18 Besides the equilibrium adsorption isotherms, the kinetic data were measured and analyzed in order to find the correlations between temperature, adsorbent capacity, and adsorption rate.
2. Methods and Calculation Procedures
2.1. Materials and Preparation of Chitosan–Silica Composites
Chitosan, Sigma-Aldrich, No. 417963 (molecular weight: 190–370 kDa, degree of deacetylation: not less than 75%, solubility: 10 mg/mL), and fumed silica (specific surface area: 150 m2/g), obtained from State Enterprise “Kalush Test Experimental Plant of Institute of Surface Chemistry of National Academy of Sciences of Ukraine”, were used in the studies. The commercial dye AO8 was purchased from Sigma–Aldrich with a purity of 65%. Chitosan-fumed silica composite (ChS) was obtained by the impregnation of fumed silica (10 g) by chitosan solution (1 g of chitosan dissolved in 100 mL of 2% acetic acid) and stirred for a day (the theoretical mass ratio chitosan:silica—1:10).5 The obtained material was dried at 60 °C.
2.2. Methods of Investigation
2.2.1. Composite Characterization
The content of carbon, hydrogen, and nitrogen in the synthesized chitosan–fumed silica composite was measured by using a Series II CHNS/O Analyzer 2400, PerkinElmer, USA (the reduction and combustion temperatures: 650, 950 °C). The results were as follows: %C = 4.73, %H = 1.02, and %N = 0.86.5 The FTIR spectrum of the synthesized chitosan–fumed silica composite was measured by using a Nicolet 8700A FTIR spectrometer with a diffuse reflectance mode, Thermo Scientific, USA (the range 4000–400 cm–1). For comparison the FTIR spectrum was also measured for pure chitosan. The accuracy of the frequency readings was 0.1 cm–1; the KBr pellet technique was used for samples preparation. The results are presented and discussed in the Supporting Information.
The parameters characterizing the composite porosity were calculated from the low-temperature nitrogen adsorption data (automatic sorption analyzer ASAP 2020, Micromeritics, USA) by using the standard methods (the linear BET plot, the adsorption value at the relative pressure p/po ∼ 0.98, the αs plot method, the Barrett, Joyner, and Halenda (BJH) procedure, the pore diameters estimated from pore size distribution (PSD) maximum, the mean hydraulic pore diameter calculated from the BET surface areas, and pore volumes Dh = 4 V/S.19 The values of the parameters are as follows: the BET specific surface area SBET = 170 m2/g, the total pore volume Vt = 1.14 cm3/g, the primary micropore/mesopore volume Vp = 1.08 cm3/g, the external surface area Sext = 17 m2/g, the pore diameters Dmo,ads = 39.8 nm, Dmo,des = 29.9 nm, and the mean hydraulic pore diameter Dh = 26.8 nm.5 The nitrogen adsorption/desorption isotherms and pore size distributions are presented and discussed in the Supporting Information.
Potentiometric titration of the acidified composite ChS with NaOH solution was used for determination of the surface charge and pH of zero charge point—pHPZC (NaCl of ionic strength I = 0.1 mol·dm–3).20 The obtained value of pHPZC was 6.0.5 By using the Scanning Electron Microscope QuantaTM 3D FEG (FEI Company, USA) (operating at a voltage of 30 kV), the surface morphology of the chitosan–silica composite ChS was studied.
The 1H MAS NMR experiments were performed at the magnetic field B0 = 14.1 T (Larmor frequency of 600.12 MHz) and MAS rate vr = 60.00 kHz on a Bruker Avance-III spectrometer equipped with 1.3 mm MAS probehead. Acquisitions involved rotor-synchronized, double-adiabatic spin–echo sequence with 90° 1.25 μs excitation pulse followed by two 50.0 μs tanh/tan high-power adiabatic pulses (SHAPs) with 5 MHz frequency sweep.21,22 All pulses operated at the nutation frequency vnut = 200 kHz. For each spectrum, 1024 signal transients with 5 s relaxation delay were accumulated. Shifts were referenced with respect to neat tetramethylsilane (TMS). Geometry optimization and subsequent GIAO 1H nuclear magnetic shieldings calculation for the Acid Orange 8 molecule were performed at the MP2/cc-pVTZ level of theory with ORCA code version 4.2.123 using a tight convergence tolerance of 1 × 10⁻⁸ Hartree. Calculated 1H shieldings were converted to 1H chemical shifts by matching the calculated shielding of methyl protons to their 1.1 ppm chemical shift in the experimental spectrum of the dye.
2.2.2. Adsorption Equilibrium
Batch adsorption isotherms of Acid Orange 8 (AO8) were performed using the classical static method. The known amounts of adsorbent (about 50 mg) were contacted with AO8 solutions (25 mL) of known concentrations (0.03–1.8 mmol·L–1). Due to the impurity in calculations, the percentage of dye content was taken into account. The Erlenmeyer flasks with adsorption systems were placed in the incubator shaker (New Brunswick Scientific Innova 40R Model) and agitated at 110 rpm speed at established temperatures for 2 days. The isotherms were measured for the following temperatures: 278, 298, and 318 K. After equilibrium was reached, the solute concentrations were defined based on the UV/vis spectrophotometric measurements (Cary 4000, Varian) carried out at λ = 490 nm. The adsorbed amounts of adsorbate were calculated from the following equation:
| 1 |
where aeq is the equilibrium adsorbed amount (mmol·g–1), co is the initial concentration of bulk fluid (mmol·L–1), ceq is the adsorbate equilibrium concentration (mmol·L–1), V is the volume of solution (L), and m is the weight of adsorbent (g).
The experimental adsorption isotherms were analyzed by using the generalized Langmuir (GL) isotherm equation24 derived from the general theory of adsorption on energetically heterogeneous solids:
| 2 |
where θ is the global (overall) adsorption isotherm (overall coverage), m and n are heterogeneity parameters describing a shape (width and asymmetry) of the adsorption energy distribution function (m, n < 0.1), and K denotes an equilibrium constant characterizing a position of the distribution function on an energy axis.
For specific values of heterogeneity parameters, the GL equation takes the form of several isotherm equations:
- Langmuir–Freundlich (LF) (GL: 0 < m = n ≤ 1):

3 - Generalized Freundlich (GF) (GL: n = 1, 0 < m ≤ 1):

4 - Tóth (T) (GL: m = 1, 0 < n ≤ 1):

5 - Langmuir (L) (GL: m = n = 1):

6
2.3.3. Adsorption Kinetics
The kinetic measurements were carried out by means of the spectrophotometric method (spectrophotometer Cary 100), and the apparatus was equipped with a 1 cm quartz flow cell working in a closed loop system. To have the possibility to make the background correction (e.g., air bubbles or small adsorbent particles blocking the cell optical window), the entire 200–600 nm spectra were always recorded. The aqueous solutions of the adsorbate of established initial concentration guaranteeing the highest accuracy of UV/vis measurements (0.071 mmol·L–1) and volume (100 mL) were contacted with a known amount of chitosan–silica composite sample (100 mg) in a thermostatic vessel (thermostat Ecoline RE 207, Lauda, Germany). The solutions were stirred during the experiment by using a digitally controlled mechanical stirrer (110 rpm). The liquid samples were collected automatically through Teflon tubing and glass wool filter by a peristaltic pump; the solution after UV–vis measurement was returned to the reaction vessel.25 The adsorption kinetic measurements with constant mass of adsorbent and initial concentration of adsorbate at 278, 288, 298, 308, and 318 K were performed. For the studied systems 118–160 spectra over a time of about 24 h were collected. The concentration vs time and the adsorption vs time profiles from the obtained spectra were calculated. Some well-known kinetic equations were applied in the analysis of the experimental data:
-
First-order equation (FOE) (dependent on concentration, c) and pseudo-first-order equation (PFOE) (dependent on adsorption, a) for which the kinetics correspond to the typical concentration gradient-driven, diffusion-dependent processes:26

7a
where c is the temporary concentration, k1a = k1c = k1 are the kinetic rate coefficients, and t is time.
7b Moreover, the integrated form of PFOE, known as the Lagergren equation which describes well typical diffusion-dependent kinetics, as well as the adsorption rate determined kinetics following the Langmuir model,27 was used:
7c 
7d The pseudo-first-order equation (PFOE) and its integrated form (the Lagergren equation) are often used in the presentation of data. Generally, it describes adsorption kinetics on nonporous, energetically homogeneous solids (in almost constant concentration conditions or in the range of adsorption isotherm linearity—Henry’s range). Therefore, the equation mostly is not applicable for data fitting.28−31
-
Second-order equation (SOE) (dependent on concentration, c) (eq 8a) and pseudo-second-order equation (PSOE) (dependent on adsorption, a) (eq 8b) for experiments with fast changes of concentration as a result of the adsorption process in the systems showing energetic heterogeneity.26,27,29,32

8a
where kna = knc(m/v)n−1 and m/V is the adsorbent to solution ratio.
8b After integration, the pseudo-second-order equation (PSOE) takes an uncomplicated form:
where k2 = aeqk2a.
8c PSOE is most often used in a linear form (eq 8d) because it does not require advanced optimization methods. However, the results of using this form of equation for presenting experimental deviations are satisfying only nearby the adsorption equilibrium range. In the initial range poor results are usually obtained.29,33
8d -
Mixed 1,2-order equation (MOE) in two equivalent linear forms (eq 9a and eq 9b) for experiments where parallel I- and II-order processes proceed:26,35

9a
where the fractional contribution f2 of the second-order term to the entire rate (eq 9aand eq 9b) at t = 0 is
9b 
9c The MOE rate (eq 9a, eq 9b) could be used in simple integrated forms if k1a = k1c = k1 > 0 (and f2 < 1):
where: F = a/aeq is the adsorption progress, k1 is the rate coefficient for the first-order process and adsorption half-time (time to attain a = 0.5aeq, or to change concentration halfway, i.e.,
9d  , i.e. F(t05)=0.5) is tos = ln(2-f2)/k1.
The MOE equation is also considered as a solution of the Langmuir rate equation if adsorption occurs on a homogeneous solid surface.36 One can mention that according to Azizian37 the Langmuir rate equation corresponds to both the first-order and second-order equations as boundary cases of the Langmuir kinetic model (activated rate theory, ART). Here, two ranges can be distinguished: the former, typical for FOE with weak adsorption and low adsorption uptakes (small concentration change), and the latter, typical for SOE with a strong adsorption and close to complete uptake.
- Multiexponential equation (m-exp) (eqs 10a–10c), semiempirical, is considered as a kind of generalization of the Lagergren equation.26,29−31 M-exp corresponds to a series of parallel kinetic processes of the first-order type or kinetic systems with first-order follow-up processes in which diffusion-driven process occurs. The equation describes especially the experimental systems with the first fast stage and afterward slower ones. Due to its mathematical properties, it may also be used to describe almost any type of wide-range experimental or theoretical kinetic data.

10a 
10b
where n is a number of exponential terms, Ai (i = 0, 1, 2, ..., n) are parameters normalized to unity corresponding to the total amount of solute in a system (Vco = Vc + ma), Ao is the relative equilibrium concentration of adsorbate, Ai are parameters describing the fraction of adsorbate in the entire system (solution + adsorbent) corresponding to a particular rate coefficient ki, and fi (i = 1 ,2, ..., n) determines the fractions of total adsorbate amount corresponding to the adsorption processes characterized by rate coefficients ki.
10c
2.3.4. Thermal Analysis
Thermal analysis was carried out on a STA 449 Jupiter F1, Netzsch (Germany), under the following operational conditions: heating rate of 10 °C·min–1, dynamic atmosphere of synthetic air (50 mL·min–1), temperature range of 30–950 °C, sample mass ∼16 mg, sensor thermocouple type S TG-DSC. As a reference, an empty Al2O3 crucible was used. The gaseous products released during the thermal degradation of materials were analyzed by FTIR spectrometer Bruker (Germany). The FTIR spectra were recorded in the spectral range of 600–4000 cm–1 with 16 scans per spectrum at a resolution of 4 cm–1.
3. Results and Discussion
Development of organic–inorganic composites is an effective way to combine physicochemical properties of both components whereby the characteristics of the obtained material favor its use in a wide range of applications. The combination of chitosan and fumed silica as components of the composite material has perspective in frames of the adsorbent’s development.
Chitosan is a copolymer consisting of β-(1→4)-2-acetamido-D-glucose and β-(1→4)-2-amino-D-glucose units. A biopolymer has three types of reactive functional groups, amino/acetamido groups as well as both primary and secondary hydroxyl groups.38 Due to these groups, it is easy to generate intra- and intermolecular hydrogen bonds39 and chemical or physical interactions with other substances. Polycationic properties of a biopolymer favor its use as an adsorbent for anionic contaminations of the aqueous environment. However, the relatively poor mechanical properties restrict its wide applications. The molar mass of chitosan ranges from a few kDa to 500 kDa or higher.
Fumed silica, also known as pyrogenic silica, consists of microscopic droplets of amorphous silica fused into branched, chainlike, three-dimensional secondary particles which then agglomerate into tertiary particles.40 This material possesses good chemical and thermal stability (up to 1500 °C) and mechanical strength. Furthermore, as a result of the silanol groups (Si–OH) present on the surface, the silica may be used as a support for immobilization of organic matter.41
Immobilization of chitosan with high molecular weight led to obtain the material with higher polymer content and, therefore, with the higher concentration of functional groups on the surface. For that reason, the chitosan with molecular weight in the range from 190–370 kDa was chosen. The high degree of deacetylation of the chosen chitosan (≥75%) provides good solubility and a high concentration of amino groups, which is crucial for effective biosorbent. The formation of hybrid material through simple impregnation process under mild conditions (room temperature, aqueous solutions) provides the combination of properties of both chitosan and fumed silica. Considering possible mechanisms of the composite creation, one can indicate, first, electrostatic interactions between positively charged amino groups of chitosan and negatively charged silanol groups of silica and, second, weak hydrogen bonds between amine, acetamido, or hydroxyl groups of the biopolymer and silanol groups of silica.42−44 Thus, according to the classification of hybrid materials based on the nature of interaction between organic and inorganic phases,45,46 the obtained material belongs to Class I. This class includes hybrid materials in which each component interacts by only weak interactions, such as hydrogen bond, van der Waals bond, π–π interaction, or electrostatic forces (in the contrary to Class II hybrid materials, characterized by strong chemical bonds such as covalent or ionic–covalent ones).
The low size (5–50 nm) and relatively narrow distribution of granules of the pristine silica material made it possible, by using a simple impregnation method, to get a homogeneous thin film of organic component. The external location of chitosan relative to silica particles and their high share in composite (14% dry mass as results from the elemental analysis) favors the use of the reactivity of amino and acetamido groups in the adsorption process taking into account both the quantitative effectiveness and rate of the process. Moreover, due to forming the hybrid material, each component can complement each other’s features including mechanical, thermal, and chemical stabilities and adsorption properties.
In order to characterize the structural and surface properties of the obtained organic–inorganic material various techniques were applied, and the selected results are presented in the Supporting Information.5 FTIR spectra confirmed the chitosan-coating formation on the surface of fumed silica (Figure S1). The internal structure analysis based on the nitrogen adsorption/desorption isotherm revealed the formation of relatively wide pores (the hydraulic diameter, 26.82 nm); the pore distribution (Figure S2) was broad indicating divergence of pore sizes, and the surface was limited (170 m2/g). Moreover, the SEM micrographs showed that the chitosan–fumed silica composite (Figure S3) had a rough and irregular surface, which is common for hybrid materials.
Due to the polycationic characteristics of the chitosan component, the hybrid materials have been applied for removal of anionic dye acid orange 8 (AO8) from aqueous solution under various temperature conditions. AO8 belongs to sulfonated azo dyes, and it possesses sulfonate and azo groups bound to aromatic rings. The chemical structure of the AO8 dye is shown in Figure S4. This dye is broadly used in textile, leather, paper, foodstuff, cosmetics, and electrooptical industry.38 The complexity of the chemical structure makes it resistant to both biological and chemical decomposition, which raises difficulties in the wastewater treatment process.39
Figure S5 (Supporting Information) presents the dependence of surface charge density Qs vs pH for the composite. Due to conditions of the experiment (pH ∼ 5.5), the total charge of the composite surface was slightly positive (pHPZC = 6) which could cause electrostatic interactions between the adsorbent and negatively charged sulfonate groups of the adsorbate. It must be emphasized that only a low part of the adsorbate was bound by means of a mechanism based on electrostatic interactions. Under experimental conditions, only a small fraction of amino groups was ionized. Thus, the hydrogen bonds contribute to the adsorption process.
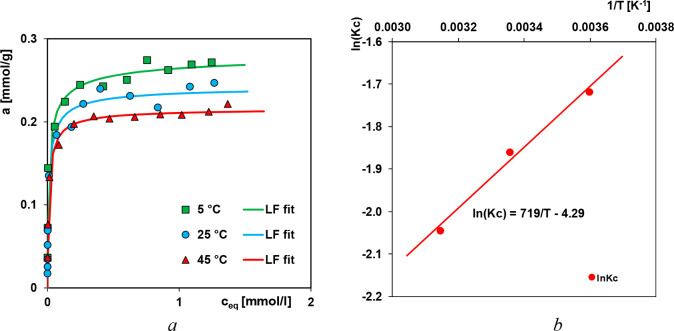
Among the process parameters frequently investigated in the literature, temperature is shown to affect the adsorption capacity greatly.13,47−49 When adsorption capacity increases with temperature, the process is claimed to be endothermic, and vice versa. This may be due to the increasing mobility of the dye molecules and an increase in the number of active sites for the adsorption with increasing temperature.13,14,49,50 The decrease of the adsorption capacity with increasing temperature indicates that the adsorption is an exothermic process. This may be due to the weakening of the adsorptive forces between the dye species and the active sites on the adsorbent surface as a result of temperature increase.51 In Figure 1a the influence of temperature on the adsorption isotherms of AO8 is presented. One can see the strong decrease of adsorption with temperature increase. The adsorption capacity at 5 °C determined from the Langmuir–Freundlich equation is about one-third higher than the one obtained at 45 °C. The temperature effect is also presented as the dependence of log Kc vs (1/T), Figure 1b. Such a behavior indicates the exothermic character of the adsorption process. The observed trend may be explained by the solubility increase which is related to enhancing the interaction with the solvent molecules (creating clusters of water) and finally to adsorption decrease. Moreover, the increase of oscillation energy of adsorbate molecules with temperature rise may result in easier adsorbate desorption from the adsorbent surface to the bulk phase, which is known to be a common effect of physical adsorption.
Figure 1.
(a) Temperature effect on the adsorption of Acid Orange 8 from aqueous solutions on the composite ChS at various temperatures. (b) Van’t Hoff plot for Acid Orange 8 adsorption from aqueous solutions on the chitosan–fumed silica composite at 278, 298, and 318 K.
The thermodynamic parameters estimated from adsorption data are essential for subsequent engineering evaluation of the ultimate uptake of the adsorbents. Those parameters provide insights to the adsorption mechanisms and thus may be applied for further use in process modification and optimization.52 Based on the thermodynamic equations and the plot log Kc vs (1/T), the values of thermodynamic functions, enthalpy, entropy, and Gibbs free energy, for the studied systems were estimated (Table 1). The calculated negative value of enthalpy confirms the exothermic character of the adsorption process, but negative values of Gibbs free energy indicate its spontaneity.
Table 1. Values of Thermodynamic Functions Estimated for the AO8 Adsorption from Aqueous Solutions on the ChS Composite at 278, 298, and 318 K.
| adsorption system | ΔG (kJ/mol) | ΔS (kJ/mol·K) | ΔH (kJ) | R2 |
|---|---|---|---|---|
| AO8/ChS (278 K) | –11.99 | 0.022 | –5.98 | 0.987 |
| AO8/ChS (298 K) | –12.51 | |||
| AO8/ChS (318 K) | –12.86 |
In Table 2 the values of the optimized parameters of the Langmuir–Freundlich equation characterizing AO8 adsorption on the composite ChS at various temperatures are listed. By considering the noticeable increase of the values of the heterogeneity parameter m with the temperature rise (from 0.55 to 0.79), one may state a negative heterogeneity effect. At the temperature of 5 °C, the studied system seems to be the most heterogeneous. In turn, the values of the adsorption equilibrium constant, K, are nearly on the same level at all experimental temperatures. High values of the obtained constants indicate strong adsorption affinity of AO8 to the composite surface. Based on SD(a) and R2 values we can state good agreement between the experimental points and fitted lines in all presented systems.
Table 2. Parameters of the Langmuir–Freundlich Equation Characterizing the Adsorption of Acid Orange 8 on the Chitosan–Fumed Silica Composite at Various Temperatures.
| adsorption system | am | m | n | log K | R2 | SD(a) |
|---|---|---|---|---|---|---|
| AO8/ChS (5 °C) | 0.29 | 0.55 | 0.55 | 1.967 | 0.955 | 0.019 |
| AO8/ChS (25 °C) | 0.24 | 0.70 | 0.70 | 1.972 | 0.985 | 0.012 |
| AO8/ChS (45 °C) | 0.22 | 0.79 | 0.79 | 1.973 | 0.991 | 0.006 |
Adsorption kinetics of AO8 by the surface of the composite were studied in temperature range from 5 to 45°C. Figure S6 (Supporting Information) depicts the exemplary absorption spectra measured in the AO8 adsorption process on the composite ChS at 5°C.
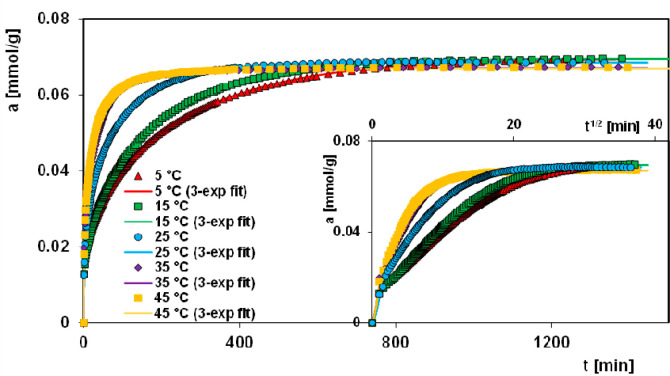
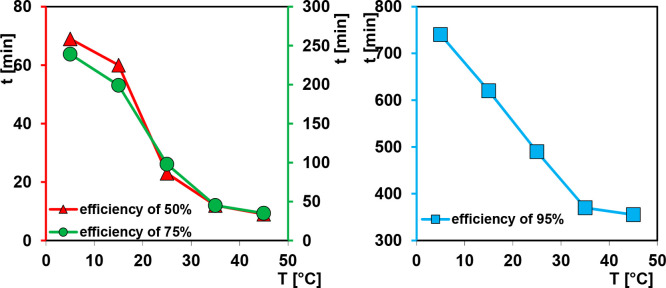
The obtained spectra for the studied system at various temperatures were used to calculate the profiles of the relative concentration c/co or adsorbed amount a vs time t (Figure S7, S8 and Figure 2). For the sake of clarity, the adsorption rate in the initial range of the experiment and all data as a function of root of time t1/2 are also shown. Additionally, a progress of the decolorization efficiency at various temperatures is given in Figure 3 and Table 3. The analysis of the obtained profiles indicates significant differences in the rate of the adsorption process depending on temperature conditions. The adsorption rate strongly increases with temperature rise due to the growing kinetic energy of the adsorbate molecules. Moreover, in the initial part of the kinetic curves linearity is kept as a result of the fast process. Comparing kinetic data for the studied systems, one can see that at extreme temperatures, i.e., 5 and 45 °C, the times which are needed for decolorization efficiency of 50% and 75% differ nearly eight and seven times, respectively. For obtaining an efficiency of 95% for these two temperatures, it is enough to double the applied time. In the range of temperature 5–35 °C linear dependence time vs temperature for the considered decolorization efficiencies could be observed. This effect is clearly observed especially in the case of efficiency of 95%. The obtained results are very promising when taking into account industrial or environmental applications of chitosan–silica composites for the removal of anionic dyes. The kinetics of the adsorption process are important as the capacity of the adsorbent may be meaningfully affected. It was found that 10 min at 45 °C and 20 min at 25 °C is enough to achieve 50% of dye removal. The equilibrium was achieved after 6 h of the adsorption at 35 and 45 °C. From the other side, 20 h is not enough to achieve the adsorption equilibrium at 5 °C. In all studied systems, an equilibrium concentration close to zero was reached. Analyzing the adsorption profiles presented in Figure 2, we can state that for all systems similar adsorption values were reached, and any noticeable variation (3.3% as resulting from calculations) is related to a specific behavior of systems.
Figure 2.
Comparison of adsorption profiles for Acid Orange 8 on the chitosan–fumed silica composite at various temperatures and coordinates: adsorption–time and adsorption–square root of time. Lines correspond to the fitted multiexponential equation.
Figure 3.
Progress of the decolorization efficiency at various temperatures.
Table 3. Comparison of Times Needed to Get the Set Decolorization Efficiency at Various Temperatures.
| time (min) |
|||||
|---|---|---|---|---|---|
| efficiency/temp | 5 °C | 15 °C | 25 °C | 35 °C | 45 °C |
| 50% | 69 | 60 | 23 | 12 | 9 |
| 75% | 239 | 199 | 98 | 45 | 35 |
| 95% | 740 | 620 | 490 | 370 | 355 |
Fast kinetics in the range of temperatures 25–45 °C let us conclude that such chitosan–fumed silica composites could be used at large wastewater treatment facilities. However, more extensive studies will be needed regarding the complexity of wastewaters and a variability of conditions of aqueous systems.
The experimental kinetic profiles at various temperatures were analyzed using the kinetic models like the following: first-order equation (FOE), pseudo-first-order equation (PFOE), second-order equation (SOE), pseudo-second-order equation (PSOE), mixed 1,2-order equation (MOE), and multiexponential equation (m-exp). A promising correlation between experimental data and the multiexponential equation was obtained according to SD(c/co) and 1 – R2 values (Table 4). The kinetic process could be described satisfactorily by a three-term m-exponential equation (Table 5) without emphasis on temperature conditions.
Table 4. Parameters of FOE, SOE, MOE, and the Multiexponential Kinetic Equationsa.
| kinetic system | fit | f2 | log k* | ueq | t0.5 (min) | SD(c)/co | 1 – R2 |
|---|---|---|---|---|---|---|---|
| AO8/ChS (5 °C) | FOE | 0 | –2.27 | 1.29 | 128 | 2.78% | 1.58 × 10⁻² |
| SOE | 1 | –2 | 1.22 | 101 | 2.83% | 1.79 × 10⁻² | |
| MOE | 0.76 | –2.75 | 1.28 | 119 | 1.96% | 7.75 × 10⁻³ | |
| m-exp | – | –1.99 | 1 | 68 | 0.28% | 1.65 × 10⁻⁴ | |
| AO8/ChS (15 °C) | FOE | 0 | –2.18 | 1.27 | 104 | 2.72% | 1.24 × 10⁻² |
| SOE | 1 | –1.90 | 1.19 | 79 | 3.05% | 1.72 × 10⁻² | |
| MOE | 0.76 | –2.65 | 1.25 | 95 | 1.93% | 6.11 × 10⁻³ | |
| m-exp | – | –1.92 | 0.99 | 58 | 0.36% | 2.11 × 10⁻⁴ | |
| AO8/ChS (25 °C) | FOE | 0 | –1.87 | 1.31 | 52 | 3.30% | 2.60 × 10⁻² |
| SOE | 1 | –1.59 | 1.22 | 39 | 2.17% | 1.11 × 10⁻² | |
| MOE | 0.87 | –2.51 | 1.21 | 38 | 2.12% | 1.05 × 10⁻² | |
| m-exp | – | –1.49 | 0.97 | 21 | 0.32% | 2.22 × 10⁻⁴ | |
| AO8/ChS (35 °C) | FOE | 0 | –1.55 | 1.29 | 24 | 3.06% | 3.10 × 10⁻² |
| SOE | 1 | –1.24 | 1.18 | 17 | 2.23% | 1.62 × 10⁻² | |
| MOE | 0.85 | –2.11 | 1.17 | 18 | 2.11% | 1.43 × 10⁻² | |
| m-exp | – | –1.20 | 0.96 | 11 | 0.54% | 1.09 × 10⁻³ | |
| AO8/ChS (45 °C) | FOE | 0 | –1.45 | 1.27 | 19 | 3.40% | 4.17 × 10⁻² |
| SOE | 1 | –1.10 | 1.12 | 12 | 1.69% | 1 × 10⁻² | |
| MOE | 0.95 | –2.44 | 1.11 | 12 | 1.69% | 9.86 × 10⁻³ | |
| m-exp | – | –1.08 | 0.97 | 8 | 0.43% | 7.58 × 10⁻⁴ |
k*: k1–FOE. MOE; k2–SOE; kavg–m-exp
Table 5. Parameters of the Multiexponential Kinetic Equation.
| kinetic system | i | log ki | Ai | fi | log t0.5i | SD* |
|---|---|---|---|---|---|---|
| AO8/ChS (5 °C) | 0 | – | 0.01 | – | 0.0028 | |
| 1 | 0 | 0.22 | 0.23 | –0.16 | ||
| 2 | –1.68 | 0.19 | 0.19 | 1.52 | ||
| 3 | –2.44 | 0.57 | 0.58 | 2.28 | ||
| AO8/ChS (15 °C) | 0 | – | 0.02 | – | 0.0036 | |
| 1 | 0 | 0.21 | 0.22 | –0.16 | ||
| 2 | –1.60 | 0.17 | 0.18 | 1.44 | ||
| 3 | –2.32 | 0.59 | 0.61 | 2.16 | ||
| AO8/ChS (25 °C) | 0 | – | 0.04 | – | 0.0031 | |
| 1 | –0.11 | 0.25 | 0.26 | –0.05 | ||
| 2 | –1.30 | 0.22 | 0.23 | 1.14 | ||
| 3 | –2.07 | 0.49 | 0.51 | 1.91 | ||
| AO8/ChS (35 °C) | 0 | – | 0.04 | – | 0.0054 | |
| 1 | 0 | 0.32 | 0.33 | –0.16 | ||
| 2 | –1.51 | 0.53 | 0.55 | 1.35 | ||
| 3 | –2.16 | 0.11 | 0.12 | 2.00 | ||
| AO8/ChS (45 °C) | 0 | – | 0.04 | – | 0.0043 | |
| 1 | 0 | 0.30 | 0.31 | –0.16 | ||
| 2 | –1.27 | 0.44 | 0.46 | 1.11 | ||
| 3 | –1.95 | 0.22 | 0.23 | 1.79 |
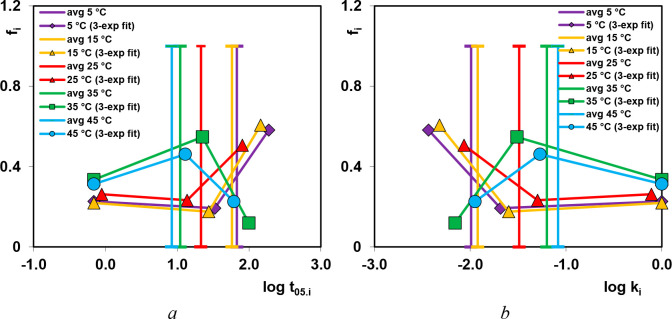
For each experimental system the adsorption half-times t0.5 were determined, i.e., the time required to adsorb half of aeq. This parameter for various terms of the multiexponential equation was obtained from the relationship t1/2 = (ln 2)/k1, while for total kinetics it was determined numerically. All the obtained parameters were plotted as a spectrum fi = Ai/(1 – A0) vs log ki and t0.5i (Figure 4). Each spectrum reflects shares of adsorption stages characterized by various rate coefficients. The broad distributions obtained for all experimental systems mean that the adsorption process proceeds in few stages with different rate coefficients. Faster kinetic processes with temperature rise correspond to the higher shares of kinetic constants with higher magnitudes, as we can observe for 35 and 45 °C. For adsorption processes carried out at lower temperatures the dependence of fi vs ki was different.
Figure 4.
Parameter spectra for the multiexponential equation presented in the coordinates fi–log t05I (a) and fi–log ki (b) for dye adsorption kinetics on the chitosan–fumed silica composite.
In Figure 5 the experimental data are compared with the optimized curves using the mixed 1,2-order equation (MOE); the deviations plotted in Weber–Morris linear coordinates are also presented. The optimization results for the MOE equation are quite good, except for 5–6 initial points of experimental data. The observed faster adsorption process in the experimental systems in relation to the MOE expectations is a result of the intraparticle diffusion as well as the presence of fine particles of the adsorbent. The FOE and SOE equations gave significantly worse fit than multiexponential and MOE equations.
Figure 5.
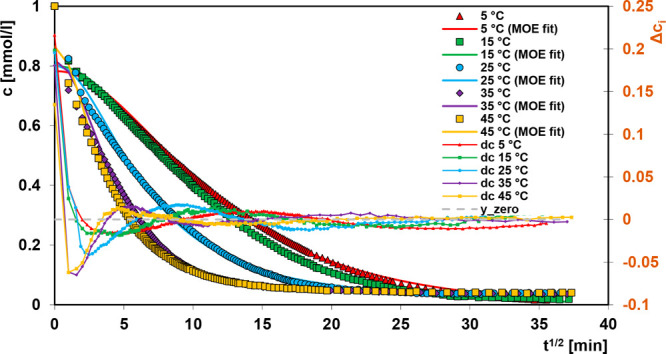
Comparison of adsorption kinetics for Acid Orange 8 on the chitosan–fumed silica composite at various temperatures and coordinates: relative concentration–square root of time. Lines correspond to the fitted mixed 1,2-order equation (MOE).
In Table 4 the comparison of parameters calculated according to FOE, SOE, MOE, and multiexponential kinetic equations for all experimental data is given. We can see as it was mentioned above that the best fitting was obtained for the multiexponential equation; its SDs are about 6–10 times and 4–8 times better than for FOE and SOE equations, respectively. The fitting parameters for the MOE equation are just a little bit better than for SOE. In Table 5 the parameters calculated from multiexponential kinetic equation for the experimental system at various temperatures are presented.
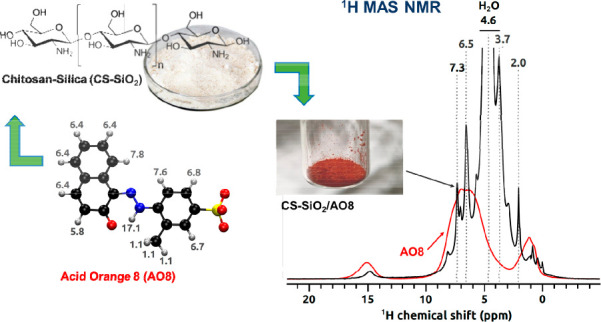
In Figure 6 quantitative 1H MAS NMR spectra of a chitosan/SiO2 sample after adsorption (black trace) and pure solid dye (red trace) are presented. In the upper panel, the spectrum of the chitosan/SiO2 sample is shown in the full scale, and the signal at 4.6 ppm from physisorbed water clearly dominates. In the bottom panel the vertical scale is zoomed, and proton signals characteristic for both chitosan and the dye are visible. Chitosan H3, H4, H5, and H6 protons contribute to the signal at 3.7 ppm, H2 protons are visible as a small bump at ∼3 ppm, H1 overlap with the signal from H2O, and the signal at 2 ppm belongs to the acetyl methyl group, which indicates that chitosan is partially acetylated.53 AO8 contributes with a resonance at ∼15 ppm that originates from the proton involved in the hydrazone bridge, signals at 6.5 and 7.3 ppm (and small features nearby) from aromatic protons, and the methyl group ∼1 ppm. These assignments are corroborated by the spectrum collected from the pure solid dye (red) and by calculated 1H chemical shifts (numbers in gray) at the robust MP2/cc-pVTZ level of theory on the energy-optimized model of the AO8 molecule. Signals from the dye are much narrower in the sample after adsorption, which can be attributed to the presence of water and therefore unlocked molecular motion compared to dry solid and also weaker intermolecular dipolar couplings.
Figure 6.
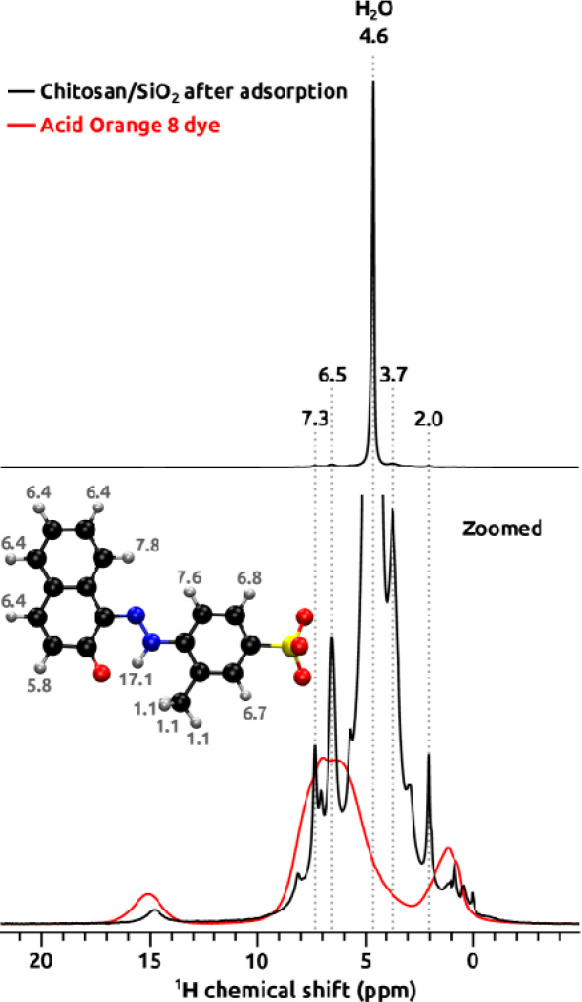
1H MAS NMR spectra of chitosan–fumed silica composite (chitosan/SiO2) after adsorption (black) and pure solid Acid Orange 8 dye (red) collected at 60.00 kHz MAS rate and 14.1 T. 1H chemical shifts calculated at the MP2/cc-pVTZ level of theory are shown in gray together with the Acid Orange 8 molecule model.
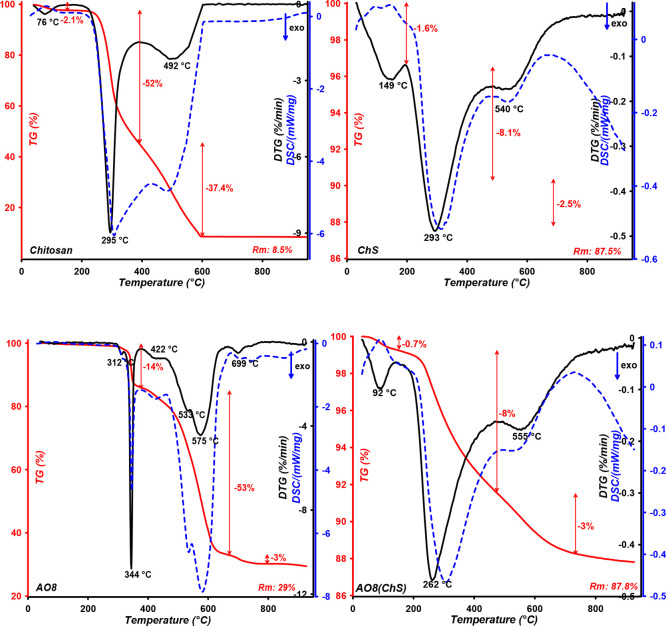
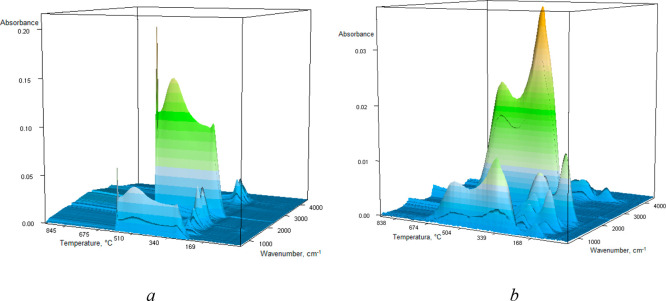
For the investigation of the thermal characteristics of the pure chitosan, pure chitosan–fumed silica composite (ChS), pure dye AO8, and the sorbent–dye system (AO8(ChS)), differential scanning calorimetry simultaneous with IR spectroscopy with Fourier transformation (FTIR-TG) analyses is applied. The results of thermal destruction analysis of samples in air atmosphere are presented in Figure 7. The low-temperature weight loss from 25 and up to 125 °C with the Tmax at 76 °C for chitosan and at 92 °C for the sorbent–dye system corresponds to water evaporation. In the chitosan–fumed silica composite, the temperature range up to 250 °C presents the process of condensation and elimination of hydroxyl and amine groups of the composite as well as the water evaporation process. TG and DTG curves for chitosan are characterized by decomposition of the polymer chain in the temperature range 230–390 °C with Tmax = 295 °C and its further destruction up to 600 °C.6 In the case of the immobilized chitosan, the highest decomposition of polymer occurs at 200–490 °C; for the pure hybrid and hybrid with adsorbed AO8 dye, the maxima are observed at 293 °C (mass loss 8.1%) and 262 °C (mass loss 8%), respectively. In that temperature range, the decomposition of chitosan was also confirmed by intensive stretching vibrations of C–O in the CO2 molecule at 2357 cm–1 (Figure S9 (Supporting Information) and Figure 8) at 295 and 492 °C for pure chitosan, at 293 and 540 °C for pure composite chitosan–fumed silica (ChS), and at 2360 cm–1 (Figure S10) at 262 and 555 °C for the sorbent–dye system (AO8(ChS)). In Figure S11 the FTIR spectra of gas products generated during the pyrolysis process of pure AO8 dye at the temperatures corresponding to the maximum rate of process are presented. It is shown that decomposition of pure dye is accompanied by intensive stretching vibrations of C–O in the CO2 molecule at 2359 cm–1 at 344, 422, 533, 575, and 699 °C.
Figure 7.
Comparison of TG, DTG, and DSC curves measured for the pure chitosan, pure chitosan–fumed silica composite (ChS), pure dye AO8, and the sorbent–dye system (AO8(ChS).5
Figure 8.
FTIR-TG space image of chitosan (a) and chitosan–fumed silica composite (b).
4. Conclusions
The chitosan–fumed silica composite was synthesized by the impregnation of fumed silica with chitosan in a mass ratio 10 to 1 from aqueous solution at room temperature. The synthesized hybrid belongs to class I in frames of classification of the hybrid materials based on the nature of interactions between organic and inorganic phases. According to the results of the potentiometric titration, only a small portion of amino groups was ionized, and it could be concluded that hydrogen bonding played a major role in the mechanism of the adsorption process. The temperature effect in adsorption equilibrium and kinetic studies was discussed for the system dye–chitosan–silica hybrid composite in neutral medium. It was shown that 1 g of composite could adsorb 0.29 mmol·g-1 at 5 °C, 0.24 mmol·g-1 at 25 °C, and 0.22 mmol·g-1 45 °C. The maximum adsorption capacity determined from the Langmuir–Freundlich equation was found for the isotherm measured at 5 °C; it was about one-third higher than the capacity value obtained for the process conducted at 45 °C. The estimated thermodynamic functions ΔG°, ΔH°, and ΔS° for the experimental system confirmed the exothermic and spontaneous character of the adsorption process. The kinetic study revealed that 10 min (at 45 °C) and 20 min ranges (at 25 °C) were enough to achieve 50% of dye removal, and the time of 6 h was enough for attaining the adsorption equilibrium at those temperatures. Fast kinetics in the range of temperature 25–45 °C confirm the high potential of the studied composite as an adsorbent for industrial wastewaters. The analysis of kinetic data for several equations, such as first-order, second-order, mixed 1,2-order, and multiexponential ones, revealed the best optimization results for the multiexponential equation. Based on the obtained results, we have proved the high efficiency of a chitosan–fumed silica sorbent which along with exceptionally high capacity and kinetics benefits from a sustainable and straightforward synthesis.
Acknowledgments
The research leading to these results was financed from the People Programme (Marie Curie Actions) of the European Union’s Seventh Framework Programme FP7/2007-2013/under REA grant agreement No. PIRSES-GA-2013-612484. A.S. acknowledges financial support from MISTRA (project: SafeChem).The authors thank Dr. Caspar de Bruin-Dickason for the English revisions.
Supporting Information Available
The Supporting Information is available free of charge at https://pubs.acs.org/doi/10.1021/acs.jpcc.0c04205.
FTIR analysis and FTIR spectra of chitosan, chitosan–fumed silica composite, and gas products; nitrogen adsorption/desorption measurements; SEM images of chitosan and chitosan–fumed silica composite; chemical structure and characteristics of Acid Orange 8 dye; potentiometric titration measurements; comparison of adsorption kinetics for Acid Orange 8 on the chitosan–fumed silica composite at various temperatures and coordinates (PDF)
The authors declare no competing financial interest.
Supplementary Material
References
- Aravind P.; Selvaraj H.; Ferro S.; Sundaram M. An Integrated (Electro-and Bio-Oxidation) Approach for Remediation of Industrial Wastewater Containing Azo-Dyes: Understanding the Degradation Mechanism and Toxicity Assessment. J. Hazard. Mater. 2016, 318, 203–215. 10.1016/j.jhazmat.2016.07.028. [DOI] [PubMed] [Google Scholar]
- Budnyak T. M.; Pylypchuk I. V.; Tertykh V. A.; Yanovska E. S.; Kolodynska D. Synthesis and Adsorption Properties of Chitosan-Silica Nanocomposite Prepared by Sol-Gel Method. Nanoscale Res. Lett. 2015, 10, 87. 10.1186/s11671-014-0722-1. [DOI] [PMC free article] [PubMed] [Google Scholar]
- Budnyak T.; Tertykh V.; Yanovska E.; Kołodyńska D.; Bartyzel A. Adsorption of V (V), Mo (VI) and Cr (VI) Oxoanions by Chitosan–Silica Composite Synthesized by Mannich Reaction. Adsorpt. Sci. Technol. 2015, 33, 645–657. 10.1260/0263-6174.33.6-8.645. [DOI] [Google Scholar]
- Budnyak T.; Tertykh V.; Yanovska E. Chitosan Immobilized on Silica Surface for Wastewater Treatment. Mater. Sci.-Medziagotyra 2014, 20, 177–182. 10.5755/j01.ms.20.2.4975. [DOI] [Google Scholar]
- Blachnio M.; Budnyak T. M.; Derylo-Marczewska A.; Marczewski A. W.; Tertykh V. A. Chitosan–Silica Hybrid Composites for Removal of Sulfonated Azo Dyes from Aqueous Solutions. Langmuir 2018, 34, 2258–2273. 10.1021/acs.langmuir.7b04076. [DOI] [PubMed] [Google Scholar]
- Budnyak T.; Yanovska E.; Kołodyńska D.; Sternik D.; Pylypchuk I. V.; Ischenko M.; Tertykh V. Preparation and Properties of Organomineral Adsorbent Obtained by Sol–Gel Technology. J. Therm. Anal. Calorim. 2016, 125, 1335–1351. 10.1007/s10973-016-5581-9. [DOI] [Google Scholar]
- Ngah W. S. W.; Teong L.; Hanafiah M. Adsorption of Dyes and Heavy Metal Ions by Chitosan Composites: a Review. Carbohydr. Polym. 2011, 83, 1446–1456. 10.1016/j.carbpol.2010.11.004. [DOI] [Google Scholar]
- Cho D.-W.; Jeon B.-H.; Chon C.-M.; Schwartz F. W.; Jeong Y.; Song H. Magnetic Chitosan Composite for Adsorption of Cationic and Anionic Dyes in Aqueous Solution. J. Ind. Eng. Chem. 2015, 28, 60–66. 10.1016/j.jiec.2015.01.023. [DOI] [Google Scholar]
- Yagub M. T.; Sen T. K.; Afroze S.; Ang H. M. Dye and Its Removal from Aqueous Solution by Adsorption: a Review. Adv. Colloid Interface Sci. 2014, 209, 172–184. 10.1016/j.cis.2014.04.002. [DOI] [PubMed] [Google Scholar]
- Kyzas G. Z.; Lazaridis N. K.; Mitropoulos A. C. Removal of Dyes from Aqueous Solutions with Untreated Coffee Residues as Potential Low-Cost Adsorbents: Equilibrium, Reuse and Thermodynamic Approach. Chem. Eng. J. 2012, 189, 148–159. 10.1016/j.cej.2012.02.045. [DOI] [Google Scholar]
- Chiou M.-S.; Ho P.-Y.; Li H.-Y. Adsorption of Anionic Dyes in Acid Solutions Using Chemically Cross-Linked Chitosan Beads. Dyes Pigm. 2004, 60, 69–84. 10.1016/S0143-7208(03)00140-2. [DOI] [Google Scholar]
- Ahmad A.; Hameed B. Reduction of Cod and Color of Dyeing Effluent from a Cotton Textile Mill by Adsorption onto Bamboo-Based Activated Carbon. J. Hazard. Mater. 2009, 172, 1538–1543. 10.1016/j.jhazmat.2009.08.025. [DOI] [PubMed] [Google Scholar]
- Argun M. E.; Dursun S.; Ozdemir C.; Karatas M. Heavy Metal Adsorption by Modified Oak Sawdust: Thermodynamics and Kinetics. J. Hazard. Mater. 2007, 141, 77–85. 10.1016/j.jhazmat.2006.06.095. [DOI] [PubMed] [Google Scholar]
- Elizalde-González M.; García-Díaz L. Application of a Taguchi L 16 Orthogonal Array for Optimizing the Removal of Acid Orange 8 Using Carbon with a Low Specific Surface Area. Chem. Eng. J. 2010, 163, 55–61. 10.1016/j.cej.2010.07.040. [DOI] [Google Scholar]
- Ho Y.; Chiang C. Sorption Studies of Acid Dye by Mixed Sorbents. Adsorption 2001, 7, 139–147. 10.1023/A:1011652224816. [DOI] [Google Scholar]
- Azizian S.; Yahyaei B. Adsorption of 18-Crown-6 from Aqueous Solution on Granular Activated Carbon: a Kinetic Modeling Study. J. Colloid Interface Sci. 2006, 299, 112–115. 10.1016/j.jcis.2006.01.058. [DOI] [PubMed] [Google Scholar]
- Valenzuela-Calahorro C.; Navarrete-Guijosa A.; Stitou M.; Cuerda-Correa E. M. A Comparative Study of the Adsorption Equilibrium of Progesterone by a Carbon Black and a Commercial Activated Carbon. Appl. Surf. Sci. 2007, 253, 5274–5280. 10.1016/j.apsusc.2006.11.047. [DOI] [Google Scholar]
- Qadeer R. Adsorption Behavior of Ruthenium Ions on Activated Charcoal from Nirtic Acid Medium. Colloids Surf., A 2007, 293, 217–223. 10.1016/j.colsurfa.2006.07.035. [DOI] [Google Scholar]
- Sulak M.; Demirbas E.; Kobya M. Removal of Astrazon Yellow 7GL from Aqueous Solutions by Adsorption onto Wheat Bran. Bioresour. Technol. 2007, 98, 2590–2598. 10.1016/j.biortech.2006.09.010. [DOI] [PubMed] [Google Scholar]
- Deryło-Marczewska A.; Marczewski A. Nonhomogeneity Effects in Adsorption from Gas and Liquid Phases on Activated Carbons. Langmuir 1999, 15, 3981–3986. 10.1021/la990033w. [DOI] [Google Scholar]
- Hwang T.-L.; Van Zijl P. C.; Garwood M.. Fast Broadband Inversion by Adiabatic Pulses; Elsevier: Amsterdam, Netherlands, 1998. [DOI] [PubMed] [Google Scholar]
- Kervern G.; Pintacuda G.; Emsley L. Fast Adiabatic Pulses for Solid-State NMR of Paramagnetic Systems. Chem. Phys. Lett. 2007, 435, 157–162. 10.1016/j.cplett.2006.12.056. [DOI] [Google Scholar]
- Neese F. The Orca Program System. Wiley Interdiscip. Rev.: Comput. Mol. Sci. 2012, 2, 73–78. 10.1002/wcms.81. [DOI] [Google Scholar]
- Marczewski A. W.; Jaroniec M. A New Isotherm Equation for Single-Solute Adsorption from Dilute Solutions on Energetically Heterogeneous Solids. Monatsh. Chem. 1983, 114, 711–715. 10.1007/BF01134184. [DOI] [Google Scholar]
- Brandt A.; Bülow M.; Deryło-Marczewska A.; Goworek J.; Schmeißer J.; Schöps W.; Unger B. Novel Zeolite Composites and Consequences for Rapid Sorption Processes. Adsorption 2007, 13, 267–279. 10.1007/s10450-007-9019-3. [DOI] [Google Scholar]
- Marczewski A. Application of Mixed Order Rate Equations to Adsorption of Methylene Blue on Mesoporous Carbons. Appl. Surf. Sci. 2010, 256, 5145–5152. 10.1016/j.apsusc.2009.12.078. [DOI] [Google Scholar]
- Lagrergen S. Zur Theorie Der Sogenannten Adsorption Gelöster Stoffe Kungliga Svenska Vetenskapsakademiens. Handlingar 1898, 24, 1–39. [Google Scholar]
- Derylo-Marczewska A.; Miroslaw K.; Marczewski A. W.; Sternik D. Studies of Adsorption Equilibria and Kinetics of O-, M-, P-, Nitro- and Chlorophenols on Microporous Carbons from Aqueous Solutions. Adsorption 2010, 16, 359–375. 10.1007/s10450-010-9247-9. [DOI] [Google Scholar]
- Marczewski A. W. Kinetics and Equilibrium of Adsorption of Organic Solutes on Mesoporous Carbons. Appl. Surf. Sci. 2007, 253, 5818–5826. 10.1016/j.apsusc.2006.12.037. [DOI] [Google Scholar]
- Marczewski A. W. Analysis of Kinetic Langmuir Model. Part I: Integrated Kinetic Langmuir Equation (IKL): A New Complete Analytical Solution of the Langmuir Rate Equation. Langmuir 2010, 26, 15229–15238. 10.1021/la1010049. [DOI] [PubMed] [Google Scholar]
- Marczewski A. W. Kinetics and Equilibrium of Adsorption of Dissociating Solutes from Aqueous Solutions on Mesoporous Carbons. Polym. J. Chem. 2008, 82, 271–281. [Google Scholar]
- Rudzinski W.; Plazinski W. Theoretical Description of the Kinetics of Solute Adsorption at Heterogeneous Solid/Solution Interfaces: On the Possibility of Distinguishing between the Diffusional and the Surface Reaction Kinetics Models. Appl. Surf. Sci. 2007, 253, 5827–5840. 10.1016/j.apsusc.2006.12.038. [DOI] [Google Scholar]
- Derylo-Marczewska A.; Marczewski A.; Winter S.; Sternik D. Studies of Adsorption Equilibria and Kinetics in the Systems: Aqueous Solution of Dyes–Mesoporous Carbons. Appl. Surf. Sci. 2010, 256, 5164–5170. 10.1016/j.apsusc.2009.12.085. [DOI] [Google Scholar]
- Ho Y.-S. Review of Second-Order Models for Adsorption Systems. J. Hazard. Mater. 2006, 136, 681–689. 10.1016/j.jhazmat.2005.12.043. [DOI] [PubMed] [Google Scholar]
- Derylo-Marczewska A.; Blachnio M.; Marczewski A. W.; Swiatkowski A.; Buczek B. Adsorption of Chlorophenoxy Pesticides on Activated Carbon with Gradually Removed External Particle Layers. Chem. Eng. J. 2017, 308, 408–418. 10.1016/j.cej.2016.09.082. [DOI] [Google Scholar]
- Liu Y.; Shen L. From Langmuir Kinetics to First-and Second-Order Rate Equations for Adsorption. Langmuir 2008, 24, 11625–11630. 10.1021/la801839b. [DOI] [PubMed] [Google Scholar]
- Azizian S. Kinetic Models of Sorption: A Theoretical Analysis. J. Colloid Interface Sci. 2004, 276, 47–52. 10.1016/j.jcis.2004.03.048. [DOI] [PubMed] [Google Scholar]
- Xia W. Physiological Activities of Chitosan and Its Application in Functional Foods. Zhongguo Shipin Xuebao 2003, 3, 77–81. [Google Scholar]
- Rinaudo M. Chitin and Chitosan: Properties and Applications. Prog. Polym. Sci. 2006, 31, 603–632. 10.1016/j.progpolymsci.2006.06.001. [DOI] [Google Scholar]
- Florke O.; Martin B.; Benda L.; Paschen S.; Bergna H.; Roberts W.; Welsh W.; Ettlinger M.; Kerner D.; Kleinschmit P.. Silica, Ullmann’s Encyclopedia of Industrial Chemistry; Wiley-VCH Verlag GmbH & Co.: Weinheim, Germany, 2008. [Google Scholar]
- Wight A.; Davis M. Design and Preparation of Organic-Inorganic Hybrid Catalysts. Chem. Rev. 2002, 102, 3589–3614. 10.1021/cr010334m. [DOI] [PubMed] [Google Scholar]
- Chassary P.; Vincent T.; Guibal E. Metal Anion Sorption on Chitosan and Derivative Materials: A Strategy for Polymer Modification and Optimum Use. React. Funct. Polym. 2004, 60, 137–149. 10.1016/j.reactfunctpolym.2004.02.018. [DOI] [Google Scholar]
- Puchol V.; El Haskouri J.; Latorre J.; Guillem C.; Beltrán A.; Beltrán D.; Amorós P. Biomimetic Chitosan-Mediated Synthesis in Heterogeneous Phase of Bulk and Mesoporous Silica Nanoparticles. Chem. Commun. 2009, 19, 2694–2696. 10.1039/b821308a. [DOI] [PubMed] [Google Scholar]
- Zou H.; Wu S.; Shen J. Polymer/Silica Nanocomposites: Preparation, Characterization, Properties, and Applications. Chem. Rev. 2008, 108, 3893–3957. 10.1021/cr068035q. [DOI] [PubMed] [Google Scholar]
- Česla P.; Fischer J.; Tesařová E.; Jandera P.; Staněk V. Effects of Capillary Coating and B-Cyclodextrin Additive to the Background Electrolyte on Separation of Sulphonated Azodyes by Capillary Zone Electrophoresis. J. Chromatogr. A 2007, 1149, 358–367. 10.1016/j.chroma.2007.02.113. [DOI] [PubMed] [Google Scholar]
- Singh R. L.; Singh P. K.; Singh R. P. Enzymatic Decolorization and Degradation of Azo Dyes – a Review. Int. Biodeterior. Biodegrad. 2015, 104, 21–31. 10.1016/j.ibiod.2015.04.027. [DOI] [Google Scholar]
- Al-Degs Y.; Khraisheh M.; Allen S.; Ahmad M.; Walker G. Competitive Adsorption of Reactive Dyes from Solution: Equilibrium Isotherm Studies in Single and Multisolute Systems. Chem. Eng. J. 2007, 128, 163–167. 10.1016/j.cej.2006.10.009. [DOI] [Google Scholar]
- Aroua M. K.; Leong S.; Teo L.; Yin C. Y.; Daud W. M. A. W. Real-Time Determination of Kinetics of Adsorption of Lead(II) onto Palm Shell-Based Activated Carbon Using Ion Selective Electrode. Bioresour. Technol. 2008, 99, 5786–5792. 10.1016/j.biortech.2007.10.010. [DOI] [PubMed] [Google Scholar]
- Marczewski A. W.; Seczkowska M.; Deryło-Marczewska A.; Blachnio M. Adsorption Equilibrium and Kinetics of Selected Phenoxyacid Pesticides on Activated Carbon: Effect of Temperature. Adsorption 2016, 22, 777–790. 10.1007/s10450-016-9774-0. [DOI] [Google Scholar]
- El-Naas M. H.; Al-Zuhair S.; Alhaija M. A. Removal of Phenol from Petroleum Refinery Wastewater through Adsorption on Date-Pit Activated Carbon. Chem. Eng. J. 2010, 162, 997–1005. 10.1016/j.cej.2010.07.007. [DOI] [Google Scholar]
- Lee J.-W.; Choi S.-P.; Thiruvenkatachari R.; Shim W.-G.; Moon H. Evaluation of the Performance of Adsorption and Coagulation Processes for the Maximum Removal of Reactive Dyes. Dyes Pigm. 2006, 69, 196–203. 10.1016/j.dyepig.2005.03.008. [DOI] [Google Scholar]
- Phan N. H.; Rio S.; Faur C.; Le Coq L.; Le Cloirec P.; Nguyen T. H. Production of Fibrous Activated Carbons from Natural Cellulose (Jute, Coconut) Fibers for Water Treatment Applications. Carbon 2006, 44, 2569–2577. 10.1016/j.carbon.2006.05.048. [DOI] [Google Scholar]
- Pereira A. G.; Muniz E. C.; Hsieh Y.-L. 1H NMR and 1H–13C HSQC Surface Characterization of Chitosan–Chitin Sheath-Core Nanowhiskers. Carbohydr. Polym. 2015, 123, 46–52. 10.1016/j.carbpol.2015.01.017. [DOI] [PubMed] [Google Scholar]
Associated Data
This section collects any data citations, data availability statements, or supplementary materials included in this article.


