

Abstract
Nitrogen oxide (NO) and nitrous oxide (N2O) formation in the circulating fluidized bed (CFB) combustion can be controlled by air staging and fuel staging. An extensive test campaign was carried out with a pilot-scale CFB test rig to observe the possibilities of the methods in the spruce bark and bituminous coal combustion as well as in co-combustion. Fuel staging with liquid petroleum gas (LPG) was done alternately from three locations with three intensities. Air staging was studied alone and during the fuel staging experiment. The experimental trends for NO and N2O emission formation during fuel staging and air staging are presented in this study. It was observed that air staging and fuel staging can have opposing effects on nitrogen oxide emission formation, and thus, when used together, a clear understanding of the fuel behavior and conditions, as well as NOx chemistry in the combustor, is needed. Under the tested conditions, it was observed that if air staging is effective, then fuel staging does not bring further benefits in the NO reduction. Instead, the LPG feed can increase the emission in the lack of oxygen. However, if it is not possible to carry out air staging, then fuel staging can be used in generating oxygen-lean reducing zones for NO. The N2O concentration was also further reduced with LPG in the tests with effective air staging.
1. Introduction
NO, NO2, and N2O are the main nitrogen pollutants emitted from combustion.1,2 Direct formation of NO2 in the fluidized bed combustion is usually insignificant. Instead, NO2 formation is found in the conditions where rapid cooling takes place.3 The formed NO is unstable in the atmosphere and oxidizes readily to NO2, which causes acidic fallout by reacting with atmospheric moisture. N2O is a greenhouse gas with an increasing atmospheric concentration4 and global warming potential 265 times that of CO2.5 Power plants in operation may have problems meeting the policies6 implemented to reduce the emissions of nitrogen oxides (NO and NO2). So far, regulations do not limit N2O emissions.
The methods for NOx and N2O emission reduction can be divided into primary and secondary techniques, of which the first one is less expensive. The primary techniques are used to reduce emissions already in the furnace by affecting the combustion conditions in order to produce reducing zones. These techniques, unfortunately, usually do not reduce all the harmful nitrogen species. The primary techniques include (i) low excess air, (ii) air staging, (iii) flue gas recirculation, (iv) reduced air preheat, and (v) fuel staging/reburning. The secondary techniques are referred to as end-of-pipe techniques, which are used to remove nitrogen oxides from the flue gas. These techniques are commonly divided into (i) selective catalytic reduction (SCR) and (ii) selective noncatalytic reduction (SNCR).20
Fuel nitrogen is the main cause of nitrogen oxide formation in the fluidized bed combustion. Nitrogen emissions also form from atmospheric nitrogen (prompt NO and thermal NO). However, the formation of prompt NO as a result of the reactions between N2 and hydrogen radicals from the fuel can be estimated as small.7,8 The combustion temperature in the fluidized bed combustion is far too low for thermal NO to form (800–1000 °C instead of ≥1300 °C), since thermal dissociation of N2 to N radicals is needed to start NO formation.9 A lower combustion temperature increases the NO reduction especially when the oxygen concentration is low.10 A relatively low combustion temperature, however, enhances the formation of N2O especially in circulating fluidized beds where almost isothermal conditions (typically 850–900 °C with full boiler load) exist in the riser.11
Bark with high volatile content releases nitrogen mainly to light gaseous species, promoting the homogeneous mechanism in nitrogen oxide formation.12 Although the reaction routes of volatile nitrogen species are complex,11,21 there is conformity in NO formation. Released nitrogen intermediates (HCN and NH3) react with available oxygen forming NO or in the oxygen-lean zone N2; formed NO can also reduce to N2.3,14 A lower O2 content in the combustor generally results in less NOx and N2O.7
Gustavsson and Leckner17,18 state that N2O formation is highly dependent on the conditions in the furnace. A higher temperature and lower level of excess air decrease emissions. In addition, the solid fuel, fuel characteristics, and additives affect the formation of nitrogen emission. Fuels with a high content of fixed carbon such as bituminous coal yield relatively high emissions of N2O (100–150 ppm), whereas N2O emission is lower for lignite and peat and negligible for wood, all with a lower content of fixed carbon compared to coal.17,19−21 The formation is commonly explained by the oxidation of char nitrogen and reaction of NO with char nitrogen or by catalytic reactions of nitrogen species on the available particle surfaces.22,23 The high volatile content of fuel also increases oxygen consumption and produces oxygen-lean zones that decrease N2O formation and increases its reduction.23 In a previous study with a VTT’s pilot circulating fluidized bed (CFB) combustor,24 it was found reasonable to assume that the heterogeneous reaction (reaction 1) of NO with char nitrogen reduces NO and increases N2O formation when char inventory increases.
| 1 |
This is in agreement with the literature2,25 of the fluidized bed combustion of coal and char.
Kinetics of reburning is complex and includes various hydrocarbon reaction mechanisms.13,15,26,27 During the reburning process, NO can be homogeneously reduced to N2 either with CHi radicals (i = 0, 1, 2) and ammonia radicals (NHi, i = 0, 1, 2) (if the reburn fuel contains nitrogen) or with CO. Also, Kilpinen et al.26 concluded that the NO reaction to HCN and with CO and H radicals is effective in reburning with methane. If active fuel-bound carbon sites are available, then they can also reduce NO to molecular nitrogen.28 The main homogeneous NO reduction routes related to reburning in the literature27−29 can be simplified to
| 2 |
| 3 |
The reburning method has been used for nitrogen emission reduction in the pulverized fuel combustion for various fuels.16,17,30−33 However, studies in the fluidized bed combustion conditions are rare. Sirisomboon and Kuprianov34 studied fuel staging in biomass–biomass co-combustion, and gas reburning in CFB integrated with gasification has been studied.35 In this study, the possibilities of the secondary fuel injection to the furnace above the primary zone in the circulating fluidized bed combustion and co-combustion of biomass and coal is studied by feeding liquid petroleum gas (LPG) in a pilot-scale combustor.
2. Experimental Procedure
The effect of air staging and fuel staging on nitrogen emission formation in the circulating fluidized bed combustion of coal, bark, and mixtures of them was studied with VTT’s 50 kW pilot combustor. The schematic diagram of the combustor can be seen in Figure 1. The riser has a cylindrical shape with a diameter of 0.17 m and a length of 8.3 m. The walls are constructed with high temperature and corrosion-resistant steel. Fed air is electrically heated, and the furnace zone has been equipped with several electric heating zones for stabilization and several ports for solid material sampling.
Figure 1.

Schematic diagram of VTT’s 50 kW CFB combustor including feeding ports for air and LPG.
Primary air is fed through an air grid. The secondary air is fed 1.3 m, and the tertiary air 1 is 4.7 m above the grid. Tertiary air 2 is fed just before the cyclone at 8.3 m above the grid. Primary fuels can be fed through two different lines. Additives can be fed through a separate line. Limestone or other additives were not used during the experiments. The particle size of natural sand used as the bed material was in a range of 0.1–0.5 mm (mean diameter, 0.2 mm). The combustor is equipped with five gas injection lines that can be seen in Figure 1 (LPG1–LPG5). LPG1 is interconnected with the primary air feed in order to mix the additional gas with primary air. LPG2 is located at 3.0 m, LPG3 at 6.2 m, and LPG4 at 7.9 m above the grid.
The main flue gas compounds (including O2, CO2, CO, NO, N2O, NO2, and SO2) were measured with an FTIR gas analyzer and an O2 analyzer at 2.0 m above the grid and after hot cyclone. The sampling point at 2.0 m is above the secondary air feed. The temperatures were measured with thermocouples along the CFB riser. All input flow rates are also measured as Nl/min. Laws describing ideal gases are used to correct the flow rate according to reactor temperatures. The total flue gas flow rate, which includes combustion gases, is calculated based on the measured fuel mass flow, air feed and, O2 content. The residence time of the flue gas is calculated using the flow rates, reactor dimensions, and feeding points.
The combustion tests were conducted with 100% bark, 100% bituminous coal, and two of their blends. The first blend consisted of 80% bark and 20% coal, and the second blend consisted of 27% bark and 73% coal on energy basis (dry fuel). Fuel compositions are shown in Table 1. LPG was injected into the combustor as a reburn fuel. The used LPG contains ∼95 vol % propane (C3H8) and ∼5 vol % butane (C4H10).
Table 1. Fuel Composition.
| fuel analysis | Finnish spruce bark | Russian bituminous coal |
|---|---|---|
| moisture (wt %) | 12.0 | 9.2 |
| ash (wt % db) 815 °C | 2.6 | 16.2 |
| volatile content (wt % db) | 75.0 | 32.8 |
| net calorific value (MJ/kg db) | 18.86 | 27.44 |
| C (wt % db) | 50.4 | 68.3 |
| H (wt % db) | 5.9 | 4.6 |
| N (wt % db) | 0.36 | 2.22 |
| S (wt % db) | 0.02 | 0.36 |
| Cl (wt % db) | 0.012 | 0.005 |
The total air volume flow (Nl/min) was kept constant, but the feed varied between primary, secondary, tertiary air 1, and tertiary air 2. The air-staging steps can be seen in Table 2. Air staging was done with or without the LPG feed. The gas injections with 5 kW load from three different locations (LPG2, LPG3, and LPG4) were tested from one location at a time and with three different LPG loads (2, 4, and 5 kW) from the injection point LPG2. The solid fuel feed, 45–50 kW depending on the fuel, was not changed when doing air staging or fuel staging to keep the bottom bed conditions comparable.
Table 2. Air-Staging Steps.
| test # | primary air (% tot) | secondary air (% tot) | tertiary air 1 (% tot) | tertiary air 2 (% tot) |
|---|---|---|---|---|
| 0 | 49 | 50 | 0 | 1 |
| 1 | 49 | 43 | 7 | 1 |
| 2 | 49 | 32 | 18 | 1 |
| 3 | 49 | 21 | 29 | 1 |
| 4 | 49 | 16 | 34 | 1 |
| 5 | 49 | 16 | 0 | 34 |
| 6 | 49 | 21 | 0 | 30 |
| 7 | 49 | 32 | 0 | 19 |
| 8 | 49 | 43 | 0 | 8 |
3. Results and Discussion
3.1. Effect of Air Staging on the Residence Time and Temperature Profile in the Combustor
The further from the grid the combustion air was fed, the longer the flue gas stayed in the combustor due to decreased flue gas velocity. From the initial air feed (49/50/0/1, prim/sec/tert1/tert2 vol % shares, respectively) to staging, in which 33% air was fed into tertiary air 1 (49/16/33/1), the increase in the flue gas residence time in the reactor was 0.5–1 s. If part of the combustion air was fed into tertiary air 2 before the cyclone (maximum case, 49/16/0/34), then the residence time increased up to 1.5 s. This means that when the air feed to the secondary air is decreased, the flue gas residence time in the oxygen-lean zone becomes longer due to both lower oxygen concentration in the combustor and decreased flue gas velocity. The LPG feed increased the total flow rate by less than 0.5%. Therefore, its effect to the residence time can be considered negligible.
During the combustion of either 100% bark or a mixture containing 80% bark, the increase in the air feed increased the temperature at the feeding height (Figures 2 and 3). This clearly shows that volatiles burn immediately if oxygen is available. In all tests for bark and mixtures containing bark, a peak in the temperature can be seen at the secondary air entry where the main part of the volatiles burn. However, during the combustion tests for 100% coal, both the secondary feed and the tertiary air 1 feed cool down the temperature in the combustor locally. The more the air feed was spread, the lower the gradient appeared in temperature at the secondary entry for bark, whereas for coal, the decrease in the secondary air feed seems to smoothen the temperature differences. It can be clearly observed that the combustion at the secondary air entry decreases and the combustion in the upper combustor increases when the share of coal in the fuel mixture is increased. When more than 20% of the total air was tertiary air 2, part of the combustion occurred after that level.
Figure 2.

Temperature profile in the combustor without the gas feed for (left) 100% bark and (right) 100% coal.
Figure 3.

Temperature profile in the combustor during the gas feed tests for 100% bark.
LPG injection increased the mean temperature (25–50 °C) in the combustor since the LPG combustion heats up the bed material. It can be seen clearly that LPG burns in oxygen-rich conditions. However, if the combustor is oxygen-lean, then combustion occurs closer to or in the cyclone or, in other words, due to tertiary air 2. Neither air staging nor the LPG feed greatly affect the density profile in the combustor, which was close to constant throughout the test set.
3.2. Nitrogen Emission Formation during Fuel Staging and Air Staging
The blending of fuels affects significantly nitrogen emission formation. The increase in the coal share in the fuel decreases the nitrogen conversion to NO and increases its conversion to N2O, as can be seen in Figure 4. If the fuel contains mainly or only bark, then the nitrogen conversion to N2O is low. For 100% coal, the measured N2O concentration is clearly the highest. In the experiments where 73% share of coal was used, nitrogen conversion to N2O in the stack is in the same range as that to NO. When the share of coal increases, the amount of char increases in the combustor, and the heterogeneous reaction of NO with char nitrogen reduces NO and increases N2O formation.2,24,25
Figure 4.

NO and N2O formation with different fuel mixtures (bark/coal) when no LPG is fed and the air feed is to the primary and secondary air (49/50/0/1).
It was found reasonable to study the tests with all bark (100%) and high share of bark (80%) in parallel due to similarities in the results. This is done in Section 3.2.1. Accordingly, in Section 3.2.2, the tests with all coal (100%) and high share of coal (73%) are also analyzed in parallel.
3.2.1. Bark as the Main Fuel
Carbon monoxide (CO) and char can reduce NO during combustion.26,28,36,37 In addition, the low excess air causing high CO concentrations reduces NO formation.38 The CO concentration in the stack is low during combustion tests with 100 and 80% bark (under 90 mg/Nm3). The tertiary air reacts with the rest of CO if the combustion in the riser is incomplete, and the cyclone is an efficient mixer that aids the combustion of CO. However, the measured CO concentration in the stack is the highest when the NO concentration is the lowest. Considerably high CO concentrations above the secondary air entry are measured when the secondary air feed is small, as can be seen from Figure 5.
Figure 5.

Mixture containing 80% bark, NO concentration in the stack, and CO concentration above the secondary air entry versus oxygen concentration after the secondary air feed.
In this study, the largest reduction in NO during the air-staging tests for pure bark (100%) and the mixture (80% bark, 20% coal) is found when 21% of the total feed is to the secondary air and 49% to the primary air and the rest of the air is fed as tertiary airs 1 and 2. A decrease in the secondary air feed affects the flue gas velocity in the combustor, making the residence time of reacting nitrogen in reducing conditions longer. When the last air feed location was tertiary air 2 instead of tertiary air 1, even more NO is reduced due to extended oxygen-lean zone in the reactor. In the lack of oxygen, nitrogen precursors reduce to atmospheric N2, or NO formed in the dense bed reduces in the reaction with CO and/or char-N.
The N2O formation is insignificant when the char inventory is small,39 which was also shown in this study. A biomass product gas is also found to be an effective N2O reductant in fluidized bed conditions.40 Lu and Anthony41 conducted experiments with natural gas in a circulating fluidized bed combustor. They found that the gas combustion itself produced a negligible amount of N2O. However, NO formed with the prompt NO mechanism, which was explained by local hot spots due to uneven burning of gas. In this study, the temperature in the combustor was electrically controlled, and such hot spots were not present. Anyhow, the abovementioned mechanism can affect a commercial-scale combustor.
The increase in the LPG feed reduces NO almost in a linear fashion for bark as can be seen in Figure 6, in which the change in the flue gas NO concentration due to the LPG feed compared to the corresponding air feed without the LPG feed is illustrated. With a 5 kW LPG feed to the lowest feeding point (LPG2) above the secondary air entry, 22% less NO forms than without fuel staging. However, it must be pointed out that there is no reduction with the most reducing air feeds (49/21/29/1). It seems that if air staging is effective, then fuel staging is not needed, and if used, it may increase NO emission. The results are similar with the mixture that contains mainly bark (80%).
Figure 6.
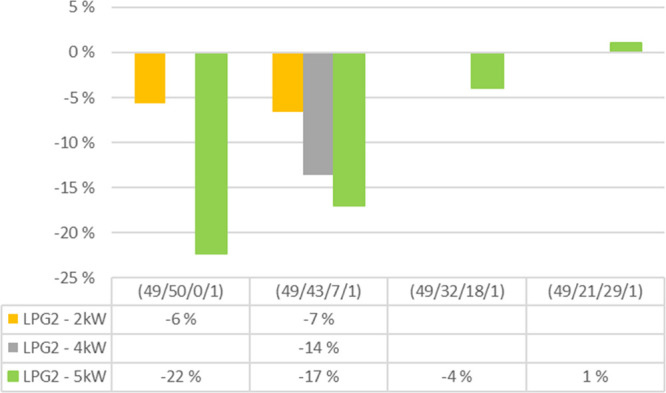
Bark 100%. The change in the flue gas NO concentration due to LPG with three intensities compared to no LPG feed at different air-staging combinations (prim/sec/tert1/tert2).
In the study by Pels et al.42 it was observed that during the volatile combustion, intermediate NCO, which originates from HCN, reacts to NO at higher temperatures, whereas lower temperatures favored N2O formation. Loeffler et al.43 also observed that above 800 °C, the conversion to NO increases if the radical level in the combustor is high. However, the effect in lower temperatures was opposite, which was explained by reaction 4.
| 4 |
Therefore, the temperature increase and high radical level due to the LPG feed would expect to lead to higher NO formation during the combustion of bark with high volatile content. However, more NO is reduced when the intensity of the LPG feed is increased. Both of the abovementioned studies were done in laboratory-scale equipment in which the oxygen concentration can be controlled. In this study, the LPG feed significantly affects the oxygen content above the feeding height. Especially, if part of the combustion air is fed into the tertiary air 2 feed, then the lower the location of the LPG feed is in the combustor, the more NO is reduced (Figure 7). A maximum reduction (31%) in the NO concentration in the stack is obtained with the lowest air feed (49/32/0/19) and the lowest LPG feed (LPG2). The lower is the increase in the reburn fuel in the combustor, the longer is the residence time of nitrogen compounds in the oxygen-lean zone if tertiary air 1 is not available. Therefore, it is assumed that the decrease in oxygen concentration due to the LPG feed plays a greater role in the NO reduction than temperature, which, anyhow, accelerates the reactions of the radical pool with NO.
Figure 7.
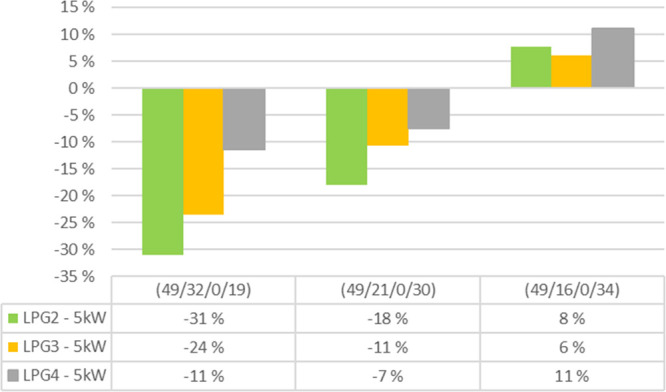
100% bark. The change in the flue gas NO concentration due to the LPG feed from three locations compared to no LPG feed at different air-staging combinations (prim/sec/tert1/tert2).
3.2.2. Coal as the Main Fuel
During bituminous coal combustion, the total nitrogen emission in the stack decreases along with the reduced secondary air feed (see Figure 8). According to an earlier study24 in which bituminous coal was combusted with VTT’s pilot combustor, NO concentration above the dense bed can be correlated with the average bed temperature and oxygen concentration. In this study, the conditions in the dense bed were kept constant to compare the effects of fuel staging and air staging. It is assumed that most of the heterogeneous nitrogen reactions on the char surface, such as NO reduction to N2O (reaction 1), have already occurred in the dense bed. The N2O concentration seems to decrease further in the riser in oxygen-deficient conditions, but the NO concentration remains quite stable despite the changes in the air feed.
Figure 8.

100% coal. NO and N2O concentration in the stack and CO concentration above the secondary air entry versus oxygen concentration after the secondary air feed.
During the coal (100%) combustion tests, the LPG feed reduces both NO and N2O emissions, as can be seen in Figure 9. For pure coal, the test matrix included the test with all air feed variations only with the LPG feed intensity of 5 kW. The NO reduction with LPG is low when tertiary air 1 is not available, and the oxygen concentration remains low in the riser. In general, more nitrogen emission is reduced with LPG when there is more oxygen available at the secondary air entry, which is reverse to the tests without LPG, in which the decrease in the secondary air feed decreases the total nitrogen emission.
Figure 9.

100% coal. The change in the flue gas NO and N2O concentration due to the LPG feed compared to no LPG feed at different air-staging combinations (prim/sec/tert1/tert2).
The LPG feed reduces NO during the tests for 73% coal except if the secondary air feed is small and part of the combustion air is fed at the tertiary air 2 feeding point instead of feeding it at the tertiary air 1 feeding point (49/21/0/30) (see Figure 10). Again, it seems that if air staging is effective, the fuel staging is not needed. Approximately 34% reduction in NO can be achieved with 5 kW LPG feed to the lowest feed point (LPG2) compared to a case in which no LPG is fed. N2O is reduced with LPG in all tests. The reducing effect of LPG is highest in the no-staging test (49/50/0/1) and decreases when staging is increased. It is also remarkable that LPG reduces more NO and N2O if the secondary air feed is high, but if LPG is not available, the reduction increases in the lack of oxygen above the dense bed. Clear conclusions regarding the intensity of the LPG feed on the NO reduction cannot be made with available measurements.
Figure 10.

Mixture containing 73% coal and 27% bark. The change in the flue gas NO concentration due to the LPG feed with three intensities compared to no LPG feed at different air-staging combinations (prim/sec/tert1/tert2).
N2O concentration decreases along with the increase in the intensity of LPG feed, as can be seen in Figure 11. A high temperature and low air ratio is found to lower N2O emissions.44,45 According to the measurements in this study, the increase in the LPG feed increases the temperature and lowers the oxygen concentration in the riser. In addition, the LPG feed increases N2O reducing radicals in the reactor. Gustavsson and Leckner17 list the main gas-phase reactions that decompose N2O. They include decomposition via H and OH radicals (reactions 5 and 6) and thermal decomposition (reaction 7).
| 5 |
| 6 |
| 7 |
Figure 11.

Mixture containing 73% coal and 27% bark, the change in flue gas N2O concentration due to LPG feed with three intensities compared to no LPG feed at different air-staging combinations (prim/sec/tert1/test2).
They found that the N2O reduction is strongly dependent on the temperature and there were no differences between the fuels used for the reduction, meaning that differences between released radicals did not affect the reduction. N2O emission approached zero if the temperature increases above 900 °C. In this study, the LPG feed clearly increases the temperature throughout the combustor, and the air feed slightly decreases the temperature.
4. Conclusions
The effect of air staging and fuel staging on nitrogen emission formation in the circulating fluidized bed combustion of coal, bark, and their mixtures was studied. LPG was used in fuel staging. It was observed that air staging and fuel staging can have opposing effects on nitrogen emission formation, and thus, when used together, a clear understanding of the conditions in the combustor is needed. The following conclusions can be made on the study:
-
1.
The decrease in the secondary air feed decreased the oxygen concentration and flue gas velocity in the combustor, which led to lower NO emission due to increased flue gas residence time in the reducing conditions and increased CO concentration in the riser. The largest reduction during the air-staging experiments was obtained when 21% of the total feed was to the secondary air and 49% to the primary air and the rest to tertiary air 1 or 2. This applied to all used fuels. If the rest of the combustion air was fed to tertiary air 2 instead of tertiary air 1, meaning that the flue gas residence time in the reducing zone further increased, and the total emission reduction was larger.
-
2.
The increase in LPG feed reduced NO during bark combustion; a maximum of 31% of NO reduction from flue gas was obtained with a 5 kW LPG feed. Such a reduction was not, however, clearly observed with the mixture of 27% bark and 73% coal.
-
3.
N2O formation was insignificant during bark combustion but increased with the increase in coal share in the fuel mixture. LPG was found to efficiently reduce N2O when it was formed. The increase in LPG feed increased N2O reduction during the experiments with 27% bark and 73% coal; a maximum of 30% N2O reduction from flue gas was obtained with a 5 kW LPG feed.
-
4.
When the effect of the air staging in decreasing NO emission was maximal, further NO reduction did not occur with fuel staging. Instead, the LPG feed can increase emissions. However, N2O concentration in the stack was further reduced with LPG, since the LPG feed increases the temperature and, thus, speeds up the decomposition of N2O and increases the N2O reducing radical pool in the combustor.
-
5.
The decrease in the oxygen concentration due to staging with LPG played a bigger role in NO reduction than the increase in the temperature due to LPG combustion in pilot CFB combustor, in which the temperature stayed well below the prompt NO formation temperature.
-
6.
In the experiments where fuel staging reduced NO in the first place, the lower the LPG feed was located in the combustor, the more NO was reduced. The location of the LPG feed did not clearly affect N2O reduction.
Unfortunately, the LPG addition did not clearly benefit NO reduction in relation to pure air staging. However, it is clear that both techniques can have beneficial effects on nitrogen emission reduction. In a commercial scale, lower cost gases such as raw gas from anaerobic digestion, landfill gas, or product gas from gasification could also be used for fuel staging. Solid fuels can be used if their combustion behavior is known so that the oxygen-lean NO reducing zone is produced to the desired location. To obtain the benefits of the joint use of fuel staging and air staging in nitrogen emission reduction during the CFB combustion, validation of sophisticated flow models with nitrogen compound measurements along the combustor riser would be needed.
Acknowledgments
This work was done within the project “Biofficiency - Highly efficient biomass CHP plants by handling ash-related problems” carried out in European Union’s Horizon 2020 research and innovation programme under grant agreement 727616.
Glossary
Notation
- CFB
circulating fluidized bed
- LPG
liquid petroleum gas
The authors declare no competing financial interest.
References
- Pohl J. H.; Sarofim A. F. Devolatilization and oxidation of coal nitrogen. Symp. (Int.) Combust. 1977, 16, 491–501. 10.1016/S0082-0784(77)80346-9. [DOI] [Google Scholar]
- Tullin C. J.; Sarofim A. F.; Beer J. M. Formation of NO and N2O in coal combustion - the relative importance of volatile and char nitrogen. J. Inst. Energy 1993, 66, 207–215. [Google Scholar]
- Hill S. C.; Smoot L. D. Modeling of nitrogen oxides formation and destruction in combustion systems. Prog. Energy Combust. Sci. 2000, 26, 417–458. 10.1016/S0360-1285(00)00011-3. [DOI] [Google Scholar]
- IPCC . Climate Change 2013 - The Physical Science Basis: Working Group I contribution to the Fifth assessment report of the Intergovernmental Panel on Climate Change; New York, NY, USA, Cambridge University Press: 2014.
- IPCC . Climate Change 2014: Synthesis Report. Geneva, Switzerland: Contribution of Working Groups 1, 2 and 3 to the Fifth Assessment Report of the Intergovernmental Panel on Climate Change [Core Writing Team: Pachauri R. K., Mayer L. A., Eds.]; Alfred-Wegener-Institut, 2014. [Google Scholar]
- Official Journal of the European Communities. Anal. Proc. 1984, 196–196. 10.1039/ap9842100196. [DOI] [Google Scholar]
- Hayhurst A. N.; Lawrence A. D. The amounts of NOx and N2O formed in a fluidized bed combustor during the burning of coal volatiles and also of char. Combust. Flame 1996, 105, 341–357. 10.1016/0010-2180(95)00215-4. [DOI] [Google Scholar]
- Fenimore C. P. Formation of Nitric Oxide in Premixed Hydrocarbon Flames. Symp. (Int.) Combust. 1971, 13, 373–380. 10.1016/S0082-0784(71)80040-1. [DOI] [Google Scholar]
- Zeldovich Y.; Sadovikov P.; Frank-Kamenetskii D.. Oxidation of Nitrogen in Combustion. Moscow-Leningrad: Academy of Sciences of USSR, Institute of Chemical Physics; 1947. [Google Scholar]
- Kühnemuth D.; Normann F.; Andersson K.; Johnsson F.; Leckner B. Reburning of nitric oxide in oxy-fuel firing-the influence of combustion conditions. Energy Fuels 2011, 25, 624–31. 10.1021/ef101054t. [DOI] [Google Scholar]
- Johnsson J. E.; Åmand L.-E.; Dam-Johansen K.; Leckner B. Modeling N2O Reduction and Decomposition in a Circulating Fluidized Bed Boiler. Energy Fuels 1996, 10, 970–9. 10.1021/ef950253r. [DOI] [Google Scholar]
- Abelha P.; Gulyurtlu I.; Cabrita I. Release of nitrogen precursors from coal and biomass residues in a bubbling fluidized bed. Energy Fuels 2008, 22, 363–71. 10.1021/ef700430t. [DOI] [Google Scholar]
- Miller J. A.; Bowman C. T. Mechanism and modeling of nitrogen chemistry in combustion. Prog. Energy Combust. Sci. 1989, 15, 287–338. 10.1016/0360-1285(89)90017-8. [DOI] [Google Scholar]
- Glarborg P.; Jensen A. D.; Johnsson J. E. Fuel nitrogen conversion in solid fuel fired systems. Prog. Energy Combust. Sci. 2003, 29, 89–113. 10.1016/S0360-1285(02)00031-X. [DOI] [Google Scholar]
- Dagaut P.; Glarborg P.; Alzueta M. U. The oxidation of hydrogen cyanide and related chemistry. Prog. Energy Combust. Sci. 2008, 34, 1–46. 10.1016/j.pecs.2007.02.004. [DOI] [Google Scholar]
- Alzueta M. U.; Glarborg P.; Dam-Johansen K. Low temperature interactions between hydrocarbons and nitric oxide: An experimental study. Combust. Flame 1997, 109, 25–36. 10.1016/S0010-2180(96)00146-0. [DOI] [Google Scholar]
- Gustavsson L.; Leckner B. Abatement of N2O Emissions from Circulating Fluidized Bed Combustion through Afterburning. Ind. Eng. Chem. Res. 1995, 34, 1419–1427. 10.1021/ie00043a050. [DOI] [Google Scholar]
- Gustavsson L.Reduction of the N2O Emission from Fluidized Bed Combustion by Afterburning; Charlmers University of Technology, 1995. [Google Scholar]
- Chen Z.; Lin M.; Ignowski J.; Kelly B.; Linjewile T. M.; Agarwal P. K. Mathematical modeling of fluidized bed combustion. 4: N2O and NOX emissions from the combustion of char. Fuel 2001, 80, 1259–72. 10.1016/S0016-2361(01)00007-2. [DOI] [Google Scholar]
- Åmand L.-E.; Leckner B. Reduction of N2O in a circulating fluidized-bed combustor. Fuel 1994, 73, 1389–97. 10.1016/0016-2361(94)90054-X. [DOI] [Google Scholar]
- Leckner B. Fluidized bed combustion: Achievements and problems. Symp. (Int.) Combust. 1996, 26, 3231–41. 10.1016/S0082-0784(96)80169-X. [DOI] [Google Scholar]
- Kilpinen P.; Hupa M. Homogeneous N2O chemistry at fluidized bed combustion conditions: A kinetic modeling study. Combust. Flame 1991, 85, 94–104. 10.1016/0010-2180(91)90179-F. [DOI] [Google Scholar]
- Shen B. X.; Mi T.; Liu D. C.; Feng B.; Yao Q.; Winter F. N2O emission under fluidized bed combustion condition. Fuel Process. Technol. 2003, 84, 13–21. 10.1016/S0378-3820(02)00104-2. [DOI] [Google Scholar]
- Tourunen A.; Saastamoinen J.; Nevalainen H. Experimental trends of NO in circulating fluidized bed combustion. Fuel 2009, 88, 1333–41. 10.1016/j.fuel.2008.12.020. [DOI] [Google Scholar]
- Kilpinen P.; Kallio S.; Konttinen J.; Barišić V. Char-nitrogen oxidation under fluidised bed combustion conditions: Single particle studies. Fuel 2002, 81, 2349–2362. 10.1016/S0016-2361(02)00176-X. [DOI] [Google Scholar]
- Kilpinen P.; Glarborg P.; Hupa M. Reburning Chemistry: A Kinetic Modeling Study. Ind. Eng. Chem. Res. 1992, 31, 1477–90. 10.1021/ie00006a009. [DOI] [Google Scholar]
- Normann F.; Andersson K.; Johnsson F.; Leckner B. Reburning in oxy-fuel combustion: A parametric study of the combustion chemistry. Ind. Eng. Chem. Res. 2010, 49, 9088–94. 10.1021/ie101192a. [DOI] [Google Scholar]
- Liu H.; Hampartsoumian E.; Gibbs B. M. Evaluation of the optimal fuel characteristics for efficient NO reduction by coal reburning. Fuel 1997, 76, 985–93. 10.1016/S0016-2361(97)00114-2. [DOI] [Google Scholar]
- Magel H. C. ; Schnell U.; Hein K. R. G.. Modelling of Hydrocarbon and Nitrogen Chemistry in Turbulent Combustor Flows using Detailed Reaction Mechanisms. 3rd Work Model Chem React Systems Heidelberg, Heidelberg University: Heidelberg, 1996, 1, 1–10. [Google Scholar]
- Smoot L. D.; Hill S. C.; Xu H. NOx control through reburning. Prog. Energy Combust. Sci. 1998, 24, 385–408. 10.1016/S0360-1285(97)00022-1. [DOI] [Google Scholar]
- Su S.; Xiang J.; Sun L.; Hu S.; Zhang Z.; Zhu J. Application of gaseous fuel reburning for controlling nitric oxide emissions in boilers. Fuel Process. Technol. 2009, 90, 396–402. 10.1016/j.fuproc.2008.10.011. [DOI] [Google Scholar]
- Werle S. Modeling of the reburning process using sewage sludge-derived syngas. Waste Manage. 2012, 32, 753–758. 10.1016/j.wasman.2011.10.013. [DOI] [PubMed] [Google Scholar]
- Adams B. R.; Harding N. S. Reburning using biomass for NOx control. Fuel Process. Technol. 1998, 54, 249–263. 10.1016/S0378-3820(97)00072-6. [DOI] [Google Scholar]
- Sirisomboon K.; Kuprianov V. I. Effects of fuel staging on the NO emission reduction during biomass-biomass co-combustion in a fluidized-bed combustor. Energy Fuels 2017, 31, 659–71. 10.1021/acs.energyfuels.6b02622. [DOI] [Google Scholar]
- Hu X.; Wang T.; Dong Z.; Zhang H.; Dong C. Research on the gas reburning in a circulating fluidized bed (CFB) system integrated with biomass gasification. Energies 2012, 5, 3167–3177. 10.3390/en5093167. [DOI] [Google Scholar]
- Aarna I.; Suuberg E. M. The Role of carbon monoxide in the NO-carbon reaction. Energy Fuels 1999, 13, 1145–1153. 10.1021/ef9900278. [DOI] [Google Scholar]
- Aarna I.; Suuberg E. M. A review of the kinetics of the nitric oxide-carbon reaction. Fuel 1997, 76, 475–91. 10.1016/S0016-2361(96)00212-8. [DOI] [Google Scholar]
- Lyngfelt A.; Åmand L.; Leckner B. Reversed air staging - a method for reduction of N20 emissions from fluidized bed combustion of coal. Fuel 1998, 77, 953–959. 10.1016/S0016-2361(98)00007-6. [DOI] [Google Scholar]
- Goel S.; Sarofim A.; Kilpinen P.; Hupa M. Emissions of Nitrogen Oxides From Circulating Fluidized-Bed combustors: Modeling results using detailed chemistry. Symp. (Int.) Combust. 1996, 26, 3317–3324. 10.1016/S0082-0784(96)80179-2. [DOI] [Google Scholar]
- Dong C.; Hu X.; Li Y.; Zhang J.; Jiang D.; Zhang H., et al. Product Gas Combustion in Fluidized Bed for N2O Reduction. In 2009 International Conference on Sustainable Power Generation and Supply; IEEE, 2009.
- Lu D.; Anthony E.. Combustion Characteristics of Natural Gas in a Circulating Fluidized Bed. In 17th International Conference on Fluidized Bed Combustion; American Society of Mechanical Engineers:Jacksonville, Florida, USA, 2003. doi: 10.1115/FBC2003-053. [DOI]
- Pels J. R.; Wojtowicz M. A.; Kapteijn F.; Moulijn J. A. Trade-Off between NOxand N2O in Fluidized-Bed Combustion of Coals. Energy Fuels 1995, 9, 743–752. 10.1021/ef00053a003. [DOI] [Google Scholar]
- Loeffler G.; Wartha C.; Winter F.; Hofbauer H. Study on NO and N2O formation and destruction mechanisms in a laboratory-scale fluidized bed. Energy Fuels 2002, 16, 1024–32. 10.1021/ef010228n. [DOI] [Google Scholar]
- Lyngfelt A.; Åmand L.-E.; Gustavsson L.; Leckner B. Methods for reducing the emission of nitrous oxide from fluidized bed combustion. Energy Convers. Manage. 1996, 37, 1297–302. 10.1016/0196-8904(95)00336-3. [DOI] [Google Scholar]
- Li S.; Xu M.; Jia L.; Tan L.; Lu Q. Influence of operating parameters on N2O emission in O2/CO2combustion with high oxygen concentration in circulating fluidized bed. Appl. Energy 2016, 173, 197–209. 10.1016/j.apenergy.2016.02.054. [DOI] [Google Scholar]