

Abstract
The reversible oxidation of Protein Tyrosine Phosphatases (PTPs) impairs their ability to dephosphorylate substrates in vivo. This transient inactivation of PTPs occurs as their conserved catalytic cysteine residue reacts with cellular oxidants thereby abolishing the ability of this reactive cysteine to attack the phosphate of the target substrate. Hence, in vivo, the inhibition of specific PTPs in response to regulated and localized rises in cellular oxidants enables phospho-dependent signaling. We present assays that measure the endogenous activity of specific PTPs that become transiently inactivated in cells exposed to growth factors. Here we describe the methods and highlight the pitfalls to avoid post-lysis oxidation of PTPs in order to assess the inactivation and the reactivation of PTPs targeted by cellular oxidants in signal transduction.
Keywords: Protein Tyrosine Phosphatases, Activity Assay, Redox Signaling, pNPP, Biotin Labeling
INTRODUCTION
Redox signaling involves low or moderate levels of cellular oxidants that transiently modify proteins. These post-translational modifications often cause structural modifications that regulate the activity, localization or stability of proteins, which in turn lead to alterations in cell function (Holmström & Finkel, 2014). Numerous examples of PTPs becoming transiently oxidized and inactivated in response to signaling induced by growth factors, cytokines, G protein-coupled receptor agonists, and stress have been published (Boivin & Tonks, 2010; Chiarugi & Cirri, 2003; Gross et al., 1999; Karisch et al., 2011; Lee, Kwon, Kim, & Rhee, 1998; Leslie et al., 2003; Mahadev, Zilbering, Zhu, & Goldstein, 2001; Meng, Buckley, Galic, Tiganis, & Tonks, 2004; Meng, Fukada, & Tonks, 2002; Ostman, Frijhoff, Sandin, & Böhmer, 2011). However, much remains to be established about the regulation of PTPs by cellular oxidants. Detecting in vivo oxidation of PTPs is challenging because of the propensity of these enzymes to become oxidized by air oxygen. Although some approaches target the conformational changes of PTPs induced by oxidation (Haque, Andersen, Salmeen, Barford, & Tonks, 2011), most methods assess the reactivity of the essential nucleophilic cysteinyl residue in the HC(X)5R signature motif present in all members of the PTP superfamily.
The surroundings of the catalytic cysteinyl residue of PTPs, located at the bottom of the crevice that forms the catalytic site, create an acidic environment that lowers its pKa (Jia, Barford, Flint, & Tonks, 1995; Tabernero, Aricescu, Jones, & Szedlacsek, 2008; Tonks, 2006). As a result, the side chain of this conserved cysteinyl residue is in a negatively charged thiolate form, which makes it both a good nucleophile (CN-S−, nucleophilic cysteine) towards phosphorylated substrates and particularly sensitive to cellular oxidants (Denu & Tanner, 1998; Lohse, Denu, Santoro, & Dixon, 1997; Zhang & Dixon, 1993). Hence, in signaling cascades PTPs act as variable resistors that integrate redox signals, and this oxidation dials down their activity and transiently facilitates phosphorylation-dependent signaling.
In physiological conditions, oxidation of the CN-S− residue of PTPs gives rise to a sulfenic acid (−SOH). The reversibility of oxidation is thought to be facilitated by the rapid conversion of this sulfenic acid to intermediate forms such as cyclic sulfenamides (Salmeen et al., 2003; Yang et al., 2007), intramolecular disulfides (Buhrman, Parker, Sohn, Rudolph, & Mattos, 2005; Salmeen & Barford, 2005), or intermolecular disulfides (Tonks, 2006). These transitory states protect the enzyme from further oxidation to sulfinic (−SO2H) and sulfonic (−SO3H) acids and allow the redox cycle regulating PTP activity to be completed by cellular reductants such as glutathione, thioredoxin, or glutaredoxin (Barrett et al., 1999; Dagnell et al., 2013; Schwertassek et al., 2014).
Methods to detect reversible oxidation of PTPs – such as the cysteinyl labeling assay (Boivin, Yang, & Tonks, 2010), the in-gel phosphatase assay (Meng & Tonks, 2003), PTP-OX antibodies (Persson et al., 2004) or dimedone-based labeling of sulfenic acids (Nelson et al., 2010) are routinely used to identify PTPs that become reversibly oxidized in specific signaling pathways (Ostman et al., 2011). Complementing these approaches that allow the identification of inactivated PTPs, we developed two assays that have the sensitivity to detect the endogenous activity of specific PTPs as well as the dynamic range to quantify the transient inactivation of these PTPs in vivo.
The first protocol that we describe is designed to quantitatively assess endogenous catalytic activity of specific PTPs in cells stimulated by growth factors. This method is a detailed description of the endogenous PTP-activity assay that we recently used to study how a protein complex stabilizes the reversibly oxidized form of PTP1B following cell stimulation with epidermal growth factor (EGF) (Londhe et al., 2020). This technique is challenging in several ways. For example, first and foremost it is critical to avoid oxidation of proteins after cell lysis. Here, we provide in a step-by-step manner a detailed account of the method to help an investigator overcome potential technical difficulties that may be encountered while performing this assay. The second protocol that we describe is a modified version of direct cysteinyl labeling assays (Ostman et al., 2011). Our modified approach takes advantage of the unique, low pKa of the active-site cysteine residue that is a characteristic of members of the PTP family. The anaerobic experimental conditions that minimize post-lysis oxidation are similar to those described in the first protocol. However, a biotinylated sulfhydryl-reactive compound (iodoacetyl-polyethyelene oxide, IAP) is included in the mildly acidic lysis buffer (pH 5.5) to label the reactive CN-S− residue of active PTPs. Hence, the biotinylated PTPs generated in this assay are active, and a decrease in biotin-labeling quantitatively reveals inactivation by reversible oxidation. Establishing the dynamic range of these assays in anaerobic conditions that minimize post-lysis oxidation of PTPs will help investigators to accurately quantify PTP oxidation and to assess their reactivation in cells, an important step towards identifying small molecules that regulate the redox cycle of specific PTPs in cells.
STRATEGIC PLANNING
The strategy devised to measure the catalytic activity of PTPs that become inactivated by cellular oxidants and reactivated by antioxidant pathways following cell stimulation by growth factors is based on principles previously established for the cysteinyl labeling assay (Boivin et al., 2010; Boivin, Zhang, Arbiser, Zhang, & Tonks, 2008). In that respect, two main aspects of our assay are different than conventional PTP activity assays. First, given the sensitivity of the catalytic cysteine of PTPs to become reversibly oxidized by cellular oxidants and to spontaneously oxidize following exposition to air oxygen dissolved in the lysis buffer or by air oxygen itself, the entire assay is designed to minimize post-lysis oxidation of PTPs. Second, reducing agents, which are generally used when measuring the activity of PTPs, are left out of all steps in our assay. These two critical modifications allow us to measure the endogenous activity of specific PTPs that are left untouched by cellular oxidants and to unmask the fraction of PTPs that are reversibly inactivated by cellular oxidants generated by growth factors signaling (Finkel, 2011; Tonks, 2013).
We describe how to perform two different cell lysis strategies and two methods that allow purification of specific PTPs: 1) to measure the endogenous catalytic activity of a PTP using a chromogenic substrate; or 2) to label the catalytic cysteine residue of active PTPs with a biotinylated sulfhydryl-reactive compound. By comparing the endogenous activity and biotin-labeling of endogenously active PTPs with control experimental conditions that activate all PTPs, our activity assays allow us to dynamically assess the reactivation of the fraction of specific PTPs that become inactivated by reversible oxidation in cells exposed to growth factors (Figure 1).
Figure 1. Schematic outline of the endogenous PTP-activity assay.
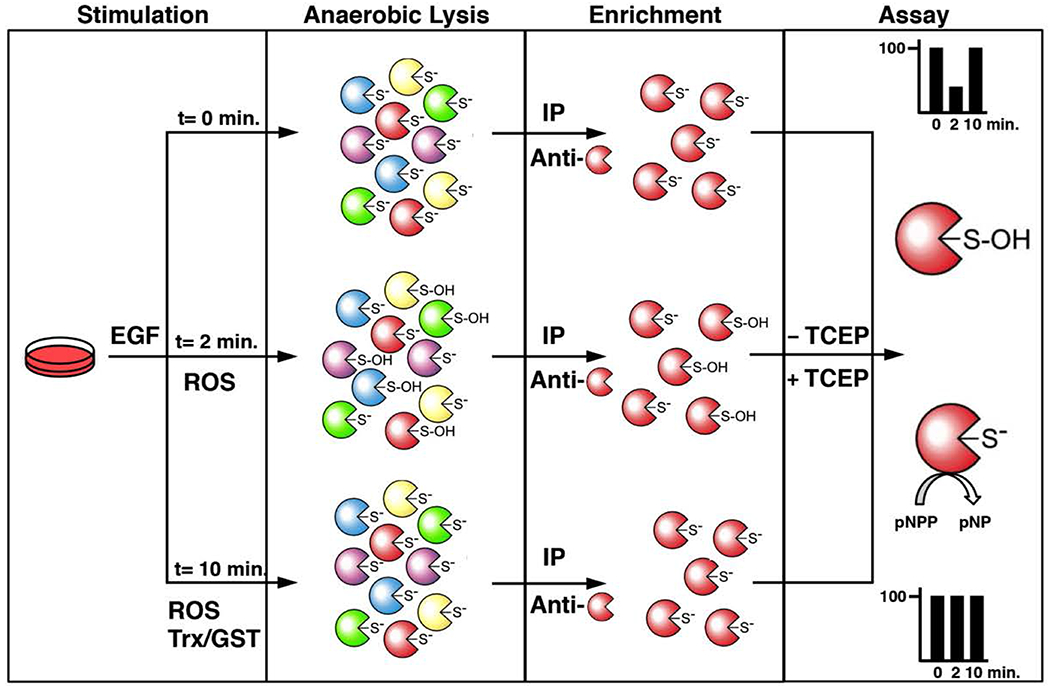
In resting cells, active PTPs are reduced and their invariable catalytic cysteinyl residue exists as a thiolate ion. This results from the unique structure and conserved residues of the PTP fold at the active site of this family of enzymes, which lowers the pKa of this specific cysteinyl residue. The nucleophilic nature of this thiolate ion makes it reactive towards phospho-amino acid residues and reactive oxygen species (ROS). Following cell exposure to a ROS-promoting stimulus such as epidermal growth factor (EGF) in the first step, specific PTPs become inactivated by reversible oxidation. In the second step of the assay, cellular lysis is performed with a degassed buffer in a hypoxic glove-box equilibrated with argon gas. This lysis in an anaerobic environment in absence of reducing agents minimizes post-lysis oxidation and maintains the reduced or oxidized state of PTPs. The third step consists of the enrichment of a PTP of interest by immunoprecipitation using degassed buffers that maintain the samples in a non-oxidizing environment. The final step entails an immune-complex activity assay of the purified PTPs using a synthetic chromogenic substrate, para-nitrophenylphosphate (pNPP). Conveniently, the dephosphorylated product of pNPP, para-nytrophenol (pNP), is a yellow compound that can be quantified using a spectrophotometer. As a positive control, one set of immunoprecipitated samples are reduced with TCEP to reactivate reversibly oxidized PTPs in order to measure the total PTP activity of the immune-complex. By comparing the endogenous activity of PTPs with control experimental conditions that activate all PTPs, this approach allows one to assess the reactivation of specific PTPs that become reversibly oxidized in cells exposed to growth factors.
Basic Protocol 1: Cell Transfection (optional)
Support Protocol 1: Preparation of Degassed Lysis Buffers
Basic Protocol 2: Cellular Extraction in Anaerobic Conditions
Basic Protocol 3: Enrichment and Activity Assay of Specific PTPs
Alternate Protocol 3: Measurement of Active PTPs via Direct Cysteinyl Labeling
BASIC PROTOCOL 1
Cell Transfection (optional)
A common tool for analyzing the function of a protein is to overexpress tagged exogenous proteins in mammalian cells by transfecting a small plasmid that contains extra-chromosomal DNA. The introduction of proteins that contain an affinity tag facilitates their purification from lysates using an affinity technique. Although applicable to all members of the PTP superfamily, we have used PTP1B as an example in this method. We have transfected Human Embryonic Kidney (HEK) 293T cells with the pCMV-2B-FLAG-PTP1B plasmid that encodes for FLAG-PTP1B (Figure 2) and used this model to establish protocols to purify and measure PTP1B activity following its inactivation by cellular oxidants (Basic Protocols 2, 3 and Alternate Protocol 3). HEK293T cells are a convenient mammalian cell system that transfects with high efficiency. Transfection of HEK293T cells with the pCMV-2B-FLAG-PTP1B plasmid leads to the expression of full-length PTP1B protein (435 amino acids + 8 amino acids FLAG-tag), and validation of transfection efficiency is routinely performed through an anti-FLAG Western blot. Basic Protocol 1 facilitates the assessment of PTP activity from cell extracts, however, Basic Protocols 2 and 3 describe assays that possess the sensitivity to measure the activity of endogenous PTPs.
Figure 2. Plasmid used in these protocols for expression of FLAG-tag PTP1B.
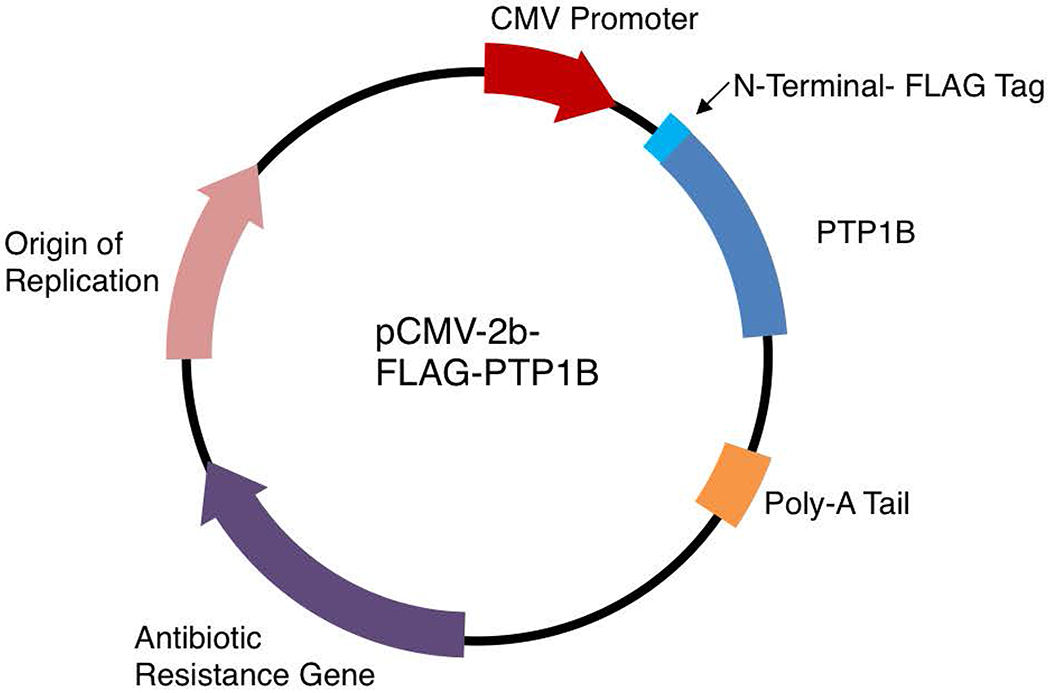
pCMV-2B is a mammalian expression vector for tagging proteins with an N-terminal FLAG epitope. A CMV promoter allows for elevated protein expression in HEK293T cells. The pCMV-2B-FLAG-PTP1B vector was a generous gift from Dr. Tonks (Cold Spring Harbor Laboratory).
Materials
Clear 1.5 mL microcentrifuge tubes
HEK293T cells (ATCC)
4X Laemmli Buffer (see recipe)
5% Nonfat Milk Blocking Solution (see recipe)
Electrophoresis Running Buffer (see recipe)
Growth Medium (see recipe)
Lysis Buffer 1 (see recipe)
Primary Antibody Dilution Buffer (see recipe)
SDS-PAGE Resolving Gel (see recipe)
SDS-PAGE Stacking Gel (see recipe)
Transfer Buffer (see recipe)
TBST (see recipe)
Trypsin-EDTA solution
OptiMEM
pCMV-2B-PTP1B-FLAG Plasmid
Turbofect transfection reagent
Anti-FLAG-HRP
Enhanced chemiluminescence reagents
0.2 μm Nitrocellulose membrane
Biosafety culture cabinet
Cell culture dishes 10 cm
Cell scrapers
Centrifuge
Electrophoresis and transfer apparatus
Clinical rotator
Spectrophotometer
Cell culture incubator
Microscope
pH Meter
Water bath
Gel imager
Care and passage of HEK293T cells
Low passage, healthy cells are grown in a 10-cm cell culture dish containing low glucose EMEM supplemented with 10 % serum and 1% of a penicillin/streptomycin solution.
Aspirate the growth medium from the cell culture dish with confluent HEK293T cells and add 2.0 mL of 1X trypsin solution (0.05% trypsin:0.53 mM EDTA) solution. Incubate in a 5% CO2 humidified incubator at 37 °C until cells start to lift from surface. HEK293T cells typically lift after a 5-minute incubation with trypsin.
Note: Cells are thawed and plated one day prior to trypsinization. Confluency should be at 90-95% when passaging cells. Early passage cells (less than 10 passages) are typically used when working on assays that measure PTP oxidation.
3. Once cells are completely dissociated from the plate, add 8 ml of growth medium to inactivate the trypsin and pipet to break up cell clumps. Transfer the cells in a sterile 15 mL conical tube and spin down the cells at 200 x g in a centrifuge for 5 minutes at room temperature.
4. Aspirate the supernatant, add 5 mL of growth medium to the tube and gently resuspend the cells. Plate 1.0 mL of the cell suspension per 10-cm cell culture dish in a total of 10 mL of growth medium (1:5 dilution). Incubate in a 5% CO2 humidified incubator at 37 °C for 24 hours.
Note: Cell confluency should be 50% to 60% on the day of transfection (Figure 3A). If cell confluency is insufficient, continue to incubate the cells in a 5% CO2 humidified incubator at 37 °C.
Figure 3.
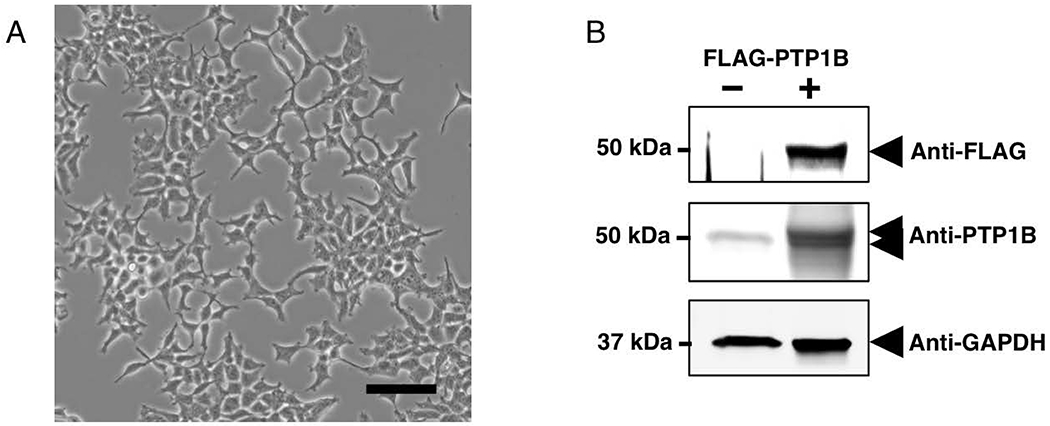
A) Phase-contrast image of HEK293T cells. Subconfluent (~50%) HEK293T cells 24 hours following trypsinization and passage (1:5). Bar: 100 μm B) Detection of FLAG-PTP1B expression in HEK293T cells. 50% confluent HEK293T cells in Growth Medium were transfected with 4 μg of pCMV-2B-FLAG-PTP1B and incubated for ~ 48 hours in a cell incubator. Cells were then lysed with lysis buffer 1, and 10 μg lysate was separated by SDS-PAGE and electrophoretically transferred onto nitrocellulose membranes. Membranes were blotted using FLAG-HRP, PTP1B (FG6) or GAPDH antibodies and the proteins were detected with HRP-conjugated secondary antibodies and visualized by ECL. Overexpression of FLAG-PTP1B was observed following transfection of HEK293T cells. The overexpressed protein was visible as a sharp immunoreactive band above the endogenous PTP1B protein at 50 kDa. GAPDH immunodetection is indicative of equal loading.
Transfection and lysis of HEK293T cells
5. Prior to transfection, warm up Opti-MEM at 37 °C in a water bath for 15–20 minutes. In a sterile 1.5 mL centrifuge tube add 4 μg of pCMV-2B-FLAG-PTP1B plasmid DNA and 6 μl Turbofect reagent to Opti-MEM to obtain a final volume 500 μL. Mix well by tapping gently and incubate at room temperature for 25 minutes. Add transfection mix in a dropwise fashion over the cells. Incubate the cells in a 5% CO2 humidified incubator at 37 °C for approximately 48 hours.
Note: The amount of DNA to transfect should be standardized based on the expression efficiency of individual plasmids and cell type. HEK293T are an easy cell model to transfect, and based on our experience, 4 μg of plasmid DNA leads to a 6-fold expression of FLAG-PTP1B when compared to endogenous levels of PTP1B. Since HEK293T cells are semi-adherent to the surface of the cell-culture dish, extra care is required when adding the transfection mix to prevent cells from lifting.
6. Cell lysis is performed ~ 48 hours after transfection, when cell density has reached 90% to 95%. To lyse the cells and to assess PTP1B overexpression, first discard EMEM from the dish. Remove the remaining growth medium using a pipette, add 800 μL of ice-cold Lysis Buffer 1 to the 10-cm culture dish. Place the cell-culture dish on ice. Scrape and transfer the cells into a cold 1.5 mL centrifuge tube. Transfer the cells to a clinical rotator for an hour at 4 °C.
7. Centrifuge the cell lysate at 14,000 x g for 10 minutes at 4 °C in a refrigerated table- top microcentrifuge and determine the protein concentration of the supernatant by the method of Bradford (Bradford, 1976).
8. Solubilize 10 μg of sample with Laemmli sample buffer and resolve, along with prestained molecular mass markers, on 10% (w/v) acrylamide SDS-PAGE gels. Electrophoretically transfer proteins from the gel onto nitrocellulose membranes for 90 minutes at 100 V, at 4 °C.
9. Block the nitrocellulose membranes for 1 hour in TBST containing 5% (w/v) nonfat milk powder.
10. Incubate overnight at 4 °C with peroxidase-conjugated anti-FLAG-antibodies (1:1000) diluted in 5 mL TBST containing 5% milk. Wash membranes 3 times 10 minutes with TBST, and visualize immunoreactive bands by enhanced chemiluminescence (ECL) using an imager or films. Expression of FLAG-PTP1B should be approximately 6 times the expression of endogenous PTP1B (Figure 3B).
Note: Transfection of PTPs in cells is optional as the activity of endogenous PTPs can be measured with our protocol, provided that a specific antibody is available for the targeted PTP. When measuring endogenous activity of PTPs, proceed using cells that have reached 90-95% confluency and serum starve the cells overnight in a 5% CO2 humidified incubator at 37 °C.
SUPPORT PROTOCOL 1
Preparation of Degassed Lysis Buffers
The reactivity of the catalytic cysteine residue of PTPs towards cellular oxidants also means that it may spontaneously oxidize following exposition to air oxygen dissolved in the lysis buffer or by air oxygen itself. Since laboratory grade distilled and deionized water contains approximately 8.24 mg/L dissolved oxygen, (or parts per million, ppm)(Näykki T, 2013), it is absolutely necessary to degas the distilled water prior to use for cell lysis to remove dissolved oxygen and prevent post-lysis oxidation of PTPs.
Materials
Argon Gas
Glass beads, 3 mm (Cat. no. 11-312A, Fisher Scientific)
Lysis Buffer 2 (see recipe)
Lysis Buffer 3 (see recipe)
Aprotinin Stock (see recipe)
Leupeptin Stock (see recipe)
Catalase Stock (see recipe)
Superoxide Dismutase Stock (see recipe)
Iodoacetyl Polyethylene Glycol (IAP)-Biotin Stock (see recipe)
Microcystin Stock (See recipe)
Okadaic acid Stock (See recipe)
Hypoxic glove-box
Büchner flask (25 mL, 100 mL)
Vacuum pump (VLP200-115, ThermoFisher Scientific)
Tripod with clamp
pH Meter
Hot plate
1. Set up a tripod and clamp to hold an Erlenmeyer on the hot plate. Add 300 mL ddH2O into a 500 mL Erlenmeyer flask. Add enough glass beads to cover the bottom surface of the flask and heat at 180 °C for 1 hour on a hot plate.
Note: Make sure to fix the flask with a clamp. Boiling water on a hot plate tends to move the flask and may cause the flask to spill.
2. While the water is boiling, start to prepare the next step. Fix a 3-way valve to the side arm of a 150 mL Büchner flask using 3 cm of rubber tubing. Add a 2 cm magnetic stirrer to the flask.
3. To prepare Lysis Buffer 2, add HEPES (25 mM), sodium chloride (150 mM) and EDTA (1 mM) into the 150 mL Büchner flask.
Note: i) All the ingredients are calculated for a final volume of 100 mL. ii) Lysis buffer preparation for basic protocol 2 and 3 is similar except for buffer composition and pH. (see recipe for lysis buffer).
4. Once the ddH2O boiled for 1-1.5 hours, take it off the hot plate and let it cool for 5 minutes (down to approximately 60-70 °C). Carefully aspirate 90 mL of boiled ddH2O using a 50 mL pipette into the Büchner flask. Hermetically close the flask using a rubber stopper (size 5) and turn the 3-way valve to allow linear airflow. Connect the Büchner flask to a mild vacuum and degas at 4 °C overnight with slow stirring.
Note: Boiling and degasing is a time-sensitive step. Do not let boiled water sit for more than 8–10 minutes. The idea is to prevent oxygen from air to enter the partially degassed/boiled water. However, degassing hot ddH2O (right off the boiler) will lead to water spilling out of the Büchner flask.
5. On the morning of the experiment, prepare the hypoxic glove-box (Figure 4) with all the necessary items (cell scraper, 1.5 mL microcentrifuge tubes, two beakers for solid and liquid waste, pipettes, marker, a 15-mL conical tube) and allow the glove-box to equilibrate with ultrapure argon. Nitrogen can also be used. This will take approximately 1 to 1.5 hours. While the glove-box is equilibrating, prepare the lysis buffer.
6. Close the 3-way valve and remove the Büchner flask from 4 °C. Carefully open the 3-way valve and remove the rubber stopper sequentially. Slowly decant the incomplete buffer into a 150 mL beaker, add 10 mL of 10% non-oxidized surfact-amps NP-40 solution (using non-oxidized NP-40 minimizes post-lysis oxidation). Rapidly adjust the pH to 7.4 using 0.2 N NaOH.
Figure 4.
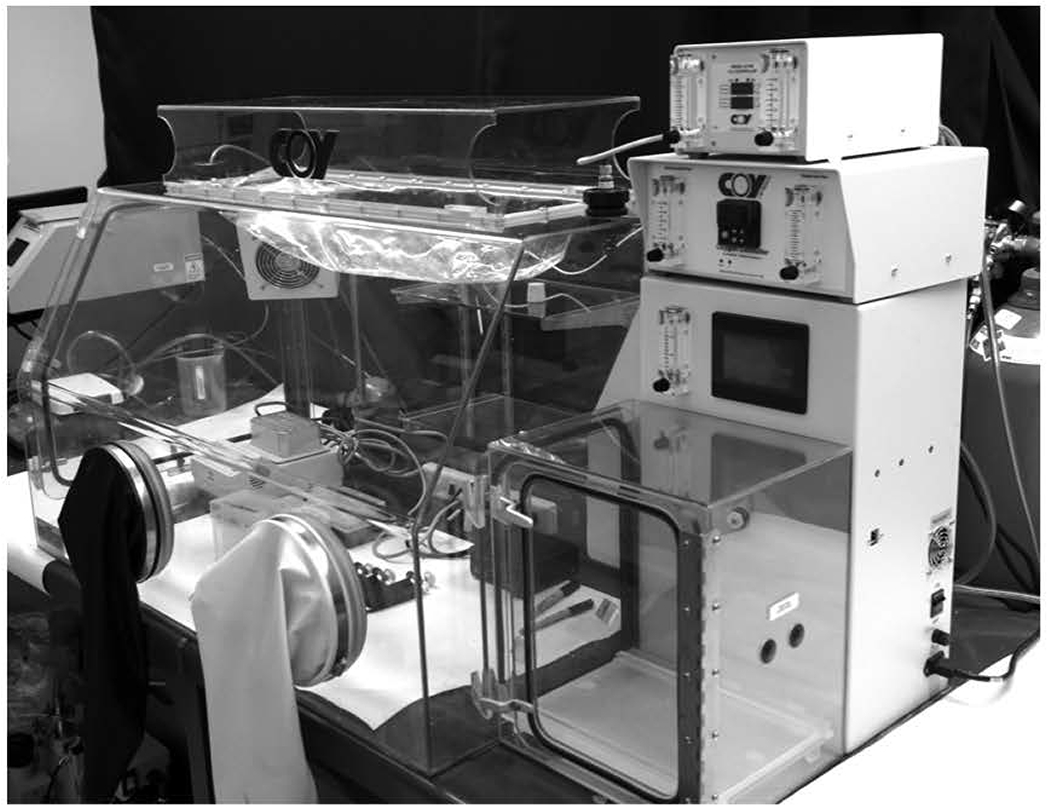
The hypoxic glove-box used to generate cell lysate in an anaerobic environment.
Note: Before opening the 3-way valve on the flask, calibrate the pH meter, and prepare 0.2 N NaOH solution to adjust the pH. Adjust the pH rapidly to minimize re-oxygenation of the buffer.
7. Gently pour the equilibrated buffer back into the 150 mL Büchner flask. Set the 3-way valve to obtain a linear flow and degas for 1 hour at 35-40 mm Hg at room temperature on a magnetic stirrer. Once degasing is over, close the 3-way valve and transfer the flask to the hypoxic glove-box, on ice.
Note: i) After the second degassing step, dissolved oxygen levels in the lysis buffer is approximately 0.35 to 0.45 ppm which significantly reduces post-lysis oxidation of proteins. ii) Using a different vacuum pump from the one suggested herein (see material) could result in decreased degassing efficiency.
BASIC PROTOCOL 2
Cellular extraction in anaerobic conditions
Accurately measuring the endogenous activity of PTPs requires supplementary precautions while performing cell lysis. We have found that performing cell lysis in a hypoxic glove-box equilibrated with ultrapure argon gas minimizes post-lysis oxidation of the highly reactive catalytic cysteine residues of PTPs.
Materials
Amber 1.5 mL microcentrifuge tubes
Clear 1.5 mL microcentrifuge tubes
15 mL conical tube
Argon gas
EGF stock (see recipe)
Lysis buffer 2 (see recipe)
Hypoxic glove-box
Cell scrapers
Centrifuge
Clinical rotator
96-well flat bottom plate
Spectrophotometer
1. Once air from the glove-box station has been replaced by argon, open the 3-way valve on the Büchner flask and remove the stopper in this sequence.
Note: Oxygen is present in the flask and removing the stopper first may re- introduce oxygen in the degassed buffer.
2. Carefully transfer 10 mL of Lysis Buffer 2 in a 15 mL conical tube and complete the buffer with aprotinin (10 μg/mL), leupeptin (10 μg/mL), okadaic acid (100 nM) and microcystin (1 μg/mL). Close the tube and gently mix the lysis buffer by inverting the tube 3 times. Replace the conical tube on ice.
3. Bring in one cell culture dish at a time through the airlock.
Note: In the case that cells need to be stimulated, this should be performed in normoxic conditions, before transferring the dish into the glove-box.
4. Pour out the growth medium and carefully remove the rest using a pipette.
5. Place the culture dish on crushed ice and add 600 μL (for a 10-cm culture dish) of cold Lysis Buffer 2.
6. Promptly collect the cells using a cell scraper and transfer the cell lysate in a 1.5 mL centrifuge tube. Keep the tubes on ice until all the cells are lysed.
Note: Gently mix cell lysates every few minutes to keep them in suspension and place on ice.
7. Place the centrifuge tubes on a clinical rotator at 4 °C for 20 minutes.
8. Centrifuge the cell lysates at 14,000 x g for 10 minutes at 4 °C in a refrigerated table-top microcentrifuge.
9. Transfer the supernatant in a new 1.5 mL centrifuge tube in the hypoxic glove-box.
Note: Aliquot 50 μL of the supernatant in a separate 1.5 mL centrifuge tube to determine protein concentration. Determination of the protein concentration is performed outside of the hypoxic box and may lead to oxidation of samples.
10. Determine the protein concentration of the supernatant by the method of Bradford (Bradford, 1976).
Note: When using HEK293T cells, we typically obtain protein concentrations in the range of 8 to 10 μg/mL.
BASIC PROTOCOL 3
Enrichment and Activity Assay of Specific PTPs
While PTPs catalyze the removal of phosphoryl groups from a wide range of substrates, including phospho-tyrosine, -serine and -threonine residues, inositol phospholipids and mRNAs in vivo (Deshpande, Takagi, Hao, & Charbonneau, 1999; Tonks, 2006), para-nitrophenylphosphate (pNPP) is a synthetic chromogenic substrate that can be used in vitro to measure the relative activity of PTPs by conventional spectrophotometric assay (Lorenz, 2011). This assay relies on the ability of PTPs to remove the phosphoryl group of pNPP, thus liberating inorganic phosphate and para-nitrophenol (pNP). The conjugate base of pNPP, pNP is a yellow phenolate compound that possess a maximal absorption at 405 nm which can be measured using a spectrophotometer (Figure 5A). As a positive control, one set of immunoprecipitated samples should be exposed to TCEP, which serves to reactivate reversibly oxidized PTPs and to measure total catalytic activity of the PTP immune-complex.
Figure 5. Quantitative analysis of the endogenous activity of PTP1B from immune-complexes.
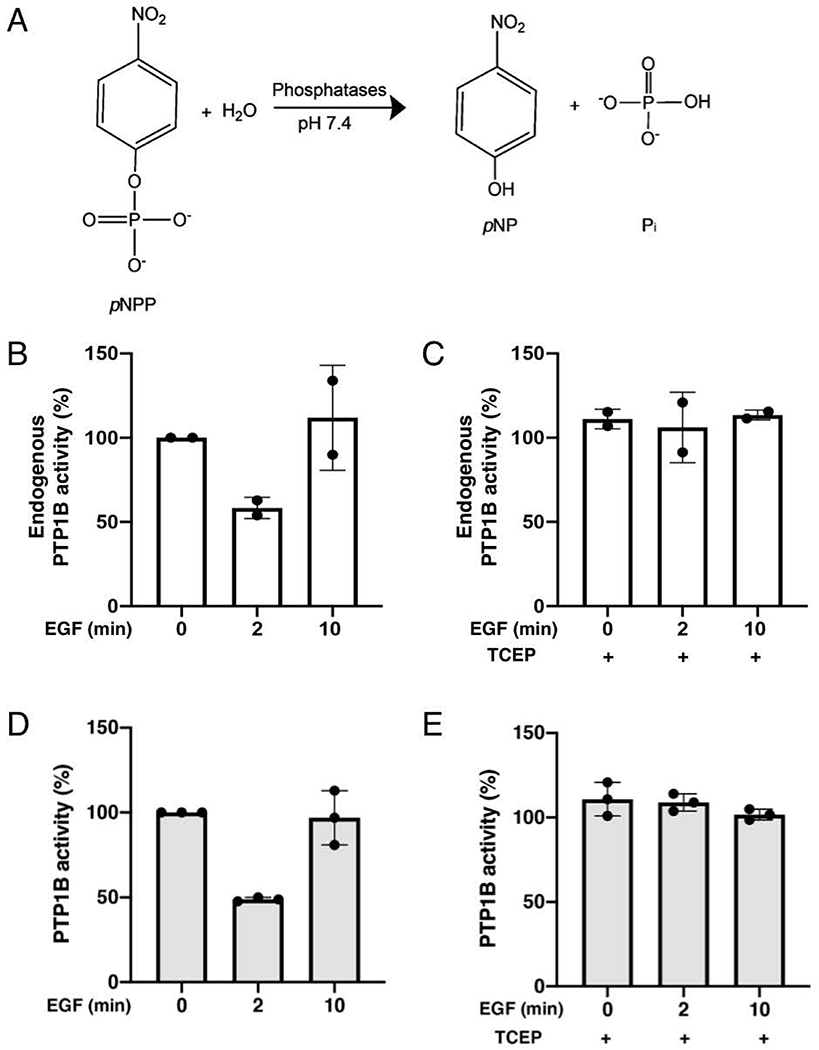
A) Dephosphorylation of para-nitrophenylphosphate (pNPP) into para-nitrophenol (A405) and inorganic phosphate. B) PTP1B inactivation was studied using the endogenous PTP-activity assay. Serum-deprived HEK293T cells stimulated with EGF (100 ng/ml) for the indicated times were lysed using degassed Lysis Buffer 2 in anaerobic conditions. Endogenous PTP1B was immunoprecipitated from lysates using 3 μg FG6 anti-PTP1B antibody coupled to Protein A/G beads. Endogenous activity of PTP1B was measured in absence of reducing agents, using pNPP as substrate. The depshophorylated product, pNP, was measured after 40 minutes at A405 using a spectrophotometer. C) In a duplicate experiment, endogenous PTP1B was immunoprecipitated from lysates from A and subjected to a pNPP activity assay in the presence of 5 mM TCEP to measure total PTP1B activity in these samples. The average readout value of technical replicates is represented by the dot-plot bar graph. Each experiment was performed two independent times. D) Serum-deprived HEK293T cells stimulated with EGF (100 ng/ml) for the indicated times were lysed using degassed Lysis Buffer 2 in anaerobic conditions. FLAG-PTP1B were purified from lysates using anti-FLAG magnetic beads. Endogenous activity of PTP1B was measured in absence of reducing agents, using pNPP as substrate. The depshophorylated product, pNP, was measured after 20 minutes at A405 using a spectrophotometer. E) In a duplicate experiment, FLAG-PTP1B was purified from lysates from A and subjected to a pNPP activity assay in the presence of 5 mM TCEP to measure total PTP1B activity in these samples. The average readout value of technical replicates is represented by the dot-plot bar graph. Each experiment was performed three independent times.
Materials
Amber 1.5 mL microcentrifuge tubes
Clear 1.5 mL microcentrifuge tubes
Argon gas
Anti-FLAG magnetic beads
TCEP (tris(2-carboxyethyl)phosphine)
EGF stock (see recipe)
Lysis buffer 2 (see recipe)
pNPP buffer (see recipe)
Hypoxic glove-box (COY Laboratory products Inc.)
Büchner flask (100 mL)
Vacuum pump
Cell scrapers
Centrifuge
Sample rotator
Clinical rotator
96-well flat bottom plate
Spectrophotometer
Magnetic stand
1. In the anaerobic glove-box station equilibrated with 100% argon, prepare your samples from Basic Protocol 2 for immunoprecipitation. All steps are performed on ice. Add 20 μL of anti-FLAG magnetic beads slurry to clear 1.5 mL tubes containing 600 μL of ice-cold degassed lysis buffer with inhibitors and 500 μg of cell lysate. Prepare in duplicate as one set will be used to measure endogenous activity of your specific PTP and one set will be used to measure total activity of your reduced, reactivated PTP of interest.
Note: When targeting endogenous PTPs, pre-couple 3–4 μg of PTP-specific antibody to 20 μL of a Protein A/G Plus agarose/PBS slurry on a clinical rotator for 1 hour at 4 ℃. Wash the beads three times with ice-cold lysis buffer and add 1 mg lysate. The amount of lysate may need to be optimized for each PTP and cell line.
2. Incubate on a clinical rotator at 4 °C for 2 hours.
Note: Duration of the immunoprecipitation will vary based on the affinity of your antibody for its antigen.
3. Prepare the degassed pNPP buffer in a 15 mL conical tube and cover with aluminum foil to protect pNPP from light. Keep the buffer at room temperature.
Note: pNPP is sensitive to light and extra precaution should be used during storage and during the assay to protect the substrate from light.
4. Separate the immune-complex from the lysate using a magnetic separation rack for 1 minute, on ice. Remove the lysate and wash the beads with 1 mL degassed lysis buffer. Separate the beads on the rack again and repeat the washing step using degassed pNPP buffer without pNPP. Remove buffer and turn off the lights to protect pNPP.
3. Add 500 μL of degassed pNPP buffer (at room temperature) in each tube. Add TCEP (final concentration, 5 mM) in one set of tubes to reduce PTPs from the immune-complex.
4. Resuspend the beads by tapping the tubes gently and transfer to a rotating mixer for 1 hour at room temperature.
5. Every 20 minutes, place tubes on magnetic rack and transfer 80 μL of the supernatant in a clear flat bottom 96-well plate and add 20 μL 2N NaOH to stop the reaction. Immediately replace the tubes on the rotating mixer for the next reading in 20 minutes. Measure absorbance of pNPP at 405 nm using a spectrophotometer. Display your results using pNPP values at t=0 as 100% activity (Figure 5 B–E).
Note: Use 80 μL of pNPP buffer and 20 μL of NaOH as your control sample. Measuring endogenous activity of PTPs will need to be optimized based on the level of expression of your PTP of interest. Values displayed in Figure 4 B, C for endogenous PTP1B were obtained after allowing dephosphorylation to occur for 40 minutes.
ALTERNATE PROTOCOL 3
Measurement of Active PTPs via Direct Cysteinyl Labeling
The invariant catalytic cysteinyl residue of PTPs possesses a low pKa value (4.5–5.5 (Tonks, 2006)). This makes its thiolate side-chain very reactive towards phosphorylated substrates at physiological pH as well as towards reactive oxygen species (ROS) and alkyl halides such as iodoacetic acid (Boivin & Tonks, 2010). We have previously developed a cysteinyl labeling assay to purify, enrich and identify reversibly oxidized PTPs from lysates (Boivin & Tonks, 2010; Boivin et al., 2008). Unlike the original 3-step cysteinyl labeling assay, which is designed to biotinylate reversibly oxidized PTPs at pH 5.5, the direct cysteinyl labeling assay is a 2-step assay optimized to tag active PTPs in cell lysates (Figure 6A, B)(Londhe et al., 2020). This direct cysteinyl labeling approach also relies on the reactivity of the active site cysteinyl side chain of PTPs towards a biotinylated iodoacetyl-polyethylene glycol (IAP) probe at pH 5.5. Once this labeling step is completed, the biotinylated proteins are enriched by streptavidin pulldown, separated by SDS-PAGE and visualized by immunoblot using PTP-specific antibodies. As a positive control, lysates from all samples are also immunoblotted using PTP-specific antibodies to determine the total (oxidized and reduced) level of the PTP.
Figure 6. Direct Cysteinyl Labeling of active PTP1B in HEK293T cell lysates.
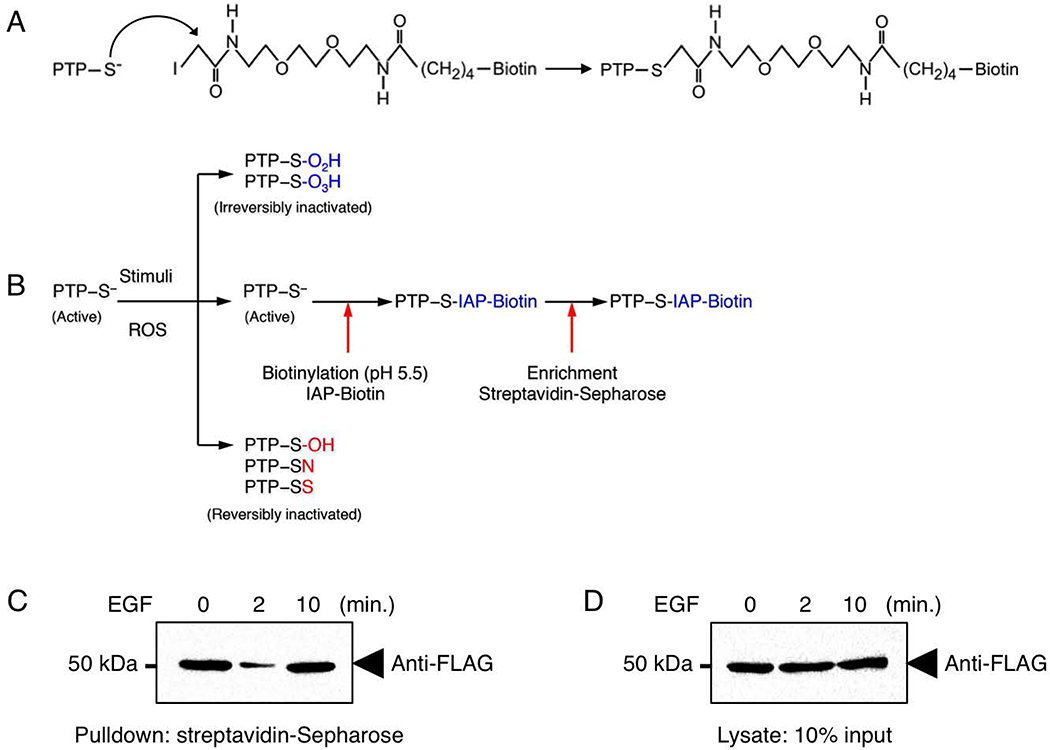
A) Mechanism of PTP labeling by the IAP probe. B) Schematic outline of the direct cysteinyl labeling assay. In resting cells, active PTPs are reduced and their invariable catalytic cysteinyl residue exists as a thiolate ion. The nucleophilic nature of this thiolate ion makes it reactive towards phospho-amino acid residues, reactive oxygen species (ROS) or certain sulhydryl-reactive compounds. Following cell exposure to a ROS-promoting stimulus in the first step, specific PTPs become inactivated by reversible oxidation. Following a ROS-promoting stimulus, specific PTPs are inactivated by oxidation. Reversible oxidation [sulfenic acids (SOH), cyclic sulfenamides (SN) and intramolecular disulfides (SS)] are depicted in red, whereas irreversible oxidation [sulfenic acid (SO2H) and sulfinic acid (SO3H)] are depicted in blue. In the second step of the direct cysteinyl labeling assay, cellular lysis is performed with a degassed buffer at pH 5.5 containing a biotinylated sulfhydryl-reactive probe [iodoacetyl-polyethylene oxide (IAP)]. This step of the assay is performed in a hypoxic glove-box equilibrated with argon gas. This lysis in an anaerobic environment in absence of reducing agents minimizes post-lysis oxidation and maintains the endogenous redox state of PTPs. PTPs that remained in their active state following cell stimulation react and become biotinylated by IAP, whereas oxidized PTPs are protected from this biotinylation step. In the last step of the assay, biotinylated PTPs are purified by streptavidin pulldown and visualized by immunoblot. As a positive control, lysates are used to measure the total level of PTPs. By comparing the decreased biotinylation of PTPs with the total level of PTPs present in the lysate, this approach allows one to assess the reactivation of specific PTPs that become reversibly oxidized in cells exposed to growth factors. C) PTP1B inactivation was studied using a direct cysteinyl labeling approach. Serum-deprived HEK293T cells stimulated with EGF (100 ng/ml) for the indicated times were lysed at pH 5.5 in the presence of IAP-biotin. Biotin-labeled proteins were purified from lysates using streptavidin-Sepharose beads. Proteins were separated by SDS-PAGE, transferred onto nitrocellulose membranes and probed for FLAG-PTP1B. D) Lysates from C were probed for FLAG-PTP1B to control for protein expression.
Materials
Amber 1.5 mL microcentrifuge tubes
Clear 1.5 mL microcentrifuge tubes
Argon gas
EGF
Anti-FLAG magnetic beads
TCEP
EGF stock (see recipe)
Lysis buffer 3 (see recipe)
4X Laemmli buffer (see recipe)
5% Nonfat milk blocking solution (see recipe)
Electrophoresis running buffer (see recipe)
Primary antibody dilution buffer (see recipe)
SDS-PAGE resolving gel (see recipe)
SDS-PAGE stacking gel (see recipe)
Transfer buffer (see recipe)
TBST (see recipe)
Streptavidin-sepharose
Anti-FLAG-HRP
Enhanced chemiluminescence reagents
0.2 μm Nitrocellulose membrane
Hypoxic glove-box
Vacuum pump
Cell scrapers
Centrifuge
Electrophoresis and transfer apparatus
Shaker
Clinical rotator
Spectrophotometer
Magnetic stand
Gel Imager
Biotinylation of Non-Oxidized Cysteinyl Residues
1. Prepare Lysis Buffer 3 (LB3) based on the instructions provided in Support Protocol 1 for the preparation of Lysis Buffer 2. Briefly, boil ddH2O, transfer 80 mL of boiled water into an erlenmeyer flask, add sodium acetate (25 mM), sodium chloride (150 mM) and 10% glycerol (v/v). Degas at 4 ℃ overnight. On the next day, add 10 mL of 10% non-oxidized surfact-amps NP-40 and adjust the pH to 5.5. Degas the buffer at room temperature for 1 hour. In the argon-equilibrated hypoxic glove-box, transfer 10 mL of degassed LB3 in 15 mL foil-covered conical tube. Complete LB3 by adding freshly prepared IAP (10 mM), catalase (125 U/mL), SOD (125 U/mL), leupeptin (5 μg/mL) and aprotinin (5 μg/mL) immediately before use.
2. Proceed to cell lysis as described in Basic Protocol 2. Briefly, remove the starvation medium, place the cell-culture dish on ice and add 600 μL of ice-cold degassed LB3. Scrape and transfer the cells into a cold 1.5 mL amber-colored centrifuge tube.
3. Incubate on a shaker for an hour at room temperature to label active PTPs with IAP.
Note: Utilizing a mildly acidic lysis buffer (pH 5.5) and non-denaturing conditions allows the thiolate ion of the catalytic cysteinyl residue of PTPs to react with the biotinylated sulphydryl-reactive probe and to minimize non-specific labeling of other cysteinyl residues typically characterized by a pKa value closer to 8.5.
4. Centrifuge the biotinylated protein extract at 14,000 x g for 10 min at 4 °C.
5. Transfer the supernatant in a new 1.5 mL centrifuge tube in the hypoxic glove-box
Note: Aliquot 50 μL of the supernatant in a separate 1.5 mL centrifuge tube to determine protein concentration. Determination of the protein concentration is performed outside of the hypoxic box and may lead to oxidation of samples.
6. Determine the protein concentration by the method of Bradford (Bradford, 1976).
Enrichment and Detection of Specific Biotinylated PTPs
7. Transfer 500 μg of the biotinylated protein extract to clear 1.5 mL centrifuge tubes. Complete to 500 μL using degassed LB3 containing inhibitors, but without IAP.
8. Add 25 μL of a streptavidin-Sepharose slurry to the aliquoted extracts and incubate for 3 hours at 4 °C on a clinical rotator.
9. Spin down labeled PTPs in a refrigerated centrifuge at 3000 x g for 3 minutes and wash the beads three times using degassed LB3.
10. Resuspend the beads (~ 40 μL) in 20 μL 4X Laemmli sample buffer and heat at 95 °C for 90 seconds.
11. Centrifuge the beads in sample buffer at 10,000 x g for one minute at room temperature.
Note: 50 μg (1/10 of the 500μg of lysate used in the Streptavidin pulldown) from your biotinylated protein extract is typically used to obtain the total amount of PTP.
12. Separate your samples on a 10% (w/v) polyacrylamide SDS-PAGE and transfer electrophoretically onto nitrocellulose membranes at 100 V and 4 °C for 90 minutes.
Note: Since the volume will vary between your different samples, load all of the sample onto your gel for electrophoresis. Typically, a Hamilton syringe is used to transfer the supernatant. The size of the beads will prevent them from entering the syringe.
13. Block the membrane in TBST containing 5% nonfat milk for 30 minutes at room temperature.
14. Incubate the membrane overnight at 4 °C with PTP-specific antisera or with anti-Biotin-HRP diluted in antibody dilution buffer.
15. Wash the membranes with TBST, 10 minutes. Repeat for a total of 3 times.
16. Incubate your membrane with the appropriate peroxidase-conjugated secondary antibody (diluted 1:10,000 in TBST containing 5% (w/v) nonfat milk) for 2 hours.
17. Wash the membranes extensively with TBST.
18. Visualize the immunoreactive bands using enhanced chemiluminescence solutions according to the manufacturer’s protocol (Figure 6 C, D).
REAGENTS AND SOLUTIONS:
Use deionized, distilled water (ddH2O) to prepare all reagents and solutions.
Recipe 1: Antibody Dilution Buffer (Vf, 100 mL)
1 g Bovine serum albumin powder (Fraction V), 1% (w/v)
100 mL 1X TBST
Dissolve bovine serum albumin powder into 100 mL of 1X TBST. Aliquot in 50 mL centrifuge tube and store at −20 for up to 1 year. Thaw aliquot before using and store at 4 ℃ for up to two weeks.
Recipe 2: Aprotinin Stock (Vf, 1 mL)
Aprotinin, 10 mg
ddH2O 1.0 mL
Dissolve 10 mg of aprotinin into 1 mL of ddH2O to make 10 mg/mL working stock concentration. Prepare 50 μL aliquots in 1.5 mL clear microcentrifuge tubes and store at −20 for up to 1 year.
Recipe 3: Blocking Solution (Vf, 100 mL)
5 g Nonfat milk powder, 5% (w/v)
100 mL 1X TBST
Dissolve milk powder into 100 mL of 1X TBST. Prepare on the day of the experiment.
Recipe 4: Catalase stock (Vf, 400 μL)
Catalase, 100 KU
ddH2O, 400 μL
Dissolve 100 KU into 400 μL of ddH2O to make a 250 KU/mL working stock. Prepare 50 μL aliquots into 1.5 mL amber centrifuge tubes and store at −20 °C for up to 1 year.
Recipe 5: EGF Stock (Vf, 5 mL)
EGF, 5 mg
10 mM Acetic acid, 5 mL
Dissolve 5 mg of lyophilized EGF into 5 mL of 10 mM acetic acid to make a 1 mg/mL stock solution. Store EGF stock aliquots at −80 °C for up to 3 years.
Dilute the EGF stock solution to 100 μg/mL (1:10 dilution) as working stock using cold ddH2O. Aliquot and store at −80 °C for up to 6 months.
Recipe 6: Growth Medium (Vf, 500 mL)
EMEM, 445 mL
Heat-inactivated FBS, 50 mL
100 X Penicillin/Streptomycin Cocktail, 5 mL
Warm up 445 mL EMEM, 50 mL heat-inactivated Fetal Bovine Serum and 5 mL Penicillin/Streptomycin antibiotic cocktail in a water bath at 37 °C for 30 minutes. Wipe all bottles with 70% ethanol and transfer into a sterile tissue culture hood. Transfer FBS (final concentration of 10%) and antibiotics (final concentration of 1X) into the EMEM bottle and mix well. Store at 4 °C for up to 2 months. Warm up in a water bath at 37 °C before each use.
Recipe 7: Iodoacetyl polyethylene glycol (IAP)-Biotin stock (Vf, 3.86 mL)
IAP, 50 mg
ddH2O, 3.867 mL
Add 3.867 mL of ddH2O into a brown tube containing 50 mg of IAP powder to make a 25 mM stock solution. Protect from light and prepare immediately before use.
Recipe 8: Laemmli buffer (4X sample buffer) (Vf, 10 mL)
4.5 mL, 1 M Tris-HCl, pH 6.8
1 g SDS, 10% (w/v)
4.12 g Sucrose, 1.2 M
200 μL 0.2 M EGTA, 4 mM
0.003 g Bromophenol blue, 0.003% (w/v)
Mix Tris, SDS, sucrose and EGTA into a 20 mL beaker and allow to dissolve for a few hours. Complete to 10 mL using ddH2O. Once homogenized, add 0.003 g of bromophenol blue (the tip of a spatula), mix for a minute and prepare aliquots of 1 mL in 1.5 mL microcentrifuge tubes. Store at −20 °C for up to 2 years. Add 140 μL of β-mercaptoethanol before use. Store at room temperature for up to 1 year.
Recipe 9: Leupeptin Stock (Vf, 1 mL)
Leupeptin, 10 mg
ddH2O, 1.0 mL
Dissolve 10 mg of leupeptin in 1 mL of ice-cold ddH2O to make 10 mg/mL working stock concentration. Prepare 50 μL aliquots in 1.5 mL clear microcentrifuge tubes, on ice. Stocks can be stored at −20 °C for up to 1 year.
Recipe 10: Lysis Buffer 1 (Vf, 100 mL)
0.5958 g HEPES, 25 mM
0.8766 g Sodium Chloride, 150 mM
0.0292 g EDTA, 1 mM
1 mL NP-40, 1% (v/v)
Leupeptin, 10 μg/mL
Aprotinin, 10 μg/mL
Okadaic Acid, 100 nM
Microcystin, 1 μM
ddH2O, 90 mL
Dissolve HEPES into 90 mL of ddH2O. Mix and adjust pH to 7.4 using 0.2 N NaOH (~1 mL). Complete to 100 mL and prepare 10 mL aliquots in 15-mL conical tube and store at −20 °C for up to 2–3 years. Thaw and add inhibitors immediately before use. Carefully, transfer 10 mL buffer to 15 mL conical tube and complete the lysis buffer by adding aprotinin (10 μg/mL), leupeptin (10 μg/mL), okadaic acid (100 nM) and microcystin (1 μΜ) immediately before use.
Recipe 11: Lysis Buffer 2 (Vf, 100 mL)
0.5958 g HEPES, 25 mM
0.8766 g Sodium Chloride, 150 mM
0.0292 g EDTA, 1 mM
10 mL Surfact-Amps Nonidet P-40 (10%), 1% (v/v)
Leupeptin, 10 μg/mL
Aprotinin, 10 μg/mL
Okadaic Acid, 100 nM
Microcystin, 1 μM
ddH2O, 90 mL
Step 1: Measure and place HEPES, sodium chloride and EDTA into a 150 mL Büchner flask. Add 90 mL of boiled ddH2O (before adding, allow ddH2O to cool off for a few minutes to 60–70 °C). Degas overnight at 4 °C. Step 2: In the morning, gently transfer to a 200 mL beaker and add 10 mL Surfact-Amps Nonidet P-40 for a final detergent concentration of 1% (v/v). Rapidly adjust pH to 7.4 using 0.2 N NaOH (~1 mL), transfer back into the 150 mL Büchner flask and degas again for 1 hour at room temperature using the VLP200 vacuum pump. Carefully, transfer 10 mL buffer to 15-mL conical tube and complete the lysis buffer by adding aprotinin (10 μg/mL), leupeptin (10 μg/mL), okadaic acid (100 nM) and microcystin (1 μΜ), immediately before use.
Recipe 12: Lysis Buffer 3 (Vf, 100 mL)
0.205 g Sodium Acetate, 50 mM
0.8776 g Sodium Chloride, 150 mM
10 mL Glycerol, 10% (v/v)
10 mL Surfact-Amps Nonidet P-40 (1%)
Leupeptin, 10 μg/mL
Aprotinin, 10 μg/mL
Catalase, 125 U/mL
Superoxide dismutase, 125 U/mL
IAP, 10 mM
ddH2O, 80 mL
Step 1: Measure and place sodium acetate, sodium chloride and glycerol ingredients into a 150 mL Büchner flask. Add 80 mL boiled ddH2O (before adding, allow ddH2O to cool off for a few minutes to 60–70 °C), degas overnight at 4 °C. Step 2: In the morning, gently transfer to a 200 mL beaker and add 10 mL Surfact-Amps Nonidet P-40 for a final detergent concentration of 1% (v/v). Rapidly adjust pH to 5.5 using ~1 N hydrochloric acid (~1 mL), transfer back into the 150 mL Büchner flask and then degas for 1 hour at room temperature using the VLP200 vacuum pump. Carefully, transfer 10 mL buffer to 15-mL conical tube and complete the lysis buffer by adding IAP (10 mM), catalase (125 U/mL), SOD (125 U/mL), leupeptin (5 μg/mL) and aprotinin (5 μg/mL) immediately before use.
Recipe 13: Microcystin Stock (Vf, 1 mL)
Microcystin, 1 mg
ddH2O, 1.0 mL
Dissolve 1 mg microcystin powder in 1 mL of ddH2O to make 1 mM stock concentration. Aliquot in small quantity in 1.5 mL microcentrifuge tubes and store at −20 for up to 2 years.
Recipe 14: Okadaic Acid Stock (Vf, 621 μL)
Okadaic acid, 50 μg
ddH2O, 621 μL
Dissolve 50 μg Okadaic Acid powder in 621 μL of ddH2O to make 100 μM stock concentration. Aliquot in small quantity 1.5 mL microcentrifuge tubes and store at −20 for up to 2 years.
Recipe 15: pNPP assay buffer
0.597 g HEPES, 20 mM (Vf, 100 mL)
0.2922 g Sodium Chloride, 100 mM (Vf, 100 mL)
0.025 g BSA, 0.05% (w/v) (Vf, 100 mL)
0.037 g pNPP, 10 mM (Vf, 10 mL)
ddH2O, 100 mL
Degas 200 mL ddH2O in 500 mL Büchner flask for 1 hour at room temperature. Measure and place HEPES, sodium chloride and BSA in a becher and add 90 mL of degassed ddH2O. Adjust pH at 7.4 using 0.2 N NaOH (~1 mL) and then fill to 100 mL with ddH2O. Store at room temperature for no more than 1 week.
Transfer 10 mL of incomplete assay buffer into a 15-ml conical tube covered in foil and add 0.037 g pNPP. Freshly prepare immediately before use.
Recipe 16: SDS-PAGE Resolving Gel (Vf 10 mL)
3.3 mL, 30% acrylamide (37.5:1 acrylamide:bisacrylamide) Solution
2.5 mL, 1.5 M Tris-Cl (pH 8.8)
0.1 mL, 10% SDS
0.1 mL, 10% Ammonium Persulfate
0.004 mL, TEMED
4.0 mL ddH2O
Add ddH2O, Tris, SDS and acrylamide into a 15 mL conical tube, mix well and add TEMED and ammonium persulfate. Mix and transfer 7 mL (for a Bio-Rad mini-gel set up) to cast a gel using 1.5 mm spacer plates. Add 1 mL ddH2O on top to allow polymerization.
Recipe 17: SDS-PAGE Running Buffer (10X) (Vf, 4 L)
121.1 g Tris-Base, 250 mM
576.54 g Glycine, 1.92 M
40 g SDS, 1% (w/v)
ddH2O, 3.5 L
Weigh and add all ingredients into a 5L beaker and add 3 L of ddH2O. Cover and allow to mix for several hours. Once all ingredients are dissolved, complete to 4 L and store at 4 for up to 1 year. Dilute to 1X before using by adding 100 mL of 10 X Running Buffer to 900 mL ddH2O. Use the 1X solution within 1 month.
Recipe 18: SDS-PAGE Stacking Gel (Vf 5 mL)
0.83 mL, 30% acrylamide (37.5:1 acrylamide:bisacrylamide) Solution
0.63 mL, 1 M Tris-Cl (pH 6.8)
0.05 mL, 10% SDS
0.05 mL, 10% Ammonium Persulfate
0.005 mL, TEMED
3.4 mL ddH2O
Add ddH2O, tris, SDS and acrylamide into a 15 mL conical tube, mix well and add TEMED and ammonium persulfate. Mix well and transfer 3 mL (for Bio-Rad mini-gel set up) over the polymerized resolving gel and rapidly place a 10-well 1.5 mm comb.
Recipe 19: Serum starvation medium (Vf, 500 mL)
EMEM, 495 mL
100 X Penicillin/ Streptomycin Cocktail, 5 mL
Warm up 495 mL EMEM and 5 mL 100 X Penicillin/Streptomycin antibiotic cocktail in a water bath at −37 °C for 30 minutes. Wipe all bottles with 70% ethanol and transfer into a sterile tissue culture hood. Transfer antibiotics (final concentration of 1X) into the EMEM bottle and mix well. Store at 4 °C for up to 2 months. Warm up in a water bath at 37 °C before each use.
Recipe 20: Superoxide dismutase stock (Vf, 200 μL)
SOD, 50 KU
ddH20, 200 μL
Dissolve 50 KU in 200 μL ddH2O to make 250 KU/mL stock concentration. Aliquot 15 μL in 1.5 mL amber colored microcentrifuge tubes and store at −20 °C for up to 1 year.
Recipe 21: Transfer Buffer (Vf, 4 L)
12.1 g Tris-Base, 25 mM
57.65 g Glycine, 192 mM
200 mL Methanol, 5% (v/v)
ddH2O, 3.8 L
Measure methanol, and weigh Tris and glycine. Add to a 5L beaker and add 3 L of ddH2O. Cover and allow to mix for 30 minutes. Once all ingredients are dissolved, complete to 4 L and store at 4 °C for up to 1 year. Transfer buffer should be used cold.
Recipe 22: Tris-Buffered Saline Tween (TBST) (20 X) (Vf, 4 L)
242.4 g Tris base, 500 mM
701.6 g NaCl, 3 M
40 mL Tween-20, 1% (v/v)
ddH2O, ~3.1 L
Weigh and add Tris, NaCl and Tween into a 5L beaker. Add 3 L of ddH2O, cover and allow to mix for several hours. Once all ingredients are dissolved, complete to 4 L and store at 4 °C for up to 1 year. Dilute to 1 X before using by adding 200 mL of 10 TBST to 3.8 L of ddH2O. 1X solution can be stored at room temperature for up to 1 month.
COMMENTARY
Background Information
In the mid 1990s, Toren Finkel’s landmark paper establishing that cellular oxidants were necessary for signal transduction by growth factors (Sundaresan, Yu, Ferrans, Irani, & Finkel, 1995) led the way to independent publications on the redox regulation of PTPs by the Rhee, Tanner and Tonks laboratories (Denu & Tanner, 1998; Lee et al., 1998; Meng et al., 2002). These papers, as well as publications by other groups thereafter, showed that PTPs were directly inactivated by cellular oxidants in order to facilitate protein phosphorylation and to control cell function (Holmström & Finkel, 2014; Ostman et al., 2011; Tonks, 2006).
Generally, PTPs are expected to oppose protein tyrosine kinases and act to suppress phosphorylation-dependent signaling: the dysregulation of tyrosine phosphorylation in disease states is typically a reflection of elevated tyrosine kinase activity as well as decreased PTP activity (Hunter, 2014; Tonks, 2013). Hence, both genetic disruption of PTP function and prolonged inactivation of specific PTPs by ROS are thought to contribute to increased tyrosine-dependent signaling and to be an underlying factor in several diseases, (Boivin et al., 2013; Hunter, 2014; Juarez et al., 2008; Julien, Dubé, Hardy, & Tremblay, 2011; Karisch et al., 2011; Tonks, 2013). While understanding how phosphatases become inactivated by reversible oxidation has been a critical step forward, this knowledge has unfortunately not yet translated into approaches to activate PTPs.
The methods described herein were specifically developed to measure the dynamic reactivation of reversibly oxidized PTP1B in cells that were stimulated with EGF (Londhe et al., 2020). Our approach, which relies on conditions that minimize artefactual oxidation of PTPs and on the absence of any reducing agent, is similar in some ways to the cysteinyl labeling assay for identifying reversibly oxidized PTPs in cells (Boivin et al., 2010; Boivin et al., 2008). The cysteinyl labeling assay is specifically designed to label, purify and identify reversibly oxidized PTPs, however the dynamic range of the assay makes the quantification of PTP reactivation difficult to evaluate by immunoblot. By combining the cysteinyl labeling assay, to identify those PTPs that are oxidized in response to a defined stimulus, with assays described herein to quantitatively assess the endogenous activity of PTPs, we have produced a strategy to study the reactivation of PTPs in cells.
CRITICAL PARAMETERS:
Multiple variables can affect the quantification of endogenous PTP activity using a pNPP activity assay. We found that healthy, low passage cells worked best for measuring reversible oxidation of PTPs. We also recommend following the manufacturer’s protocol when transfecting cells, as the suggested cell confluency can vary depending on the carrier. A thorough preparation of the lysis buffers, the rapidity of execution once the lysis buffers are prepared and the degassing of the pNPP buffer are key parameters to successfully detecting reversible oxidation of PTPs.
TROUBLESHOOTING:
| Problem | Possible Cause | Solution |
|---|---|---|
| Low transfection efficiency | Different transfection reagent. Low/high cell confluency, insufficient plasmid DNA used for complex formation. Plasmid DNA is of poor quality or degraded. |
Select suitable transfection reagent based on the cell type used for assay. Optimize transfection protocol by using different cell confluency, plasmid concentration and transfection duration. Re-purify plasmid and store in small aliquots at −20 °C. |
| No color appearance in pNPP reaction | Post-lysis oxidation occurred. Lysate stored on ice for long period Low protein input. Unsuccessful IP. Unsuccessful dephosphorylation of pNPP pNPP buffer was not degassed efficiently |
Measure pO2 levels of lysis buffer with an oxygen electrode before using for cell lysis. Time to perform cell lysis, Bradford, IP and pNPP reaction should be optimized. Protein concentration should be optimized for your PTP of interest. Optimize duration, antibody and protein concentration for IP. Optimize duration of pNPP reaction or the concentration of substrate. Boil and degas ddH2O and verify pressure or leaks on vacuum pump |
| No band on western blot | Degassing of buffers. Protein degradation. Low protein input. Unsuccessful IP. Unsuccessful IAP labeling. Insufficient denaturation of sample in Laemmli buffer. Compromised epitope |
Measure pO2 levels of lysis buffer with an oxygen electrode before using for cell lysis. Avoid keeping cell lysates on ice for a long period. Use fresh stocks of protease inhibitors. Protein concentration should be optimized for your PTP of interest. Optimize duration, antibody and protein concentration for IP. IAP should be made fresh. Post-lysis oxidation of PTPs and the pH of the lysis buffer can also affect IAP labeling. Heat samples for 90-120 seconds at 95 °C. Final concentration of sample buffer should be at least 1X. IAP binds to the catalytic cysteinyl residue of PTPs. Antibodies used to detect the PTP should not target an area close to the active site of the PTP. |
STATISTICAL ANALYSIS:
To analyze the spectrophotometric readouts of the pNPP activity assay, using Prism, a scatter dot-plot with the mean as a standard deviation was performed. All the readouts are experimental triplicates (n=3).
ANTICIPATED RESULTS:
In Basic Protocol 2, healthy HEK293T cells transfected with 4 μg of pCMV-2B-FLAG-PTP1B for 48 hours should express approximately 6 times the level of FLAG-PTP1B when compared to levels of wild type PTP1B (Fig. 3B). In Basic Protocol 3, immunoprecipitating FLAG-PTP1B from 500 μg of control (unstimulated) lysate should allow PTP1B to dephosphorylate sufficient pNPP into pNP within 20 minutes to see a yellow color appear in the 1.5 mL centrifugation tube, and to be able to quantify it at A405 using a spectrophotometer (Fig. 5D). In HEK293T cells, maximal oxidation of PTP1B typically occurs 2 minutes post EGF stimulation. We expect to detect approximately 50% less pNP formation in the sample from cells that were stimulated with EGF for 2 minutes. Most of the PTP1B catalytic activity should be back to 100% after a 10-minutes stimulation. Performing the pNPP assay in presence of a reducing agent (e.g. TCEP) should maximally activate PTP1B in the immune-complex and provide a reference for 100% activity (Fig. 5E). Finally, in Alternate Protocol 3, the trend of FLAG-PTP1B biotin-labeling is expected to be similar to what was observed in Basic Protocol 3: direct cysteinyl labeling with biotin-IAP should result in an immunoreactive band at 50 kDa that represents 100% PTP1B activity in resting cells (Fig. 6C). This intensity of the immunoreactive band at 50 kDa should decrease in cells that were stimulated with EGF for 2 minutes. This reflects increased oxidation of PTP1B, since oxidized PTP1B cannot react with the sulfhydryl-reactive IAP probe. The intensity of the immunoreactive band at 50kDa should be back to levels observed in resting HEK293T cells after 10 minutes of stimulation. While the level of PTP1B biotinylation reflects the level of active PTP1B in the lysate (by which reversible oxidation can be deduced), it is expected that the levels of FLAG-PTP1B will not change in lysates over the course of the stimulation with EGF (Fig. 6D).
TIME CONSIDERATIONS:
Although each step of Basic Protocol 1 are not time consuming, long incubation periods during cell growth and Western blotting amount to a total of 4 to 5 days. On the first day, cells are passaged and plated onto cell culture dishes. On the second day cells at a confluency of 50 to 60% are transfected and serum starved (if necessary) on the evening of the third day. In the morning of the fourth day, cells are lysed, and proteins are immunoprecipitated, separated by SDS-PAGE and electrophoretically transfered. Primary antibodies are typically incubated at 4 °C for several hours or overnight, which bring us to day 5 for the secondary antibody and for visualization of the immunoreactive band. When using HRP-coupled primary antibodies, the overnight incubation can be skipped and immunoreactive bands can be visualized at the end of day 4.
In Basic Protocol 3, the enrichment and activity assay of specific PTPs itself takes one day. However, one should also take into account steps from Basic Protocol 1 up to the point of lysis, which adds 3 days to the protocol. On the evening of the third day (when transfected cells are serum-starved) the first step of the Lysis Buffer 2 preparation (boiling, mixing and degassing at 4 °C) is performed. In the morning, the second preparation step of Lysis Buffer 2 is done and lysis is performed in the hypoxic glove-box. Preparing the hypoxic glove-box and flushing it with ultrapure argon takes close to one hour. After cell lysis, samples are centrifuged, the protein concentrations are determined and FLAG-PTP1B is immunoprecipitated for 2 hours. The activity assay itself takes about 1 hour to 1.5 hours including the preparation and reading absorbance with the spectrophotometer.
In Alternate Protocol 3, the direct labeling of PTPs using IAP takes 3 days in addition to the 3 first days from Basic Protocol 1 up to the point of cell lysis. Step 1 for Lysis Buffer 3 is similar to the steps described for Lysis Buffer 2 in Basic Protocol 3. On the morning of the fourth day, the second preparation step of Lysis Buffer 2 is done and cell lysis is performed in the argon-equilibrated hypoxic glove-box station. Following the cell lysis, samples are centrifuged, the protein concentrations are determined and biotinylated samples are immunoprecipitated 3 hours using streptavidin-Sepharose. Proteins are separated by SDS-PAGE and electrophoretically transferred on the fifth day. Typically, we use large gel units for this step as several PTPs can be biotinylated using this approach and a large 10% or 10-20% gradient gel offers better resolution. Primary antibodies are incubated at 4 °C overnight, which bring us to day 6 for the secondary antibody and for visualization of the immunoreactive band. When using HRP-coupled primary antibodies, the overnight incubation can be skipped and immunoreactive bands can be visualized at the end of day 5.
Supplementary Material
ACKNOWLEDGEMENTS:
We thank N.K. Tonks for providing the pCMV-2B-FLAG-PTP1B plasmid. This research was supported by NIH grant HL138605 and American Heart Association grant 17GRNT33700265 to BB. BB is also grateful for support from the SUNY Research Foundation.
LITERATURE CITED:
- Barrett WC, DeGnore JP, Konig S, Fales HM, Keng YF, Zhang ZY, … Chock PB (1999). Regulation of PTP1B via glutathionylation of the active site cysteine 215. Biochemistry, 38(20), 6699–6705. [DOI] [PubMed] [Google Scholar]
- Boivin B, Chaudhary F, Dickinson BC, Haque A, Pero SC, Chang CJ, & Tonks NK (2013). Receptor Protein-tyrosine Phosphatase α Regulates Focal Adhesion Kinase Phosphorylation and ErbB2 Oncoprotein-mediated Mammary Epithelial Cell Motility. J Biol Chem, 288(52), 36926–36935. [DOI] [PMC free article] [PubMed] [Google Scholar]
- Boivin B, & Tonks NK (2010). Analysis of the redox regulation of protein tyrosine phosphatase superfamily members utilizing a cysteinyl-labeling assay. Methods Enzymol, 474, 35–50. [DOI] [PubMed] [Google Scholar]
- Boivin B, Yang M, & Tonks NK (2010). Targeting the reversibly oxidized protein tyrosine phosphatase superfamily. Sci Signal, 3(137), pl2. [DOI] [PMC free article] [PubMed] [Google Scholar]
- Boivin B, Zhang S, Arbiser JL, Zhang ZY, & Tonks NK (2008). A modified cysteinyl-labeling assay reveals reversible oxidation of protein tyrosine phosphatases in angiomyolipoma cells. Proc Natl Acad Sci U S A , 105(29), 9959–9964. [DOI] [PMC free article] [PubMed] [Google Scholar]
- Bradford MM (1976). A rapid and sensitive method for the quantitation of microgram quantities of protein utilizing the principle of protein-dye binding. Anal Biochem, 72, 248–254. [DOI] [PubMed] [Google Scholar]
- Buhrman G, Parker B, Sohn J, Rudolph J, & Mattos C (2005). Structural mechanism of oxidative regulation of the phosphatase Cdc25B via an intramolecular disulfide bond. Biochemistry, 44(14), 5307–5316. [DOI] [PubMed] [Google Scholar]
- Chiarugi P, & Cirri P (2003). Redox regulation of protein tyrosine phosphatases during receptor tyrosine kinase signal transduction. Trends Biochem Sci, 28(9), 509–514. [DOI] [PubMed] [Google Scholar]
- Dagnell M, Frijhoff J, Pader I, Augsten M, Boivin B, Xu J, … Ostman A (2013). Selective activation of oxidized PTP1B by the thioredoxin system modulates PDGF-β receptor tyrosine kinase signaling. Proc Natl Acad Sci U S A, 110(33), 13398–13403. [DOI] [PMC free article] [PubMed] [Google Scholar]
- Denu JM, & Tanner KG (1998). Specific and reversible inactivation of protein tyrosine phosphatases by hydrogen peroxide: evidence for a sulfenic acid intermediate and implications for redox regulation. Biochemistry, 37(16), 5633–5642. [DOI] [PubMed] [Google Scholar]
- Deshpande T, Takagi T, Hao L, & Charbonneau H (1999). Human PIR1 of the protein-tyrosine phosphatase superfamily has RNA 5′-triphosphatase and diphosphatase activities. J Biol Chem 274, 16590–16594. [DOI] [PubMed] [Google Scholar]
- Finkel T (2011). Signal transduction by reactive oxygen species. J Cell Biol, 194(1), 7–15. [DOI] [PMC free article] [PubMed] [Google Scholar]
- Gross S, Knebel A, Tenev T, Neininger A, Gaestel M, Herrlich P, & Bohmer FD (1999). Inactivation of protein-tyrosine phosphatases as mechanism of UV-induced signal transduction. J Biol Chem, 274(37), 26378–26386. [DOI] [PubMed] [Google Scholar]
- Haque A, Andersen JN, Salmeen A, Barford D, & Tonks NK (2011). Conformation- sensing antibodies stabilize the oxidized form of PTP1B and inhibit its phosphatase activity. Cell, 147(1), 185–198. [DOI] [PMC free article] [PubMed] [Google Scholar]
- Holmström KM, & Finkel T (2014). Cellular mechanisms and physiological consequences of redox-dependent signalling. Nat Rev Mol Cell Biol, 15(6), 411–421. [DOI] [PubMed] [Google Scholar]
- Hunter T (2014). The genesis of tyrosine phosphorylation. Cold Spring Harb Perspect Biol, 6(5), a020644. [DOI] [PMC free article] [PubMed] [Google Scholar]
- Jia Z, Barford D, Flint AJ, & Tonks NK (1995). Structural basis for phosphotyrosine peptide recognition by protein tyrosine phosphatase 1B. Science, 268(5218), 1754–1758. [DOI] [PubMed] [Google Scholar]
- Juarez JC, Manuia M, Burnett ME, Betancourt O, Boivin B, Shaw DE, … Doñate F. (2008). Superoxide dismutase 1 (SOD1) is essential for H2O2-mediated oxidation and inactivation of phosphatases in growth factor signaling . Proc Natl Acad Sci U S A, 105(20), 7147–7152. [DOI] [PMC free article] [PubMed] [Google Scholar]
- Julien SG, Dubé N, Hardy S, & Tremblay ML (2011). Inside the human cancer tyrosine phosphatome. Nat Rev Cancer, 11(1), 35–49. [DOI] [PubMed] [Google Scholar]
- Karisch R, Fernandez M, Taylor P, Virtanen C, St-Germain JR, Jin LL, … Neel BG (2011). Global proteomic assessment of the classical protein-tyrosine phosphatome and “Redoxome”. Cell, 146(5), 826–840. [DOI] [PMC free article] [PubMed] [Google Scholar]
- Lee SR, Kwon KS, Kim SR, & Rhee SG (1998). Reversible inactivation of protein-tyrosine phosphatase 1B in A431 cells stimulated with epidermal growth factor. J Biol Chem, 273(25), 15366–15372. [DOI] [PubMed] [Google Scholar]
- Leslie NR, Bennett D, Lindsay YE, Stewart H, Gray A, & Downes CP (2003). Redox regulation of PI 3-kinase signalling via inactivation of PTEN. Embo J, 22(20), 5501–5510. [DOI] [PMC free article] [PubMed] [Google Scholar]
- Lohse DL, Denu JM, Santoro N, & Dixon JE (1997). Roles of aspartic acid-181 and serine-222 in intermediate formation and hydrolysis of the mammalian protein-tyrosine-phosphatase PTP1. Biochemistry, 36(15), 4568–4575. [DOI] [PubMed] [Google Scholar]
- Londhe AD, Bergeron A, Curley SM, Zhang F, Rivera KD, Kannan A, … Boivin B (2020). Regulation of PTP1B activation through disruption of redox-complex formation. Nat Chem Biol, 16(2), 122–125. [DOI] [PMC free article] [PubMed] [Google Scholar]
- Lorenz U (2011). Protein tyrosine phosphatase assays. Curr Protoc Immunol, 10.1002/0471142735.im1107s93. [DOI] [PMC free article] [PubMed] [Google Scholar]
- Mahadev K, Zilbering A, Zhu L, & Goldstein BJ (2001). Insulin-stimulated hydrogen peroxide reversibly inhibits protein-tyrosine phosphatase 1b in vivo and enhances the early insulin action cascade. J Biol Chem, 276(24), 21938–21942. [DOI] [PubMed] [Google Scholar]
- Meng TC, Buckley DA, Galic S, Tiganis T, & Tonks NK (2004). Regulation of insulin signaling through reversible oxidation of the protein-tyrosine phosphatases TC45 and PTP1B. J Biol Chem, 279(36), 37716–37725. [DOI] [PubMed] [Google Scholar]
- Meng TC, Fukada T, & Tonks NK (2002). Reversible oxidation and inactivation of protein tyrosine phosphatases in vivo. Mol Cell, 9(2), 387–399. [DOI] [PubMed] [Google Scholar]
- Meng TC, & Tonks NK (2003). Analysis of the regulation of protein tyrosine phosphatases in vivo by reversible oxidation. Methods Enzymol, 366, 304–318. [DOI] [PubMed] [Google Scholar]
- Näykki T, J. L, Helm I, Leito I. (2013). Dissolved Oxygen Concentration Interlaboratory Comparison: What Can We Learn? Water, 5, 420–442. [Google Scholar]
- Nelson KJ, Klomsiri C, Codreanu SG, Soito L, Liebler DC, Rogers LC, … Poole LB. (2010). Use of dimedone-based chemical probes for sulfenic acid detection methods to visualize and identify labeled proteins. Methods Enzymol, 473, 95–115. [DOI] [PMC free article] [PubMed] [Google Scholar]
- Ostman A, Frijhoff J, Sandin A, & Böhmer FD (2011). Regulation of protein tyrosine phosphatases by reversible oxidation. J Biochem, 150(4), 345–356. [DOI] [PubMed] [Google Scholar]
- Persson C, Sjoblom T, Groen A, Kappert K, Engstrom U, Hellman U, … Ostman A. (2004). Preferential oxidation of the second phosphatase domain of receptor-like PTP-alpha revealed by an antibody against oxidized protein tyrosine phosphatases. Proc Natl Acad Sci U S A, 101(7), 1886–1891. [DOI] [PMC free article] [PubMed] [Google Scholar]
- Salmeen A, Andersen JN, Myers MP, Meng TC, Hinks JA, Tonks NK, & Barford D (2003). Redox regulation of protein tyrosine phosphatase 1B involves a sulphenyl-amide intermediate. Nature, 423(6941), 769–773. [DOI] [PubMed] [Google Scholar]
- Salmeen A, & Barford D (2005). Functions and mechanisms of redox regulation of cysteine-based phosphatases. Antioxid Redox Signal, 7(5-6), 560–577. [DOI] [PubMed] [Google Scholar]
- Schwertassek U, Haque A, Krishnan N, Greiner R, Weingarten L, Dick TP, & Tonks NK (2014). Reactivation of oxidized PTP1B and PTEN by thioredoxin 1. FEBS J, 281(16), 3545–3558. [DOI] [PMC free article] [PubMed] [Google Scholar]
- Sundaresan M, Yu ZX, Ferrans VJ, Irani K, & Finkel T (1995). Requirement for generation of H2O2 for platelet-derived growth factor signal transduction. Science, 270(5234), 296–299. [DOI] [PubMed] [Google Scholar]
- Tabernero L, Aricescu AR, Jones EY, & Szedlacsek SE (2008). Protein tyrosine phosphatases: structure-function relationships. FEBS J., 275(5), 867–882. [DOI] [PubMed] [Google Scholar]
- Tonks NK (2006). Protein tyrosine phosphatases: from genes, to function, to disease. Nat Rev Mol Cell Biol, 7(11), 833–846. [DOI] [PubMed] [Google Scholar]
- Tonks NK (2013). Protein tyrosine phosphatases--from housekeeping enzymes to master regulators of signal transduction. FEBS J, 280(2), 346–378. [DOI] [PMC free article] [PubMed] [Google Scholar]
- Yang J, Groen A, Lemeer S, Jans A, Slijper M, Roe SM, … Barford D (2007). Reversible oxidation of the membrane distal domain of receptor PTPalpha is mediated by a cyclic sulfenamide. Biochemistry, 46(3), 709–719. [DOI] [PubMed] [Google Scholar]
- Zhang ZY, & Dixon JE (1993). Active site labeling of the Yersinia protein tyrosine phosphatase: the determination of the pKa of the active site cysteine and the function of the conserved histidine 402. Biochemistry, 32(36), 9340–9345. [DOI] [PubMed] [Google Scholar]
Associated Data
This section collects any data citations, data availability statements, or supplementary materials included in this article.