

Abstract
Background.
Significant racial differences are observed in incidence and clinical outcomes of diffuse large B-cell lymphoma (DLBCL) in the United States, but it remains unclear whether genomic differences contribute to these disparities.
Methods.
To understand the influences of genetic ancestry on tumor genomic alterations, we estimated the genetic ancestry of 1,001 previously described DLBCL patients using unsupervised model-based ADMIXTURE applied to exome sequencing data and examined the mutational profile of 150 DLBCL driver genes in tumors from this cohort.
Results.
Global ancestry prediction identified 619 patients with >90% European ancestry, 81 with >90% African ancestry, and 50 with >90% Asian ancestry. Compared with DLBCL patients with European ancestry, patients with African ancestry were >10 years younger at diagnosis and were more likely to present with B symptoms, elevated serum lactate dehydrogenase, extranodal disease, and advanced stage disease. Patients with African ancestry exhibited worse overall survival compared to patients with European ancestry (median 4.9 years vs 8.8 years, p=0.04). We found recurrent mutations of MLL2, HIST1H1E, MYD88, BCL2, and PIM1 across all ancestry groups, suggesting shared mechanisms underlying tumor biology. We also identified six DLBCL driver genes that were more commonly mutated in patients with African ancestry compared to patients with European ancestry: ATM (21.0% vs 7.75%, p<0.001), MGA (19.7 vs 5.33%, p<0.001), SETD2 (17.3% vs 5.17%, p<0.001), TET2 (12.3% vs 5.82%, p=0.029), MLL3 (11.1% vs 4.36%, p=0.013), and DNMT3A (11.1% vs 4.52%, p=0.016).
Conclusions.
Distinct prevalence and patterns of mutation highlight an important difference in the mutational landscapes of DLBCL arising in different ancestry groups. Our work provides the first-ever characterization of genetic alterations among DLBCL patients of African descent.
Keywords: diffuse large B cell lymphoma, mutation, African continental ancestry group, racial factors
Precis:
In a cohort of 1,001 DLBCL cases, genome-defined African ancestry was associated with distinct driver mutations in ATM, MGA, SETD2, TET2, MLL3, and DNMT3A in DLBCL tumors. Patients with African ancestry were more likely to present with B symptoms, elevated serum LDH, extranodal disease, and advanced stage disease, and had inferior overall survival compared to patients with European ancestry.
Introduction
Diffuse large B-cell lymphoma (DLBCL) is the most common subtype of non-Hodgkin lymphoma (NHL) in the United States, comprising approximately one-third of lymphomas in adults.1 The clinical course of DLBCL can be aggressive, with a median survival of less than one year in untreated patients.2 With standard immunochemotherapy regimens such as rituximab, cyclophosphamide, doxorubicin, vincristine, and prednisone (R-CHOP), 75% of patients achieve complete remission, and 64% of those individuals are alive and disease-free at 10 years.3 Despite these high cure rates, DLBCL outcomes are heterogeneous, and 30–40% of patients are either refractory to or relapse after first-line treatment and have a lower likelihood of long-term survival. In particular, individuals who relapse within 24 months of diagnosis or who have a short diagnosis-to-treatment interval have worse outcomes.4, 5 Accordingly, much work has been devoted to characterizing the biologic, clinical, and environmental factors that underlie this heterogeneity of DLBCL.
The genomic landscape of DLBCL has been robustly studied through integrative analyses of genomics and transcriptomics. Gene expression profiling of DLBCL identified molecularly distinct DLBCL subgroups defined by cell-of-origin: activated B-cell-like (ABC), germinal center B-cell-like (GCB), and primary mediastinal DLBCL6, 7 that have been recapitulated by immunohistochemistry8–10 and have divergent clinical outcomes. Three-year overall survival (OS) is approximately 80% for GCB-DLBCL and 30–40% for ABC-DLBCL.8, 11, 12 Several recent landmark studies have defined genetic drivers, clarified their functional roles, identified patterns of abnormalities associated with GCB- and ABC-DLBCL, and linked these with clinical outcomes.12–15 However, no analysis has provided detailed information on distribution of genomic alterations or DLBCL subtypes by race or ancestry.
While racial differences in the incidence of lymphoma are well known,16 and many groups have contributed to a developed understanding of disparities in cancer outcomes for solid tumors,17, 18 our group has systematically examined disparities in the presentation and outcomes of lymphoma.19–21 In two national cancer datasets, the Surveillance, Epidemiology and End Results registry (SEER) and the National Cancer Database (NCDB), we discovered that African American patients in the United States with DLBCL were diagnosed 10 years younger than whites, were significantly more likely to have advanced stage disease, and were less likely to be insured, less likely have received standard of care therapy, and less likely to be alive at 5 years (38% vs 46%).19, 21 Studies of DLBCL patients from two academic centers that collected detailed information on administration of chemotherapy and immunotherapy found no racial differences in treatment, but African American patients still experienced inferior survival.22 Given the established biological subtypes of DLBCL described above and their association with disparate survival outcomes, we hypothesized that differences in the prevalence of ABC-DLBCL between African American and whites could underlie racial disparities in outcomes, and that recently described gene mutations associated with ABC-DLBCL would more common in African American patients. Pilot data from our two-institution study (n=89) suggested racial differences in the prevalence of non-GCB DLBCL by immunohistochemistry (64% in African American vs 37% in white, p=0.01).23, 24 However, no studies have taken into account genome-based ancestry, mutation patterns, and outcome in DLBCL patients.
Admixture mapping is a powerful genome association strategy for investigating potential genetic factors that contribute to racial difference in complex diseases. It evaluates the relationships between different ancestral populations and allele frequencies of multiple single nucleotide polymorphisms. Further analyses can also distinguish chromosomal segments that denote distinct ancestry via statistical enumeration of ancestry informative markers, with the rationale that the genetic variation associated with pathogenesis of a disease could present more frequently on chromosome segments derived from a parental population with a higher incidence of that disease.25 Admixture mapping analyses may be particularly useful in DLBCL given that the incidence of B-cell lymphoma is markedly lower in African Americans compared with Americans of European ancestry,21 and since African Americans in the United States represent a highly admixed population involving African, European, Native American, and Asian ancestry.26
The purpose of this study is to identify ancestry-specific cancer driver gene mutations and to describe the genomic landscape of DLBCL across ancestry groups.
Methods
DLBCL data
DLBCL whole exome sequencing (n=1,001) and RNA sequencing (n=775) datasets were downloaded from European Genome-Phenome Archive (EGA: EGAS00001002606) from the genomic analysis performed by Reddy and colleagues.12 This dataset involved patients who were uniformly treated with standard-of-care therapy with R-CHOP and includes clinical data. Clinical information was obtained from Reddy et al supplementary materials, including age, gender, serum lactate dehydrogenase (LDH), disease stage, ECOG performance status, number of extranodal sites of disease, B symptoms, International Prognostic Index (IPI) score, RNA-sequencing-based molecular subtype (GCB, ABC, unclassified), genomic risk model, initial response to therapy, date of last follow-up, and date of death.27 Data that could be used to calculate disease-free survival, progression-free survival, or event-free survival was not available from this dataset. Of the 1,001 patients included in the dataset, 159 patients were from Emory University. Self-reported race of selected Emory University patients was available from institutional medical records and collected under an IRB-approved protocol (n=63; 42 African-American, 18 non-Hispanic white, and 3 Hispanic).
Global ancestry estimation
We applied unsupervised model-based ADMIXTURE28 global ancestry analysis with K=3 postulated ancestral populations to identify global ancestry groups using exome sequencing data. We used K=2–12 and cross-validation error method implemented in ADMIXTURE to estimate the most preferable K. We categorized patients into one of seven genetically-defined ancestry groups: >90% European ancestry, >90% African ancestry, >90% Asian ancestry, 50–90% European ancestry, 50–90% African ancestry, 50–90% Asian ancestry, and unclassified. We utilized the 63 Emory patients with known self-reported race to describe the overlap between self-reported African ancestry and African ancestry determined by genomic assessment of ADMIXTURE.
Statistical analysis
Differences in baseline characteristics at diagnosis across different ancestry groups were analyzed using pairwise analyses (African vs European; Asian vs European). Univariate and multivariable Cox proportional hazards models were used to determine predictors for survival and included the following variables: ancestry, age, gender, LDH, stage, performance status, number of extranodal sites of disease, B symptoms, IPI score, and RNA-sequencing-based molecular subtype. OS curves were constructed using the Kaplan-Meier method and were compared by a two-sided log-rank test. A level of significance of 0.05 was defined as statistically significant. All statistics were computed using R statistics software (R 3.5.1).
Genetic drivers in DLBCL patients with African ancestry
After stratifying patients by ancestry groups as determined by ADMIXTURE, we examined mutational frequency of the 150 DLBCL driver genes previously identified in the Reddy et al dataset. Each mutation was further categorized by type of alteration: truncation, missense, frameshift, copy number gain, or copy number loss. Differences in mutational frequency between ancestry groups were analyzed using Fisher’s exact test. We identified putative driver mutations on OncoPrints (CBioPortal)29, based on mutation hotspots30 and OncoKB.31
Results
Global Ancestry Estimation
As self-reported race was not part of the clinical information collected in Reddy et al dataset, we performed ADMIXTURE global ancestry on 1,001 DLBCL cases. We identified patients with >90% European ancestry (n=619), >90% African ancestry (n=81), >90% Asian ancestry (n=50), 50–90% European ancestry (n=164), 50–90% African ancestry (n=34), 50–90% Asian ancestry (n=47), and unclassified (n=6; Figure 1). Global ancestry prediction correlated with self-reported race for 96.7% of patients with available data (n=63).
Figure 1. Global ancestry estimation of 1,001 DLBCL patients.

ADMIXTURE plot showing genome-wide ancestry fractions for individuals from admixed populations. Each column corresponds to an individual patient. Abbreviations: EU, European ancestry; AF, African ancestry; AS, Asian ancestry.
Baseline characteristics
The clinical characteristics of DLBCL patients are described in Table 1. The mean age at diagnosis was 62 years (range, 3–93) for patients with >90% European ancestry, compared to 52 (9–83) for patients with >90% African ancestry (p<0.001). A greater proportion of patients with >90% African ancestry presented with B symptoms (p=0.001), elevated LDH (p<0.001), advanced stage disease (p=0.007), extranodal sites of involvement (p<0.001) and B symptoms (p=0.001), as compared to patients with >90% European ancestry. There were no statistically significant differences between these ancestry groups in gender, ECOG performance status, IPI score, or cell-of-origin subtype. Clinical characteristics of patients with >90% European ancestry and >90% Asian ancestry were remarkably similar except for elevated LDH observed in Asian ancestry group (p<0.05). No significant differences were observed with respect to molecular subtypes across all ancestry groups (approximately 40% of patients had ABC-DLBCL).
Table 1. Clinical characteristics by genetic ancestry in 1001 DLBCL cases.
For each variable, cases with missing or unknown data were excluded in calculating the P value.
| Number of patients (%) | P value | |||||
|---|---|---|---|---|---|---|
| Characteristics | All patients N=750 |
>90% EU N=619 |
>90% AF N=81 |
>90% AS N=50 |
>90% AF vs >90% EU |
>90% AS vs >90% EU |
| Age | ||||||
| Mean | 62 | 63 | 52 | 60 | <0.001 | 0.91 |
| ≤ 60 | 318 (44.5) | 244 (41.2) | 52 (72.2) | 22 (44.0) | ||
| > 60 | 396 (55.5) | 348 (58.8) | 20 (27.8) | 28 (56.0) | ||
| Gender | ||||||
| Male | 420 (56.1) | 349 (56.5) | 41 (50.6) | 30 (60.0) | 0.38 | 0.81 |
| Female | 329 (43.9) | 269 (43.5) | 40 (49.4) | 20 (40.0) | ||
| LDH | ||||||
| Elevated | 363 (54.8) | 277 (50.7) | 51 (76.1) | 35 (71.4) | <0.001 | 0.008 |
| Normal | 299 (45.2) | 269 (49.3) | 16 (23.9) | 14 (28.6) | ||
| Stage | ||||||
| I/II | 277 (38.1) | 242 (40.3) | 18 (23.7) | 17 (34.0) | 0.007 | 0.47 |
| III/IV | 450 (61.9) | 359 (59.7) | 58 (76.3) | 33 (66.0) | ||
| ECOG PS | ||||||
| 0–2 | 488 (71.9) | 396 (71.4) | 51 (68.9) | 41 (82.0) | 0.77 | 0.15 |
| 3–4 | 191 (28.1) | 159 (28.6) | 23 (31.1) | 9 (18.0) | ||
| >1 Extranodal sites | ||||||
| Yes | 166 (23.8) | 121 (20.6) | 29 (46.8) | 16 (34.0) | <0.001 | 0.05 |
| No | 531 (76.2) | 467 (79.4) | 33 (53.2) | 31 (66.0) | ||
| B symptoms | ||||||
| Yes | 252 (35.9) | 205 (35.0) | 28 (41.2) | 19 (38.8) | 0.001 | 0.71 |
| No | 450 (64.1) | 380 (65.0) | 40 (58.8) | 30 (61.2) | ||
| Subtype | ||||||
| ABC | 239 (40.0) | 202 (39.8) | 21 (42.9) | 16 (40.0) | 0.31 | 0.57 |
| GCB | 261 (43.7) | 232 (45.7) | 17 (34.7) | 12 (30.0) | ||
| Unclassified | 97 (16.2) | 74 (14.6) | 11 (22.4) | 12 (30.0) | ||
Abbreviations: EU, European ancestry; AF, African ancestry; AS, Asian ancestry;ECOG PS, Eastern Cooperative Oncology Group performance status; ABC, activated B-cell-like; GCB, germinal center B-cell like.
Survival Analysis
Figure 2 presents the Kaplan-Meier survival curves stratified by estimated genomic ancestry. DLBCL patients with >90% African ancestry exhibited worse survival compared to patients with >90% European ancestry (median OS 4.9 years vs 8.8 years, p=0.04). The median OS for patients with >90% Asian ancestry was 8.6 years. Table 2 shows univariate and multivariable results of Cox regression analyses of factors predicting mortality. In our multivariable model, age at diagnosis (hazard ratio [HR] 1.91, p<0.001), elevated LDH (HR 1.46, p=0.02), ECOG performance status >2 (HR 1.94, p<0.001), and ABC subtype (HR 1.47, p=0.04) predicted worse survival. OS was worse among patients with >90% African ancestry compared to >90% European ancestry in univariate analyses (HR 1.56, p=0.02), but the strength of this association decreased in the multivariable model (p=0.054).
Figure 2.

Overall survival of DLBCL patients treated with R-CHOP, by ancestry.
Table 2. Cox regression models of mortality predictors in patients with DLBCL.
Covariates with adjusted p values < 0.05 in the univariate model were assessed in the multivariable model, with adjustment for age, ancestry, LDH, disease stage, ECOG PS, B symptoms, and subtype.
| Univariate Model | Multiple Variable Model | |||
|---|---|---|---|---|
| Factors | HR (95% Cl) | p-value | HR (95% Cl) | p-value |
| Age | ||||
| ≤ 60 | Reference | Reference | ||
| > 60 | 1.86 (1.42–2.45) | <0.001 | 1.91 (1.38–2.64) | <0.001 |
| Gender | ||||
| Female | Reference | Reference | ||
| Male | 0.98 (0.69–1.18) | 0.48 | ||
| Ancestry | ||||
| > 90% European | Reference | Reference | ||
| > 90% African | 1.56 (1.09–2.23) | 0.02 | 1.59 (0.99–2.56) | 0.054 |
| > 90% Asian | 1.22 (0.80–2.23) | 0.34 | 1.18 (0.72–1.91) | 0.506 |
| LDH | ||||
| Normal | Reference | Reference | ||
| Elevated | 1.96 (1.47–2.61) | <0.001 | 1.46 (1.05–2.04) | 0.02 |
| Stage | ||||
| I/II | Reference | Reference | ||
| III/IV | 1.87 (1.40–2.48) | <0.001 | 1.36 (0.97–1.95) | 0.3 |
| ECOG PS | ||||
| 0–2 | Reference | Reference | ||
| 3–4 | 2.45 (1.92–3.25) | <0.001 | 1.94 (1.43–2.66) | <0.001 |
| >1 Extranodal sites | ||||
| No | Reference | Reference | ||
| Yes | 1.28 (0.95–1.72) | 0.10 | ||
| B symptoms | ||||
| No | Reference | Reference | ||
| Yes | 1.40 (1.08–1.83) | 0.01 | 1.10 (0.81–1.50) | 0.55 |
| Subtype | ||||
| GCB | Reference | Reference | ||
| ABC | 1.56 (1.13–2.14) | 0.005 | 1.47 (1.04–2.16) | 0.04 |
Abbreviations: HR, hazard ratio; Cl, confidence interval; ECOG PS, Eastern Cooperative Oncology Group performance status; LDH, lactate dehydrogenase.
We also examined the association between ancestry and initial response to therapy. Of patients with >90% African ancestry, 81.3% of patients achieved complete response, 6.7% attained partial response, and 12.0% showed no response. The proportion of patients with >90% European ancestry achieving complete response was 91.8%, and no response was seen in 8.2% of patient (both non-significant).
Genetic Drivers in DLBCL Patients by Global Ancestry
We compared the mutation frequencies of 150 DLBCL driver genes identified in the prior analysis. The 40 most frequently mutated driver genes are shown in Figure 3A. The mean frequencies of mutations in patients with >90% African ancestry and patients with >90% European ancestry were similar (7.5% vs 7.4%, respectively). Patients with >90% Asian ancestry had the highest mutation frequency (9.9%). We found alterations in MLL2, HIST1H1E, MYD88, BCL2, and PIM1 in at least 10% of cases in each ancestry group. We also found genes that were differentially mutated between ancestry groups. ATM, MGA, SETD2, TET2, MLL3, and DNMT3A were mutated more frequently in patients with African ancestry compared to patients with European ancestry (Figure 3B, p<0.05). These six genes accounted for 86 mutations across 57% of patients with African ancestry (p<0.001), 29 mutations across 40% of patients with Asian ancestry (p=0.02), as compared to 172 mutations across 24% of patients with European ancestry. Conversely, patients with African ancestry were less likely to have TP53 (2.5% vs 10.8%, p=0.021) mutations compared to patients with European ancestry.
Figure 3. Frequencies of mutations and copy number variations for top 40 DLBCL driver genes by patient ancestry.
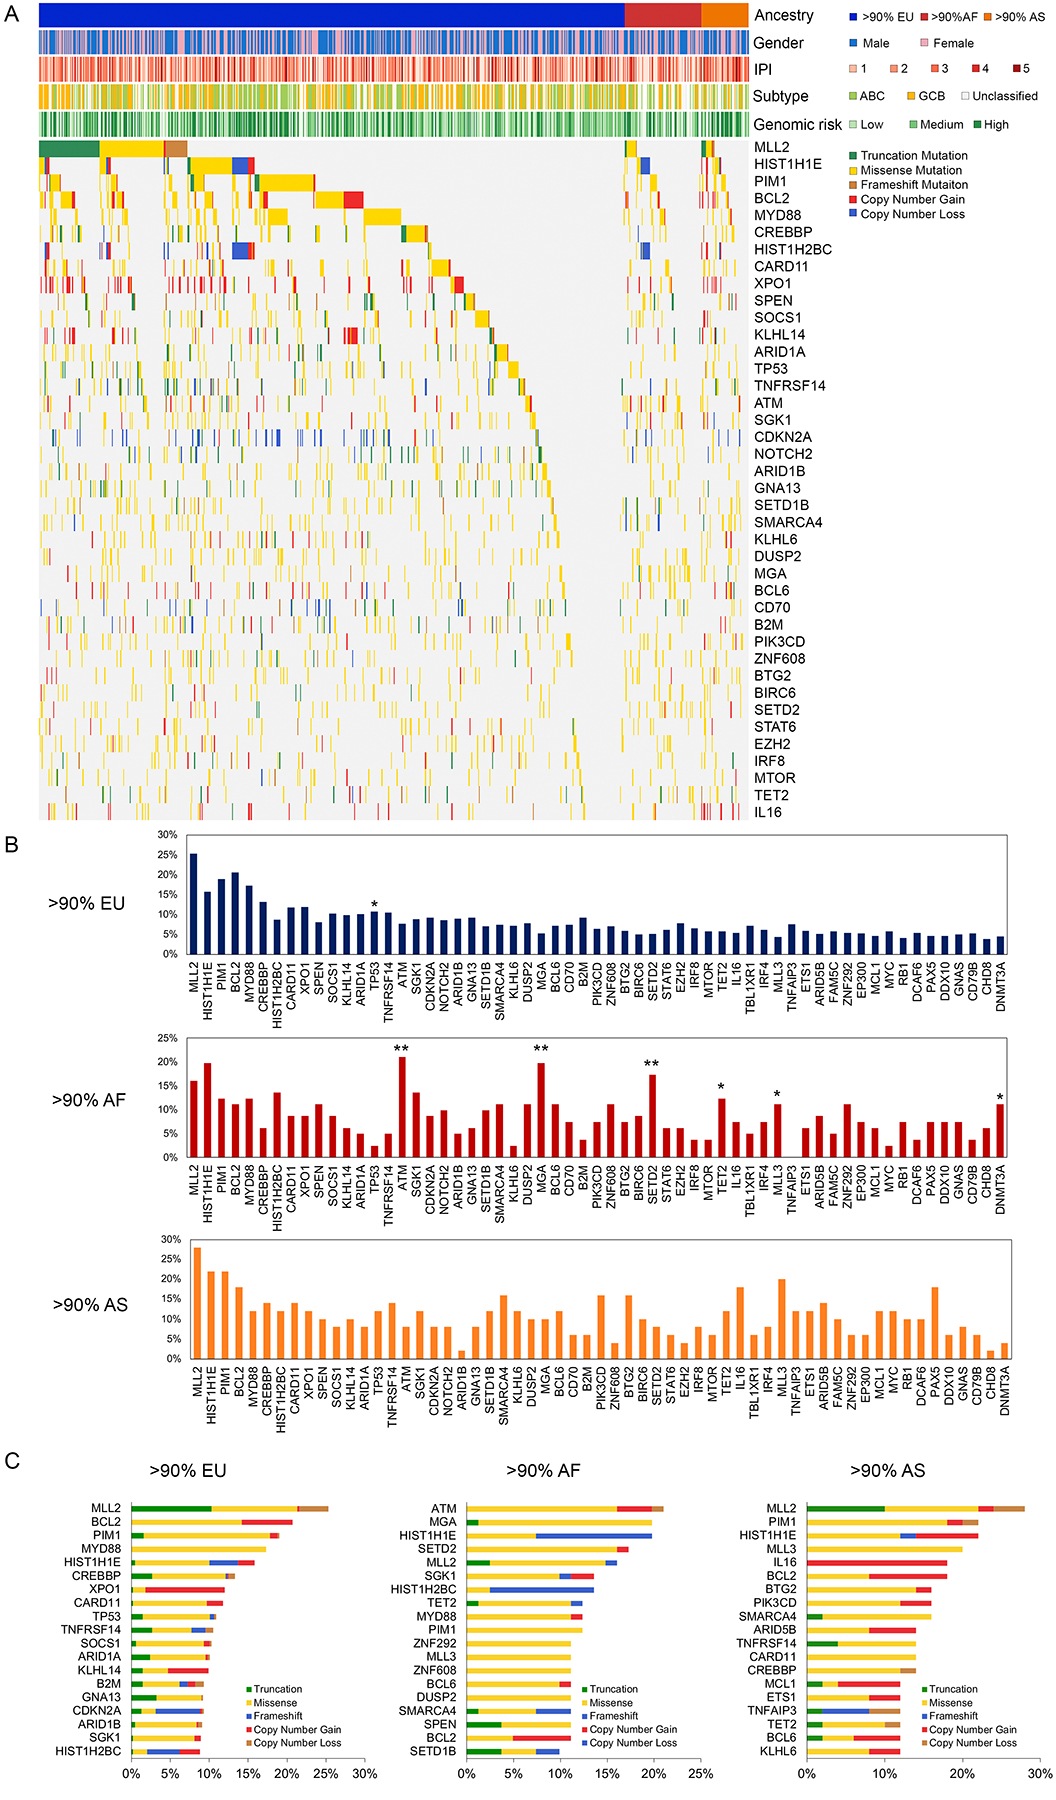
A. Heatmap of genetic alterations across ancestral groups. Columns correspond to tumors and rows correspond to DLBCL driver genes. Individual boxes are colored according to the type of alteration for that gene in that tumor. Genes are ordered by frequency, and mutations are stratified by mutation types. Color bars show gender, International Prognostic Index (IPI) score, cell-of-origin subtype, and genomic risk model. B. Frequencies of gene alterations were compared between DLBCL tumors from European, African, and Asian ancestry using the Fisher exact test. (*p <0.05; **p <0.001). C. Top 20 most frequently mutated DLBCL driver genes by ancestry and type of alteration. Abbreviations: EU, European ancestry; AF, African ancestry; AS, Asian ancestry; ABC, Activated B-cell-like (ABC); GCB, germinal center B-cell-like (GCB).
Figure 4A depicts the heatmap of the six highly mutated genes in patients with African ancestry (n=81) along with corresponding clinical features. The most frequently mutated gene in the African ancestry group was ATM (21% of cases), with a large proportion of missense mutations, including five likely oncogenic mutations. MGA had a Q240 hotspot mutation in the T-box domain. TET2 had four mutational hotspots, three localized in the catalytic domain of its J-binding protein. Mutations observed in SETD2, DNMT3A and MLL3 were missense variants of unknown significance. The distributions of mutations in ATM, MGA, and TET2 are shown in Figure 4B.
Figure 4. The genomic landscape of DLBCL drivers in 81 patients with >90% African ancestry.

A. Mutations in ATM, MGA, SETD2, TET2, DNMT3A and MLL3 observed in 81 DLBCL patients with African ancestry. Frequencies of alteration are expressed as a percentage of all cases. Clinical features of the corresponding patients are indicated below the mutational heatmap, including the International Prognostic Index (IPI) score, response to therapy (complete[CR], partial[PR], or no response[NR]), activated B-cell-like (ABC) versus germinal center B-cell-like (GCB) DLBCL subtype, and gender. B. Stem plot showing distribution of mutations in ATM, MGA, and TET2. Known driver hotspot mutations and oncogenic mutations determined by OncoKB are annotated. X axis indicates amino acid position of each mutation. Y axis indicates number of patients with the same mutation.
We further investigated the distribution of DLBCL driver genes mutations across all ancestry groups (Figure 3C). Genes exhibited a pattern of either predominant missense and/or copy number gains of oncogenes (e.g., BCL2, CARD11) or truncating mutations and/or copy number losses of tumor suppressor genes (e.g., SPEN, TP53). Patients with African ancestry harbored a higher proportion of missense mutations compared to patients with European ancestry (77.7% of total mutations vs 64.9%; p<0.001), and frameshift substitution (8.1% vs 5.4%, p=0.03). In contrast, patients with European ancestry had higher proportions of truncation (11.3% vs 4.2%, p<0.001), copy number gain (14.2% vs 8.4%, p=0.002), and copy number loss (4.1% vs 1.7%, p=0.02) compared to patients with African ancestry.
In our examination of the association of driver gene alterations and OS in patients with African ancestry, none of the individual mutated genes had a prognostic significance. Kaplan Meier analysis showed that alterations in MGA, DNMT3A, and MLL3 showed a trend toward worse OS, but this cohort size was insufficiently powered to establish statistical significance.
Discussion
This study represents a comprehensive effort to examine DLBCL cancer genomics among different ancestral populations, with integrated clinical characteristics, tumor cell-of-origin subtype, outcome, mutations, and ancestry information from whole exome sequencing. We used genetically determined African ancestry rather than self-reported race to examine differences in DLBCL clinical features and outcomes. Our results are consistent with previous epidemiologic studies of DLBCL in that African American patients were diagnosed at a younger age compared to non-Hispanic white patients, and were more likely to present with B symptoms and advanced stage disease.21, 22 Our study shows significant differences in survival based on ancestral origin, supporting with prior findings that African American patients with DLBCL have worse OS. However, contrary to our hypothesis, we did not observe any differences in the frequency of ABC-DLBCL by ancestral origin. Although African ancestral origin was a predictor of OS in univariate models, the strength of this association decreased in multivariable models that included factors from the IPI score32 and cell-of-origin subtype, suggesting an interplay between these factors or lack of power to identify significance with this sample size.
Genome-wide association studies (GWAS) have identified common variants that are associated with the risk of various types of cancer.33, 34 It is becoming increasingly apparent that host genomic factors such as germline variants can act as expression quantitative trait loci (eQTLs), thereby affecting the expression of cancer driver genes.35 These germline variants may be preferentially found in certain populations, which could potentially explain the differences in disease severity and therapeutic response observed between some population groups. Importantly, however, most of the DLBCL cases examining risk variants have been conducted primarily in European36 and Asian.37, 38 Investigation of lymphoma genetics in African Americans has been lacking, and the relationships between variants and risk of DLBCL in African Americans has been unknown. We identified overlapping alterations of MLL2, HIST1H1E, MYD88, BCL2, and PIM1 across ancestry groups, indicating shared oncogenic mechanisms. We also found differentially mutated genes across ancestry groups. The surprisingly lower incidence of TP53 mutations in African ancestry patients suggests the possibility of alternative cellular pathway being of greater importance. These observations underscore the considerable genetic heterogeneity across ancestry groups that may contribute to the observed disparities in the clinical presentation and outcomes of DLBCL.
ATM was the most frequently mutated gene in African ancestry group. ATM codes for a protein critically important in the cellular response to DNA damage, which acts upstream of p53. Mutations in ATM have been reported in B cell chronic lymphocytic leukemia (CLL)39 and mantle cell lymphoma,40 and ATM mutations were associated with worse overall and treatment-free survival in CLL patients.39 Although the strongest evidence for association has been found with truncation and splice-junction variants, some studies have identified missense variants leading to depletion of functional ATM protein,41 and induction of downstream components in the p53 pathway following irradiation.42 In the current study, ATM mutations were mainly missense mutations and seemed to be independent of p53 alterations.
Our study identified epigenetic regulators that are associated with DLBCL in the African ancestry group, including histone-modifying enzymes and regulators of DNA methylation. Among these genes, SETD2 and TET2 are of special interest because of their known involvement in myeloid/lymphoid oncogenic pathways. SETD2 codes for a histone H3 lysine 36 trimethyltransferase (H3K36me3), and loss of function of SETD2 has been associated with accelerated tumor cell growth in leukemia.43 Mar et al described the effect of inactivating mutations of SETD2 in conferring drug resistance against DNA-damaging agents in cell lines and in a murine model of AML.44 Consequently, treatment with an inhibitor of the H3K26me3 demethylase restored sensitivity to cytarabine, suggesting potential therapeutic avenue to investigate. TET2 is a wells-established tumor suppressor gene in myeloid malignancies and TET2 mutations have been associated with advanced stage disease and worse progression-free survival in AML and T-cell lymphoma.45 Several groups have identified rare variants in TET2 that were associated with aggressive prostate cancer in African Americans but were protective in European Americans.46 Studies investigating the prevalence of TET2 mutations across cancer in African American populations and the biological significance of these mutations may provide new insights for pathogenesis and therapy.
Most of the six DLBCL driver gene mutations in individuals of >90% African ancestry (ATM, MGA, SETD2, TET2, MLL3, and DNMT3A) were missense, and their functional impact in cancer biology has yet to be established. Future studies are required to establish the role of these missense mutations in tumor development, progression, and differential responses to chemotherapy across ancestry groups. None of these genes had a prognostic impact on OS, suggesting that the integrated analysis of pathways may be more relevant than individual genes. This approach may overcome the challenges of low frequency of these genes.
There are several limitations to this study. First, we predicted each patient’s ancestral information based on whole exome sequencing data. Although ancestral origin was highly correlated with small subset of self-identified race among patients where these data were available, we have limited clinical information on the remaining patients to confirm ancestry groups. Small mismatch between genetic ancestry and self-reported race could be due to limited ability of ancestry informative markers to predict ancestry. However, it is important to recognize that genetic information provides more precise estimates of ancestral origin, while self-reported race encompasses social and environmental dimensions that may be relevant to disease risk. Notably, socioeconomic status and other environmental factors were not available in our dataset. Thus, it is unclear to what extent these factors might have acted as confounders or interacted with genetic abnormalities to impact the observed racial disparities in outcome. Secondly, our evaluation was limited to somatic mutations and copy number variations of 150 previously identified DLBCL driver genes. We cannot rule out the possibility that other genes outside of our selection display substantially different mutational frequencies between patients with African and European ancestry. However, such associations would likely occur only in mutations that are uncommon in DLBCL. In addition, many of the gene variants identified are rare and of unknown function, and the number of patients of African ancestry was relatively small. Sample size may not be adequate to comprehensively characterize racial differences in genetic alterations despite the large size of the 1,001 DLBCL cases as a whole. Larger cohorts with patients with African ancestry will be necessary to identify driver genes and pathways implicated in pathogenesis of DLBCL in this particular population; at the time of our analysis, no cohort with significant numbers of samples or sequencing data from DLBCL patients of African descent was available. Large cohort studies such as the Lymphoma Epidemiology of Outcomes Cohort Study (LEO; NCT02736357) are now underway that may make additional analyses possible. Finally, eQTL analysis could potentially determine the functional significance of the identified genes variants and identify downstream targets of validated susceptibility genes in DLBCL patients.
This study highlights the striking genetic heterogeneity underlying DLBCL across ancestry groups. We have identified certain alterations that are common across ancestry groups, but also found driver genes with significantly different mutational profiles. These findings suggest involvement of different oncogenic genes and pathways in African American populations and constitute possible mechanisms that may contribute to racial differences in incidence, patterns of presentation, and survival. Our work adds to existing literature identifying differences in DLBCL outcomes by race, insurance status, socioeconomic status, clinical, and environmental factors.1, 19, 21, 22, 47–49 Larger epidemiologic studies that integrate these factors along with gene expression, copy number, and genome sequencing data are needed to better understand the complex interactions between these variables and their contributions to disparities in DLBCL outcomes. Ideally, such data should be collected from population-based samples to provide a representation of general clinical practice and to avoid skewing toward academic settings that may over-represent patients with poor-risk genomics. Such studies also may require oversampling of ethnic minority groups to adequately evaluate ethnic diversity. The current study provides a model for disentangling factors that contribute to racial differences in outcomes for hematological malignancies and supports the development of interventions that overcome these barriers and improve survival.
Acknowledgements:
Research reported in this publication was supported in part by the Winship Research Informatics Shared Resource of Winship Cancer Institute of Emory University. CRF would like to acknowledge the American Society of Hematology Clinical Research Training Institute (CRTI) program.
Funding Statement: Research reported in this publication was supported by the Burroughs Wellcome Research Fund, the V Foundation, and by the National Cancer Institute of the National Institutes of Health under award number K24 CA208132. Support for this work was also provided by the Winship Research Informatics shared resource of Winship Cancer Institute of Emory University and NIH/NCI under award number P30CA138292. The content is solely the responsibility of the authors and does not necessarily represent the official views of the National Institutes of Health.
Footnotes
Conflicts of Interest:
C.R.F.: Abbvie, Bayer, Celgene (unpaid), Denovo Biopharma, Genentech/Roche (unpaid), Gilead, OptumRx, Karyopharm, MEI Pharmaceuticals, Pharmacyclics/ Janssen, Spectrum
References
- 1.Teras LR, DeSantis CE, Cerhan JR, Morton LM, Jemal A, Flowers CR. 2016 US lymphoid malignancy statistics by World Health Organization subtypes. CA Cancer J Clin. 2016;66: 443–459. [DOI] [PubMed] [Google Scholar]
- 2.Flowers CR, Sinha R, Vose JM. Improving outcomes for patients with diffuse large B-cell lymphoma. CA Cancer J Clin. 2010;60: 393–408. [DOI] [PubMed] [Google Scholar]
- 3.Coiffier B, Thieblemont C, Van Den Neste E, et al. Long-term outcome of patients in the LNH-98.5 trial, the first randomized study comparing rituximab-CHOP to standard CHOP chemotherapy in DLBCL patients: a study by the Groupe d’Etudes des Lymphomes de l’Adulte. Blood. 2010;116: 2040–2045. [DOI] [PMC free article] [PubMed] [Google Scholar]
- 4.Maurer MJ, Ghesquieres H, Link BK, et al. Diagnosis-to-Treatment Interval Is an Important Clinical Factor in Newly Diagnosed Diffuse Large B-Cell Lymphoma and Has Implication for Bias in Clinical Trials. J Clin Oncol. 2018;36: 1603–1610. [DOI] [PMC free article] [PubMed] [Google Scholar]
- 5.Maurer MJ, Habermann TM, Shi Q, et al. Progression-free survival at 24 months (PFS24) and subsequent outcome for patients with diffuse large B-cell lymphoma (DLBCL) enrolled on randomized clinical trials. Ann Oncol. 2018;29: 1822–1827. [DOI] [PMC free article] [PubMed] [Google Scholar]
- 6.Alizadeh AA, Eisen MB, Davis RE, et al. Distinct types of diffuse large B-cell lymphoma identified by gene expression profiling. Nature. 2000;403: 503–511. [DOI] [PubMed] [Google Scholar]
- 7.Bea S, Zettl A, Wright G, et al. Diffuse large B-cell lymphoma subgroups have distinct genetic profiles that influence tumor biology and improve gene-expression-based survival prediction. Blood. 2005;106: 3183–3190. [DOI] [PMC free article] [PubMed] [Google Scholar]
- 8.Choi WW, Weisenburger DD, Greiner TC, et al. A new immunostain algorithm classifies diffuse large B-cell lymphoma into molecular subtypes with high accuracy. Clin Cancer Res. 2009;15: 5494–5502. [DOI] [PMC free article] [PubMed] [Google Scholar]
- 9.Hans CP, Weisenburger DD, Greiner TC, et al. Confirmation of the molecular classification of diffuse large B-cell lymphoma by immunohistochemistry using a tissue microarray. Blood. 2004;103: 275–282. [DOI] [PubMed] [Google Scholar]
- 10.Meyer PN, Fu K, Greiner TC, et al. Immunohistochemical methods for predicting cell of origin and survival in patients with diffuse large B-cell lymphoma treated with rituximab. J Clin Oncol. 2011;29: 200–207. [DOI] [PMC free article] [PubMed] [Google Scholar]
- 11.Rosenwald A, Wright G, Chan WC, et al. The use of molecular profiling to predict survival after chemotherapy for diffuse large-B-cell lymphoma. N Engl J Med. 2002;346: 1937–1947. [DOI] [PubMed] [Google Scholar]
- 12.Reddy A, Zhang J, Davis NS, et al. Genetic and Functional Drivers of Diffuse Large B Cell Lymphoma. Cell. 2017;171: 481–494 e415. [DOI] [PMC free article] [PubMed] [Google Scholar]
- 13.Arthur SE, Jiang A, Grande BM, et al. Genome-wide discovery of somatic regulatory variants in diffuse large B-cell lymphoma. Nat Commun. 2018;9: 4001. [DOI] [PMC free article] [PubMed] [Google Scholar]
- 14.Chapuy B, Roemer MG, Stewart C, et al. Targetable genetic features of primary testicular and primary central nervous system lymphomas. Blood. 2016;127: 869–881. [DOI] [PMC free article] [PubMed] [Google Scholar]
- 15.Schmitz R, Wright GW, Huang DW, et al. Genetics and Pathogenesis of Diffuse Large B-Cell Lymphoma. N Engl J Med. 2018;378: 1396–1407. [DOI] [PMC free article] [PubMed] [Google Scholar]
- 16.Morton LM, Wang SS, Devesa SS, Hartge P, Weisenburger DD, Linet MS. Lymphoma incidence patterns by WHO subtype in the United States, 1992–2001. Blood. 2006;107: 265–276. [DOI] [PMC free article] [PubMed] [Google Scholar]
- 17.Berry J, Caplan L, Davis S, et al. A Black-White Comparison of the Quality of Stage-Specific Colon Cancer Treatment. Cancer. 2010;116: 713–722. [DOI] [PMC free article] [PubMed] [Google Scholar]
- 18.Breslin TM, Morris AM, Gu N, et al. Hospital factors and racial disparities in mortality after surgery for breast and colon cancer. J Clin Oncol. 2009;27: 3945–3950. [DOI] [PMC free article] [PubMed] [Google Scholar]
- 19.Flowers CR, Fedewa SA, Chen AY, et al. Disparities in the early adoption of chemoimmunotherapy for diffuse large B-cell lymphoma in the United States. Cancer Epidemiol Biomarkers Prev. 2012;21: 1520–1530. [DOI] [PMC free article] [PubMed] [Google Scholar]
- 20.Flowers C, Nastoupil L, Bernal-Mizrachi L, Rose A, Sinha R. New Challenges in the Management of Diffuse Large B-Cell Lymphoma. Treatment Strategies – Hematology. 2012;2: 68–73. [PMC free article] [PubMed] [Google Scholar]
- 21.Shenoy PJ, Malik N, Nooka A, et al. Racial differences in the presentation and outcomes of diffuse large B-cell lymphoma in the United States. Cancer. 2011;117: 2530–2540. [DOI] [PubMed] [Google Scholar]
- 22.Flowers CR, Shenoy PJ, Borate U, et al. Examining racial differences in diffuse large B-cell lymphoma presentation and survival. Leuk Lymphoma. 2013;54: 268–276. [DOI] [PMC free article] [PubMed] [Google Scholar]
- 23.Chastain EC, Fisher KE, Bumpers K, et al. Racial Differences in Prognostic Biomarkers of Diffuse Large B-Cell Lymphoma. United States and Canadian Academy of Pathology. 2012: Abstract#1377. [Google Scholar]
- 24.Flowers CR, Nastoupil L, Borate U, et al. Racial Disparities in Cell of Origin Among DLBCL Patients. Blood. 2012;120. [Google Scholar]
- 25.Mani A Local Ancestry Association, Admixture Mapping, and Ongoing Challenges. Circ Cardiovasc Genet. 2017;10. [DOI] [PMC free article] [PubMed] [Google Scholar]
- 26.Bryc K, Durand EY, Macpherson JM, Reich D, Mountain JL. The genetic ancestry of African Americans, Latinos, and European Americans across the United States. Am J Hum Genet. 2015;96: 37–53. [DOI] [PMC free article] [PubMed] [Google Scholar]
- 27.Zhang J, Grubor V, Love CL, et al. Genetic heterogeneity of diffuse large B-cell lymphoma. Proceedings of the National Academy of Sciences. 2013;110: 1398–1403. [DOI] [PMC free article] [PubMed] [Google Scholar]
- 28.Alexander DH, Novembre J, Lange K. Fast model-based estimation of ancestry in unrelated individuals. Genome Res. 2009;19: 1655–1664. [DOI] [PMC free article] [PubMed] [Google Scholar]
- 29.Gao J, Aksoy BA, Dogrusoz U, et al. Integrative analysis of complex cancer genomics and clinical profiles using the cBioPortal. Sci Signal. 2013;6: pl1. [DOI] [PMC free article] [PubMed] [Google Scholar]
- 30.Chang MT, Asthana S, Gao SP, et al. Identifying recurrent mutations in cancer reveals widespread lineage diversity and mutational specificity. Nat Biotechnol. 2016;34: 155–163. [DOI] [PMC free article] [PubMed] [Google Scholar]
- 31.Chakravarty D, Gao J, Phillips SM, et al. OncoKB: A Precision Oncology Knowledge Base. JCO Precis Oncol. 2017;2017. [DOI] [PMC free article] [PubMed] [Google Scholar]
- 32.A predictive model for aggressive non-Hodgkin’s lymphoma. N Engl J Med. 1993;329: 987–994. [DOI] [PubMed] [Google Scholar]
- 33.Bolli N, Avet-Loiseau H, Wedge DC, et al. Heterogeneity of genomic evolution and mutational profiles in multiple myeloma. Nat Commun. 2014;5: 2997. [DOI] [PMC free article] [PubMed] [Google Scholar]
- 34.Zaitlen N, Pasaniuc B, Sankararaman S, et al. Leveraging population admixture to characterize the heritability of complex traits. Nat Genet. 2014;46: 1356–1362. [DOI] [PMC free article] [PubMed] [Google Scholar]
- 35.Morley M, Molony CM, Weber TM, et al. Genetic analysis of genome-wide variation in human gene expression. Nature. 2004;430: 743–747. [DOI] [PMC free article] [PubMed] [Google Scholar]
- 36.Cerhan JR, Berndt SI, Vijai J, et al. Genome-wide association study identifies multiple susceptibility loci for diffuse large B cell lymphoma. Nat Genet. 2014;46: 1233–1238. [DOI] [PMC free article] [PubMed] [Google Scholar]
- 37.Bassig BA, Cerhan JR, Au WY, et al. Genetic susceptibility to diffuse large B-cell lymphoma in a pooled study of three Eastern Asian populations. Eur J Haematol. 2015;95: 442–448. [DOI] [PubMed] [Google Scholar]
- 38.de Miranda NF, Georgiou K, Chen L, et al. Exome sequencing reveals novel mutation targets in diffuse large B-cell lymphomas derived from Chinese patients. Blood. 2014;124: 2544–2553. [DOI] [PMC free article] [PubMed] [Google Scholar]
- 39.Austen B, Powell JE, Alvi A, et al. Mutations in the ATM gene lead to impaired overall and treatment-free survival that is independent of IGVH mutation status in patients with B-CLL. Blood. 2005;106: 3175–3182. [DOI] [PubMed] [Google Scholar]
- 40.Fang NY, Greiner TC, Weisenburger DD, et al. Oligonucleotide microarrays demonstrate the highest frequency of ATM mutations in the mantle cell subtype of lymphoma. Proc Natl Acad Sci U S A. 2003;100: 5372–5377. [DOI] [PMC free article] [PubMed] [Google Scholar]
- 41.Becker-Catania SG, Chen G, Hwang MJ, et al. Ataxia-telangiectasia: phenotype/genotype studies of ATM protein expression, mutations, and radiosensitivity. Mol Genet Metab. 2000;70: 122–133. [DOI] [PubMed] [Google Scholar]
- 42.Cheng Q, Chen J. Mechanism of p53 stabilization by ATM after DNA damage. Cell Cycle. 2010;9: 472–478. [DOI] [PMC free article] [PubMed] [Google Scholar]
- 43.Zhu X, He F, Zeng H, et al. Identification of functional cooperative mutations of SETD2 in human acute leukemia. Nat Genet. 2014;46: 287–293. [DOI] [PMC free article] [PubMed] [Google Scholar]
- 44.Mar BG, Chu SH, Kahn JD, et al. SETD2 alterations impair DNA damage recognition and lead to resistance to chemotherapy in leukemia. Blood. 2017;130: 2631–2641. [DOI] [PMC free article] [PubMed] [Google Scholar]
- 45.Lemonnier F, Couronne L, Parrens M, et al. Recurrent TET2 mutations in peripheral T-cell lymphomas correlate with TFH-like features and adverse clinical parameters. Blood. 2012;120: 1466–1469. [DOI] [PubMed] [Google Scholar]
- 46.Koboldt DC, Kanchi KL, Gui B, et al. Rare Variation in TET2 Is Associated with Clinically Relevant Prostate Carcinoma in African Americans. Cancer Epidemiol Biomarkers Prev. 2016;25: 1456–1463. [DOI] [PMC free article] [PubMed] [Google Scholar]
- 47.Han X, Jemal A, Flowers CR, Sineshaw H, Nastoupil LJ, Ward E. Insurance status is related to diffuse large B-cell lymphoma survival. Cancer. 2014;120: 1220–1227. [DOI] [PubMed] [Google Scholar]
- 48.Ritter AJ, Goldstein JS, Ayers AA, Flowers CR. Rural and urban patients with diffuse large B-cell and follicular lymphoma experience reduced overall survival: a National Cancer DataBase study. Leuk Lymphoma. 2019: 1–12. [DOI] [PMC free article] [PubMed] [Google Scholar]
- 49.Flowers CR, Nastoupil LJ. Socioeconomic disparities in lymphoma. Blood. 2014;123: 3530–3531. [DOI] [PMC free article] [PubMed] [Google Scholar]