

Abstract
China’s Conversion of Cropland to Forest Program (CCFP) is one of the world’s largest Payments for Ecosystem Services (PES) programs. Its socioeconomic-ecological effects are of great interest to both scholars and policy-makers. However, little is known about how the socioeconomic-ecological outcomes of CCFP differ across geographic regions. This study integrates household survey data, satellite imagery, and statistical models to examine labor migration and forest dynamics under CCFP. The investigation is carried out at two mountainous sites with distinct biophysical and socioeconomic conditions, one in a subtropical mountainous region (Anhui) and the other in the semi-arid Loess Plateau (Shanxi). We found divergent CCFP outcomes on migration behavior, stimulating both local- and distant-migration in the Anhui site while discouraging distant-migration in the Shanxi site, after controlling for factors at the individual, household, community and regional levels. Forest recovery is positively associated with distant-migration in Anhui but with local-migration in Shanxi. Contextual factors interact with demographic-socioeconomic factors to influence household livelihoods in both areas, leading to various socio-ecological pathways from CCFP participation to enhanced forest sustainability. Regional differences should therefore be taken into account in the design of future large-scale PES programs.
Keywords: payments for ecosystem services, conversion of cropland to forest program, forest restoration, rural out-migration, contextual factors, social-ecological sustainability
1. Introduction
Human activities have greatly altered the Earth’s land surface, resulting in vast ecosystem degradation (DeFries et al., 2004). This degradation is further exacerbated by numerous other unintended human-induced global environmental changes, including climate change and biodiversity loss, as well as natural hazards with increasing frequency and intensity (Kotiaho et al., 2016; Nagelkerken and Connell, 2015). The persistence of these adverse global environmental changes jeopardizes the continuous provision of vital ecosystem services upon which human welfare depends (Bennett et al., 2015). To safeguard the sustainability of these ecosystem services, Payments for Ecosystem Services (PES) programs have been designed and increasingly incorporated into environmental policies (Chen et al., 2020; CIFOR, 2005; Schirpke et al., 2018; Wunder et al., 2018). The well-known Reduce Emissions from Deforestation and Forest Degradation (REDD+) is one such program that aims to prevent carbon emissions from forests by providing financial incentives to forest-dependent peoples for forest conservation (Mahanty et al., 2013). In most cases, payments are made to smallholders in low-income countries to stimulate changes in their socioeconomic activities to strengthen or at least secure the ecosystem services (Milder et al., 2010).
In the late 1990s, China adopted new forest policies (Zhang et al., 2000) in which PES was an important tool for environmental conservation and restoration following a long history of overexploitation of natural resources (Fang et al., 2018). The new forest policy helped stimulate a forest transition in China (Meyfroidt et al., 2010), with significantly increased forest cover nationwide (FAO, 2015, 2010). As a result, China’s ecological restoration projects accounted for 56% of the country’s total contribution to a carbon sink during 2001–2010 (Lu et al., 2018). Under the new forest policies, the world’s largest PES program, the Conversion of Cropland to Forest Program1 (CCFP), was implemented in 25 of the 31 provinces, municipalities and autonomous regions in China starting in 2000. The CCFP can be viewed as a public PES program, as the Chinese central government compensated farmers for converting their ecologically vulnerable croplands to forests (Bennett et al., 2014). The program targets mountainous low-income areas where soil erosion is often serious, with a secondary goal of rural poverty alleviation (Gutiérrez Rodríguez et al., 2016). Up to 2016, the program had invested a total of $45 billion to “retire” and afforest 30 million ha of farmland and degraded land, affecting about 17% of China’s rural population (Zhang and Putzel, 2016).
Although the CCFP has been shown to improve the natural environment in China, it is facing many socioeconomic challenges (Wu et al., 2019a). By providing financial compensation, the CCFP seeks to stimulate a transformation of rural livelihoods in a sustainable way, so the smallholders would be less dependent on natural resources (Jack et al., 2008). In particular, the CCFP affects household labor allocation because less labor is needed on the farm after marginal cropland is retired (Yao et al., 2010; Yost et al., 2020), so the released labor is available for other income generation activities. Meanwhile, CCFP payment partly compensates for the opportunity cost of income foregone from the retired cropland, providing small financial resources for participating households to use for consumption or to diversify economic activities and sources of income. Since CCFP-participants continue to have full usufruct rights to the growing trees planted on their former cropland parcels (and the land as well), they will be able to reconvert the recently reforested land back to cultivation if and when government compensation ceases. If CCFP forest were to be reconverted back to cropland, the ecosystem services of soil and water conservation provided by the forests would be lost (Song et al., 2014). Therefore, policy-makers hope participating households seek and maintain alternative livelihoods during the years of compensation so that the provision of ecosystem services will continue after compensation ends.
Labor out-migration is an essential livelihood strategy in addition to farm work in rural China (Liang, 2016) as well as in most other developing countries (Anderson and Leiserson, 1980; García-Barrios et al., 2009). Out-migration of farm labor is even more prominent in mountainous regions where croplands were extensively enrolled in the CCFP (Treacy et al., 2018). Households sending out-migrants often expect to receive remittances in return as a source of income (Barbieri et al., 2009; Stark and Bloom, 1985). Migrants usually send back more income (Song et al., 2014) than would have produced working on their cropland (Rimal et al., 2019). Meanwhile, the out-flow of farm labor is likely to further affect how the households use their remaining land and forests (Radel et al., 2019). Liu et al. (2016) found a nonlinear relationship between rural-to-urban migration and farmland use intensity on cultivated land based on data from five mountain cities in China. Oldekop et al. (2018) detected forest recovery during 2000–2010 in Nepal and explained the transition as driven by demographic changes, emphasizing an unneglectable effect of labor out-migration on improving ecosystem dynamics. Ervin et al. (2020) also demonstrated the important role of migration in forest change, although the patterns varied across biomes. In sum, labor out-migration from rural households may significantly influence socio-environmental dynamics, including forest ecosystem restoration and overall rural socioeconomic development.
Previous studies have found strong but complex associations between environmental changes and demographic dynamics (Call et al., 2017; Carr, 2009; Oldekop et al., 2018). Investigators have also observed linkages between the CCFP and labor migration in rural China, which can complicate the assessment of long-term socioeconomic consequences. Evidence from previous studies found that the CCFP may have positive influences on non-agricultural livelihood strategies in some regions, particularly on out-migration often resulting in significant increases in income due to remittances (Lin and Yao, 2014; Wu et al., 2019b). The initial effects of the CCFP include less restrictions on liquidity from the income at the end of the year (Uchida et al., 2009) and idle farm labor, which result in a labor transfer from farm to nonfarm activities (Kelly and Huo, 2013). These changes may be accompanied by other socioeconomic changes, such as an increase in household livelihood resilience (Li and Zander, 2020) and increase in income inequality in the community (Liu et al., 2014). In other regions, however, mixed results and unintended feedbacks have been observed (Komarek et al., 2014; Liang et al., 2012; Wang and Maclaren, 2012; Xie et al., 2018). The study by Li et al. (2011) indicated that in western regions the CCFP might not be as effective in stimulating a shift in farm labor to non-farm employment. In addition, Chen et al. (2019) reported an increase in crop raiding by wildlife due to forest recovery resulting from PES programs, which was regarded as a negative feedback to rural livelihoods. The main reason for such a diversity of outcomes is that the CCFP-livelihood relationship is often complex and perhaps context-dependent, leading to multiple social-ecological pathways towards forest sustainability across geographic regions (Radel et al., 2019; Zinda and Zhang, 2019). Song et al. (2014) compared rural livelihoods under the CCFP in three sites, finding that people’s perceptions of the program depend on the local contexts; but their comparison was primarily descriptive without systematic quantification of the factors contributing to the differences. To the best of our knowledge, no research has systematically examined what role regional differences play, if any, in the socioeconomic and ecological performances of the CCFP. There is also a paucity of understanding of labor out-migration (a socioeconomic process) and subsequent forest dynamics (an environmental process) that has addressed differences across regions.
To fill the aforementioned knowledge gaps, this study investigates whether and how regional differences affect the socioeconomic and ecological outcomes of PES using the case of the CCFP in China. This study covers two contrasting geographic sites, one in the subtropical mountainous region and the other in the semi-arid Loess Plateau of China. As the CCFP has concluded the first round of payments and nearly initiated to the second phase at the time of our data collection (Delang, 2019), it is useful to evaluate its performances in terms of both forest restoration and changing livelihood strategies, especially labor out-migration as the latter is often a central component of household livelihood strategies with long-term implications for origin area forest ecosystem rehabilitation. This research integrates household survey data on the ground with remote sensing data from satellites to address the following question: Do contrasting contextual conditions in different geographic regions results in different outcomes on labor migration and associated forest regeneration under the CCFP? Specific objectives include 1) statistically comparing and modeling migration decisions using multilevel perspectives in both areas, explicitly accounting for regional differences, 2) examining the associations between labor migration and forest dynamics, and 3) exploring social-ecological pathways from PES programs to forest sustainability.
2. Materials and Methods
2.1. Study sites
Our study areas are located in two rural regions in China with distinct biophysical and socioeconomic conditions (Fig. 1). The first study sites, Tiantangzhai Township (115°39′ E∼115°53′ E, 31°8′ N∼31°17′ N), is located in Jinzhai County of Anhui Province in central China. The Township is in the Dabie Mountain Range with a subtropical monsoon climate, which spans a wide geographic ranges in southern China (Han et al., 2011). Jinzhai County is classified by the national government as a county in poverty. The mild weather, with a mean annual temperature of 16.4°C and a mean annual total precipitation of 1350mm, nourishes abundant natural forests consisting of broad-leaf evergreen and deciduous forests. Its topography is characterized by rough terrain with elevations of 363m-1729m above sea level. Tiantangzhai covers an area of 189km2, supporting 4369 households (in 2012) clustered in 165 resident groups (i.e., communities). About a third of the households live below the poverty line. The area is typical of poor communities in the mountainous regions of central China. Historically, farmers in the same resident group used to work together in collective (communal) farms. With the Household Responsibility System implemented in the early 1980s, each household received a lease on land annually from the central government and began to farm independently (Ma et al., 2015). Although their original focus was on growing subsistence crops comprising rice on paddy fields and corn or wheat on drylands, over time the farmers have become increasingly engaged in other agricultural and non-agricultural activities to increase their incomes. These activities include raising small domestic animals, local off-farm work and out-migration for better paid employments. Among the migrants, some moved to nearby places within Jinzhai County, being available to assist on their origin household farm when needed; others migrated out of the county to seek better job opportunities, usually in cities, and much less likely to return or to help with farm work. Since few people move in, Tiantangzhai is considered as a migrant-sending area.
Fig. 1.

Study areas in two geographic regions of China.
Notes: One study area covers Jichang and Checheng Townships in Ji County in Shanxi (upper) and the other is located in Tiantangzhai Township in Anhui (lower), China. The Anhui region has a subtropical monsoon climate with paddy rice being the major crops, while the Shanxi region is in the semi-arid Loess Plateau where farmers plant primarily dryland crops such as corn and manage apple and walnut orchards.
The second study site encompasses part of two geographically contiguous townships, Checheng and Jichang (110°34′ E∼110°57′ E, 36°3′ N∼36°16′ N), located in Ji County, Shanxi Province. The county is situated in the south of Lüliang Mountain with a semi-arid climate characteristic of much of northern China. This area is located in the Loess Plateau with elevation of 830m to 1820m above sea level. The Loess Plateau is a major soil source area in north central China (including Shanxi Province), contributing to the sediment from soil erosion that makes the Yellow River “yellow”. It has much less mean annual precipitation (544mm, or about 35% that of the Anhui site) and a lower mean annual air temperature (10.2°C) than the Anhui site. The total area is 489 km2, with nearly 6,000 households clustered in 95 resident groups. The area is characteristic of the Loess Plateau region, i.e., resident groups have both larger cropland areas and more households (30 to 180) than the Anhui subtropical study site (10 to 40). Due to the semi-arid climate, dryland farming is the only type of agriculture, with corn the major subsistence crop. At the same time, managing apple and/or walnut orchards is another major farming activity, and cash from selling the fruits and nuts often accounts for the lion’s share of agricultural income. Regarding other livelihoods, raising livestock (mainly cattle and goats) in Shanxi is observed. Some households also have members engaged in off-farm work and/or former members who have migrated locally or outside the county, usually to large cities.
The CCFP was put into practice in 2002 in both study sites, with participating households retiring cropland parcels, typically on slopes, for restoring forest ecosystem services in return for receiving payments from the government via a direct deposit to their bank account every year. The payment duration depends on the type of trees planted on the retired cropland parcels, with 8 years for ecological trees (e.g., maple and poplar) and 5 years for economic trees (e.g., walnut) based on the initial contract. After the initial contract period, almost all households renewed their contracts for another 8 or 5 years with the renewed compensation at half of the initial rate. Thus, compensations continued longer for ecological forests (16 years total) than economic forests (10 years total). The payment schemes in the two regions were also different (Chen et al., 2010), with 125 yuan/mu ($229/ha) each year in Anhui and 90 yuan/mu ($165/ha) each year in Shanxi during the surveys ($1=8.2 yuan in 2002; 1mu=1/15 ha). As shown in Table 1, ecological trees (mainly maple, Acer saccharum) prevail over economic trees in the reforested areas at the Anhui site, so participating households rarely obtained extra earnings from the CCFP forests. At the Shanxi site, about half of the cropland was reforested with economic trees, which brought additional incomes for participants after a few years of management. The primary species of ecological and economic CCFP trees in Shanxi were black locust (Robinia pseudoacacia) and walnut (Juglans regia), respectively. In both study areas, as in other targeted policy areas in China (Bennett, 2008), technicians from local governments helped with the implementation of the program. They first identified land parcels considered eligible (e.g., on sloping lands and mostly contiguous to each other) for enrollment, and then persuade the land users to retire those targeted parcels, and assisted the participants to select tree species for reforestation. The selection of tree types was based on local geographic and biophysical conditions and land management practices preferred by farmers to guarantee high tree survival rates (Bennett et al., 2014).
Table 1.
Comparison of CCFP implementation in the two study sites.
| Variable | Anhui | Shanxi |
|---|---|---|
| Percentage of CCFP households in sample | 57.3% | 49.7% |
| Proportion of households with ecological forests among participants | 94.5% | 50.5% |
| Mean area of ecological forests (mu) | 2.03 | 5.32 |
| Mean payments for ecological forests (yuan/year) | 254 | 478 |
| Mean income from ecological forests (yuan/year) | 0 | 0 |
| Proportion of households with economic forests among participants | 7.7% | 56.6% |
| Mean area of economic forests (mu) | 1.53 | 4.99 |
| Mean CCFP compensation for economic forests (yuan/year) in year of survey | 0 | 0 |
| Mean income from economic forests (yuan/year) in year of survey | 0 | 3228 |
Notes: Statistics are based on sample of household surveys comprising 410 and 199 households in Anhui and Shanxi, respectively (Section 3.1. Data collection). Mean incomes from CCFP forests are based on participating households. Mu is a Chinese traditional land size unit, 1mu = 0.0667 ha.
2.2. Data collection and preprocessing
2.2.1. Household and community surveys and fieldwork
Two equivalent household surveys were carried out during June-August 2014 in Anhui and July-August 2015 in Shanxi. A comprehensive questionnaire was designed to cover many topics of interest, including demographic information, socioeconomic conditions, cropland use, agricultural and non-agricultural economic activities, and CCFP participation. University graduate students were recruited and trained as interviewers for one week, followed by several days of pretesting in the field. It took about 1.5 hours for a well-trained interviewer to complete the survey for a typical household.
Due to the relatively low rates of CCFP participation in the study areas (17% in Anhui and 15% in Shanxi), a stratified disproportionate sampling approach (Bilsborrow, 2016; Bilsborrow et al., 1984) was adopted in each area to oversample CCFP participants in order to sample approximately equal numbers of households participating in the CCFP and not participating. A sampling frame was available from the local forestry stations listing all households in the study area by name of head, resident group, and whether participating or not in CCFP. Based on these data, we adopted a two stage disproportionate stratified random sampling. In the first stage, we over-sampled the resident groups with CCFP participation. In the second stage, we strived to sample an equal number of CCFP-participating households and nonparticipants as much as possible. In resident groups with fewer participants than nonparticipants, we over-sampled the participants, and vice versa. The resulting data are presented in Table S1 and Table S2 with a detailed description of the sampling design for the Anhui site found in Song et al. (2018). Similar sampling procedures were used in the Shanxi site, in Checheng and Jichang. All sample households are associated with sampling weights.
For each sample household, the household head, or if not available, another adult household member most knowledgeable about the farm and other household economic activities, was interviewed. During the interview, the house location was recorded with a Global Positioning System (GPS) unit. The final sample sizes with complete data were 481 households in Anhui and 251 households in Shanxi, with CCFP participating rates of 56% and 51%, respectively, in the sample. The surveys provided complete data for 1957 and 948 persons in Anhui and Shanxi, respectively. Short community surveys were also conducted for sample resident groups, interviewing a resident group leader to obtain data at the community level on the presence of paved road, and walking (time) distance to the nearest primary school and health care facility (clinic or hospital).
As migration occurs in many forms and is complex to define, it was crucial to do this clearly, which was done in both the training and in the questionnaire design for both household surveys (Bilsborrow, 2016; Bilsborrow et al., 1984). We defined a migrant as a member of the household who was aged 16–59 at the time of departure when she/he left (since 2002) to reside somewhere else for at least six consecutive months and was still living away from the household at the time of the survey. A distant-migrant (or long-distance migrant) is a migrant who had been living outside the county of her/his origin household, while a local-migrant is a migrant living within the county. Non-migrants are household members aged 16–59 in each year who never lived away from the household for more than six consecutive months in that year. Persons who moved away for less than six consecutive months are considered non-migrants. This involved considerable work in re-constituting the household composition and size according to when people left as migrants and returned, for each year during the reference period of 2002 to the survey date. The goal of this household reconstitution process was to create an appropriate “population at the risk of migration”, comprising all persons in each year living in the household who could be considered at the risk of migration, taking persons aged 16–59 as the age range when they could considered as “adults” likely to be actively involved in the migration decision-making process. To accommodate the local conditions in the two study sites, in this study, the age range was adjusted to 16–55. Hence, in the following analysis, our definition of migrants excluded persons aged 0–15 or over 56 living in the household each year, taking them to be dependent children and the elderly.
This present study is thus based on subsamples of adult individuals aged 16–55 (in any year in the interval in which they were of these ages) who migrated or not after 2002 (the CCFP starting year). The final samples used comprised 1,732 persons from 609 households (Anhui: 1134 persons from 410 households; Shanxi: 598 persons from 199 households). Based on our clear definitions of migration, in the Anhui site, there were 90 local-migrants (7.9%) and 496 distant-migrants (43.7%) among the 1134 individuals (total population of adults 16–55 at risk living in the household in 2014 plus former household members who left at ages 16–55 during the reference period of 2003–2014). In the Shanxi site, among the total of 598 individuals, there were 79 local-migrants, a higher proportion (13.2%) than in Anhui, while the proportion of distant-migration (numbering 148, and 24.7%) was much lower than in Anhui (Fig. S1).
2.2.2. Satellite imagery and spatial data preprocessing
Spatial data included satellite images and digital elevation model (DEM) covering the two areas under study. The Landsat archive offers spatial data widely used for monitoring land use dynamics (Liu et al., 2019; Woodcock et al., 2008). Thus, satellite images from Landsat Operational Land Imager (OLI) and Enhanced Thematic Mapper Plus (ETM+) sensors were acquired from the United States Geological Survey, and the surface reflectance products were utilized2. The images for the Anhui site were captured in the years of 2002 and 2013, while those for the Shanxi site were in 2002 and 2014. These years reflect forest status and changes between the time at the CCFP initial implementation and the time immediately before the household surveys. In addition to the spectral bands, vegetation indices were calculated, including the Enhanced Vegetation Index (EVI), Normalized Difference Water Index (NDWI), Normalized Difference Vegetation Index (NDVI), and Structure Index (SI). DEM was obtained from the shuttle radar topography mission (Farr et al., 2007). Based on the DEM, biophysical variables, including elevation, slope, aspect and topographic wetness index, were computed. Additionally, the elevation of each sample household was derived by overlaying GPS points with the DEM. Detailed information on spatial data and derived indices and their references are provided in Tables S3–S4.
The random forest machine-learning algorithm (Breiman, 2001) was applied for land cover classification and change detection in both study areas. A total of six classes were originally defined, including developed area, forest, water, cropland, barren land and grass. Training samples for classifying the recent images (2013 for Anhui and 2014 for Shanxi) were collected from both GPS points during fieldwork and visually interpreted points from high-resolution Google Earth images. All spectral bands and the aforementioned vegetation or topography indices were included as feature layers. Due to data unavailability of training samples for historical images, the automatic adaptive signature generalization procedure3 (Dannenberg et al., 2016; Gray and Song, 2013), which yields sufficient stable training samples for time series imagery, was employed to classify images in 2002. Classification validation found an overall accuracy of 90% or above for all classified images. Detailed information of classifying images and detecting changes is provided in Zhang et al. (2017). The classified maps were then reclassified to forest and non-forest as the former class is the focus here. Processing and analysis of satellite images was performed in Google Earth Engine (Gorelick et al., 2017).
2.3. Statistical methods used in multilevel mixed-effects modeling
Although local governments implemented the CCFP via targeting land areas and then seeking to persuade households to participate in both study sites, it is still desirable to statistically assess whether there is potential bias caused by household self-selection for participation (Li et al., 2011) when examining policy outcomes. Thus, before modeling migration behavior, it is first desirable to compare individual and household characteristics for households enrolling cropland in CCFP and those not in the two study sites.
To model migration behavior, within one study site, the individual migration decision (M) (whether a household member aged 16–55 migrates or not) is a function of factors measured at three levels, individual attributes (I), household characteristics (H), and community factors (C) (Bilsborrow et al., 1984; Bilsborrow and Henry, 2012; Findley, 1987; Henry and Dos Santos, 2013). When involving another geographical area, the regional differences (D) may be intermingled with other factors specific to each geographic location, such as natural resource endowments and local transportation infrastructure. Thus, a multilevel mixed-effects model approach is appropriate for data with a hierarchically nested structure (Goldstein et al., 1993; Pan and Bilsborrow, 2005). Such a model was adopted for estimating the determinants of migration here. A general migration formula is M = f (I, H, C, D), with the specific model as:
| (1) |
where Mijk is the migration decision (0=non-migration, 1=local-migration, 2=distant-migration) of individual i from household j in resident group k, and xt is the tth predictor among all the T explanatory variables at each level. The parameters β0 and βt capture the fixed intercept and fixed effects of xt, respectively. A dummy variable (D) indicates the study site (0=Anhui, 1=Shanxi), so θt is the additional effects of the specific predictors in Shanxi (D=1) compared to those in Anhui (D=0), while ξ is the overall systematic differences between the two regions. The error term εijk captures the random effect at the individual level. The model also allows for unexplained cluster variance across resident groups captured by the random effect µ0k at the community level, which is assumed to have a normal distribution, µ0k ~ N(0, τ02). Based on this equation, regional differences are incorporated in both the intercept and slopes of predictors, where the intercept reflects the overall differences in socioeconomic (e.g., household income, culture) and biophysical (e.g., mountain landscape) settings while the differences in slopes reveal how the different context leads to differences in the effects of explanatory variables.
Guided by insights from the literature (Barbieri et al., 2009; Bilsborrow, 2002; Gibson and Goody, 1958; Lee, 1966; Massey, 1990; Stark and Bloom, 1985) and empirical research as reviewed above, a theoretical framework of the determinants of migration is presented in Fig. 2, showing the explanatory variables at multiple levels. Based on this figure, potentially relevant explanatory variables for modeling the determinants of labor migration were selected from the data in the household surveys, and listed in Table 2. The PES-related variable, in Eq. (2), is income received at the household from the CCFP. As payments for economic trees planted had already ended in both study sites by the time of the surveys, CCFP-participating households received subsidies only for ecological forests. Thus, the income attributable to the program is the sum of both the actual cash subsidy payment plus earnings from the products sold from CCFP-induced forests, such as from selling walnuts in the Shanxi case. This explanatory variable (referred to as CCFP income) captures the total gross economic benefits from participating in CCFP, which is affected by the nature of program implementation even after subsidies ended4 (Song et al., 2014).
| (2) |
where, given a parcel l among totally L CCFP land parcels, IncomeCCFP is the total income gained from the CCFP forest in a household. The variable of Rate denotes the payment rate for one unit area of CCFP forest with its value being 125 yuan/mu in Anhui and 90 yuan/mu in Shanxi. The indicator of Tree represents the tree type planted in a parcel with its value being 1 for economic trees and 0 for ecological trees. Finally, Price and Harvest are the unit sale price and the amount of sold products harvested from economic trees.
Fig. 2.
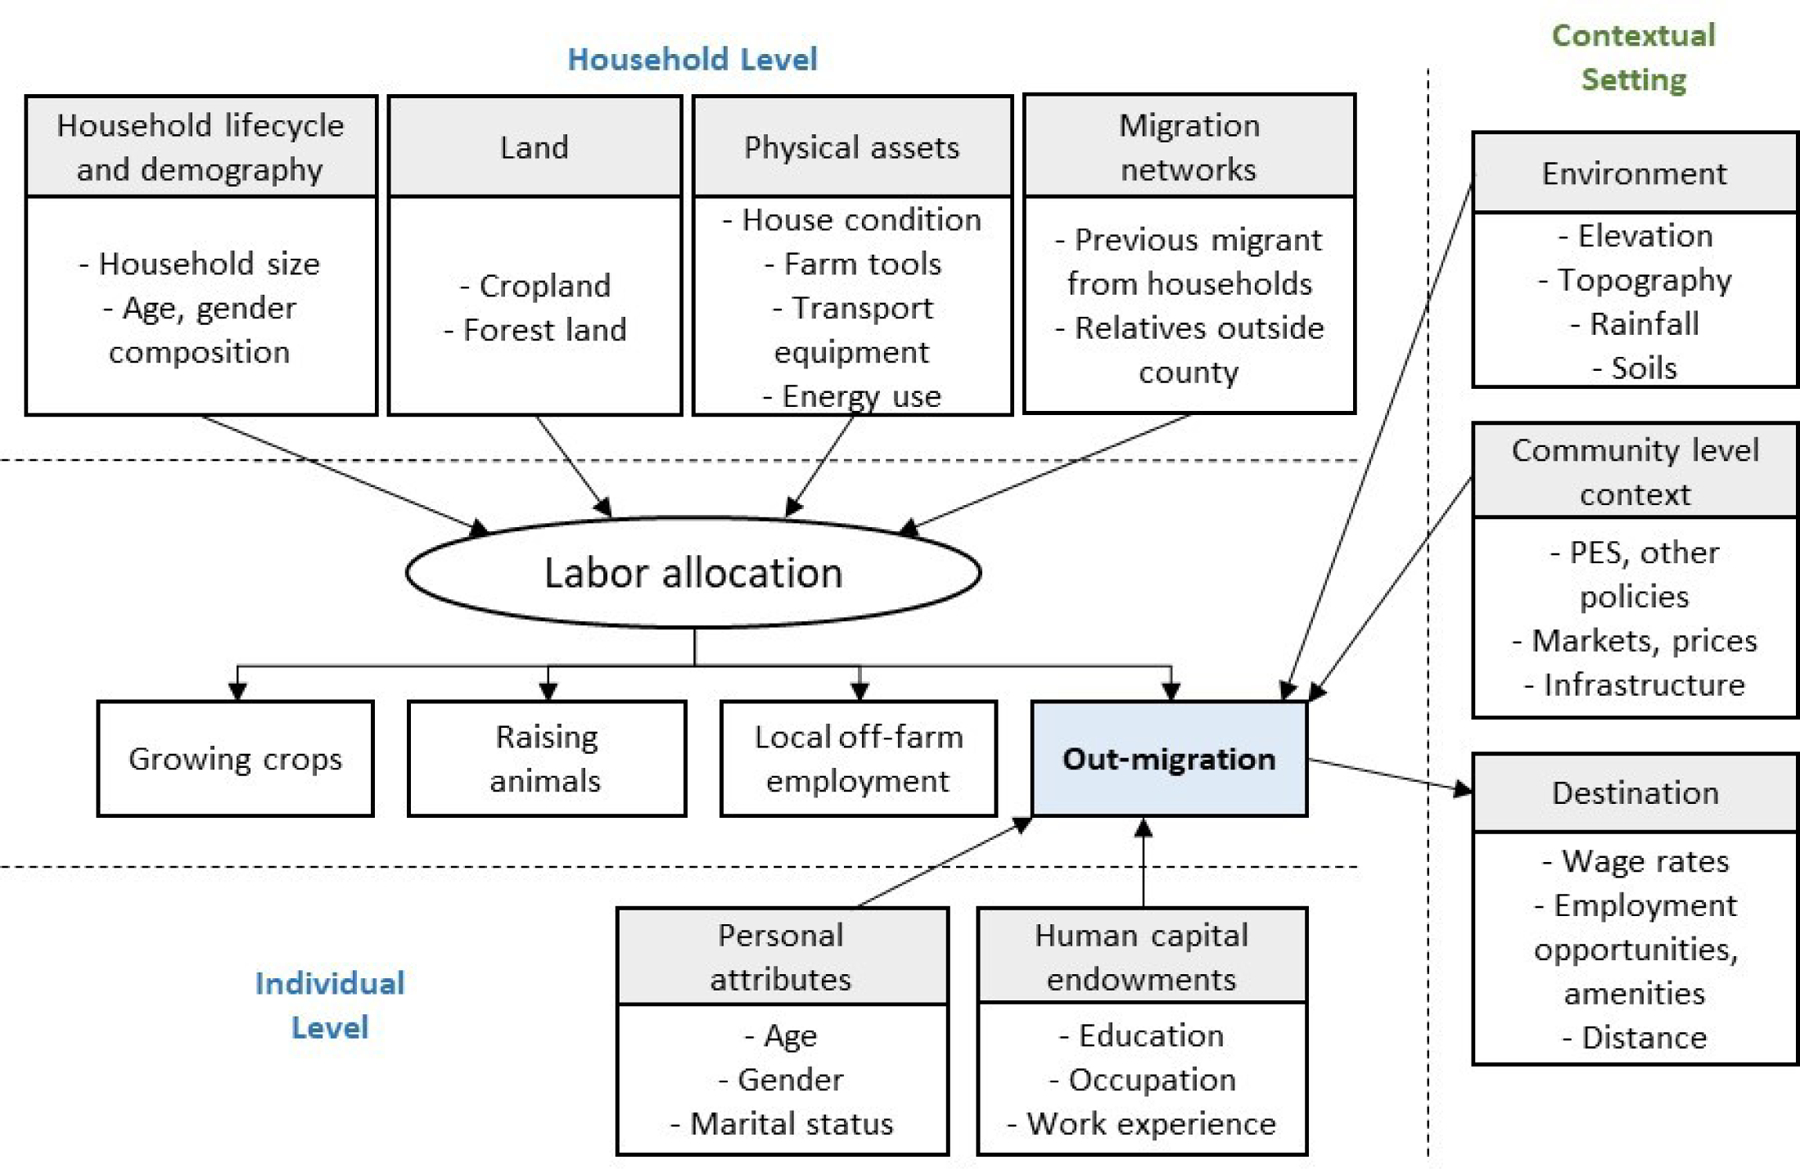
Theoretical framework for individual migration choices.
Table 2.
Descriptions and statistical summary of explanatory variables.
| Variable | Description | Mean (SD) | |
|---|---|---|---|
| Anhui | Shanxi | ||
| Person level | |||
| Female | 1=female, 0=male | 0.52 (0.50) | 0.49 (0.50) |
| Adult age*** | Individual aged 16–55 | 35.09 (12.41) | 33.35 (12.31) |
| Education*** | Individual has higher education than completed elementary school (1=yes, 0=no) | 0.64 (0.48) | 0.88 (0.32) |
| Married*** | Marital status (1=currently married, 0=not married) | 0.71 (0.45) | 0.63 (0.48) |
| Household level | |||
| CCFP income*** | Income from CCFP (100yuan/year) | 1.43 (1.94) | 10.45 (40.24) |
| Head’s age*** | Household head’s age | 49.22 (9.05) | 44.95 (9.47) |
| Head’s education*** | Household head has higher education than elementary school (1=yes, 0=no) | 0.57 (0.50) | 0.68 (0.47) |
| Elevation*** | Household elevation (100m) | 6.75 (1.03) | 10.02 (1.21) |
| Size*** | Number of persons currently living in household | 3.74 (1.22) | 3.90 (1.20) |
| Wealth*** | Indicator of household wealth score (0–35) | 21.08 (4.86) | 19.95 (3.98) |
| Destination*** | Indicator of mean score of migration destination by all family members (0–5) | 1.84 (1.35) | 1.34 (1.15) |
| Travel time *** | Mean travel time to migration destinations of household members and former members (in hours) | 2.99 (2.37) | 1.26 (1.71) |
| Network*** | Previous migration experience of household members (1=yes, 0=no) | 0.33 (0.47) | 0.12 (0.32) |
| Cropland*** | Non-abandoned land in crops (mu) | 5.47 (2.77) | 12.22 (11.11) |
| Animals*** | Household raises domestic animals or livestock (1=yes, 0=no) | 0.85 (0.36) | 0.35 (0.48) |
| Nonfarm*** | Some member of household engaged in non-agricultural work in local area (1=yes, 0=no) | 0.60 (0.49) | 0.70 (0.46) |
| Group level | |||
| Group size*** | Size of resident group (number of households) | 26.03 (8.65) | 77.18 (39.15) |
| Hospital*** | Time to walk to nearest health service facility (minutes) | 18.74 (15.46) | 13.68 (10.18) |
| School*** | Time to walk to nearest elementary school (minutes) | 19.56 (24.36) | 22.08 (15.81) |
p < 0.01.
Notes: SD denotes standard deviation.
A wealth index was developed as a measure of the overall dwelling and living conditions of the household, encompassing a number of specific indicators including materials of house, energy use, possession of assets, etc. The wealth index is the sum of the scores of the various categories, or dimensions of living conditions, with details on the scoring found in Wang et al. (2019). Regarding the migration destinations, all reported destinations are reclassified and scored based on the population size of each city (Table S5), with a larger population size rendering a higher score. The mean of destination scores of all former household members living away (although rarely more than one or two) is calculated as a household variable. This score is intended to reflect the economic opportunity obtained by migrants from the household. In addition to economic opportunities, migration decisions are also influenced by the distance from the origin to the destination places. Hence, we also derived estimates of mean travel time of out-migrants from the household (assuming travel by vehicle based on main highways viewable on Google Map) from the study site to the destination city for each long distant-migrant (see Appendix B). Robust tests of the time variable were performed by replacing estimated travel time with travel distance (see Appendix B). Descriptive statistics suggest that migrants from the Anhui site tend to go to large cities or megacities which are relatively close, while out-migrants from the Shanxi site are more evenly distributed in cities of different sizes across varying distances (Fig. S2). These two factors, estimated travel time plus economic opportunities, thus should be controlled to isolate the effects of the CCFP.
The explanatory variables with their definitions and means for both study sites are provided in Table 2. It should be noted that time varying variables (e.g., age) were collected or reconstructed to refer to the year just before the migration in order to be considered as factors potentially affecting the migration decision. Except for gender, all explanatory variables including CCFP income were statistically different (p<0.01) between the two study sites of Anhui and Shanxi, reflecting systematic differences in socio-demographic characteristics, geophysical conditions and CCFP implementations between the two geographic regions. Analysis of Variance (ANOVA) was used with t-tests to compare the explanatory variables among non-migrants, local-migrants and distant-migrants.
From Eq. (1), the additional contextual effects resulting when switching from the Anhui site to the Shanxi site are captured by adding interactive terms of the regional dummy variable and the predictors. For example, for an explanatory variable x, the effect in the Shanxi site (i.e., its estimated coefficient) is the sum of the effect in the Anhui site (β) and the interactive effect (θ), and the corresponding variance can be estimated as Var(β+θ|x) = Var(β|x) + Var(θ|x) + 2Cov(β,θ|x), where Var() and Cov() denote variance and covariance, respectively, and the standard error is the square root of the variance. To further examine the interactive effects of region and CCFP implementation, predictive margins (Williams, 2012) were calculated for each migration choice under various levels of CCFP income with all the other explanatory variables set at their means. The modeling and post-estimation processes were performed using STATA 14.0.
2.4. Non-spatial and spatial modeling
Both non-spatial and spatial models were used to examine associations between migration choices and reforestation trends. For the non-spatial analysis, univariate ordinary least square (OLS) regression was adopted for the overview of global correlations between migration behavior and forest regeneration, and difference in such correlations between the two geographic regions. The OLS model is formulated as:
| (3) |
where the subscript D indicates the region of Anhui or Shanxi; Migrationj denotes the Migration-related variables for household j, while ∆Forestj denotes the difference in a given remote sensing based forest index value between the initial and final years of the study period around household j. The parameters of α and γ are the intercept and slope corresponding to the migration variable; ηj is the error term associated with household j.
Migration-related variables that were used as independent variables include the numbers of non-migrants, local-migrants, distant-migrants, out-migrants (the sum of local and distant migrants) per household, as well as sum and mean of the destination scores of household members or former members (Table S5). Two indices representing forest dynamics were derived from satellite images, including 1) changes in percentage of forest cover and 2) changes in forest Enhanced Vegetation Index (EVI) density, for the area surrounding the household (defined as a circular buffer). EVI is a remote sensing index widely used for measuring the greenness of vegetation, as described in Table S4 (Huete et al., 1997). Mean values of EVI are calculated only for the pixels classified as forest. The radius of the buffer was set at 300 meters because it best depicts the range of daily farmers’ activities, based on discussions with interviewees during the surveys. To justify the buffer distance, sensitivity analysis was conducted to compare model performances with radius ranges from 100m to 700m at a step of 100m (Fig. S3). Based on the customary clustering of households in resident groups, this procedure could lead to similar values for many households in the same resident group, which could lead to large bias. To minimize such bias, a spatial random subsampling approach based on the observation density (Fithian and Hastie, 2013) was used to refine the sample distribution. The resulting subsample sizes for the Anhui and Shanxi sites were both 70, with geo-locations scattered over their study areas.
The forest variables involve interesting spatial features. Tests of spatial autocorrelation suggest there exist spatially clustered patterns for both changes in forest coverage and changes in forest EVI values, with global Moran’s I statistics all above 0.35 at the 0.1% significance level. Thus, a spatial regression model, Geographically Weighted Regression (GWR), which is capable of capturing spatially varying local relationships (Berman and Diggle, 1989; Sannigrahi et al., 2020), was applied to model the migration-forest relationships. The formula is as follows:
| (4) |
where α(uh, vh) and γ(uh, vh) are intercept and slope, respectively, at location j with a coordinate of (uh, vh) in the spatial domain, and the residential error is also specific to location h. The neighboring spatial domain demarcated by a kernel with an adaptive width for each data point was defined using cross validation. With the estimated non-stationary relationships, the final forest-migration dynamic outputs could be exhibited in a spatially explicit way. The spatial (GWR) and non-spatial (OLS) models were estimated by ArcMap 10.5 and R programming, respectively.
3. Results
3.1. Household self-selection for CCFP participation
Comparing CCFP participants and nonparticipants in Table 3 shows that both individual and household characteristics are almost all remarkably similar in both study sites, except for elevation in the site of Anhui (Table 3). At the Anhui site (Tiantangzhai), compared to nonparticipants, CCFP-participating households are generally located at higher elevations (mean diff = 46m, p < 0.05) where cropland parcels were more likely to have been targeted for the program by local governments. Thus, for Anhui household elevation should be controlled to isolate the policy effects. All other variables exhibit no significant differences in means between participants and nonparticipants in both study sites. Overall, this suggests that there is no significant bias from self-selection in terms of individual attributes and household characteristics.
Table 3.
Comparisons of CCFP-participating households and nonparticipants in study sites.
| Features | Anhui | Shanxi | ||||
|---|---|---|---|---|---|---|
| CCFP participants | Non-participants | Difference in means | CCFP participants | Non-participants | Difference in means | |
| Individual (aged 16–55) | N=662 | N=472 | N=324 | N=274 | ||
| Proportion of females | 0.50 (0.50) | 0.53 (0.50) | −0.03 | 0.47 (0.50) | 0.51 (0.50) | −0.04 |
| Person’s age | 34.8 (12.4) | 35.4 (12.4) | −0.60 | 33.5 (12.5) | 33.2 (12.0) | 0.30 |
| Education, years | 6.97 (3.54) | 6.90 (3.66) | 0.07 | 8.09 (3.25) | 8.09 (3.59) | −0.01 |
| Proportion married | 0.71 (0.45) | 0.72 (0.45) | 0.00 | 0.61 (0.49) | 0.66 (0.48) | −0.05 |
| Household | N=235 | N=175 | N=99 | N=100 | ||
| Household size | 2.93 (1.39) | 3.01 (1.33) | −0.08 | 3.13 (1.55) | 2.95 (1.27) | 0.18 |
| Number of adults aged 16–55 | 2.82 (0.98) | 2.70 (0.99) | 0.12 | 2.97 (1.12) | 2.74 (1.18) | 0.23 |
| Number of female adult aged 16–55 | 1.42 (0.71) | 1.44 (0.69) | −0.02 | 1.55 (0.85) | 1.41 (0.78) | 0.14 |
| Adults with primary school completed (5+) | 0.64 (0.30) | 0.63 (0.34) | 0.01 | 0.87 (0.26) | 0.83 (0.31) | 0.04 |
| Head’s age | 49.5 (9.76) | 49.1 (9.60) | 0.38 | 46.1 (9.2) | 43.0 (12.8) | 3.09 |
| Head’s education, years | 6.24 (2.84) | 5.93 (3.12) | 0.31 | 7.08 (3.07) | 7.02 (3.08) | 0.06 |
| Elevation (100m) | 6.93 (1.08) | 6.48 (0.88) | 0.46** | 10.2 (1.19) | 9.82 (1.27) | 0.34 |
| Per capita cropland (mu) | 1.96 (1.80) | 1.70 (1.49) | 0.27 | 3.73 (3.04) | 2.69 (4.55) | 1.04 |
| Wealth score (0–35) | 20.9 (5.0) | 20.5 (4.9) | 0.41 | 19.7 (4.2) | 19.3 (3.9) | 0.36 |
| Proportion of households raising animals | 0.85 (0.36) | 0.81 (0.40) | 0.05 | 0.41 (0.50) | 0.29 (0.46) | 0.12 |
| Mean income from local off-farm work (100yuan) | 132 (241) | 127 (169) | 5.10 | 104 (148) | 85 (123) | 19.4 |
p < 0.05
Notes: Standard deviations are shown in parentheses.
3.2. Descriptive analysis of differences in migrant destinations
Most explanatory variables differ significantly among non-migrants, local-migrants and distant-migrants in each study site as well as between the two sites (Table 4). Compared to the Shanxi site, people at the Anhui site are slightly older with less education; households have slightly more wealth and considerably more migration networks from previous migration of household members and more likely to keep domestic animals. However, households in the Anhui site are located at lower altitudes, have much smaller areas of cropland, live in communities with smaller sizes, and are located farther from health facilities but slightly closer to primary schools. For all other variables, there are no significant differences between the two sites except for CCFP income, distance and travel time to migration destinations. Regarding the three migrant-status groups (non-migrants, local-migrants, and distant-migrants), ANOVA analysis reveals significant difference in many variables among them in both sites. For personal attributes, migrants are better educated, younger and more likely single than non-migrants; female migrants tend to be local-migrants and males more likely distant-migrants. Migrants come from households with older heads, lower wealth and fewer domestic animals (Anhui only), and with more migration networks and less off-farm work.
Table 4.
Statistical comparisons in means and standard deviations of explanatory variables among migration groups between Anhui and Shanxi sites.
| Variable | Anhui Site (0) | Shanxi Site (1) | Anhui (0) - Shanxi (1) | ||||||||
|---|---|---|---|---|---|---|---|---|---|---|---|
| Non (n=548) | Local (n=90) | Distant (n=496) | ANOVA (p-value) | Non (n=371) | Local (n=79) | Distant (n=148) | ANOVA (p-value) | Diff. Non | Diff. Local | Diff. Distant | |
| Person | |||||||||||
| Female | 0.56 (0.50) | 0.68 (0.47) | 0.44 (0.50) | 0.000 | 0.51 (0.50) | 0.57 (0.50) | 0.41 (0.49) | 0.050 | 0.06* | 0.11 | 0.02 |
| Adult age | 42.24 (9.68) | 27.13 (10.52) | 28.65 (10.92) | 0.000 | 39.50 (10.75) | 24.68 (7.18) | 22.55 (6.61) | 0.000 | 2.73*** | 2.45* | 6.09*** |
| Education | 0.45 (0.50) | 0.78 (0.42) | 0.81 (0.39) | 0.000 | 0.85 (0.36) | 0.92 (0.27) | 0.95 (0.23) | 0.004 | −0.39*** | −0.15*** | −0.13*** |
| Married | 0.88 (0.33) | 0.44 (0.50) | 0.58 (0.49) | 0.000 | 0.84 (0.36) | 0.46 (0.50) | 0.20 (0.40) | 0.000 | 0.03 | −0.01 | 0.38*** |
| Household | |||||||||||
| CCFP income | 1.21 (1.72) | 2.00 (2.54) | 1.56 (2.03) | 0.000 | 12.11 (47.28) | 6.16 (23.75) | 8.60 (25.13) | 0.398 | −10.90*** | −4.16 | −7.04*** |
| Head’s age | 47.06 (8.23) | 48.36 (8.07) | 51.77 (9.43) | 0.000 | 44.72 (9.70) | 44.38 (10.78) | 45.84 (8.02) | 0.401 | 2.34*** | 3.98*** | 5.92*** |
| Head’s education | 0.55 (0.50) | 0.57 (0.5) | 0.59 (0.49) | 0.278 | 0.67 (0.47) | 0.70 (0.46) | 0.70 (0.46) | 0.819 | −0.13*** | −0.13* | −0.10** |
| Elevation | 6.80 (1.03) | 6.88 (1.03) | 6.67 (1.05) | 0.059 | 10.00 (1.22) | 10.10 (1.08) | 10.03 (1.27) | 0.792 | −3.20*** | −3.22*** | −3.36*** |
| Size | 3.68 (1.22) | 3.92 (1.27) | 3.76 (1.21) | 0.186 | 3.86 (1.24) | 4.08 (1.11) | 3.93 (1.13) | 0.327 | −0.17** | −0.15 | −0.17 |
| Wealth | 21.30 (4.43) | 19.96 (5.64) | 21.03 (5.13) | 0.049 | 19.94 (3.74) | 20.52 (4.59) | 19.66 (4.19) | 0.297 | 1.36*** | −0.56 | 1.38*** |
| Destination | 1.09 (0.90) | 1.33 (0.83) | 2.77 (1.27) | 0.000 | 0.68 (0.68) | 0.86 (0.56) | 1.62 (0.83) | 0.000 | 0.40*** | 0.48*** | 1.15*** |
| Travel time | 1.79 (1.66) | 2.29 (1.34) | 4.43 (2.38) | 0.000 | 0.90 (1.33) | 0.60 (1.11) | 2.49 (2.15) | 0.000 | 0.89*** | 1.69*** | 1.94*** |
| Network | 0.24 (0.43) | 0.47 (0.50) | 0.41 (0.49) | 0.000 | 0.09 (0.28) | 0.10 (0.30) | 0.20 (0.40) | 0.001 | 0.16*** | 0.37*** | 0.20*** |
| Cropland | 5.59 (2.69) | 5.43 (3.07) | 5.36 (2.81) | 0.413 | 12.39 (11.18) | 11.52 (10.99) | 12.17 (11.04) | 0.817 | −6.80*** | −6.08*** | −6.81*** |
| Animals | 0.90 (0.30) | 0.78 (0.42) | 0.81 (0.39) | 0.000 | 0.33 (0.47) | 0.39 (0.49) | 0.37 (0.48) | 0.439 | 0.57*** | 0.39*** | 0.44*** |
| Nonfarm | 0.69 (0.46) | 0.56 (0.50) | 0.50 (0.50) | 0.000 | 0.72 (0.45) | 0.57 (0.50) | 0.70 (0.46) | 0.027 | −0.03 | −0.01 | −0.20*** |
| Group | |||||||||||
| Group size | 25.85 (8.61) | 25.44 (8.49) | 26.32 (8.74) | 0.546 | 76.56 (39.39) | 80.24 (39.46) | 77.12 (39.57) | 0.750 | −50.70*** | −54.80*** | −50.80*** |
| Hospital time | 18.22 (15.46) | 19.66 (13.85) | 19.16 (15.73) | 0.520 | 13.89 (10.05) | 12.23 (10.53) | 13.92 (10.33) | 0.398 | 4.33*** | 7.43*** | 5.24*** |
| School time | 19.83 (25.48) | 16.78 (19.03) | 19.76 (23.96) | 0.529 | 22.34 (15.86) | 21.89 (16.76) | 21.54 (15.24) | 0.869 | −2.50* | −5.11* | −1.78 |
p < 0.05
p <0.01
Notes: Statistically significant (p<0.05) differences of ANOVA tests are highlighted in bold. “Diff.” denotes difference in means of variables. Values in parentheses below means are standard deviations.
Means and variances of CCFP income are shown in Table 4 for all three migrant-status groups for both sites. At the Anhui site mean CCFP incomes are far smaller for all groups than those at the Shanxi site, showing the large differences in household income contributions from the CCFP between the two sites (mostly due to economic trees grown in Shanxi). At the same time, migrant households in Anhui receive higher CCFP incomes than non-migrant households, with little difference between the local- and distant-migrant groups. At the Shanxi site, however, households with migrants have lower gains from CCFP than non-migrants, albeit insignificantly.
3.3. Dynamics of forest cover and tree growth
Changes in land use and land cover and EVI reveals substantial reforestation during 2002–2013/2014 (Fig. 3). In both study sites, forest area increased accompanied by enhanced greening since the implementation of the CCFP. Statistically, the proportion of the study area in forest cover increased from 66.4% to 72.5% in Tiantangzhai (Anhui) and from 57.9% to 63.2% in Checheng and Jichang (Shanxi). The overall greenness of the landscape measured by EVI shows remarkable differences between the two sites. In Tiantangzhai the small area declining in greenness occurred mostly in the residential area, along the major paved road, and in some agricultural areas; the enhanced greening appears mainly high up in the mountains. In Checheng and Jichang (Shanxi), a large area of forests experienced both greening enhancement and area expansion, which could be partially attributed to new CCFP forests (mostly economic trees) that had been well managed by local residents.
Fig. 3.

Changes in land cover and enhanced vegetation index in Tiantangzhai of Anhui and Checheng & Jichang of Shanxi.
3.4. Influence of CCFP on individual migration
Based on the multilevel modeling results, CCFP income has statistically significant effects on individual migration behaviors but the effects are quite different for the two study sites (Table 5 and Table S6). In the Anhui site, after controlling for all the other factors at three levels, we find that an additional 100 yuan ($12.2) of CCFP income increases the likelihood of local- and distant-migration (versus non-migration) by 23.9% and 10.5%, respectively. But the same additional CCFP income in Shanxi actually slightly decreases the probability of labor out-migration, particularly distant-migration with 0.4% less likely than no migration at all. Robustness tests find such effects remain statistically significant even after replacing the travel time with distance to destination cities (Table S7). In addition, the intercept dummy variable that reflects any remaining systematic differences between Anhui and Shanxi after other factors are controlled is not statistically significant, implying that the important contextual differences (e.g., differences in economic opportunities between the Yangtze River Delta and the Loess Plateau) are mostly captured through the observable variables in the model. This is evident from the fact that the intercept dummy D is statistically significant if the two variables for mean household destination score and mean travel time to destination cities are removed, although the effects of CCFP remain robust (Table S8). These results suggest that the CCFP has stimulated both local-migration and distant-migration at the Anhui site in search for better opportunities, while it has slightly demotivated labor distant-migration at the Shanxi site. Such different effect are due to unmeasured contextual factors in the two mountainous regions.
Table 5.
Estimated results of mixed-effects logistic model for individual migration with multilevel influencing factors.
| Variable | Full Model: Tiantangzhai (Anhui) | Checheng & Jichang (Shanxi) | ||||||
|---|---|---|---|---|---|---|---|---|
| Local-migration | Distant-migration | Local-migration | Distant-migration | |||||
| Coef. | SE | Coef. | SE | Coef. | SE | Coef. | SE | |
| Individual | ||||||||
| Female | −0.199 | 0.303 | −1.851*** | 0.330 | 0.307 | 0.407 | −0.480 | 0.368 |
| Adult age | −0.139*** | 0.023 | −0.211*** | 0.017 | −0.173*** | 0.045 | −0.222*** | 0.044 |
| Education | 0.767 | 0.780 | 0.260 | 0.391 | −1.357** | 0.599 | −2.745*** | 1.055 |
| Married | −0.780 | 0.628 | 0.503 | 0.648 | −0.977 | 1.210 | −0.586 | 0.490 |
| Household | ||||||||
| CCFP income | 0.239** | 0.112 | 0.105** | 0.048 | −0.019 | 0.014 | −0.004* | 0.002 |
| Head’s age | 0.040 | 0.028 | 0.092*** | 0.020 | 0.052** | 0.024 | 0.070** | 0.035 |
| Head’s education | 0.846 | 0.717 | 0.158 | 0.380 | 0.710 | 0.517 | 0.380 | 0.347 |
| Elevation | −0.106 | 0.325 | −0.123 | 0.240 | 0.361 | 0.342 | 0.188 | 0.262 |
| Size | 0.709*** | 0.154 | 0.276 | 0.173 | 0.353 | 0.304 | −0.362 | 0.239 |
| Wealth | −0.110** | 0.046 | −0.011 | 0.028 | 0.074 | 0.077 | −0.042 | 0.057 |
| Destination | −0.673 | 0.596 | 2.478*** | 0.283 | 4.393*** | 0.433 | 4.918*** | 0.468 |
| Travel time | 0.487** | 0.223 | 0.107 | 0.122 | −2.525*** | 0.487 | −0.934*** | 0.135 |
| Network | 2.088*** | 0.539 | 0.069 | 0.470 | −0.536 | 0.713 | −0.677 | 0.515 |
| Cropland | −0.102 | 0.119 | −0.125* | 0.064 | −0.010 | 0.023 | 0.013 | 0.011 |
| Animals | −0.496 | 0.735 | −0.341 | 0.320 | −0.060 | 0.652 | 0.102 | 0.276 |
| Nonfarm | −1.970** | 0.867 | −1.391*** | 0.520 | −1.702** | 0.670 | −0.269 | 0.661 |
| Group | ||||||||
| Group size | 0.036 | 0.035 | 0.040 | 0.028 | −0.003 | 0.007 | −0.010 | 0.006 |
| Hospital time | 0.035** | 0.016 | 0.009 | 0.009 | −0.044 | 0.036 | −0.029 | 0.027 |
| School time | −0.012 | 0.008 | −0.001 | 0.006 | 0.045 | 0.042 | −0.001 | 0.036 |
| Region | ||||||||
| Site (D) | −4.877 | 6.358 | 3.767 | 4.512 | ||||
| Interaction - Individual | ||||||||
| Female × D | 0.507 | 0.506 | 1.371*** | 0.494 | ||||
| Age × D | −0.035 | 0.051 | −0.011 | 0.048 | ||||
| Education × D | −2.123** | 0.990 | −3.005*** | 1.126 | ||||
| Married × D | −0.197 | 1.359 | −1.089 | 0.812 | ||||
| Interaction - Household | ||||||||
| CCFP income × D | −0.258** | 0.113 | −0.110** | 0.048 | ||||
| Head’s age × D | 0.012 | 0.037 | −0.022 | 0.040 | ||||
| Head’s education × D | −0.136 | 0.883 | 0.222 | 0.511 | ||||
| Elevation × D | 0.467 | 0.463 | 0.311 | 0.345 | ||||
| Size × D | −0.356 | 0.340 | −0.638** | 0.295 | ||||
| Wealth × D | 0.183** | 0.090 | −0.031 | 0.064 | ||||
| Destination × D | 5.066*** | 0.735 | 2.440*** | 0.545 | ||||
| Travel time × D | −3.012*** | 0.535 | −1.042*** | 0.183 | ||||
| Network × D | −2.624*** | 0.892 | −0.746 | 0.696 | ||||
| Cropland × D | 0.092 | 0.121 | 0.137** | 0.064 | ||||
| Animals × D | 0.436 | 0.987 | 0.443 | 0.427 | ||||
| Nonfarm × D | 0.268 | 1.090 | 1.122 | 0.841 | ||||
| Interaction - Community | ||||||||
| Group size × D | −0.039 | 0.035 | −0.050* | 0.029 | ||||
| Hospital time × D | −0.079** | 0.039 | −0.038 | 0.029 | ||||
| School time × D | 0.057 | 0.043 | 0.000 | 0.036 | ||||
| Intercept | 0.657 | 2.099 | −0.753 | 2.419 | ||||
| Group Variance | 0.838 | 0.450 | ||||||
p < 0.10;
p < 0.05;
p <0.01
Notes: Full Model includes a dummy variable D to use for both the intercept and slopes of coefficients when interacting with variables, with D=1 for Shanxi site (reference is Anhui site). The symbol of “×” denotes interaction between an independent variable and the dummy variable. Conditional effects indicate effects derived based on the full model results and the variance-covariance matrices (Table S7) for the individual sample at the Shanxi site. “Coef.” denotes coefficient and “SE” the robust standard errors resulting from the data being weighted, as is appropriate.
The predicted probabilities of migration, combining the direct effects plus interaction effects, reveal nonlinear responses of migration to different levels of CCFP income (Fig. 4). As CCFP income rises, the predicted probabilities of distant-migration from the Anhui site and local-migration from the Shanxi site are substantially altered. Specifically, individuals from the Anhui site are even more likely to be distant-migrants at higher CCFP income levels, which is statistically significant from 800 yuan ($98) or higher. At the Shanxi site, individuals are inclined to migrate locally once CCFP income exceeds 300 yuan ($37), with the predicted probabilities of migration continuing to be high and significant up to 2800 yuan ($342), after which the probability becomes insignificant. Other relationships of migration decisions and CCFP income levels are generally consistent with modeling outcomes, as expected, albeit with relatively low significance levels.
Fig. 4.

Predicted probabilities of non- migration, local- migration and distant-migration, according to the level of CCFP income in the two study areas.
Notes: The curves are estimated at different CCFP income levels with other explanatory variables at their means. Solid and hollow triangles denotes significant at the 5% and 10% significance levels, respectively.
3.5. Associations between labor migration and forest regeneration
In both study sites, apart from the dissimilarity in correlations estimated by OLS, there is also different spatial heterogeneity between labor migration and forest regeneration (Fig. 5). Sensitivity analysis testing the radius used for forest surrounding households shows consistent and robust correlations between forest regrowth and various types of migration (Fig. S3). In Tiantangzhai (Fig. 5, left panel), OLS estimation shows the increase in distant-migration is significantly and positively associated with an increase in forest cover (coefficient=1.211, p=0.064), but is not significantly linked to forest greenness as measured by EVI. Households sending more workers to cities are likely to use forest resources less (especially those receiving large remittances), which could facilitate forest expansion. Interestingly, however, the EVI value of newly planted ecological forests under the CCFP are not as high as that of the existing mature forests, so they contribute little to overall forest greenness. Spatially, the Geographic Weighted Regression (GWR) model results demonstrate positive migration-forest associations similar to those of OLS in most places. In the semi-arid site of Shanxi (Fig. 5, right panel), local-migration is found positively associated with both forest expansion and growth, with all associations statistically significant (coefficients of 3.860 and 0.021 for forest cover and EVI, respectively; p-values are under 0.06). Thus, local-migrants in Shanxi may be engaged in orchard forest management (apples, walnuts), helping their origin households, such as harvesting and commercializing locally.
Fig. 5.

Estimated associations between migration and forest dynamics based on non-spatial and spatial modeling.
4. Discussion
4.1. Divergent social-ecological pathways of PES to forest sustainability
In this research, we find strong evidence of divergent effects of CCFP on rural out-migration in two contrasting regions, with full sets of factors at the individual, household, community and region levels controlled. In particular, income from the CCFP and the change in livelihoods it appears to often stimulate has had important effects on migration decisions, but the effects appear to be significantly different between the subtropical mountainous setting in Anhui and a semi-arid site on the Loess Plateau in Shanxi. The different impacts appear to result from different responses to the implementation of the CCFP in household livelihood strategies on land use and labor allocation, combined with differences in government CCFP policies, especially with respect to the promotion of ecological vs. economic trees for reforestation (Fig. 6).
Fig. 6.

Socioeconomic-ecological pathways of payments for ecosystem services to forest conservation sustainability.
In the subtropical mountain site of Anhui with rough terrain, small cropland parcels of modest productivity are scattered within resident group clusters (households have multiple small parcels, often intermixed and non-contiguous). The CCFP reduces cropland available (Groom et al., 2009) and hence free farm labor for other economic activities, including migration (Zhang et al., 2018a). Nearly all CCFP-participating households (94.5% of all participants) in Tiantangzhai (Anhui) established ecological forests, from which participants gain little, if any, additional income. Thus, the CCFP, albeit providing small amounts of cash compensation, can induce freed-up labor to become migrants and even also provide some financial support to the move. This is evidenced by the finding that a higher level of CCFP income increases the likelihood of distant-migration (Fig. 4). Some rural households participating in the CCFP face various obstacles for distant migration, such as lack of migration networks or enough adults in the household (Wang et al., 2019), so may use the CCFP compensation to send migrants within the local area, which also explains the significant effects of CCFP payments on local-migration (Table 5). As households with migrants rely less on cultivation of cropland for their livelihoods, it does not appear unlikely for these participating households to revert the CCFP forests back to croplands when CCFP funding ceases. They have become dependent on high remittances from former members, accounting for a mean of over a third of household income (Zhang et al., 2019). Thus, the out-migration stimulated by the CCFP payment contributes indirectly to forest sustainability. Labor migration to cities also can substantially reduce the extraction of fuelwood (Song et al., 2018), which is the primary energy source for daily cooking and winter heating, hence also contributing to forest restoration and regrowth. This is confirmed by the results from the non-spatial modeling in which distant-migration is found to be positively correlated with forest recovery during the implementation of the CCFP. Notably, the strongest correlation is observed at higher elevations (Fig. 5), where household members are in a sense “pushed out”, by not having good access to local employment in local towns to migrate out and leave cropland behind (Zhang et al., 2018b), as also found in other mountainous regions in Nepal (Rimal et al., 2019) and Ecuador (Barbieri et al., 2009).
At the Shanxi site on the semi-arid Loess Plateau, per capita cropland areas on average are much larger than in the subtropical region of Tiantangzhai, while relatively large urban labor markets are farther away. With larger landholdings, they have larger areas enrolled in the CCFP, so participants receive higher payments, even though the compensation rate per unit area is lower. More important, over half of the CCFP forests planted are economic forests (mainly walnut), which after a few years generated significant additional income, which will continue even if and after the CCFP compensation ceases (Table 1). Such differences in tree types planted may be due to differences in regional geographical conditions that influence the viability and productivity of the planted trees (Bennett et al., 2014), leading to different pathways (Fig. 6). For households with economic forests, selling their products can bring in substantial income (Delang, 2019) and decreasing motives of household members to migrate away in search of more remunerative work, as appeared to occur in the Shanxi site (Table 5). Meanwhile, local-migration tends to nonlinearly respond to CCFP income level (Fig. 3). Thus, when the CCFP income is below a certain level, households often seek to diversify income sources by sending out local-migrants, who are close enough to easily help on the farm or with the new tree orchards when needed. When the CCFP income reaches a sufficiently high level, households have enough income to not have to send someone away as a distant migrant, and instead focus on the management of their new lucrative tree orchards. Their successful management of orchards under the CCFP therefore expands the area in forest, but also strengthen the tree growth, rendering the positive relationships between CCFP compensation and the greening trends of forests. However, for the nearly half of the participating households with only ecological forests, they gain little or no extra cash income from their newly planted forest. These households are therefore more likely to seek alternative local work or out-migrate. This could explain the more heterogeneous associations between household labor allocation for migration and forest growth trends in the Shanxi site compared to the Anhui site. When CCFP compensation ceases, these households, unless successful in finding remunerative local work or receiving remittances from migrants, are also likely to return their ecological forests to cropland, ending the ecological services stimulated by the CCFP.
4.2. Implications for environment-migration nexus
Our research findings improve the understanding of the environment-migration nexus (Bilsborrow, 2002; Carr, 2009) in a broader context of social-ecological systems (Aryal et al., 2018). Migration is influenced by interactions between environmental and non-environmental factors and can feedback onto environmental change (Neumann and Hilderink, 2015). Such interactions can be particularly prominent in mountainous areas, where conflicts between environmental sustainability and local livelihood improvements are strong (Liu et al., 2016). The example of the CCFP in China addresses these challenges based on research findings from comparable data in two very distinct areas, distinct in environmental conditions and locations vis-a-vis the centers of the national economy. The results illustrate forest-migration interplays of considerable interest for outstanding global environmental change (Ervin et al., 2020; Meyfroidt et al., 2010; Oldekop et al., 2018). Unfavorable environmental conditions in the mountainous area—in the sense of little land, poor quality land, and isolation (weak transportation infrastructure) function as a poverty trap that both makes people poor while also making it difficult for them to escape, such as by changing or diversifying livelihoods or migrating to locations with better economic opportunities. The CCFP can provide modest financial compensation which can help facilitate the migration process. More important than the modest compensation from the CCFP is its requiring the withdrawal of marginal cropland, which can free farm labor from onerous, low-productivity cultivation of croplands, and sometimes strengthen land tenure security at the same time in cases when the government issues at deed of ownership for the CCFP (Kelly and Huo, 2013; Treacy et al., 2018; Uchida et al., 2009; Zhang et al., 2018a). Households with freed-up labor may seek alternative ways of allocating that household labor, including out-migration, to diversify their livelihoods while holding onto the remaining cropland (Wang and Maclaren, 2012). Whether the reforested lands can be sustained to provide the intended ecosystem services depends on how they adjust their livelihoods to adapt to the land use change (Yao et al., 2010).
Labor out-migration is adopted common strategy that can have feedback effects on forest rehabilitation, expansion and conservation under the CCFP (Wu et al., 2019b). In this research, we categorize three different migration choices, including non-migration (i.e., continuing to live at the original house location, regardless of economic activities), local-migration (migrating to live nearby within the county), and distant-migration (moving to locations, almost all cities, at longer distances away outside the county). The two migration alternatives offer very different perspectives for understanding how land use change may be related to demographic dynamics and feedbacks onto forests. In the subtropical study site (Anhui), enrolling more land in the CCFP yields a larger cash payment which was found to increasingly stimulate out-migration to distant and larger destination with generally higher wages. To the extent this migration leads to remittances sent back to the origin household, as is the norm, it frees that household from the need to exploit the land and existing forests so much and hence is turn conducive to the sustainability of CCFP forests. While it is not always the case that migrants are both successful and send back remittances (nor do we have direct data on this for our samples as it would require expensive tracing of migrants), it is more likely to be the case for those migrating to the larger cities. This may facilitate a livelihood transition in their origin households (Zhang et al., 2019), including forest expansion (Fig. S3). As a result, the CCFP can be viewed as successful to date for most participating households in improving their livelihoods and achieving (up to now) sustainable reforestation via promoting migration. At the Shanxi site of the Loess Plateau, farm households have been able to generate sizable income by turning CCFP land into economic forests, growing and selling fruits/nuts (mostly walnuts), which is nevertheless rather labor demanding. Thus it is more common for those who migrate away to be local-migrants, so they can assist the origin household when needed and thereby play a major role in making the CCFP economic forests thrive in the long term. Therefore, the program there has also fulfilled the goal of forest conservation while altering household livelihoods in a way that has led to higher household incomes, albeit via a different migration pathway.
4.3. Limitations and future directions
It is important to acknowledge a few limitations in this research that may help improve future work. The analysis of the migration-forest dynamic linkages here is evidently based on single cross-sections of data, and therefore requires a considerable leap to infer relationships over time based on differences across households. Hopefully it will be possible to conduct a follow-up survey on the same households in the future to assess the sustainability of the improvements in livelihoods and forest cover observed here. Second, the analysis of forest cover and “greening” here is based on all forests identified from satellite images, and thus cannot separate the “greening” and expanding shares of natural forests, ecological CCFP forests, and economic CCFP forests. Third, this present research could be extended by attempting to quantitatively estimate the linkages between the changes in each forest type and the types and destinations of labor migration at the household level. Fourth, this study does not attempt to quantify the value of specified ecosystem services supported by forests, but regards forest cover and tree growth as the surrogate for (increased) ecosystem services. Finally, the model emphasizes to a less extent the joint effects of demographic change and land use change on forest conservation outcomes. For instance, cropland abandonment, which has become common in mountain areas of subtropical China, is closely related to household labor allocation and vegetation regeneration on human-modified fields (Zhang et al., 2018b). At the same time, in the Loess Plateau, agricultural transformation from dryland crops to apple and walnut orchards may also involve nuanced changes in forest ecosystems (for example, we observed considerable areas of intercropping of fruit trees with corn). Taking into account these complex interactions requires comprehensive models (e.g., agent-based models) to uncover the underlying feedback processes of the demographic-socioeconomic and ecological subsystems, which is evidently beyond the scope of the research focus here on examining regional differences.
5. Conclusion
This study integrates household survey, remote sensing and statistical models to investigate rural labor out-migration in two contrasting sites following the implementation of the largest payment for ecosystem services program in China, the Conversion of Cropland to Forest Program (CCFP). The socioeconomic and ecological outcomes of the CCFP as well as the underlying pathways are shown to vary between the two regions, characterized by quite different biophysical and socioeconomic conditions. More specifically, we found that the CCFP has different effects on both labor migration and forest recovery between a subtropical mountainous site in Anhui a semi-arid site of the Loess Plateau in Shanxi. CCFP (income) payments stimulates both local- and distant-migration from households in the Anhui site, but tend to slightly reduce out-migration from households in the Shanxi location, especially migration to long distance. Meanwhile the distant-migration from Anhui is strongly associated with increased forest cover, and thus enhanced ecosystem services. At the same time, it is the local out-migration in Shanxi that is correlated with forest expansion, which is interpreted as reflecting the desire of households in Shanxi to keep migrants close so they can help with the labor required in successful management of the new economic forests (mostly walnut trees) as well as existing apple orchards. Overall, the CCFP has contributed to both the primary goal of ecosystem conservation and the secondary goal of improving livelihoods, but with intriguing differences in the socioeconomic-ecological pathways linking out-migration to forest sustainability between the two quite different mountain areas. The future design of large-scale PES programs in China and elsewhere would benefit from explicitly considering a priori such differences in underlying contextual conditions in program implementation areas.
Supplementary Material
Highlights.
CCFP in the subtropical mountainous area stimulates local- and distant-migration.
CCFP in the semi-arid Loess Plateau reduces out-migration to distant destinations.
Forest expansion is primarily associated with distant-migration in Anhui.
Forest expansion and growth are primarily associated with local-migration in Shanxi.
CCFP impacts are shaped by local biophysical and household socioeconomic factors.
Acknowledgements
This research was supported by the National Science Foundation (Grant No. DEB-1313756). The collaboration of Ying Wang was supported by the National Natural Science Foundation of China (Grant No. 41901213) and the Fundamental Research Funds for the Central Universities, China University of Geosciences (Wuhan) (Grant No. 26420190065, 26420180052). Richard Bilsborrow was supported by the Carolina Population Center and the NIH/NICHD population center grant (P2C HD050924). Finally, the authors would like to thank the editor and two anonymous reviewers for their constructive and insightful comments on an earlier draft of this paper.
Footnotes
Publisher's Disclaimer: This is a PDF file of an unedited manuscript that has been accepted for publication. As a service to our customers we are providing this early version of the manuscript. The manuscript will undergo copyediting, typesetting, and review of the resulting proof before it is published in its final form. Please note that during the production process errors may be discovered which could affect the content, and all legal disclaimers that apply to the journal pertain.
Declaration of Competing Interest
The authors declare that they have no known competing financial interests or personal relationships that could have appeared to influence the work reported in this paper.
We prefer “Conversion of Cropland to Forest” to “Grain-for-Green” or “Sloping Land Conversion”, although the latter two are also commonly used. First, the government compensated participants with in-kind support (e.g., grains) only in the very beginning of program implementation, but all forms of support were soon replaced by cash to minimize transaction costs. Second, in some regions, the program targeted not only sloping lands but also other lands at high risk of soil erosion.
Source: https://www.usgs.gov/
An updated version for the adaptive signature generalization procedure algorithm programmed in R can be found at: https://data.mendeley.com/datasets/s7c3vfr84w/1. See the detailed description in Dannenberg et al. (2016).
This variable does not reflect the opportunity cost of the land no longer being farmed and producing crops for self-consumption and sale, nor any costs of inputs involved in growing and maintaining the economic trees and selling the tree products. But the variable captures the significant difference in the medium term benefits of the CCFP in the two sites resulting from planting (successful) economic trees.
References
- Anderson D, Leiserson MW, 1980. Rural Nonfarm Employment in Developing Countries. Econ. Dev. Cult. Change 10.1086/451170 [DOI]
- Aryal S, Cockfield G, Maraseni TN, 2018. Globalisation and traditional social-ecological systems: Understanding impacts of tourism and labour migration to the transhumance systems in the Himalayas. Environ. Dev 10.1016/j.envdev.2017.09.001 [DOI]
- Barbieri AF, Carr DL, Bilsborrow RE, 2009. Migration within the frontier: The second generation colonization in the Ecuadorian Amazon. Popul. Res. Policy Rev 10.1007/s11113-008-9100-y [DOI] [PMC free article] [PubMed]
- Bennett EM, Cramer W, Begossi A, Cundill G, Díaz S, Egoh BN, Geijzendorffer IR, Krug CB, Lavorel S, Lazos E, Lebel L, Martín-López B, Meyfroidt P, Mooney HA, Nel JL, Pascual U, Payet K, Harguindeguy NP, Peterson GD, Prieur-Richard AH, Reyers B, Roebeling P, Seppelt R, Solan M, Tschakert P, Tscharntke T, Turner BL, Verburg PH, Viglizzo EF, White PCL, Woodward G, 2015. Linking biodiversity, ecosystem services, and human well-being: three challenges for designing research for sustainability. Curr. Opin. Environ. Sustain 10.1016/j.cosust.2015.03.007 [DOI]
- Bennett MT, 2008. China’s sloping land conversion program: Institutional innovation or business as usual? Ecol. Econ 10.1016/j.ecolecon.2007.09.017 [DOI]
- Bennett MT, Xie C, Hogarth NJ, Peng D, Putzel L, 2014. China’s conversion of cropland to forest program for household delivery of ecosystem services: How important is a local implementation regime to survival rate outcomes? Forests 10.3390/f5092345 [DOI]
- Berman M, Diggle P, 1989. Estimating Weighted Integrals of the Second-Order Intensity of a Spatial Point Process. J. R. Stat. Soc. Ser. B 10.1111/j.2517-6161.1989.tb01750.x [DOI]
- Bilsborrow R, 2002. Migration, population change, and the rural environment. Environ. Change Secur. Proj. Rep
- Bilsborrow RE, 2016. Concepts, Definitions and Data Collection Approaches 10.1007/978-94-017-7282-2_7 [DOI]
- Bilsborrow RE, Henry SJF, 2012. The use of survey data to study migration-environment relationships in developing countries: Alternative approaches to data collection. Popul. Environ 10.1007/s11111-012-0177-1 [DOI] [PMC free article] [PubMed]
- Bilsborrow RE, Oberai AS, Standing G, 1984. Migration surveys in low-income countries: guidelines for survey and questionnaire design
- Breiman L, 2001. Random forests. Mach. Learn 10.1023/A:1010933404324 [DOI] [Google Scholar]
- Call MA, Gray C, Yunus M, Emch M, 2017. Disruption, not displacement: Environmental variability and temporary migration in Bangladesh. Glob. Environ. Chang 10.1016/j.gloenvcha.2017.08.008 [DOI] [PMC free article] [PubMed]
- Carr D, 2009. Popu lation and deforestation: Why rural migration matters. Prog. Hum. Geogr 10.1177/0309132508096031 [DOI]
- Chen X, Lupi F, Viña A, He G, Liu J, 2010. Using cost-effective targeting to enhance the efficiency of conservation investments in payments for ecosystem services. Conserv. Biol 10.1111/j.1523-1739.2010.01551.x [DOI] [PubMed]
- Chen X, Zhang Q, Peterson MN, Song C, 2019. Feedback effect of crop raiding in payments for ecosystem services. Ambio 10.1007/s13280-018-1105-0 [DOI] [PMC free article] [PubMed]
- Chen HL, Lewison RL, An L, Yang S, Shi L, Zhang W, 2020. Understanding direct and indirect effects of Payment for Ecosystem Services on resource use and wildlife. Anthropocene. 10.1016/j.ancene.2020.100255. [DOI]
- CIFOR, 2005. Payments for environmental services: some nuts and bolts, Payments for environmental services: some nuts and bolts 10.17528/cifor/001765 [DOI]
- Dannenberg MP, Hakkenberg CR, Song C, 2016. Consistent classification of landsat time series with an improved automatic adaptive signature generalization algorithm. Remote Sens 10.3390/rs8080691 [DOI]
- DeFries RS, Foley JA, Asner GP, 2004. Land-use choices: Balancing human needs and ecosystem function. Front. Ecol. Environ. 10.1890/1540-9295(2004)002[0249:LCBHNA]2.0.CO;2. [DOI]
- Delang CO, 2019. The Second Phase of the Grain for Green Program: Adapting the Largest Reforestation Program in the World to the New Conditions in Rural China. Environ. Manage 10.1007/s00267-019-01185-4 [DOI] [PubMed]
- Ervin D, Lopéz-Carr D, Riosmena F, Ryan SJ, 2020. Examining the relationship between migration and forest cover change in Mexico from 2001 to 2010. Land use policy 10.1016/j.landusepol.2019.104334 [DOI]
- Fang J, Yu G, Liu L, Hu S, Stuart Chapin F, 2018. Climate change, human impacts, and carbon sequestration in China. Proc. Natl. Acad. Sci. U. S. A 10.1073/pnas.1700304115 [DOI] [PMC free article] [PubMed]
- FAO, 2015. Global Forest Resources Assessment 2015. FAO Forestry Paper Rome. [Google Scholar]
- FAO, 2010. Global Forest Resources Assessment 2010 FAO Forestry Research Paper 163 Rome. [Google Scholar]
- Farr TG, Rosen PA, Caro E, Crippen R, Duren R, Hensley S, Kobrick M, Paller M, Rodriguez E, Roth L, Seal D, Shaffer S, Shimada J, Umland J, Werner M, Oskin M, Burbank D, Alsdorf DE, 2007. The shuttle radar topography mission. Rev. Geophys 10.1029/2005RG000183 [DOI]
- Findley SE, 1987. An interactive contextual model of migration in Ilocos Norte, the Philippines. Demography 10.2307/2061628 [DOI] [PubMed]
- Fithian W, Hastie T, 2013. Finite-sample equivalence in statistical models for presence-only data. Ann. Appl. Stat 10.1214/13-AOAS667 [DOI] [PMC free article] [PubMed]
- García-Barrios L, Galván-Miyoshi YM, Valsieso-Pérez IA, Masera OR, Bocco G, Vandermeer J, 2009. Neotropical Forest Conservation, Agricultural Intensification, and Rural Out-migration: The Mexican Experience. Bioscience 10.1525/bio.2009.59.10.8 [DOI]
- Gibson GD, Goody J, 1958. The Developmental Cycle in Domestic Groups. Am. Sociol. Rev 10.2307/2088842 [DOI]
- Goldstein H, Bryk AS, Raudenbush SW, 1993. Hierarchical Linear Models: Applications and Data Analysis Methods. J. Am. Stat. Assoc 10.2307/2290750 [DOI]
- Gorelick N, Hancher M, Dixon M, Ilyushchenko S, Thau D, Moore R, 2017. Google Earth Engine: Planetary-scale geospatial analysis for everyone. Remote Sens. Environ 10.1016/j.rse.2017.06.031 [DOI]
- Gray J, Song C, 2013. Consistent classification of image time series with automatic adaptive signature generalization. Remote Sens. Environ 10.1016/j.rse.2013.03.022 [DOI]
- Groom B, Grosjean P, Kontoleon A, Swanson T, Zhang S, 2009. Relaxing rural constraints: A “win-win” policy for poverty and environment in China? Oxf. Econ. Pap 10.1093/oep/gpp021 [DOI]
- Gutiérrez Rodríguez L, Hogarth NJ, Zhou W, Xie C, Zhang K, Putzel L, 2016. China’s conversion of cropland to forest program: A systematic review of the environmental and socioeconomic effects. Environ. Evid 10.1186/s13750-016-0071-x [DOI]
- Han G, Fang WT, Huang YW, 2011. Classification and influential factors in the perceived tourism impacts of community residents on nature-based destinations: China’s Tiantangzhai scenic area, in: Procedia Environmental Sciences 10.1016/j.proenv.2011.09.315 [DOI]
- Henry SJF, Dos Santos S, 2013. Rainfall variations and child mortality in the Sahel: Results from a comparative event history analysis in Burkina Faso and Mali. Popul. Environ 10.1007/s11111-012-0174-4 [DOI]
- Huete AR, Liu HQ, van Leeuwen WJD, 1997. Use of vegetation indices in forested regions: Issues of linearity and saturation, in: International Geoscience and Remote Sensing Symposium (IGARSS) 10.1109/igarss.1997.609169 [DOI] [Google Scholar]
- Jack BK, Kousky C, Sims KRE, 2008. Designing payments for ecosystem services: Lessons from previous experience with incentive-based mechanisms. Proc. Natl. Acad. Sci. U. S. A 10.1073/pnas.0705503104 [DOI] [PMC free article] [PubMed]
- Kelly P, Huo X, 2013. Land Retirement and Nonfarm Labor Market Participation: An Analysis of China’s Sloping Land Conversion Program. World Dev 10.1016/j.worlddev.2013.04.002 [DOI]
- Komarek AM, Shi X, Heerink N, 2014. Household-level effects of China’s Sloping Land Conversion Program under price and policy shifts. Land use policy 10.1016/j.landusepol.2013.04.013 [DOI]
- Kotiaho JS, Ten Brink B, Harris J, 2016. Land use: A global baseline for ecosystem recovery. Nature 10.1038/532037c [DOI] [PubMed]
- Lee ES, 1966. A theory of migration. Demography 10.2307/2060063 [DOI]
- Li J, Feldman MW, Li S, Daily GC, 2011. Rural household income and inequality under the sloping land conversion program in Western China. Proc. Natl. Acad. Sci. U. S. A 10.1073/pnas.1101018108 [DOI] [PMC free article] [PubMed]
- Li Q, Zander P, 2020. Resilience building of rural livelihoods in PES programmes: A case study in China’s Loess Hills. Ambio 10.1007/s13280-019-01236-4 [DOI] [PMC free article] [PubMed]
- Liang Y, Li S, Feldman MW, Daily GC, 2012. Does household composition matter? The impact of the Grain for Green Program on rural livelihoods in China. Ecol. Econ 10.1016/j.ecolecon.2012.01.019 [DOI]
- Liang Z, 2016. China’s Great Migration and the Prospects of a More Integrated Society. Annu. Rev. Sociol 10.1146/annurev-soc-081715-074435 [DOI]
- Lin Y, Yao S, 2014. Impact of the Sloping Land Conversion Program on rural household income: An integrated estimation. Land use policy 10.1016/j.landusepol.2013.09.005 [DOI]
- Liu C, Zhang Q, Luo H, Qi S, Tao S, Xu H, Yao Y, 2019. An efficient approach to capture continuous impervious surface dynamics using spatial-temporal rules and dense Landsat time series stacks. Remote Sens. Environ 10.1016/j.rse.2019.04.025 [DOI]
- Liu G, Wang H, Cheng Y, Zheng B, Lu Z, 2016. The impact of rural out-migration on arable land use intensity: Evidence from mountain areas in Guangdong, China. Land use policy 10.1016/j.landusepol.2016.10.005 [DOI]
- Liu T, Liu C, Liu H, Wang S, Rong Q, Zhu W, 2014. Did the key priority forestry programs affect income inequality in rural China? Land use policy 10.1016/j.landusepol.2013.11.016 [DOI]
- Lu F, Hu H, Sun W, Zhu J, Liu Guobin, Zhou W, Zhang Q, Shi P, Liu X, Wu X, Zhang L, Wei X, Dai L, Zhang K, Sun Y, Xue S, Zhang W, Xiong D, Deng L, Liu B, Zhou L, Zhang C, Zheng X, Cao J, Huang Y, He N, Zhou G, Bai Y, Xie Z, Tang Z, Wu B, Fang J, Liu Guohua, Yu G, 2018. Effects of national ecological restoration projects on carbon sequestration in China from 2001 to 2010. Proc. Natl. Acad. Sci. U. S. A 10.1073/pnas.1700294115 [DOI] [PMC free article] [PubMed]
- Ma X, Heerink N, Feng S, Shi X, 2015. Farmland tenure in China: Comparing legal, actual and perceived security. Land use policy 10.1016/j.landusepol.2014.07.020 [DOI]
- Mahanty S, Suich H, Tacconi L, 2013. Access and benefits in payments for environmental services and implications for REDD+: Lessons from seven PES schemes. Land use policy 10.1016/j.landusepol.2011.10.009 [DOI]
- Massey DS, 1990. Social structure, household strategies, and the cumulative causation of migration. Popul. Index 10.2307/3644186 [DOI] [PubMed]
- Meyfroidt P, Rudel TK, Lambin EF, 2010. Forest transitions, trade, and the global displacement of land use. Proc. Natl. Acad. Sci. U. S. A 10.1073/pnas.1014773107 [DOI] [PMC free article] [PubMed]
- Milder JC, Scherr SJ, Bracer C, 2010. Trends and future potential of payment for ecosystem services to alleviate rural poverty in developing countries. Ecol. Soc 10.5751/ES-03098-150204 [DOI]
- Nagelkerken I, Connell SD, 2015. Global alteration of ocean ecosystem functioning due to increasing human CO2 emissions. Proc. Natl. Acad. Sci. U. S. A 10.1073/pnas.1510856112 [DOI] [PMC free article] [PubMed]
- Neumann K, Hilderink H, 2015. Opportunities and challenges for investigating the environment-migration nexus. Hum. Ecol 10.1007/s10745-015-9733-5 [DOI] [PMC free article] [PubMed]
- Oldekop JA, Sims KRE, Whittingham MJ, Agrawal A, 2018. An upside to globalization: International outmigration drives reforestation in Nepal. Glob. Environ. Chang 10.1016/j.gloenvcha.2018.06.004 [DOI]
- Pan WKY, Bilsborrow RE, 2005. The use of a multilevel statistical model to analyze factors influencing land use: A study of the Ecuadorian Amazon, in: Global and Planetary Change 10.1016/j.gloplacha.2004.10.014 [DOI]
- Radel C, Jokisch BD, Schmook B, Carte L, Aguilar-Støen M, Hermans K, Zimmerer K, Aldrich S, 2019. Migration as a feature of land system transitions. Curr. Opin. Environ. Sustain 10.1016/j.cosust.2019.05.007 [DOI]
- Rimal B, Sharma R, Kunwar R, Keshtkar H, Stork NE, Rijal S, Rahman SA, Baral H, 2019. Effects of land use and land cover change on ecosystem services in the Koshi River Basin, Eastern Nepal. Ecosyst. Serv 10.1016/j.ecoser.2019.100963 [DOI]
- Sannigrahi S, Zhang Q, Pilla F, Joshi PK, Basu B, Keesstra S, Roy PS, Wang Y, Sutton PC, Chakraborti S, Paul SK, Sen S, 2020. Responses of ecosystem services to natural and anthropogenic forcings: A spatial regression based assessment in the world’s largest Mangrove ecosystem. Sci. Total Environ 715, 137004 10.1016/j.scitotenv.2020.137004 [DOI] [PubMed] [Google Scholar]
- Schirpke U, Marino D, Marucci A, Palmieri M, 2018. Positive effects of payments for ecosystem services on biodiversity and socio-economic development: Examples from Natura 2000 sites in Italy. Ecosyst. Serv 10.1016/j.ecoser.2018.10.006 [DOI]
- Song C, Bilsborrow R, Jagger P, Zhang Q, Chen X, Huang Q, 2018. Rural Household Energy Use and Its Determinants in China: How Important Are Influences of Payment for Ecosystem Services vs. Other Factors? Ecol. Econ 10.1016/j.ecolecon.2017.08.028 [DOI]
- Song C, Zhang Y, Mei Y, Liu H, Zhang Z, Zhang Q, Zha T, Zhang K, Huang C, Xu X, Jagger P, Chen X, Bilsborrow R, 2014. Sustainability of Forests Created by China’s Sloping Land Conversion Program: A comparison among three sites in Anhui, Hubei and Shanxi. For. Policy Econ 10.1016/j.forpol.2013.08.012 [DOI]
- Stark O, Bloom DE, 1985. The new economics of labor migration. Am. Econ. Rev 10.2307/1805591 [DOI]
- Treacy P, Jagger P, Song C, Zhang Q, Bilsborrow RE, 2018. Impacts of China’s Grain for Green Program on Migration and Household Income. Environ. Manage 10.1007/s00267-018-1047-0 [DOI] [PMC free article] [PubMed]
- Uchida E, Rozelle S, Xu J, 2009. Conservation payments, liquidity constraints, and off-farm labor: Impact of the grain-for-green program on rural households in China. Am. J. Agric. Econ 10.1111/j.1467-8276.2008.01184.x [DOI]
- Wang C, Maclaren V, 2012. Evaluation of economic and social impacts of the sloping land conversion program: A case study in Dunhua County, China. For. Policy Econ 10.1016/j.forpol.2011.06.002 [DOI]
- Wang Y, Bilsborrow RE, Zhang Q, Li J, Song C, 2019. Effects of payment for ecosystem services and agricultural subsidy programs on rural household land use decisions in China: Synergy or trade-off? Land use policy 10.1016/j.landusepol.2018.10.057 [DOI]
- Williams R, 2012. Using the margins command to estimate and interpret adjusted predictions and marginal effects. Stata J [DOI]
- Woodcock CE, Allen R, Anderson M, Belward A, Bindschadler R, Cohen W, Gao F, Goward SN, Helder D, Helmer E, Nemani R, Oreopoulos L, Schott J, Thenkabail PS, Vermote EF, Vogelmann J, Wulder MA, Wynne R, 2008. Free Access to Landsat Imagery. Science (80-. ) 10.1126/science.320.5879.1011a [DOI] [PubMed]
- Wu X, Wang S, Fu B, Feng X, Chen Y, 2019a. Socio-ecological changes on the Loess Plateau of China after Grain to Green Program. Sci. Total Environ 10.1016/j.scitotenv.2019.05.022 [DOI] [PubMed]
- Wu X, Wang S, Fu B, Zhao Y, Wei Y, 2019b. Pathways from payments for ecosystem services program to socioeconomic outcomes. Ecosyst. Serv 10.1016/j.ecoser.2019.101005 [DOI]
- Wunder S, Brouwer R, Engel S, Ezzine-De-Blas D, Muradian R, Pascual U, Pinto R, 2018. From principles to practice in paying for nature’s services. Nat. Sustain 10.1038/s41893-018-0036-x [DOI]
- Xie L, Zeng B, Jiang L, Xu J, 2018. Conservation payments, off-farm labor, and ethnic minorities: Participation and impact of the Grain for Green program in China. Sustain 10.3390/su10041183 [DOI]
- Yao S, Guo Y, Huo X, 2010. An empirical analysis of the effects of china’s land conversion program on farmers’ income growth and labor transfer. Environ. Manage 10.1007/s00267-009-9376-7 [DOI] [PubMed]
- Yost A, An L, Bilsborrow R, Shi L, Chen X, Yang S, Zhang W, 2020. Mechanisms behind concurrent payments for ecosystem services in a Chinese nature reserve. Ecol. Econ 10.1016/j.ecolecon.2019.106509. [DOI]
- Zhang K, Putzel L, 2016. Institutional innovation and forest landscape restoration in China: Multi-scale cross-sector networking, household fiscal modernization and tenure reform. World Dev. Perspect 10.1016/j.wdp.2016.11.002 [DOI]
- Zhang P, Shao G, Zhao G, Le Master DC, Parker GR, Dunning JB, Li Q, 2000. China’s forest policy for the 21st century. Science (80-. ) 10.1126/science.288.5474.2135 [DOI] [PubMed]
- Zhang Q, Bilsborrow RE, Song C, Tao S, Huang Q, 2019. Rural household income distribution and inequality in China: Effects of payments for ecosystem services policies and other factors. Ecol. Econ 10.1016/j.ecolecon.2019.02.019 [DOI] [PMC free article] [PubMed]
- Zhang Q, Bilsborrow RE, Song C, Tao S, Huang Q, 2018a. Determinants of out-migration in rural China: effects of payments for ecosystem services. Popul. Environ 10.1007/s11111-018-0307-5 [DOI] [PMC free article] [PubMed]
- Zhang Q, Hakkenberg CR, Song C, 2017. Evaluating the effectiveness of forest conservation policies with multitemporal remotely sensed imagery: A case study from tiantangzhai township, anhui, China, in: Comprehensive Remote Sensing 10.1016/B978-0-12-409548-9.10435-X [DOI]
- Zhang Q, Song C, Chen X, 2018b. Effects of China’s payment for ecosystem services programs on cropland abandonment: A case study in Tiantangzhai Township, Anhui, China. Land use policy 10.1016/j.landusepol.2018.01.001 [DOI]
- Zinda JA, Zhang Z, 2019. Explaining heterogeneous afforestation outcomes: How community officials and households mediate tree cover change in China. World Dev 10.1016/j.worlddev.2019.05.020 [DOI]
Associated Data
This section collects any data citations, data availability statements, or supplementary materials included in this article.