Abstract
The hedgehog signaling pathway plays a critical role in bone development and regeneration. Applications of hedgehog morphogens or small molecular agonists are of interest in bone repair but constrained by low stability, high dose requirement, and nonspecific targeting in vivo. Herein, a nanoparticulate agonist as a new type of hedgehog signaling activator is developed for efficacious bone healing. The shell of nanoparticulate agonist consists of palmitic acid and oxysterol, which could modify hedgehog function and bind with the smoothened receptor to positively modulate hedgehog signaling. Meanwhile, the core is assembled with sonic hedgehog gene/polyethyleneimine complex, which could synergistically enhance hedgehog signaling with oxysterol constituents. Moreover, alendronate is introduced into nanoparticulate agonist to bind with hydroxyapatite for potential bone tissue targeting. Lastly, the nanoparticulate agonist surface is decorated with the guanidine group to overcome cell membrane barriers. The created multifunctional nanoparticulate agonist is successfully integrated onto apatite-coated three-dimensional scaffolds and demonstrates greatly improved osteogenesis in vitro and calvarial bone healing. This work suggests a novel biomaterial design to specifically promote hedgehog signaling for the treatment of bone defects.
Keywords: nanoparticle, bone targeting, hedgehog signaling, sterosome, bone repair
Graphical Abstract
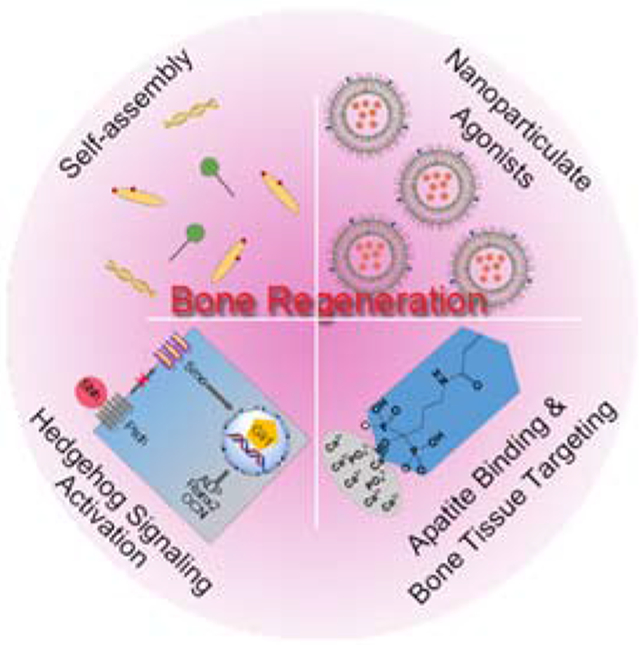
The multifunctional nanoparticulate agonists (MNAs) are developed for activating the hedgehog signaling pathway and inducing bone tissue regeneration. These MNAs are assembled from 20(S)-Hydroxycholesterol and palmitic acid in aqueous solutions. The MNAs demonstrate strong osteoinductive properties by regulating hedgehog signaling. When combined with apatite-coated scaffolds, the MNAs promote efficacious bone healing in a mouse non-healing calvarial defect.
1. Introduction
Hedgehog signaling plays an important role in skeletal development and bone healing by including osteoblast differentiation from mesenchymal progenitors and bone formation.[1, 2, 3] Dysregulation of hedgehog signaling results in bone defects, osteoarthritis and osteosarcoma.[2, 3] Hedgehog ligands, such as sonic hedgehog (Shh), Indian hedgehog (Ihh) and desert hedgehog (Dhh), bind to transmembrane protein patched (Ptch) and activate smoothened (Smo) receptor, leading to a signaling cascade that upregulates target genes including Ptch itself and Gli1 (glioma-associated oncogene).[2] In addition to the application of exogenous Shh, targeting to hedgehog signaling pathway by employing small molecule modulators of Smo activity is a potential therapeutic approach in recent bone defect treatments.[4, 5, 6] Natural and synthetic small molecules (e.g. oxysterols, purmorphamine, SAG) have been discovered as hedgehog pathway agonists, providing a promising alternative to enhance osteoblast differentiation and facilitate bone repair.[7] For example, oxysterols are oxidized cholesterol derivatives and dictate the osteogenic fate of mesenchymal stem cells by binding Smo and activating hedgehog signal.[8] However, the use of Shh morphogens and Smo agonists are hampered by low stability, immunogenicity, high dose requirement, low specificity, off-target side effects and short-acting time in vivo.[4] Thus, there is a need to develop alternative strategies to manipulate hedgehog signaling using nanocarriers for faster, safer, and more efficacious bone repair.
Various nanoparticles, including liposome, synthetic polymeric micelles and inorganic particles have been designed and constructed for effective delivery of therapeutic agents such as drugs, genes and growth factors.[9, 10] Current nanoparticles are employed primarily as carrier platforms to enhance the biological effects of cargos and overcome the aforementioned drawbacks associated with therapeutic agents.[11] However, nanoparticles themselves lack biological activities and have no therapeutic effects in the treatment of tissue defects.[10, 12] Therefore, our promising strategy is toward developing multifunctional nanoparticles with intrinsically osteoinductive characteristics that could maximize hedgehog signaling activity in the defect site.
Membrane lipids acting as secondary messengers are thought to be important in cell signaling.[13] Endogenous cholesterol and palmitic acid are covalently attached to the C- and N-termini of Shh producing a highly hydrophobic and motivated protein, which is necessary for hedgehog signal pathway transduction.[5, 14] Herein, we develop a multifunctional and versatile sterosome with the desired potentials of hedgehog signaling activation for bone regeneration (Scheme 1). In order to realize our idea, 20(S)-Hydroxycholesterol (20S-OHC) and palmitic acid (PA) are chosen to self-assemble into sterosomes (STs). 20S-OHC is used to stabilize sterosomes and bind with Smo while PA is employed as a hydrophobic segment. With the flexible surface of sterosomes, alendronate (Alt) is introduced on the STs to target bone tissues using its affinity for hydroxyapatite (HA, a main inorganic component of bone).[15] Considering the obstruction of negative surface for cellular internalization, agmatine is employed to enhance cell penetration through supramolecular interactions between its guanidine groups and cell membranes.[16] Finally, pDNA/polyethyleneimine (PEI) condensed particles are encapsulated into the core of sterosome for synergistic therapy. The engineering and multifunctional sterosomes are expected to provide a favorable microenvironment for bone regeneration with following advancements: (i) nanovector for Smo binding and Shh modification (20S-OHC/PA); (ii) bone targeting (Alt); (iii) enhanced cell-penetration (agmatine), and (iv) synergistically enhanced hedgehog signaling (20S-OHC + Shh DNA). In brief, this integrated strategy focuses on the development of novel nanoparticulate agonists to provoke hedgehog signaling for bone defect repair.
Scheme 1.
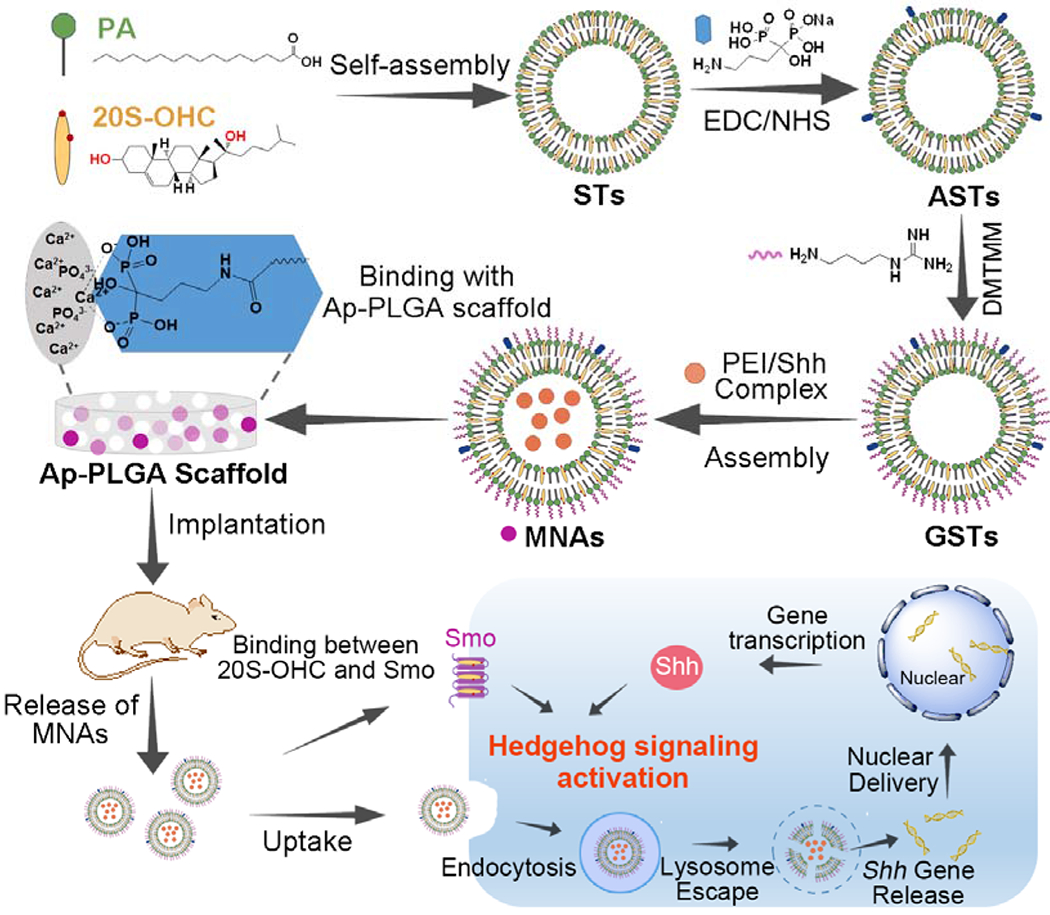
Schematic illustration of supramolecular fabrication on nanoparticulate agonists with hedgehog signaling activation for bone tissue regeneration, including self-assembly of PA and 20S-OHC, Alt and guanidino modification, high binding ability with Ap-PLGA scaffolds, specific binding to bone tissue, cell penetration, lysosome escape, nuclear delivery for provoking hedgehog signaling and stem cell differentiation.
2. Results and Discussion
2.1. Preparation and Physicochemical Characterization of Sterosomes
First, 20S-OHC/PA sterosomes were prepared by the self-assembling of 20S-OHC and PA under the ultrasonic environment, and 5% of their peripheral groups (-COOH) were decorated with HA-binding Alt via the condensation reaction to obtain Alt-modified sterosomes (ASTs).[12, 17, 18] The average size of sterosomes detected with dynamic light scattering (DLS) was decreased from 131.2 nm to 94.2 nm after modification with Alt (Figure S1 and Figure S2). The observed decrease in size is partly due to the replacement of carboxyl groups (-COOH) by Alt that may change the hydration of lipid bilayers. It is also possible that the change of zeta potential from −25.1 mV to −24.1 mV and the decreased repulsive force between charged groups on the sterosome surface induced smaller particles. All of the residual carboxyl groups were functionalized with superfluous agmatine to obtain guanidinerich sterosomes (GSTs) with strong cell-penetrating ability.[19] As shown by transmission electron microscopy (TEM, Figure 1A), GSTs displayed spherical nanostructures and three-dimensional (3D) architectures with the diameter from 100 to 200 nm. An average size of ~179.7 nm was detected with dynamic light scattering (DLS) measurement, which was consistent with the results of TEM image. Next, pDNA/PEI condensed complex was loaded into the core of GSTs to form multifunctional nanoparticulate agonists (MNAs). TEM image and DLS results revealed that the MNAs had ‘envelope-type’ nanostructures with an average size of ~199.2 nm (Figure 1B). It was noted that the zeta potentials of GSTs and STs were 29.3 and −25.1 mV (Figure 1C), indicating that there was a transformation from negative to positive surface due to the conjugation of guanidine groups. Moreover, these nanoparticles not only showed stable nanostructures but also displayed steady surface charge both at pH 7.4 phosphate buffered solutions (PBS) and culture medium containing 10% fetal bovine serum (FBS, Figure S3 and Figure S4). To investigate the binding capacity of nanoparticles to bone mineral via their Alt moieties, HA was selected as a model bone mineral and sterosomes were labeled with 5-carboxyfluorescein (5-FAM) for fluorescence detection.[18] As shown in Figure 1D, 92.7% of 5-FAM labeled MNAs could bind to HA after 24 h incubation, and all of the Alt-decorated sterosomes including ASTs, GSTs and MNAs displayed analogously strong HA-binding ability. In contrast, less than 10% of STs without Alt modification could bind to HA, manifesting that embellishment of Alt plays a key role in binding HA and targeting bone tissue specifically.
Figure 1.
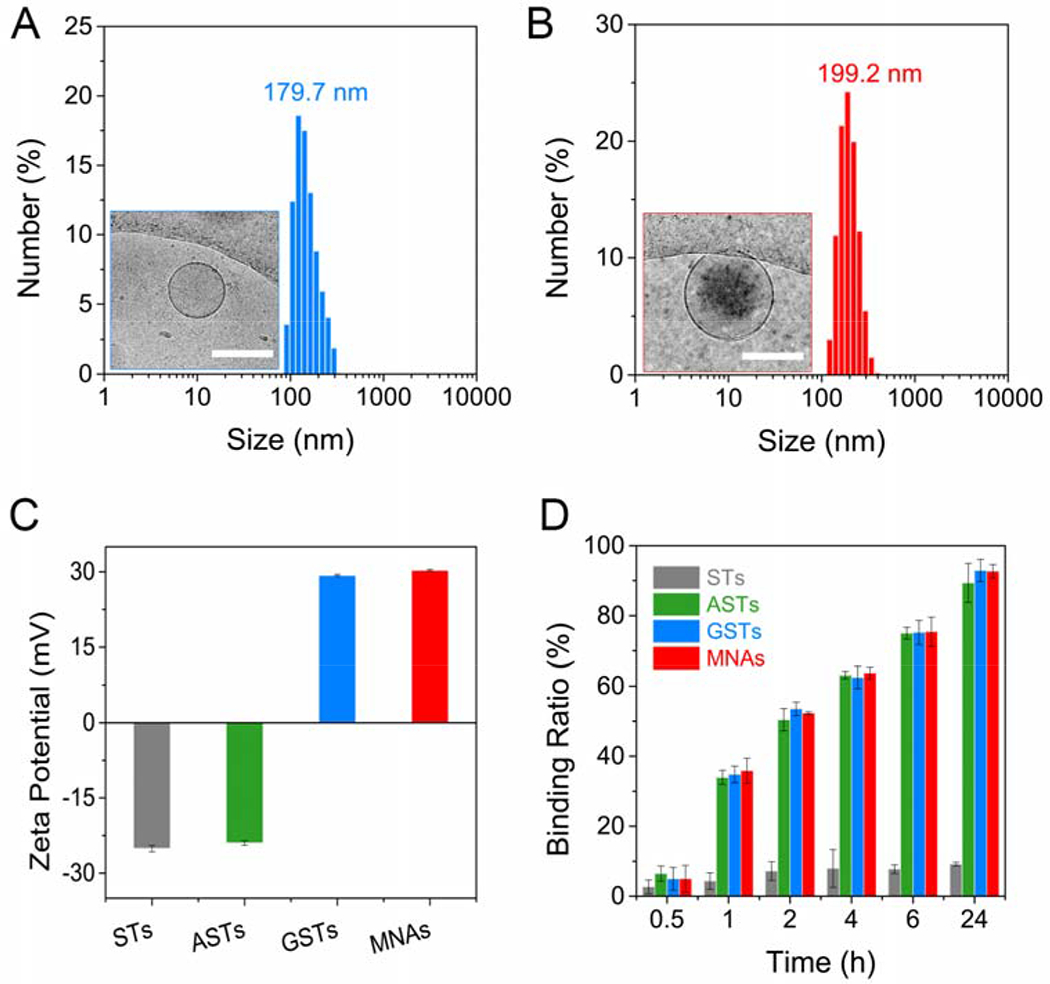
Physical Characterization of Multifunctional Sterosomes. Size distribution and TEM image (inset) of GSTs (A) and MNAs (B). The scar bar represents 200 μm. (C) Zeta potential of STs, ASTs, GSTs and MNAs in Tris-NaCl buffer solution (means ± standard deviation (SD), n = 3). (D) The binding kinetics of STs, ASTs, GSTs and MNAs to HA surface at various incubating times (means ± SD, n = 3).
2.2. Intracellular Fate of Nanoparticulate Agonists
Next, we turned to explore the cellular uptake of nanoparticulate agonists using mouse bone marrow stromal cells (BMSCs, Figure 2A). After incubation with 15 μg/mL 5-FAM labeled MNAs for 2 h, ~40% of MNAs were internalized into BMSCs. More than 90% of MNAs could enter the cells through 8 h incubation, thanks to the ultrastrong membrane-penetrating ability provided by their external guanidine groups.[20] Negative-charged sterosomes like STs and ASTs which had weak potential ability for penetration showed poor cellular uptake even after 24 h treatment. Although a range of 50-100 nm is known to be the optimal size for nanoparticles to achieve maximum cellular uptake, several studies report the maximum size of nanoparticle allowing cellular uptake via endocytosis to be around 200 nm.[21] In addition, guanidine groups introduced on the sterosomes could enhance cellular uptake. Encouraged by the considerable cellular uptake efficiency of MNAs, pEGFP was selected as a model pDNA in combination with confocal laser scanning microscopy (CLSM) to disclose an appropriate ratio between MNAs and pDNA/PEI particles for future signal activation and osteoinduction. In Figure 2B, green fluorescent protein (GFP) expression in MNAs group at a concentration of 15 μg/mL was strongest compared with other groups. GFP expression was decreased apparently after treated with PEI in culture medium containing 10% FBS simulating normal physiological conditions, which is a shortcoming of cationic polymers. In addition, PEI group without FBS still showed weaker GFP expression, which was used as a gold standard in gene transfection. Moreover, the MNAs exhibited no obvious cytotoxicity to BMSCs at a concentration range from 2.5 to 20 μg/mL, while the gold standard control group (PEI-) could induce significant cytotoxicity towards BMSCs after 48 h incubation. Collectively, the MNAs give remarkable effects for toilless cell membrane penetration, high gene transfection efficiency, serum resistance, and good biocompatibility.
Figure 2.
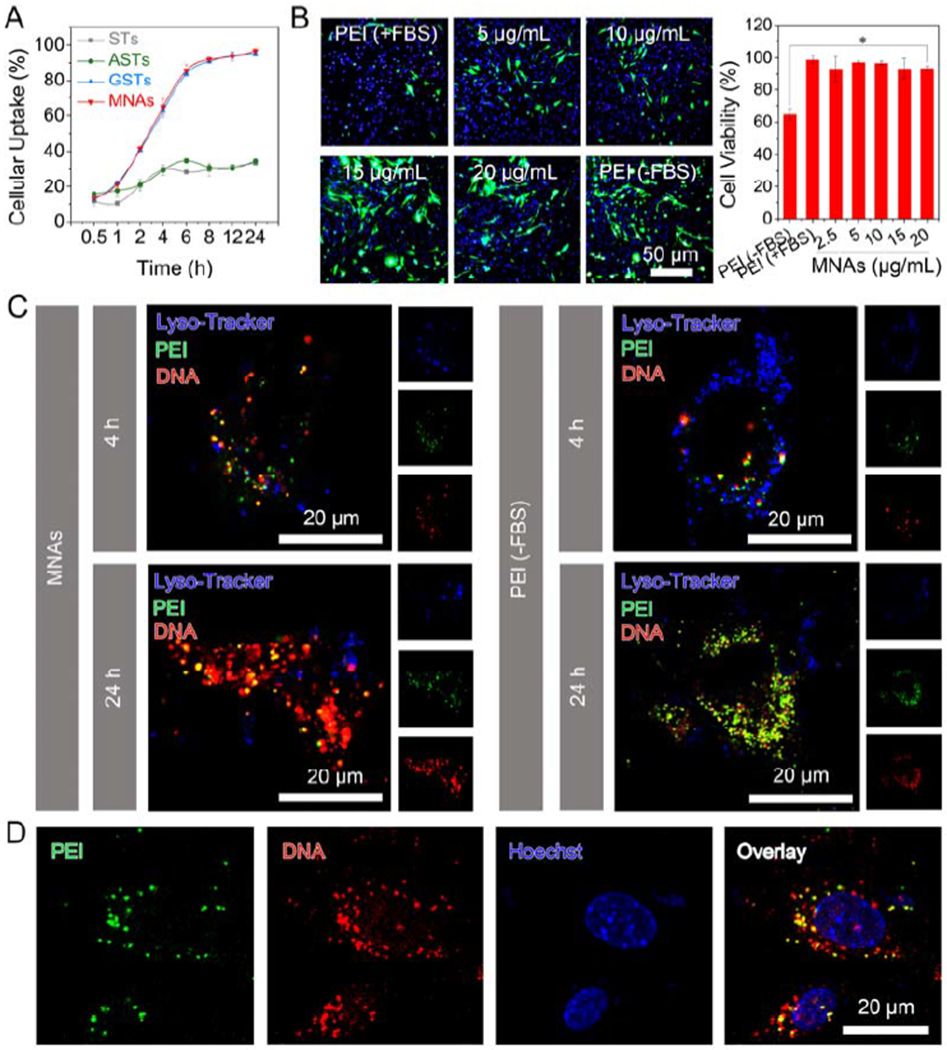
2D cell culture of BMSCs for investigating intracellular fate and gene expression efficiency of MNAs. (A) Cellular uptake efficiency of 15 μg/mL STs, ASTs, GSTs and MNAs over 24 h (means ± SD, n = 3). (B) GFP expression (left) in BMSCs after exposure to MNAs with various concentrations, pDNA/PEI complex without (−) FBS or with (+) FBS for 48 h including GFP channel (green), Hoechst-stained nucleus channel (blue) and overlay of previous images. Cell viability was detected by alarmerBlue assay (means ± SD, n = 6). (C) CLSM images for BMSCs after incubation with 15 μg/mL MNAs (left) and pDNA/PEI complex (right), including FITC-labeled PEI channel (green), Cy5-labeled pDNA channel (red), Lysotracker-stained lysosome channel (blue) and overlay of previous images. (D) CLSM images for BMSCs after incubation with 15 μg/mL MNAs for 24 h, including FITC-labeled PEI channel (green), Cy5-labeled pDNA channel (red), Hoechst-stained nucleus channel (blue) and overlay of previous images.
We further studied the intracellular fate of MNAs using fluorescein isothiocyanate (FITC)-labeled PEI and Cy5-labeled pDNA. CLSM images indicated that MNAs were entrapped into lysosomes after 2 h incubation (Figure S5, overlay of blue, green and red fluorescence). When the incubation time was increased to 4 h, MNAs could escape from lysosomes (Figure 2C, dissociation of blue fluorescence with green and red fluorescence) and some parts of pDNA could be released from MNAs and enter into the cell nucleus (Figure 2D, overlay of blue fluorescence with red fluorescence). However, a large proportion of pDNA (red fluorescence) was still overlapped with PEI (green fluorescence) in the gold standard control group (PEI-) after 24 h (Figure 2C, Figure S6 and S7). As expected, the MNAs could deliver their cargo pDNA into cells, escape from lysosomes and enter into the nucleus efficiently thanks to supramolecular interaction between their guanidine surface and membranes.[22]
2.3. Osteogenic Activity of Nanoparticulate Agonists in 2D Cell Culture
Following the research of intracellular fate, we turned to evaluate the osteogenic capacity of nanoparticulate agonists towards BMSCs. Given the important role of Shh in regulating skeletal regeneration among the hedgehog signaling family, Shh/PEI complex was introduced into the core of GST to form nanoparticulate agonist. First, BMSC differentiation was determined through detecting the expression of alkaline phosphatase (ALP), an early marker of osteogenesis.[23] After 7 days, there was the strongest ALP expression in the MNAs group and GSTs also could induce ALP expression moderately (Figure 3A and Figure S8). From a quantitative analysis, the ALP activity levels of MNA- and GST-treated cells were raised 2.6-fold and 1.8-fold as compared with untreated cells after 7 days of incubation, respectively (Figure 3B). PEI (+) could enhance the ALP activity level to 1.28-fold after incubation 7 days. Then the accumulation of calcium (late osteogenic marker) during BMSC osteogenic differentiation was further analyzed by alizarin red staining.[24] After 14 days, there was the most remarkable red-staining area (precipitation and mineralization of calcium salts) in MNA-treated cells and modest red-staining area was shown in GST-treated cells (Figure 3C and Figure S9). These results manifested that exert intrinsic osteoinductive capacity, which was greatly enhanced with Shh gene loading.
Figure 3.
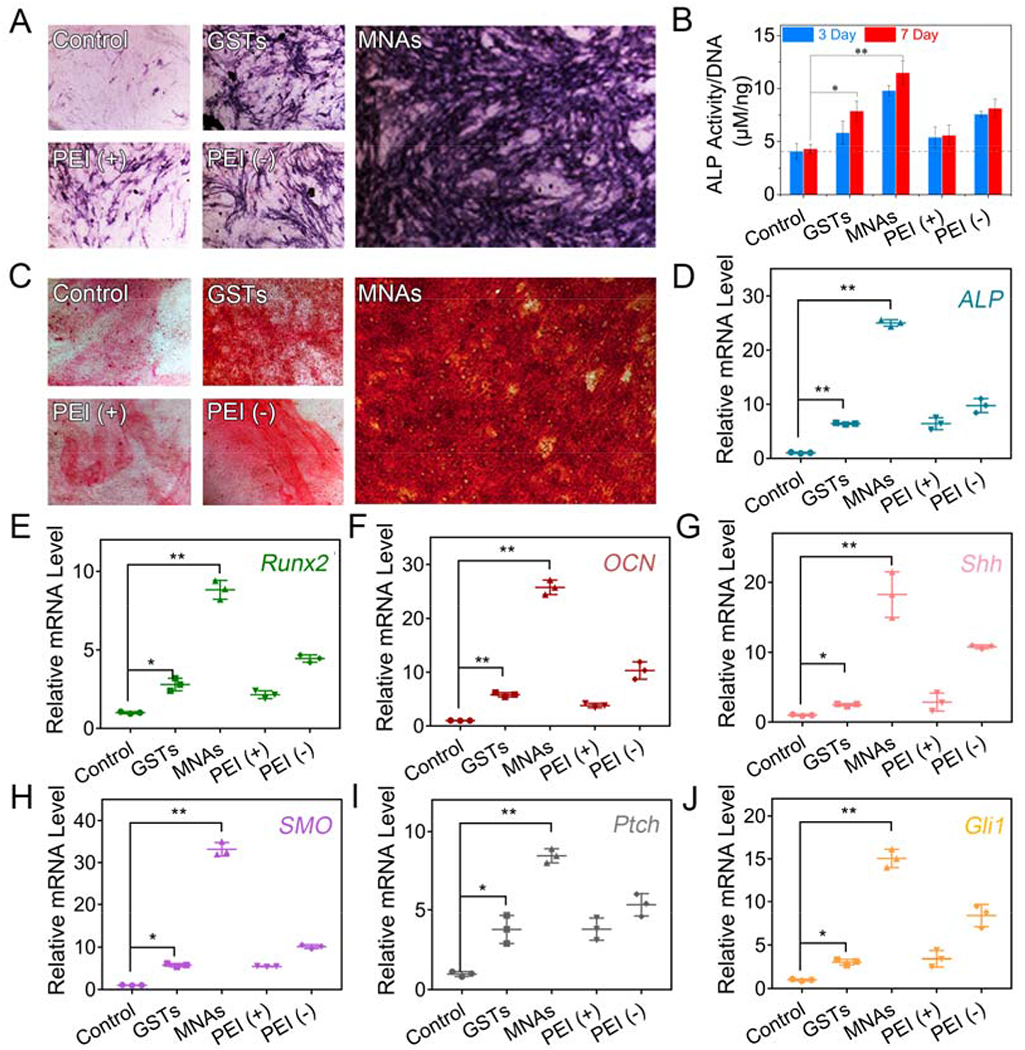
Osteoinductive capacity of MNAs towards BMSCs in 2D cell culture. (A) Expression and (B) ALP activity of ALP in BMSCs incubated with GSTs and MNAs (15 μg/mL) in culture medium for 2 days and treated with osteogenic medium for another 3 or 7 days. pDNA/PEI complex in culture medium with or without FBS was used as control groups. (C) Mineralization in BMSCs after incubation of 15 μg/mL GSTs and MNAs in culture medium for 2 days and treatment with osteogenic medium for another 14 days. qPCR analysis for mRNA levels of osteogenic markers including ALP (D), Runx2 (E) and OCN (F) and hedgehog signaling markers including Shh (G), Smo (H), Ptch (I) and Gli1 (J) in BMSCs (means ± SD, n = 3, *p < 0.05, **p < 0.001 by one-way analysis of variance, ANOVA).
At the molecular level, mRNA levels of osteogenic differentiation markers including ALP, Runx2, osteocalcin (OCN) were quantified with quantitative polymerase chain reaction (qRT-PCR) analysis (Figure 3D–F).[25] The ALP, Runx2 and OCN mRNA levels were raised 25.1-fold, 8.8-fold and 25.7-fold after treatment of MNAs, respectively, while GSTs induced slight upregulation on mRNA levels of ALP (6.3-fold), Runx2 (2.8-fold) and OCN (5.8-fold) in comparison with untreated group. These results were well consistent with ALP staining, activity and calcium accumulation, indicating that both osteogenic genes and protein could be regulated by our tailored MNAs. To further investigate the activation of the hedgehog signaling pathway by MNAs, the mRNA expressions of some key proteins were detected using qRT-PCR assay. As shown in Figure 3G, treatment with MNAs had obvious influence on Shh mRNA level with 18.3-fold upregulation compared with untreated cells, while there was only 10.9-fold upregulation of Shh mRNA level in PEI-treated cells (positive control group). It is well known that Shh protein binds to Ptch for activating Smo protein.[2] Smo activates intracellular proteins, leading to the activation of Gli transcription factors.[2] Notably, the Ptch, Smo and Gli1 mRNA levels of MNA-treated cells have been increased up to 8.5-fold, 32.5-fold and 15.0-fold upregulation compared with control group, while the Ptch, Smo and Gli1 mRNA levels of MNA-treated cells were 2.3-fold, 5.7-fold and 4.8-fold increase compared with GST-treated cells, respectively, manifesting that our MNAs consisted of 20S-OHC (modification of Shh and binding with Smo), PA (modification of Shh) and Shh gene (upregulation of Shh protein) could efficaciously and synergistically induce hedgehog signaling (Figure 3H–J).
2.4. Binding Ability of MNAs to Apatite-Coated 3D Scaffolds
The osteoinductive capacity of MNAs were further evaluated in 3D setting using apatite-coated poly lactic-co-glycolic acid (Ap-PLGA) porous scaffolds that mimic the trabecular bone structure and provide a favorable substrate for cell adhesion and biomolecule delivery. The microstructures of scaffolds were analyzed using scanning electron microscopy (SEM). As observed, PLGA scaffolds prior to apatite coating displayed smooth surfaces and abundant open-porous structures with the pore size between 200 to 300 μm (Figure 4A). After 12 h immersion in simulated body fluid (SBF) solutions, there were numerous plate-like structures on Ap-PLGA surfaces without compromising interconnected pore morphology. GSTs and MNAs could bind with Ap-PLGA scaffolds intensely due to the interaction between Alt moieties and apatite coating. Both GST- and MNA-bound Ap-PLGA scaffolds exhibited similar porous morphology with Ap-PLGA scaffolds, indicating that nanoparticle binding had no influence on the structure of 3D scaffolds. Meanwhile, apatite coating on the interior surface of scaffolds was further characterized using energy dispersive X-ray spectroscopy (EDX, Figure 4B). The calcium–phosphorus (Ca/P) ratios of Ap-PLGA scaffolds, GST-bound and MNA-bound Ap-PLGA scaffolds were approximately 1.64, 1.55 and 1.50, respectively, which were close to the theoretical Ca/P ratio of HA. There were slightly lower Ca/P ratios after GSTs and MNAs binding because phosphorus elements were not only from apatite coating but also from Alt groups and pDNA.
Figure 4.
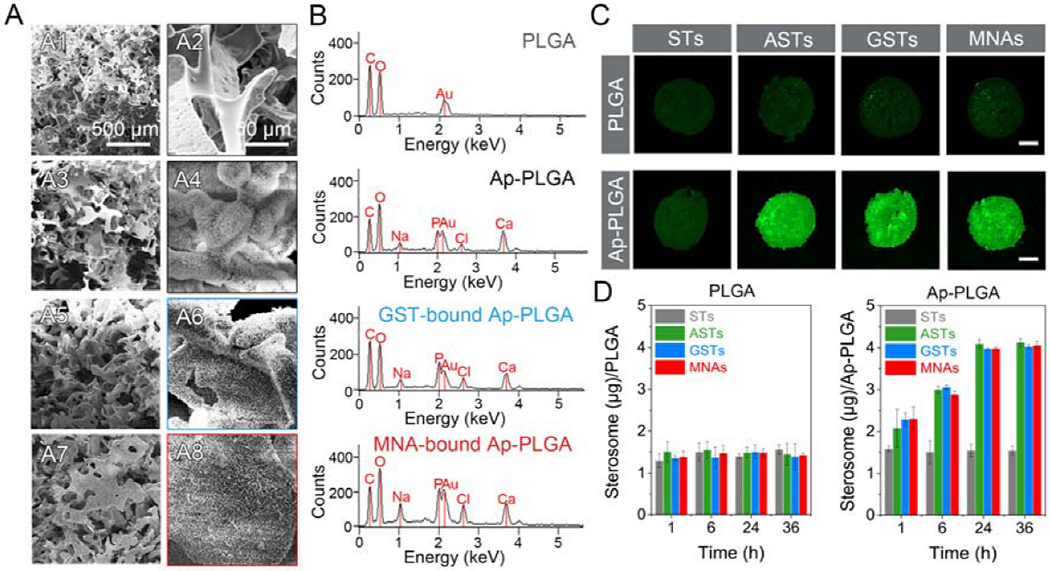
Binding ability between nanoparticles and 3D porous scaffolds. (A) SEM images of PLGA (A1, A2), Ap-PLGA (A3, A4), GST-bound Ap-PLGA (A5, A6), MNA-bound Ap-PLGA (A7, A8) scaffolds. (B) EDX spectra of PLGA, Ap-PLGA, GST-bound Ap-PLGA, MNA-bound Ap-PLGA scaffolds. (C) Fluorescent images of PLGA and Ap-PLGA scaffolds after incubation of 100 μg/mL STs, ASTs, GSTs and MNAs for 24 h. The scar bar represents 1 mm. (D) Binding content of sterosomes on a scaffold after treatment with 5 μg STs, ASTs, GSTs and MNAs over 36 h (means ± SD, n = 3).
To further evaluate the binding efficiency of MNAs to Ap-PLGA scaffolds, 5-FAM labeled nanoparticles were used for qualitative and quantitative analysis. As exhibited in Figure 4C and Figure S10, considerable green fluorescence signals were observed on Ap-PLGA scaffolds after treatment with 5-FAM labeled ASTs, GSTs and MNAs (100 μg/mL, 50 μL) for 24 h. However, the green fluorescence signals were very weak on PLGA scaffolds without apatite coating (Figure S11). After binding with scaffolds, the fluorescence intensity of remanent sterosomes was measured to quantitatively determine the apatite-binding capacity (Figure 4D). With the increase of incubation time, the binding content was enhanced notably. There were 3.9 μg MNAs per Ap-PLGA scaffold after 24 h treatment, which were 2.6-fold compared to the ST-bound Ap-PLGA scaffold. Only 1.4 μg MNAs could bind to a PLGA scaffold after 24 h incubation. These results are consistent with microscope observation, testifying that our nanoparticulate agonists could be loaded on Ap-PLGA scaffolds thanks to the strong supramolecular interactions between Alt groups of MNAs and apatite surface of Ap-PLGA scaffolds.
2.5. Cytotoxicity and Osteoinduction of MNAs in 3D Scaffolds
To demonstrate the cytotoxicity of MNA-bound Ap-PLGA scaffolds towards BMSCs, we used a Calcein AM/Ethidium homodimer (EthD-1) double staining method to observe live (green) and dead (red) cells (Figure 5A and Figure S12). There were no distinct dead cells on the MNA-bound Ap-PLGA scaffold even after 7 days of incubation. More importantly, cell clusters were formed throughout the porous structure of MNA-bound Ap-PLGA scaffold, indicating that the MNA-bound Ap-PLGA scaffold could provide an environment permissive for cell adhesion, survival, migration and proliferation. However, PEI showed cytotoxicity towards BMSCs with apparent red fluorescence. Then the quantitative cell viability of MNAs towards BMSCs on 3D scaffolds was evaluated by an alarmerBlue assay (Figure 5B). Fluorescence signals could add to 2.1-fold from day 1 to 7 in the MNAs group, and the trend of cell proliferation was similar to untreated cells. These results illustrated that MNAs incorporated with Ap-PLGA 3D scaffolds could provide favorable substrates for cell proliferation and function.
Figure 5.
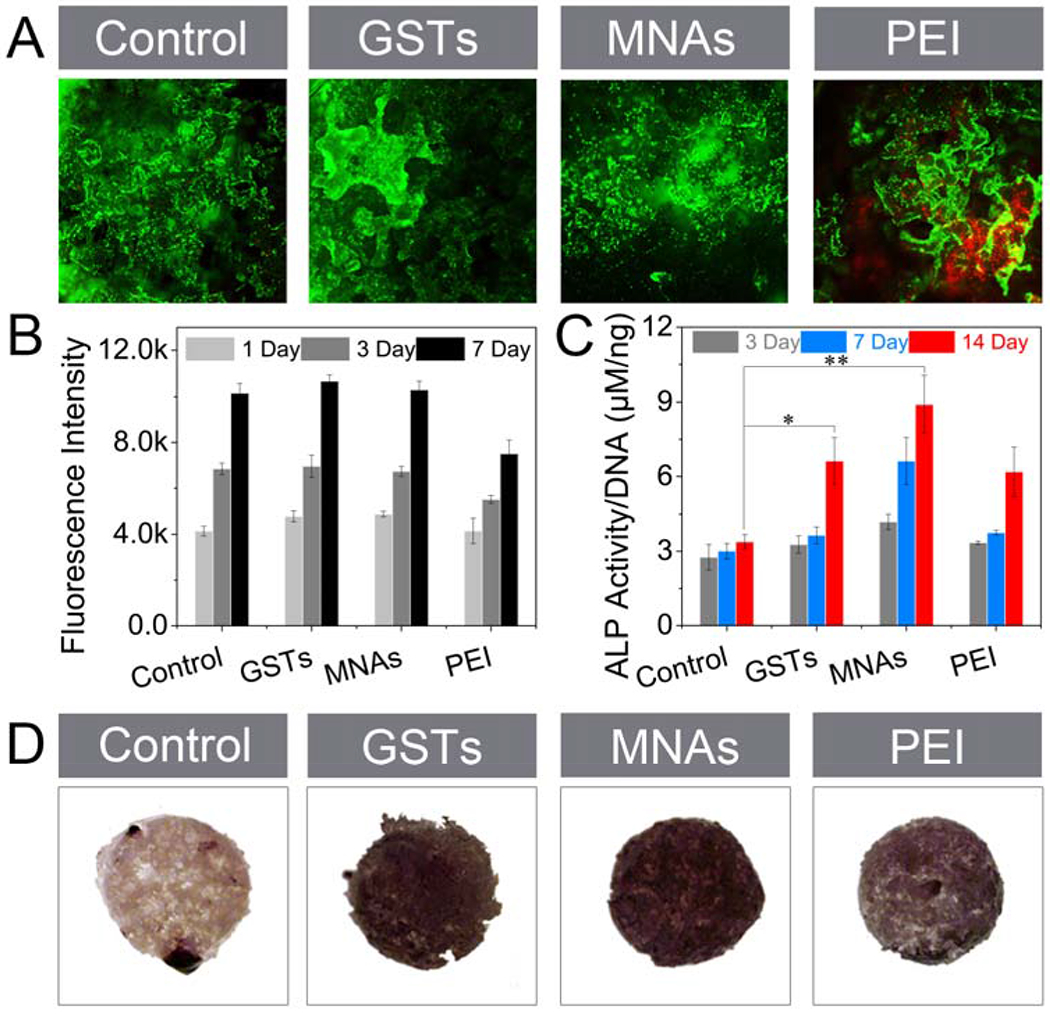
Cell viability and osteoinduction of MNAs against BMSCs in 3D culture. (A) Live/Dead staining of Ap-PLGA, GST-bound Ap-PLGA, MNA-bound Ap-PLGA and PEI-loaded Ap-PLGA scaffolds after seeding BMSCs and culturing for 1 day. (B) Fluorescence intensity of BMSCs on Ap-PLGA, GST-bound Ap-PLGA, MNA-bound Ap-PLGA and PEI-loaded Ap-PLGA scaffolds after incubation in culture medium and staining with alarmerBlue at day 1, 3 and 7 (means ± SD, n = 3). (C) ALP activity (means ± SD, n = 3, *p < 0.05, **p < 0.001 by one-way analysis of variance, ANOVA) and (D) ALP expression of BMSCs on Ap-PLGA, GST-bound Ap-PLGA, MNA-bound Ap-PLGA and PEI-loaded Ap-PLGA scaffolds after incubation in osteogenic medium.
Next, the osteoinductive capacity of MNA-bound Ap-PLGA scaffolds was evaluated by monitoring ALP expression and activity. As shown in Figure 5C, the ALP activity level of BMSCs on MNA-bound Ap-PLGA scaffolds was increased from 4.2 μM per 1 ng DNA to 8.9 μM per 1 ng DNA after incubation from 3 to 14 Days. In contrast, ALP activity level was lower in control groups including PEI-bound and GST-bound Ap-PLGA scaffolds. ALP staining further confirmed that there were the highest ALP expression levels on MNA-bound Ap-PLGA scaffolds, and the ALP expression increased over time (Figure 5D and Figure S13). Therefore, our MNAs could bind with Ap-PLGA scaffolds and support mesenchymal cell osteogenic differentiation effectively.
2.6. Molecular Regulation of MNAs in 3D Scaffolds
To disclose the MNA-related molecular mechanisms for bone induction in 3D scaffolds, the expression of osteogenic markers (e.g. ALP, Runx2, Col 1α1 and OCN) was evaluated using qRT-PCR analysis (Figure 6A–D). The mRNA levels of ALP, Runx2, Col 1α1 and OCN in MNA-bound Ap-PLGA scaffolds were increased 2.7-, 3.2-, 2.9- and 2.4-fold, respectively, after incubation in osteogenic culture medium for 14 days. Control groups GST- and PEI-bound Ap-PLGA scaffolds displayed a moderate increase in mRNA level of ALP, Runx2, Col 1α1 and OCN, implying that ingenious design of nanoparticulate agonists exerted synergistically enhanced osteogenic capacity mediated by lipid constituents and gene core. Furthermore, we investigated whether the MNA function for mediating osteogenesis was through activating hedgehog signaling by monitoring the mRNA level of key proteins in the hedgehog signaling pathway. Shh mRNA level of cells on MNA-bound Ap-PLGA scaffolds enhanced 80-fold compared with cells seeded on blank Ap-PLGA scaffolds (Figure 6E). As expected, there was a strong increase in mRNA levels of Ptch, Smo and Gli1 proteins with 6.4-, 7.2- and 15.8-fold upregulation in MNA-bound Ap-PLGA scaffolds compared with blank group, respectively (Figure 6F–H). However, GST-bound Ap-PLGA scaffolds had a weaker influence on the upregulation of Shh, Ptch, Smo and Gli1 mRNA levels, which was consistent with the qRT-PCR results in 2D cell culture. The expressions of Shh and Gli1 were increased in MNAs group as observed by western blot analysis (Figure S14). Therefore, our tailored nanoparticulate agonists could effectively activate hedgehog signaling for enhanced osteogenesis with potential mechanisms, including production of Shh morphogen by Shh gene transfection, Smo binding and Shh modification by 20S-OHC and PA, activation of Gli family transcription factors (Figure 6I).
Figure 6.
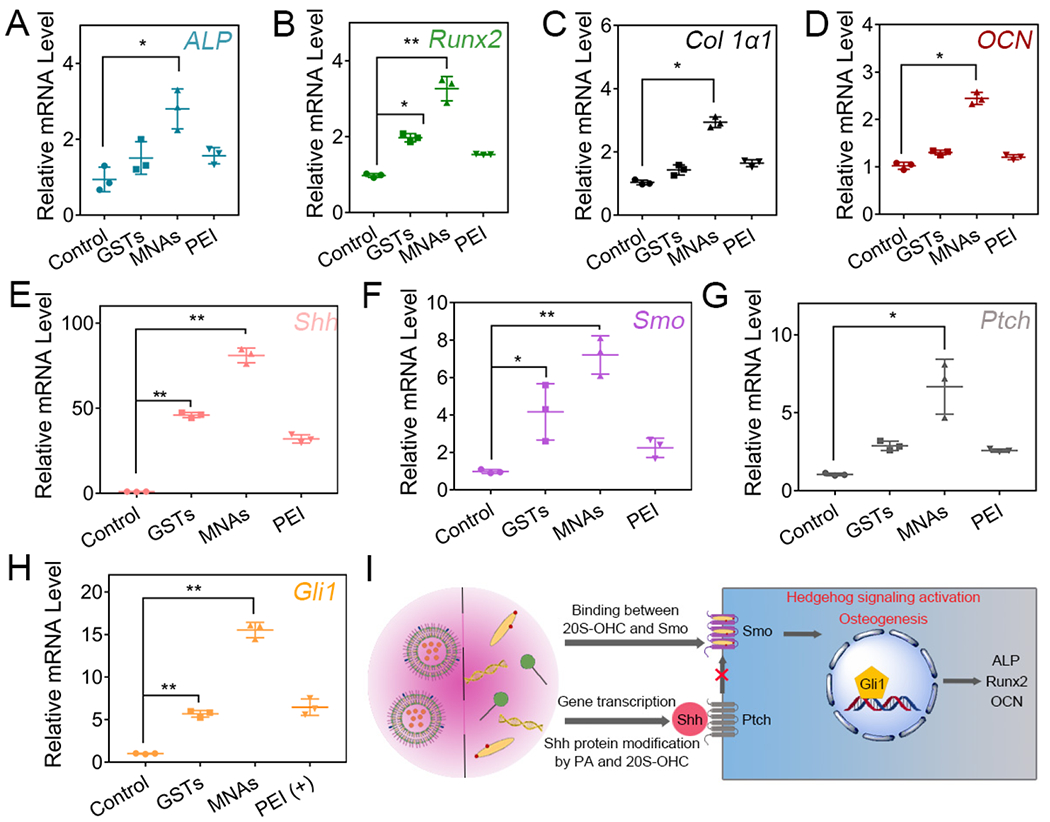
Gene expression of BMSCs in Ap-PLGA scaffolds loading with GSTs, MNAs and PEI. Osteogenic markers ALP (A), Runx2 (B), Col 1α1 (C) and OCN (D) were evaluated on day 14. Hedgehog genes Shh (E), Smo (F), Ptch (G) and Gli1 (H) were detected on day 2 (means ± SD, n = 3, *p < 0.05, **p < 0.001 by one-way analysis of variance, ANOVA). (I) Schematic diagram of the hedgehog signaling pathway.
2.7. Osteoinduction of MNAs in vivo
Having confirmed that MNAs have an efficient osteogenic ability in vitro, we next evaluated their osteogenic efficiency in vivo using the calvarial defect model of mice.[26] Ap-PLGA scaffold, GST-bound and MNA-bound Ap-PLGA scaffold were implanted into 3.0 mm critical size defects to assess bone regeneration. After six weeks, new bone formation in the calvarial defects was observed using micro-computed tomography (μ-CT). As shown in Figure 7A, distinctly more new bone and smaller defect sizes appeared in MNAs group compared with control group. The amount of newly formed bone in GSTs group and PEI group was higher than control group but lower than MNAs group. The relative new bone surface area, bone volume/tissue volume (BV/TV), and trabecular number (Tb.N, mm−1) were obtained by quantification of μ-CT images (Figure 7B). Defects treated with pDNA/PEI, GSTs and MNAs showed approximate 38.9%, 44% and 75% healing, respectively. However, control group treated with Ap-PLGA showed only 17% healing. The BV/TV value of the MNAs group (15.1%) was higher than that of the GSTs group (6.1%) and PEI group (4.0%), while the BV/TV value was less than 2% in control group. The Tb.N was up to 2.3 mm−1 in MNAs group, which was higher than that of the GSTs group (0.7 mm−1), PEI group (0.5 mm−1 and control group (0.2 mm−1). These results demonstrate the combined bone forming capacity of GSTs and Shh gene, indicating that the modular components of MNAs were effective to promote bone defect regeneration.
Figure 7.
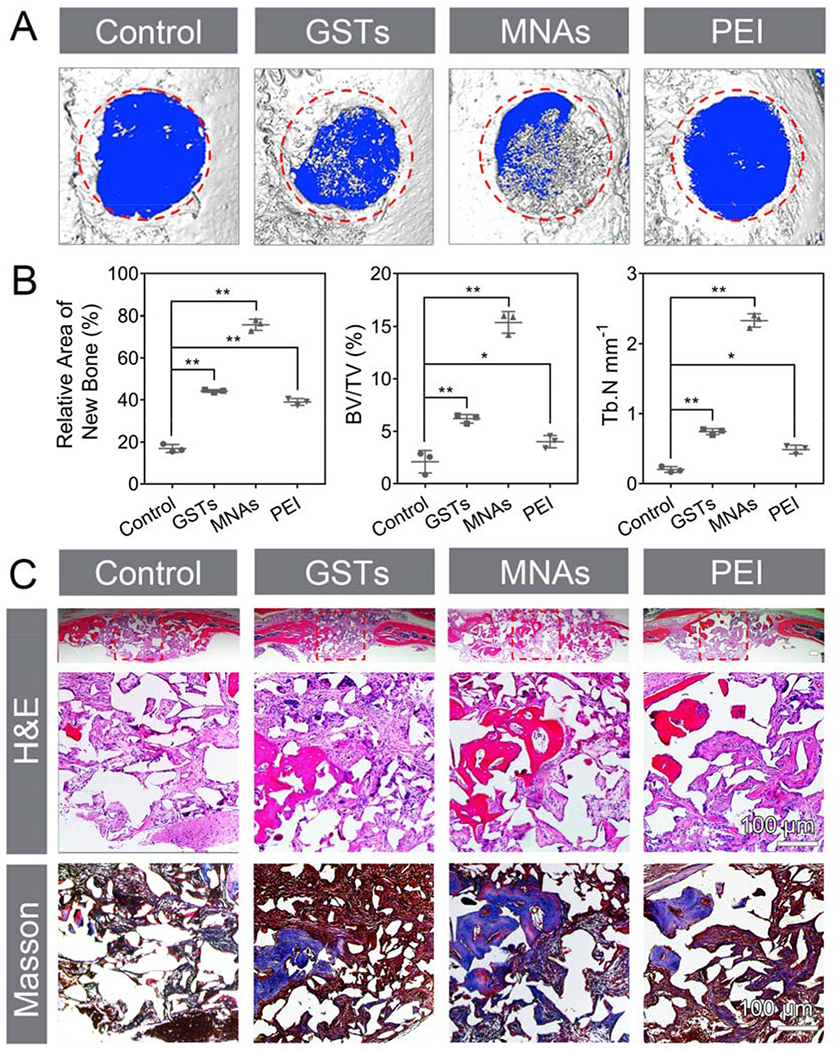
In vivo evaluation of osteoinduction using calvarial defect model. (A) 3D μ-CT images of calvarial defects. The red area with 3 mm diameter indicates the defect site. (B) Semiquantitative analysis of relative new bone, BV/TV and Tb.N (means ± SD, n = 3, *p < 0.05, **p < 0.001 by one-way analysis of variance, ANOVA). (C) H&E staining, magnified images of H&E and Masson trichrome staining. Red boxes represent the magnified areas. Scar bar repents 100 μm.
The newly formed bony tissue was also analyzed using hematoxylin and eosin (H&E) and Masson trichrome staining (Figure 7C). H&E staining results indicated that newly formed bone was prominent at the defect edge and was also present throughout the defect treated with MNAs after 6 weeks, which was consistent with the results of μ-CT. Masson trichrome staining revealed that there was an obvious osteoid matrix formed within the regenerate after treatment of MNAs. However, defects treated with GSTs and pDNA/PEI were occupied with moderate bone healing with fibrous soft tissue. Control-treated groups showed mainly fibrous tissue with minimal bone formation. These results manifested that our nanoparticulate agonists have a significant potential for bone healing.
3. Conclusions
In conclusion, we have successfully displayed molecular and supramolecular engineering of novel nanoparticulate agonists of the hedgehog signaling pathway that may promote bone repair and regeneration. These nanoparticulate agonists are prepared using an analog of cholesterol (20S-OHC) and PA that are involved in lipid modification of hedgehog proteins. The nanoparticulate agonists potentially target bone fracture due to a high affinity to bone mineral HA from Alt modification. Furthermore, the guanidine ornaments endow nanoparticulate agonists’ high cell-penetrating ability to overcome cell membrane barriers. Most importantly, the integrated MNAs significantly improve osteogenic differentiation of bone marrow stem cells through 20S-OHC + Shh gene-mediated synergistic activation of hedgehog signaling. This work presents a promising nanoparticulate alternative and hedgehog signaling regulation for faster and more efficacious bone regeneration.
4. Experimental Section
Materials:
PA, tris(hydroxymethyl)-aminomethane (Tris), NaCl, Alt sodium 3-(3-dimethylaminopropyl) carbodiimide hydrochloride (EDC.HC1), N-hydroxysuccinimide, agmatine sulfate salt, 4-(4,6-Dimethoxy-l,3,5-triazin-2-yl)-4-methylmorpholinium chloride, PEI, HA, Hoechst 33342, 5-bromo-4-chloro-3-indoxylphosphate (BCIP), Nitro Blue tetrazolium (NBT), Alizarin red S, L-ascorbic acid, p-nitrophenol phosphate, β-glycerophosphate, dexamethasone were purchased from Sigma Aldrich (St.Louis, MO). 20S-OHC was obtained from R&D System Inc. (Minneapolis, MN). Cholesterol fluorometric assay kit was obtained from Cayman Chemical (Ann Arbor, MA). 5-FAM cadaverine and LysoTracker blue were purchased from AAT Bioquest Inc. (Sunnyvale, CA). PLGA (Poly-Lactic-Glycolic-Acid), cell culture media Dulbecco’s modified Eagle’s medium (DMEM), penicillin, streptomycin, Calcein AM, EthD-1, Quant-iT™ PicoGreen™ dsDNA Assay Kit, Trizol reagents and cDNA transcription kit were purchased from Life Technologies (Grand Island, NY).
Preparation of MNAs:
Firstly, STs were prepared using the ultrasonic method. PA/20S-OHC (molar ratio: 3/7) were dissolved in benzene/methanol (volume ratio: 9/1) solution. The solution was removed under vacuum overnight and hydrated with Tris-NaCl buffer (50 mM Tris, 140 mM NaCl, pH 7.4). The suspensions were vortexed, warmed at 70 °C and frozen at −80 °C for five cycles to obtain multilamellar vesicles. Next, STs was obtained under an ultrasound condition (high-power 500 W sonic dismembrator, 20 s on, 5 s off, 20% amplitude, 25 W/mm2 power intensity) for 20 min. The concentration of STs was detected by the cholesterol fluorometric assay kit. For Alt modification, STs was activated by EDC and NHS for 4 h. Then Alt was added and reacted for 24 h at room temperature. Subsequently, the suspension was purified by size exclusion chromatography with Sephadex G-50 to remove the un-conjugated Alt, EDC and NHS. The content of Alt was determined with a standard iron (III) chloride solution. Light absorbance at 293 nm was measured by a microplate reader. To prepare GSTs, ASTs, agmatine and DMTMM were mixed and reacted for 24 h at room temperature. Subsequently, GSTs were obtained after purification using size exclusion chromatography with Sephadex G-50. The pDNA was condensed with PEI at an N/P ratio of 10. Then pDNA/PEI particle was added into GSTs solution and mixed using vortex for 1 min. pDNA/PEI particle was assembled into the core of GSTs under an ultrasound condition for 1 min to obtain MNAs. Size and zeta potential of nanoparticles were detected by a Malvern Zetasizer. The morphology of nanoparticles was observed using cyro-TEM (TF-20).
HA Binding Assay:
HA was dispersed in Tris-NaCl buffer at a 50 mg/mL concentration. 5-FAM labeled STs, ASTs, GSTs and MNAs were prepared at 100 μg/mL, respectively. 100 μL HA suspension was mixed with 100 μL nanoparticles and placed on a shaker at 25 °C. At the given time, the mixture was centrifuged (12000 rpm, 1 min) and the supernatant was measured by microplate reader (Ex: 480 nm; Em: 530 nm).
Cellular Uptake Assay:
The BMSCs (D1 ORL UVA [D1], D1 cell, CRL-12424) was purchased from American Type Culture Collection (ATCC, Manassas, VA) and cultured in DMEM with 10% FBS and 1% penicillin/streptomycin at 37 °C in a humidified atmosphere containing 5% CO2. For cellular uptake assay, BMSCs were cultured in 24-well plates at a concentration of 1 × 10⁵ cells per well for 24 h. The cells were incubated with 15 μg/mL 5-FAM labeled nanoparticles over 24 h. At given times, the supernatant was collected and cells were lysed using 0.1% Tween-20 buffer. The fluorescence intensity of supernatant and cell lysate was detected using a microplate reader (Ex: 480 nm, Em: 530 nm).
Gene transfection:
For EGFP gene transfection, BMSCs were cultured in 96-well plates at a concentration of 1 × 10⁴ cells per well for 24 h. The cells were incubated with MNAs from 5 to 20 μg/mL. The mass ratio between pDNA and MNAs was from 1/2.5 to 1/10. After transfected for 48 h, the cells were washed with PBS for 3 times and imaged by an Olympus SZX16 microscope. Cells treated with PDNA/PEI complex (N/P=10) in culture medium with or without FBS were used as negative and positive control group, respectively.
Intracellular Tracking:
FITC-labeled PEI and Cy5-labeled pDNA were used to form complex at N/P 10. BMSCs were cultured in glass-bottomed dishes at a concentration of 1 × 10⁴ cells per well for 24 h. After incubation with MNAs (300 ng Cy5-labeled pDNA per well) in culture medium containing 10% FBS or PDNA/PEI complex in culture medium without FBS, cells were washed, stained with LysoTracker blue or Hoechst 33342 and imaged using CLSM with the FITC channel (green, ex 480 nm and em 530 nm), Cy5-labeled pDNA channel (red, EX 633 nm and EM 670 nm), LysoTracker-stained lysosome channel (blue, EX 405 nm and EM 422 nm) or Hoechst-stained nuclear channel (blue, EX 346 nm and EM 460 nm).
ALP Assay and Mineralization in 2D cell culture.
Cells were cultured in 48-well plates (5 × 10⁴ cells per well) and treated with GSTs, MNAs and pDNA/PEI complex in culture medium for 2 days. Then cells were cultured in osteogenic DMEM medium containing 10% FBS, 50 μg/mL L-ascorbic acid, 10 mM β-glycerophosphate, 1% penicillin/streptomycin and 100 nM dexamethasone for 7 Days. For ALP staining, cells were fixed using 10% formalin solution and stained with BCIP/NBT in ALP solution (100 mM Tris, 50 mM MgCl2, 100 mM NaCl, pH 8.5) for 30 min. Images were recorded using an Olympus 1X71 microscope (Olympus, Tokyo, Japan). For ALP activity assay, cells were washed with PBS and lysed through 0.1% Tween-20 buffer. The supernatant was collected after 5 min centrifugation at 12000 rpm and reacted with phosphatase substrate for 2 h at 37 °C. ALP concentration was measured at a wavelength of 405 nm using a microplate reader, which was normalized by DNA content using Quant-iT™ PicoGreen™ dsDNA Assay Kit.
For mineralization assay, after 14 days, cells were washed with PBS and stained with 2% Alizarin Red S solution for 5 min. Cells were rewashed with PBS for 3 times (0.5 h per time) and observed by an Olympus IX71 microscope.
qRT-PCR Analysis in 2D cell culture.
At given times, total RNA was obtained from cells using Trizol reagent. cDNA was synthesized using a cDNA transcription kit (Invitrogen). Amplification reactions including 1 μL of cDNA template, 1 μL of primer, 8 μL of distilled deionized water and 10 μL of SYBR Green were carried out using a LightCycler 480 PCR (Indianapolis, IN) for 55 cycles. The sequences of primers are listed in Table S1.
Preparation of Scaffold.
The 3D porous PLGA scaffold was prepared using salt-leaching methods. Firstly, PLGA (85:15, 0.7 g) was dissolved in CHCl3 (3.3 g, 2.2 mL) solutions in a glass vial. Then 0.5 g PLGA solution was dropped into methanol (0.2 g, 252 μL) and mixed immediately until the solution is clear. 1.5 g sucrose (200-300 μm) was added and mixed immediately. The mixture was transferred to the center of a Teflon plate, covered the second plate and clamped them tightly. PLGA sheet was collected after freeze-drying. The PLGA sheet was incubated in deionized water to remove sucrose, sterilized using 70% EtOH, washed with deionized water and dried in laminar flow overnight. Thin scaffold with 500 μm thick and 3.0 mm in diameter was obtained after cutting using a 3.0 mm sterile punch. The PLGA scaffold was obtained after particulate leaching using glow discharge argon plasma etching (Harrick Scientific, Ossining, NY).
For apatite coating, the PLGA scaffold was incubated 1 mL 5×SBF 1 solution for 12 h and transferred into 1 mL 5×SBF 2 solution for another 12 h incubation. Ap-PLGA scaffold was obtained after washing with sterile water and drying in the laminar flow hood. Preparation of SBF 1 and SBF 2 solutions was illustrated in the Supporting Information. The morphology of the scaffold was observed using a Nova NanoSEM 230 microscope (FEI, Hillsboro, OR) after gold coating. At the same time, elemental composition was evaluated using EDX.
Scaffold Binding Assay.
5-FAM labeled STs, ASTs, GSTs and MNAs were prepared at 100 μg/mL, respectively. 50 μL nanoparticle was dropped on PLGA or Ap-PLGA scaffold. At given times, the scaffold was imaged with Olympus SZX16 Stereomicroscope (Olympus, Tokyo, Japan). The fluorescence intensity of sterosome was measured by a microplate reader (Ex: 480 nm; Em: 530 nm) for quantitative analysis.
Cell Culture in 3D scaffold.
Firstly, the Ap-PLGA scaffold was incubated with 50 μL GSTs, MNAs and pDNA/PEI complex for 24 h, respectively. Scaffolds were washed with PBS for 3 times to remove unbinding GSTs, MNAs and pDNA/PEI. Then cells (5×10⁴ cells per scaffold) were seeded on the Ap-PLGA scaffold gently. Once the cells were attached to the scaffolds, cell-seeded Ap-PLGA scaffolds were transferred to new wells containing culture medium and cultured in a humidified incubator at 37 °C with 5% CO2.
Cytotoxicity Test.
After incubation in culture medium for 1, 3 and 7 days, cell-seeded scaffolds were washed with PBS 3 times, incubated with culture medium including 10% alarmerBlue. After 3 h incubation, the fluorescent intensity of alarmerBlue was measured by microplate reader with an excitation wavelength of 570 nm and at an emission wavelength of 585 nm. The cell-seeded scaffolds without any treatment were used as blank controls. The culture medium including 10% alarmer blue was used as a background. The relative cell viability was calculated by the equation: cell viability = (Fsample - Fbackground)/(Fcontrol - Fbackground) × 100%.
Live/Dead Staining.
After incubation in culture medium for 1, 3 and 7 days, cell-seeded scaffolds were washed and stained with Calcein AM and EthD-1 for 30 min. Cell-seeded scaffolds were imaged using an Olympus IX71 microscope after washing with PBS. Calcein AM-positive cells were live and EthD-1-positive cells were dead.
ALP Assay in 3D culture.
After incubation in osteogenesis medium for 7days, cell-seeded scaffolds were fixed using 10% formalin solution stained with BCIP/NBT in ALP solution (100 mM Tris, 50 mM MgCl2, 100 mM NaCl, pH 8.5) for 3 h for microscope observation. For ALP activity assay, cell-seeded scaffolds were washed with PBS and lysed through 0.1% Tween-20 buffer after incubation for 3, 7 and 14 days. The supernatant was collected after 5 min centrifugation at 12000 rpm and reacted with phosphatase substrate for 2 h at 37 °. ALP concentration was measured at a wavelength of 405 nm using a microplate reader, which was normalized by DNA content using Quant-iT™ PicoGreen™ dsDNA Assay Kit.
qRT-PCR Analysis in 3D culture.
After given times, total RNA was obtained from cell-seeded scaffolds using Trizol reagent after centrifugation at 12000 rpm for 5 min. The operational processes for cDNA synthesis and amplification reactions were consistent with the steps of qPCR Analysis in 2D culture.
Calvarial Defect Model.
All animal experiments were carried out according to the guidelines of the Chancellor’s Animal Research Committee (ARC) at the University of California, Los Angeles. CD-I nude mice (female, 8 - 12 weeks old) were housed with abundant food and water in a light and temperature-controlled environment. Mice were anesthetized and full-thickness bone defect with 3 mm in diameter was trephined in parietal bone. Each defect was implanted with Ap-scaffold, AST-bound Ap-scaffold, GST-bound Ap-scaffold and MNA-bound Ap-scaffold, respectively. After the surgery, buprenorphine was injected in all animals subcutaneously with a concentration of 0.1 mg/kg for pain management.
μ-CT analysis.
After 6 weeks, calvarial tissues were harvested, fixed in 4% formaldehyde solution for 48 h and scanned with a μ-CT scanner (SkyScan 1172, Kontich, Belgium). Scanning was performed with a resolution of 10 μm, an exposure time of 190 ms, and 475 projections were acquired at the angle of 190°. μ-CT images were acquired with 0.5 mm A1 filtration at 104 kV and 98 mA. The data was carried out with the OsiriX MD imaging software for visualization and reconstruction. The relative of new bone was evaluated using Image J, and BV/TV and Tb.N were analyzed using the SkyScan CT-Analyzer program (Bruker microCT).
Histological Evaluation.
For decalcification, all fixed tissues were treated with 10% EDTA solution for 7 days. After cut at a thickness of 5 μm, sections were stained with H&E and Masson trichrome, respectively. Then sections were observed using an Olympus 1X71 microscope to evaluate new bone formation.
Supplementary Material
Acknowledgements
This work was supported by grants from the National Institutes of Health (R01 DE027332), the Department of Defense (W81XWH-18-1-0337), and the MTF Biologies.
Footnotes
Supporting Information
Supporting Information is available from the Wiley Online Library or from the author.
Contributor Information
Xiao Zhang, Division of Advanced Prosthodontics, University of California at Los Angeles, 10833 Le Conte Avenue, Los Angeles, California 90095, United States.
Jiabing Fan, Division of Advanced Prosthodontics, University of California at Los Angeles, 10833 Le Conte Avenue, Los Angeles, California 90095, United States.
Chung-Sung Lee, Division of Advanced Prosthodontics, University of California at Los Angeles, 10833 Le Conte Avenue, Los Angeles, California 90095, United States.
Soyon Kim, Division of Advanced Prosthodontics, University of California at Los Angeles, 10833 Le Conte Avenue, Los Angeles, California 90095, United States.
Chen Chen, Division of Advanced Prosthodontics, University of California at Los Angeles, 10833 Le Conte Avenue, Los Angeles, California 90095, United States.
Tara Aghaloo, Division of Diagnostic and Surgical Sciences, University of California at Los Angeles, 10833 Le Conte Avenue, Los Angeles, California 90095, United States.
Min Lee, Division of Advanced Prosthodontics, University of California at Los Angeles, 10833 Le Conte Avenue, Los Angeles, California 90095, United States; Department of Bioengineering, University of California at Los Angeles, 420 Westwood Plaza, Los Angeles, California 90095, United States.
References
- [1].Yang J, Andre P, Ye L, Yang Y-Z, Int. J. Oral Sci 2015, 7, 73; [DOI] [PMC free article] [PubMed] [Google Scholar]; Pan A, Chang L, Nguyen A, James A, Front. Physiol 2013, 4, 1; [DOI] [PMC free article] [PubMed] [Google Scholar]; Long F, Nat. Rev. Mol. Cell. Bio 2012, 13, 27; [DOI] [PubMed] [Google Scholar]; Ingham PW, McMahon AP, Gene. Dev 2001, 15, 3059; [DOI] [PubMed] [Google Scholar]; McMahon AP, Chuang P-T, Nat. Med 1996, 2, 1308. [DOI] [PubMed] [Google Scholar]
- [2].Alman BA, Nat. Rev. Rheumatol 2015, 11, 552. [DOI] [PubMed] [Google Scholar]
- [3].Briscoe J, Thérond PP, Nat. Rev. Mol. Cell. Bio 2013, 14, 416. [DOI] [PubMed] [Google Scholar]
- [4].Laurencin CT, Ashe KM, Henry N, Kan HM, Lo KWH, Drug Discov. Today 2014, 19, 794; [DOI] [PMC free article] [PubMed] [Google Scholar]; Stanton BZ, Peng LF, Mol. BioSyst 2010, 6, 44. [DOI] [PubMed] [Google Scholar]
- [5].Riobo NA, Curr. Opin. Pharmacol 2012, 12, 736; [DOI] [PMC free article] [PubMed] [Google Scholar]; Guerrero I, Chiang C, Trends Cell Biol 2007, 17, 1. [DOI] [PubMed] [Google Scholar]
- [6].Schugar RC, Robbins PD, Deasy BM, Gene Ther. 2008, 15, 126. [DOI] [PubMed] [Google Scholar]
- [7].Javitt NB, Steroids 2008, 73, 149; [DOI] [PubMed] [Google Scholar]; Sinha S, Chen JK, Nat. Chem. Biol 2006, 2, 29; [DOI] [PubMed] [Google Scholar]; Wu X, Walker J, Zhang J, Ding S, Schultz PG, Chem. Biol 2004, 11, 1229. [DOI] [PubMed] [Google Scholar]
- [8].Nedelcu D, Liu J, Xu Y, Jao C, Salic A, Nat. Chem. Biol 2013, 9, 557; [DOI] [PMC free article] [PubMed] [Google Scholar]; Corman A, DeBerardinis AM, Hadden MK, ACS Med. Chem. Lett 2012, 3, 828; [DOI] [PMC free article] [PubMed] [Google Scholar]; Dwyer JR, Sever N, Carlson M, Nelson SF, Beachy PA, Parhami F, J. Biol. Chem 2007, 282, 8959; [DOI] [PubMed] [Google Scholar]; Corcoran RB, Scott MP, Proc. Natl. Acad. Sci 2006, 103, 8408. [DOI] [PMC free article] [PubMed] [Google Scholar]
- [9].Mclaughlin S, Podrebarac J, Ruel M, Suuronen EJ, McNeill B, Alarcon EI, Front. Mater 2016, 3, 1; [Google Scholar]; Jin S-S, He D-Q, Luo D, Wang Y, Yu M, Guan B, Fu Y, Li Z-X, Zhang T, Zhou Y-H, Wang C-Y, Liu Y, ACS Nano 2019, 13, 6581; [DOI] [PubMed] [Google Scholar]; Yan S, Ren J, Jian Y, Wang W, Yun W, Yin J, Biomacromolecules 2018, 19, 4554; [DOI] [PubMed] [Google Scholar]; Xu X-L, Li W-S, Wang X-J, Du Y-L, Kang X-Q, Hu J-B, Li S-J, Ying X-Y, You J, Du Y-Z, Nanoscale 2018, 10, 2923; [DOI] [PubMed] [Google Scholar]; Lavrador P, Gaspar VM, Mano JF, Control J. Release 2018, 273, 51; [DOI] [PMC free article] [PubMed] [Google Scholar]; Cui Z-K, Sun JA, Baljon JJ, Fan J, Kim S, Wu BM, Aghaloo T, Lee M, Acta Biomater. 2017, 58, 214; [DOI] [PMC free article] [PubMed] [Google Scholar]; Cheng H, Chawla A, Yang Y, Li Y, Zhang J, Jang HL, Khademhosseini A, Drug Discov. Today 2017, 22, 1336; [DOI] [PMC free article] [PubMed] [Google Scholar]; Crasto GJ, Kartner N, Reznik N, Spatafora MV, Chen H, Williams R, Burns PN, Clokie C, Manolson MF, Peel SAF, Control J. Release 2016, 243, 99; [DOI] [PubMed] [Google Scholar]; Kim Y-H, Tabata Y, Adv. Drug. Deliver. Rev 2015, 94, 28; [DOI] [PubMed] [Google Scholar]; Azevedo HS, Pashkuleva I, Adv. Drug. Deliver. Rev 2015, 94, 63. [DOI] [PubMed] [Google Scholar]
- [10].Arora P, Sindhu A, Dilbaghi N, Chaudhury A, Rajakumar G, Rahuman AA, J. Cell. Mol. Med 2012, 16, 1991. [DOI] [PMC free article] [PubMed] [Google Scholar]
- [11].Panyam J, Labhasetwar V, Adv. Drug. Deliver. Rev 2012, 64, 61. [DOI] [PubMed] [Google Scholar]
- [12].Cui Z-K, Kim S, Baljon JJ, Doroudgar M, Lafleur M, Wu BM, Aghaloo T, Lee M, ACS Nano 2017, 11, 8055. [DOI] [PMC free article] [PubMed] [Google Scholar]
- [13].van Meer G, Voelker DR, Feigenson GW, Nat. Rev. Mol. Cell. Bio 2008, 9, 112; [DOI] [PMC free article] [PubMed] [Google Scholar]; Janmey PA, Kinnunen PKJ, Trends Cell Biol. 2006, 16, 538. [DOI] [PubMed] [Google Scholar]
- [14].Huang P, Nedelcu D, Watanabe M, Jao C, Kim Y, Liu J, Salic A, Cell 2016, 166, 1176; [DOI] [PMC free article] [PubMed] [Google Scholar]; Taylor FR, Wen D, Garber EA, Carmillo AN, Baker DP, Arduini RM, Williams KP, Weinreb PH, Rayhorn P, Hronowski X, Whitty A, Day ES, Boriack-Sjodin A, Shapiro RI, Galdes A, Pepinsky RB, Biochemistry-Us 2001, 40, 4359; [DOI] [PubMed] [Google Scholar]; Chamoun Z, Mann RK, Nellen D, von Kessler DP, Bellotto M, Beachy PA, Basler K, Science 2001, 293, 2080; [DOI] [PubMed] [Google Scholar]; Pepinsky RB, Zeng C, Wen D, Rayhorn P, Baker DP, Williams KP, Bixler SA, Ambrose CM, Garber EA, Miatkowski K, Taylor FR, Wang EA, Galdes A, J. Biol. Chem 1998, 273, 14037. [DOI] [PubMed] [Google Scholar]
- [15].Palmer LC, Newcomb CJ, Kaltz SR, Spoerke ED, Stupp SI, Chem. Rev 2008, 108, 4754; [DOI] [PMC free article] [PubMed] [Google Scholar]; Boanini E, Gazzano M, Rubini K, Bigi A, Adv. Mater 2007, 19, 2499; [Google Scholar]; Kay MI, Young RA, Posner AS, Nature 1964, 204, 1050. [DOI] [PubMed] [Google Scholar]
- [16].Stanzl EG, Trantow BM, Vargas JR, Wender PA, Accounts Chem. Res 2013, 46, 2944; [DOI] [PMC free article] [PubMed] [Google Scholar]; Wender PA, Galliher WC, Goun EA, Jones LR, Pillow TH, Adv. Drug. Deliver. Rev 2008, 60, 452; [DOI] [PMC free article] [PubMed] [Google Scholar]; Pantos A, Tsogas I, Paleos CM, Biochim. Biophys. Acta. Biomembr 2008, 1778, 811. [DOI] [PubMed] [Google Scholar]
- [17].Chen Q, Zheng C, Li Y, Bian S, Pan H, Zhao X, Lu WW, ACS Appl. Mater. Inter 2018, 10, 23700. [DOI] [PubMed] [Google Scholar]
- [18].Miller K, Erez R, Segal E, Shabat D, Satchi-Fainaro R, Angew. Chem. Int. Edit 2009, 48, 2949. [DOI] [PubMed] [Google Scholar]
- [19].Li Y, Yang J, Xu B, Gao F, Wang W, Liu W, ACS Appl. Mater. Inter 2015, 7, 8114; [DOI] [PubMed] [Google Scholar]; Choi J.-y., Ryu K, Lee GJ, Kim K, Kim T.-i., Biomacromolecules 2015, 16, 2715; [DOI] [PubMed] [Google Scholar]; Yang J, Liu Y, Wang H, Liu L, Wang W, Wang C, Wang Q, Liu W, Biomaterials 2012, 33, 604. [DOI] [PubMed] [Google Scholar]
- [20].Zhang X, Xu X, Li Y, Hu C, Zhang Z, Gu Z, Adv. Mater 2018, 30, 1707240. [DOI] [PubMed] [Google Scholar]
- [21].He C, Hu Y, Yin L, Tang C, Yin C, Biomaterials 2010, 31, 3657; [DOI] [PubMed] [Google Scholar]; Rejman J, Oberle, Zuhorn I, Hoekstra D, Biochem. J 2004, 377, 159. [DOI] [PMC free article] [PubMed] [Google Scholar]
- [22].Xu X, Jian Y, Li Y, Zhang X, Tu Z, Gu Z, ACS Nano 2014, 8, 9255. [DOI] [PubMed] [Google Scholar]
- [23].Jiang L-B, Su D-H, Ding S-L, Zhang Q-C, Li Z-F, Chen F-C, Ding W, Zhang S-T, Dong J, Adv. Funct. Mater 2019, 29, 1901314; [Google Scholar]; Cui Z-K, Kim S, Baljon JJ, Wu BM, Aghaloo T, Lee M, Nat. Commun 2019, 10, 3523; [DOI] [PMC free article] [PubMed] [Google Scholar]; Diba M, Camargo WA, Brindisi M, Farbod K, Klymov A, Schmidt S, Harrington MJ, Draghi L, Boccaccini AR, Jansen JA, van den Beucken JJJP, Leeuwenburgh SCG, Adv. Funct. Mater 2017, 27, 1703438. [Google Scholar]
- [24].Ko DY, Patel M, Lee HJ, Jeong B, Adv. Funct. Mater 2018, 28, 1706286; [Google Scholar]; Müller WEG, Wang S, Ackermann M, Gerich T, Neufurth M, Wiens M, Schröder HC, Wang X, Adv. Funct. Mater, 0, 1905220. [Google Scholar]
- [25].Luo Z, Pan J, Sun Y, Zhang S, Yang Y, Liu H, Li Y, Xu X, Sui Y, Wei S, Adv. Funct. Mater 2018, 28, 1804335; [Google Scholar]; Ma H, Jiang C, Zhai D, Luo Y, Chen Y, Lv F, Yi Z, Deng Y, Wang J, Chang J, Wu C, Adv. Funct. Mater 2016, 26, 1197. [Google Scholar]
- [26].Zhang X, Li Y, Chen YE, Chen J, Ma PX, Nat. Commun. 2016, 7, 1. [DOI] [PMC free article] [PubMed] [Google Scholar]
Associated Data
This section collects any data citations, data availability statements, or supplementary materials included in this article.


