

Abstract
Background:
Coffee consumption has been associated with reduced risk for death in prospective cohort studies; however, data in nonwhites are sparse.
Objective:
To examine the association of coffee consumption with risk for total and cause-specific death.
Design:
The MEC (Multiethnic Cohort), a prospective population-based cohort study established between 1993 and 1996.
Setting:
Hawaii and Los Angeles, California.
Participants:
185 855 African Americans, Native Hawaiians, Japanese Americans, Latinos, and whites aged 45 to 75 years at recruitment.
Measurements:
Outcomes were total and cause-specific mortality between 1993 and 2012. Coffee intake was assessed at baseline by means of a validated food-frequency questionnaire.
Results:
58 397 participants died during 3 195 484 person-years of follow-up (average follow-up, 16.2 years). Compared with drinking no coffee, coffee consumption was associated with lower total mortality after adjustment for smoking and other potential confounders (1 cup per day: hazard ratio [HR], 0.88 [95% CI, 0.85 to 0.91]; 2 to 3 cups per day: HR, 0.82 [CI, 0.79 to 0.86]; ≥4 cups per day: HR, 0.82 [CI, 0.78 to 0.87]; P for trend < 0.001). Trends were similar between caffeinated and decaffeinated coffee. Significant inverse associations were observed in 4 ethnic groups; the association in Native Hawaiians did not reach statistical significance. Inverse associations were also seen in never-smokers, younger participants (<55 years), and those who had not previously reported a chronic disease. Among examined end points, inverse associations were observed for deaths due to heart disease, cancer, respiratory disease, stroke, diabetes, and kidney disease.
Limitation:
Unmeasured confounding and measurement error, although sensitivity analysis suggested that neither was likely to affect results.
Conclusion:
Higher consumption of coffee was associated with lower risk for death in African Americans, Japanese Americans, Latinos, and whites.
Primary Funding Source:
National Cancer Institute.
Coffee is one of the most widely consumed beverages in the world and in the U.S. population (1). Therefore, even a small health-promoting effect of coffee could have a substantial impact on public health. Previous studies have indicated that coffee consumption is inversely associated with several types of cancer (2), diabetes (3, 4), liver disease (5), Parkinson disease (6, 7), and other chronic diseases (8). Cohort studies have shown that coffee consumption is associated with lower risk for total and cause-specific death (8 –10). However, these studies included mainly white participants, and their results may not be generalizable to other populations with different lifestyles, confounding factors, and disease susceptibilities. Data in U.S. minority populations are scarce, and research is needed in nonwhite populations (10).
This study examined the association between coffee drinking and risk for total and cause-specific death among more than 185 000 African Americans, Japanese Americans, Native Hawaiians, Latinos, and whites in the MEC (Multiethnic Cohort) study.
Methods
Study Population
The MEC is a prospective cohort of more than 215 000 adults aged 45 to 75 years who were enrolled between 1993 and 1996. The MEC study design and baseline characteristics have been described in detail previously (11). Potential participants were identified by means of Department of Motor Vehicles driver’s license records, voter registration lists, and Health Care Financing Administration data files. The response rates were highest in Japanese Americans (51%), whites (47%), and Native Hawaiians (42%) and lowest in African Americans (26%) and Latinos (21%). A baseline questionnaire assessed diet; lifestyle; anthropometrics; family and personal medical history; and, for women, menstrual and reproductive history and hormone use. For this analysis, we excluded participants who were not in the 5 main ethnic groups (n = 13 986), had implausible dietary energy and macronutrient intakes (n = 8258), or were missing smoking information (n = 7521). The resulting cohort included 185 855 participants for the final analysis. The Institutional Review Boards of the University of Southern California and the University of Hawai’i approved this study.
Assessment of Coffee Consumption and Covariates
Dietary information, including coffee consumption, was obtained using a quantitative food-frequency questionnaire (QFFQ) designed for use in this multiethnic population (11). A calibration study of the QFFQ was conducted using three 24-hour recalls from a random subsample of participants selected within groups based on sex and race/ethnicity (12); this study revealed a high correlation between the QFFQ and 24-hour recalls for energy-adjusted nutrients. The median correlation coefficient for coffee intake was 0.72, as assessed by the QFFQ and 24-hour recalls (13). On the baseline QFFQ, participants were asked to indicate their average consumption of caffeinated and decaffeinated coffee in the previous year using 9 predefined categories from “never or hardly ever” to “4 or more cups daily.” Data on potential confounders, such as education level, body size, diabetes, smoking history, and alcohol intake, were obtained from the baseline questionnaire. Body mass index (BMI) was calculated by dividing weight (in kilograms) by the square of height (in meters).
Assessment of Death
We ascertained deaths by means of annual linkage to files of state death certificates in California and Hawaii and periodic linkage to the National Death Index. Death ascertainment ended on 31 December 2012. The primary outcome was total mortality. Secondary outcomes were mortality from the 10 leading causes of death in the United States that accounted for 74% of deaths in 2014 (14). We used codes from the International Classification of Diseases, Ninth Revision (ICD-9) and 10th Revision (ICD-10), to classify the primary cause of death specified on each certificate. Causes were defined as follows: heart disease (ICD-9 codes 390 to 398, 402, 404, and 410 to 429; ICD-10 codes I00 to I09, I11, I13, and I20 to I51), cancer (ICD-9 codes 140 to 239; ICD-10 codes C00 to C97 and D00 to D48), chronic lower respiratory disease (ICD-9 codes 490 to 494 and 496; ICD-10 codes J40 to J47), stroke (ICD-9 codes 430 to 434 and 436 to 438; ICD-10 codes I60 to I69), accident (ICD-9 codes E800 to E869 and E880 to E929; ICD-10 codes V01 to X59 and Y85 to Y86), Alzheimer disease (ICD-9 code 331.0; ICD-10 code G30), diabetes mellitus (ICD-9 code 250; ICD-10 codes E10 to E14), influenza and pneumonia (ICD-9 codes 480 to 487; ICD-10 codes J10 to J18), kidney disease (ICD-9 codes 580 to 589; ICD-10 codes N00 to N07, N17 to N19, and N25 to N27), and intentional self-harm (ICD-9 codes E950 to E959; ICD-10 codes X60 to X84 and Y87.0).
Statistical Analysis
We categorized coffee consumption as never, 1 to 3 cups per month, 1 to 6 cups per week, 1 cup per day, 2 to 3 cups per day, and 4 or more cups per day. Similar categories were used for caffeinated and decaffeinated coffee, with those who never drink coffee as the reference group. In the analysis of coffee type, we examined consumption of exclusively caffeinated and exclusively decaffeinated coffee. We used multiple imputation, based on 5 replications and the Markov-chain Monte Carlo method in the SAS MI procedure, to account for missing data on education, BMI, and physical activity. This resulted in the exclusion of 30 participants for whom imputation was not possible. We also performed sensitivity analyses using a complete-case analysis (n = 174 579).
Follow-up time for each participant was calculated from the date of cohort entry to the date of death or the end of follow-up (31 December 2012). Hazard ratios (HRs) and 95% CIs were calculated for mortality associated with coffee intake, using Cox proportional hazards models with age as the underlying time metric. Cox models were first adjusted for the strata variables of age at cohort entry (<50, 50 to 54, 55 to 59, 60 to 64, 65 to 69, 70 to 74, or ≥75 years), sex, and race/ethnicity. They were further adjusted for smoking using a detailed model to account for smoking cessation over time, which was common but varied by race/ethnicity (15). Smoking variables included ethnicity, smoking status, average number of cigarettes, squared average number of cigarettes, number of years smoking (time-dependent), number of years since quitting (time-dependent), and interactions between ethnicity and smoking status. The Cox models were then further adjusted for the following covariables in the log-linear component: BMI (<18.5, 18.5 to 22.9, 23.0 to 24.9, 25.0 to 29.9, 30.0 to 34.9, or ≥35.0 kg/m2), education (high school or less, vocational school or some college, or college graduate), vigorous physical activity (for men, <0.1, 0.1 to <0.25, 0.25 to <0.80, or ≥0.80 hour per day; for women, <0.1, 0.1 to <0.25, 0.25 to <0.5, or ≥0.5 hour per day), alcohol (ethanol) consumption (for men, 0, 1 to <5.2, 5.2 to <23, or ≥23 g/d; for women, 0, 1 to <2.5, 2.5 to <10, or ≥10 g/d), total energy intake (<1317, 1317 to 1717, 1718 to 2159, 2160 to 2835, or ≥2836 kcal/d), energy from fat (<23.7%, 23.7% to 28.0%, 28.1% to 31.8%, 31.9% to 35.9%, or ≥36.0%), and preexisting chronic disease at baseline (self-reported heart attack or angina, stroke, diabetes, or high blood pressure, and cancer that was self-reported or ascertained from tumor registries).
We performed tests for linear trend by entering the median value of each category of coffee consumption as a continuous variable in the models. A competing risk analysis was done to compare the association with coffee intake among causes of death, where each cause was simultaneously modeled as a different event (16). We used a Wald test to compare the parameter estimates between causes of death. The proportional hazards assumption over all ages was tested by modeling the interaction of age with coffee consumption, and no violation was found. Direct adjusted mortality curves by category of coffee consumption were computed over the age range from the Cox model as the average of the model-based curves at observed profiles for the following covariates (17, 18): age at cohort entry; sex; ethnicity; smoking status; average number of cigarettes; squared average number of cigarettes; number of years smoking; number of years since quitting; interactions between ethnicity and smoking status, average number of cigarettes, squared average number of cigarettes, and number of years smoking; BMI; education; physical activity; alcohol consumption; total energy intake; energy from fat; and preexisting illness.
We did subgroup analyses by race/ethnicity, sex, age at cohort entry, and smoking status. Heterogeneity across subgroups was tested using the Wald statistics for cross-product terms of trend variables and subgroup membership. To assess potential reverse causality, we performed sensitivity analysis by excluding deaths that occurred within the first 5 years of follow-up. We also did a formal sensitivity analysis, as described by Lin and colleagues (19), to assess the potential effect of unmeasured confounding on our results. For all analyses, we used SAS, version 9.4 (SAS Institute). All P values were 2-sided.
Role of the Funding Source
The MEC was supported by the National Cancer Institute, which had no role in the study design; recruitment; data collection and analysis; or preparation, approval, or publication of the manuscript.
Results
Baseline Characteristics of Study Participants, by Coffee Consumption
About 16% of participants did not drink coffee, 7% drank 1 to 3 cups per month, 13% drank 1 to 6 cups per week, 31% drank 1 cup per day, 25% drank 2 to 3 cups per day, and 7% drank 4 or more cups per day (Table 1). Participants who drank more coffee were more likely to be younger, male, and white and to drink more alcohol. There was a strong correlation between higher coffee consumption and smoking status; among non– coffee drinkers, 58% were never-smokers, but among those who drank 4 or more cups per day, 26% were never-smokers. The proportion of preexisting illness at baseline was lower among participants who drank coffee more frequently.
Table 1.
Baseline Characteristics of Participants in the Multiethnic Cohort, by Coffee Consumption*
| Variable | Coffee Consumption |
|||||
|---|---|---|---|---|---|---|
| None | 1–3 cups/mo | 1–6 cups/wk | 1 cup/d | 2–3 cups/d | ≥4 cups/d | |
| Participants, n | 30 082 | 13 370 | 24 637 | 57 488 | 47 282 | 12 996 |
| Mean age (SD), y | 59.1 (9.3) | 59.8 (9.0) | 59.9 (8.9) | 61.5 (8.7) | 59.2 (8.6) | 57.8 (8.2) |
| Female, % | 59.2 | 59.1 | 52.8 | 56.2 | 52.9 | 46.4 |
| Race/ethnicity, % | ||||||
| African American | 25.8 | 23.8 | 21.2 | 16.3 | 10.5 | 7.8 |
| Native Hawaiian | 9.9 | 8.6 | 8.0 | 6.7 | 5.8 | 6.2 |
| Japanese American | 25.4 | 28.4 | 27.5 | 32.4 | 28.8 | 24.9 |
| Latino | 14.3 | 18.7 | 24.2 | 21.9 | 25.4 | 26.4 |
| White | 24.7 | 20.6 | 19.1 | 22.8 | 29.5 | 34.8 |
| Mean BMI (SD), kg/m2 | 26.7 (5.3) | 26.7 (5.3) | 26.9 (5.1) | 26.3 (4.8) | 26.4 (4.6) | 26.4 (4.6) |
| Smoking status at baseline, % | ||||||
| Never | 58.0 | 54.3 | 48.8 | 44.6 | 38.1 | 25.6 |
| Former | 32.3 | 35.4 | 38.3 | 40.7 | 42.0 | 39.1 |
| Current | 9.7 | 10.3 | 12.9 | 14.7 | 19.9 | 35.3 |
| Mean alcohol intake (SD), g/d | 6.5 (24.6) | 6.7 (23.1) | 7.4 (21.2) | 10.1 (25.6) | 10.2 (25.3) | 10.8 (29.4) |
| Education, % | ||||||
| High school or less | 40.3 | 42.2 | 46.1 | 47.0 | 41.6 | 41.8 |
| Vocational school/some college | 30.0 | 29.7 | 28.8 | 29.5 | 30.1 | 29.3 |
| College graduate | 29.8 | 28.2 | 25.2 | 23.5 | 28.2 | 28.9 |
| Preexisting illness, %† | 52.1 | 54.7 | 54.3 | 54.1 | 47.2 | 42.9 |
| Mean vigorous physical activity (SD), h/d | 0.39 (0.83) | 0.35 (0.74) | 0.39 (0.79) | 0.37 (0.80) | 0.40 (0.81) | 0.45 (0.88) |
| Mean energy intake (SD), kcal/d | 2062 (1027) | 2010 (991) | 2047 (1027) | 2090 (984) | 2236 (1050) | 2467 (1184) |
| Mean energy from fat (SD), % | 29.1 (7.7) | 29.2 (7.4) | 30.3 (7.0) | 29.6 (7.0) | 30.3 (6.8) | 31.7 (7.0) |
BMI = body mass index.
P values for differences across coffee consumption for the variables in the table were <0.001 based on the chi-square test for categorical measures and analysis of variance for continuous measures.
Self-reported heart attack or angina, stroke, diabetes, high blood pressure, and cancer identified from questionnaire and SEER (Surveillance, Epidemiology, and End Results) registries.
Association of Coffee Consumption With Total Mortality
During an average of 16.2 years of follow-up (3 195 484 person-years), we identified 58 397 deaths in the cohort. In the age-, sex-, and ethnicity-adjusted analysis, consuming 4 or more cups of total (caffeinated and decaffeinated) coffee per day was associated with a higher risk for all-cause death (Table 2). However, after adjustment for smoking and other covariates, we saw significant inverse associations between increasing coffee consumption and all-cause mortality. The HR for death (vs. no coffee) was 1.00 (95% CI, 0.95 to 1.05) for 1 to 3 cups of coffee per month, 0.97 (CI, 0.93 to 1.01) for 1 to 6 cups per week, 0.88 (CI, 0.85 to 0.91) for 1 cup per day, 0.82 (CI, 0.79 to 0.86) for 2 to 3 cups per day, and 0.82 (CI, 0.78 to 0.87) for 4 or more cups per day. Exclusive consumption of either caffeinated coffee (P for trend < 0.001) or decaffeinated coffee (P for trend = 0.008) was inversely associated with total mortality. Associations were similar in men and women (Appendix Table 1, available at Annals.org).
Table 2.
Coffee Consumption and Total Mortality in the Multiethnic Cohort, 1993–2012
| Coffee Consumption | Participants, n | Deaths, n | Adjusted Hazard Ratio (95% CI) |
||
|---|---|---|---|---|---|
| Model 1* | Model 2† | Model 3‡ | |||
| Total | |||||
| None | 30 082 | 9460 | 1.00 (reference) | 1.00 (reference) | 1.00 (reference) |
| 1–3 cups/mo | 13 370 | 4277 | 1.00 (0.96–1.04) | 0.98 (0.95–1.02) | 1.00 (0.95–1.05) |
| 1–6 cups/wk | 24 637 | 7894 | 0.99 (0.96–1.02) | 0.94 (0.91–0.97) | 0.97 (0.93–1.01) |
| 1 cup/d | 57 488 | 19 623 | 0.97 (0.95–1.00) | 0.88 (0.85–0.90) | 0.88 (0.85–0.91) |
| 2–3 cups/d | 47 282 | 13 395 | 0.95 (0.93–0.98) | 0.80 (0.78–0.83) | 0.82 (0.79–0.86) |
| ≥4 cups/d | 12 996 | 3748 | 1.11 (1.07–1.16) | 0.80 (0.77–0.84) | 0.82 (0.78–0.87) |
| P for trend | – | – | 0.098 | <0.001 | <0.001 |
| Increase per cup | – | – | 1.00 (1.00–1.01) | 0.94 (0.94–0.95) | 0.95 (0.94–0.96) |
| Caffeinated§ | |||||
| None | 30 082 | 9460 | 1.00 (reference) | 1.00 (reference) | 1.00 (reference) |
| 1–3 cups/mo | 6721 | 2138 | 1.06 (1.01–1.11) | 1.02 (0.97–1.07) | 1.05 (0.98–1.13) |
| 1–6 cups/wk | 11 722 | 3815 | 1.07 (1.03–1.11) | 0.97 (0.94–1.01) | 1.00 (0.94–1.06) |
| 1 cup/d | 37 155 | 12 659 | 0.99 (0.96–1.01) | 0.87 (0.85–0.89) | 0.86 (0.83–0.90) |
| 2–3 cups/d | 28 245 | 7900 | 0.98 (0.95–1.01) | 0.80 (0.77–0.82) | 0.79 (0.76–0.83) |
| ≥4 cups/d | 7769 | 2193 | 1.15 (1.10–1.21) | 0.78 (0.74–0.82) | 0.79 (0.73–0.85) |
| P for trend | – | – | 0.075 | <0.001 | <0.001 |
| Increase per cup | – | – | 1.01 (1.00–1.02) | 0.93 (0.92–0.94) | 0.93 (0.91–0.94) |
| Decaffeinated|| | |||||
| None | 30 082 | 9460 | 1.00 (reference) | 1.00 (reference) | 1.00 (reference) |
| 1–3 cups/mo | 4796 | 1586 | 0.94 (0.90–1.00) | 0.96 (0.91–1.01) | 0.95 (0.87–1.05) |
| 1–6 cups/wk | 3979 | 1506 | 1.01 (0.96–1.07) | 0.98 (0.93–1.04) | 1.00 (0.91–1.10) |
| 1 cup/d | 8345 | 3502 | 1.04 (1.00–1.08) | 0.97 (0.93–1.01) | 0.98 (0.92–1.05) |
| 2–3 cups/d | 3111 | 1177 | 1.06 (0.99–1.12) | 0.90 (0.85–0.96) | 0.85 (0.75–0.95) |
| ≥4 cups/d | 485 | 202 | 1.31 (1.14–1.50) | 0.94 (0.82–1.08) | 0.84 (0.63–1.13) |
| P for trend | – | – | <0.001 | 0.002 | 0.008 |
| Increase per cup | – | – | 1.04 (1.02–1.06) | 0.97 (0.95–0.99) | 0.96 (0.92–0.99) |
Adjusted for age at cohort entry, sex, and ethnicity.
The following variables were also included to control for the effects of smoking: smoking status; average number of cigarettes; squared average number of cigarettes; number of years smoking (time-dependent); number of years since quitting (time-dependent); and interactions between ethnicity and smoking status, average number of cigarettes, squared average number of cigarettes, and number of years smoking.
Further adjusted for body mass index, education, physical activity, alcohol consumption, total energy intake, energy from fat, and preexisting illness.
Excludes decaffeinated coffee drinkers.
Excludes caffeinated coffee drinkers.
The adjusted mortality rates by different levels of coffee consumption are presented in the Figure. The inverse association applies to consumption of at least 1 to 6 cups of caffeinated coffee per week and seems to be monotonic with increased consumption.
Figure.
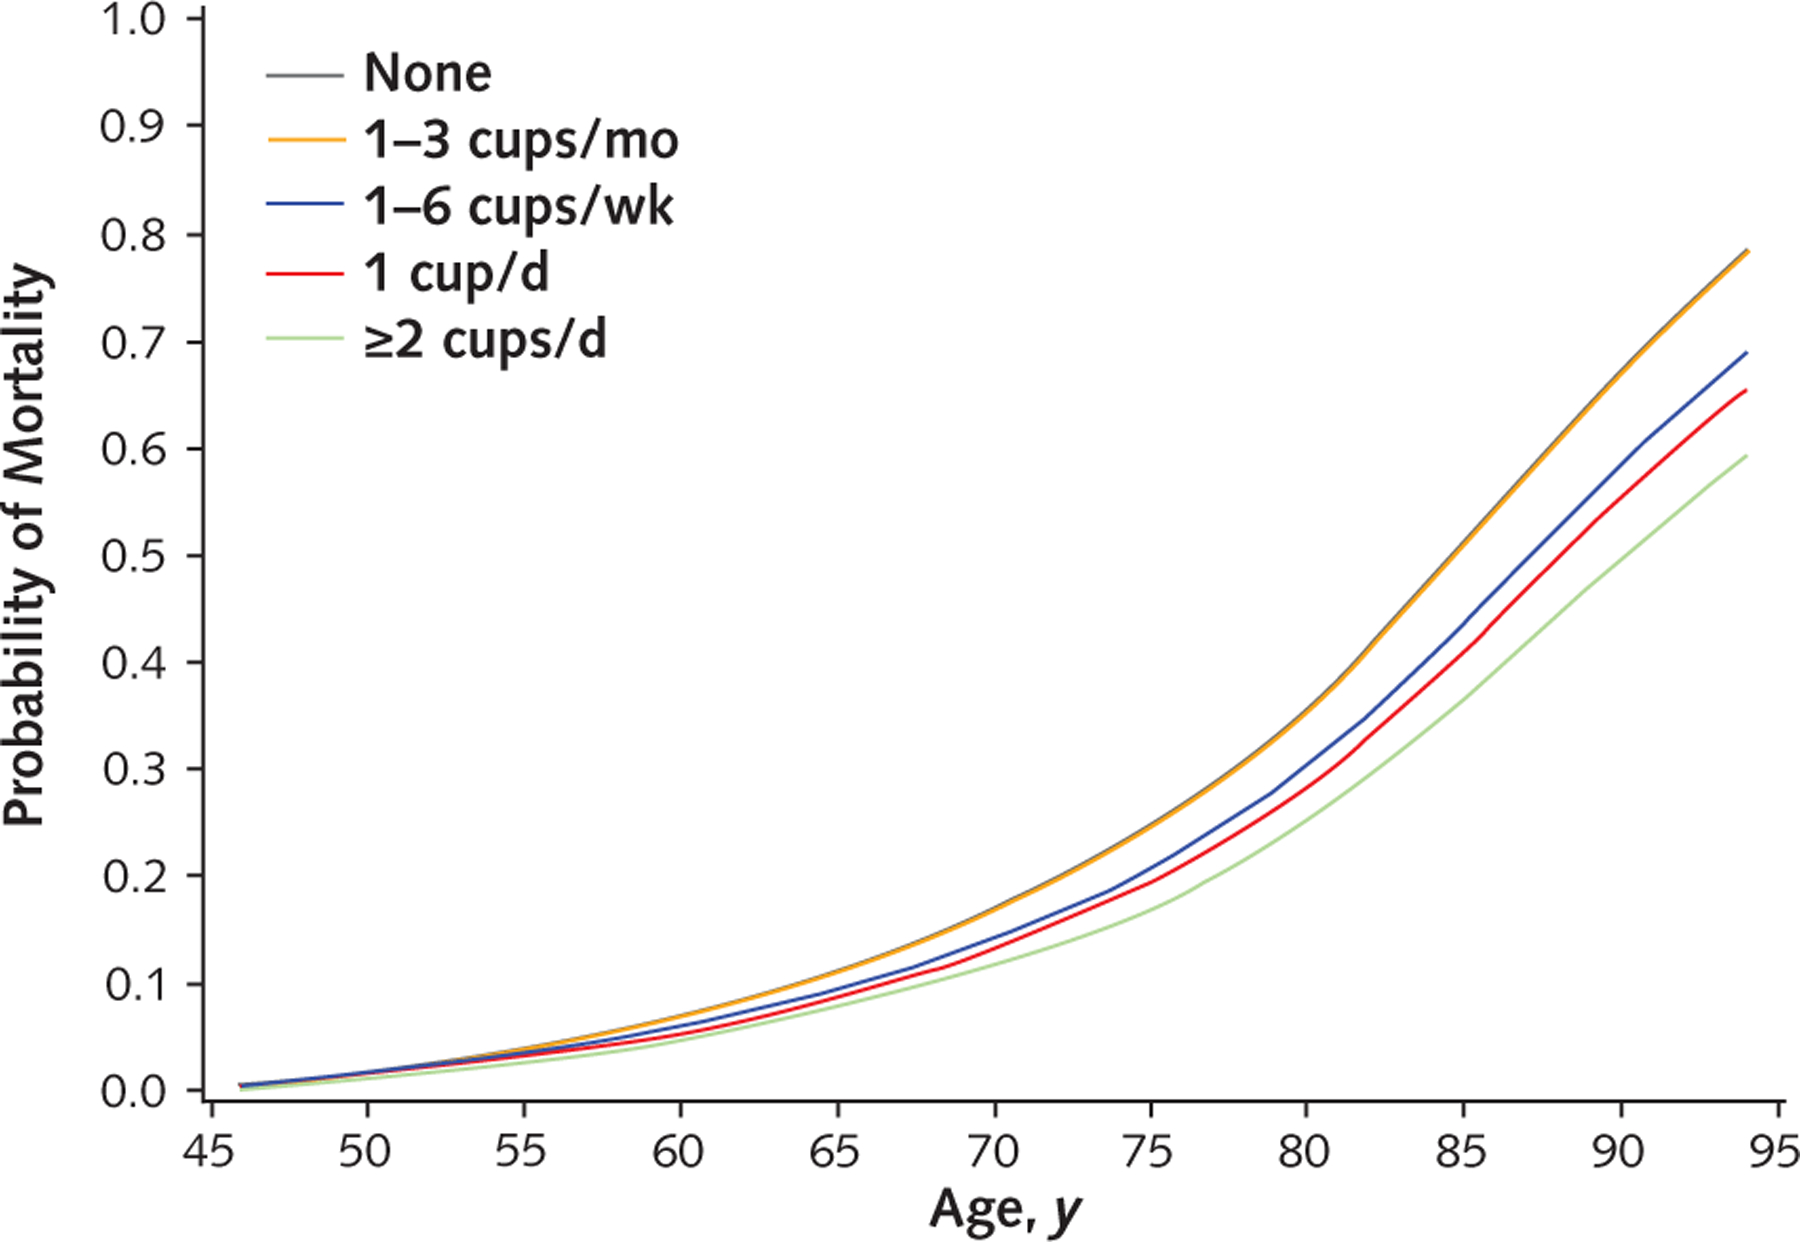
Adjusted mortality in the Multiethnic Cohort, by age by category of coffee consumption, 1993–2012. Direct adjusted curves were generated using the Cox model as the average of the model-based curves at observed profiles for the following covariates: age at cohort entry, sex, ethnicity, smoking variables (smoking status; average number of cigarettes; squared average number of cigarettes; number of years smoking [time-dependent]; number of years since quitting [time-dependent]; and interactions between ethnicity and smoking status, average number of cigarettes, squared average number of cigarettes, and number of years smoking), body mass index, education, physical activity, alcohol consumption, total energy intake, energy from fat, and preexisting illness. For categorical covariates, dummy variables were used. The “None” and “1–3 cups/ mo” lines overlap.
The results of the sensitivity analysis indicated that the associations between coffee consumption and mortality were robust to unmeasured confounders, except in the case of a strong unmeasured confounder, on the order of smoking or diabetes, that was substantially associated with coffee drinking (Appendix Table 2, available at Annals.org).
Association of Coffee Consumption With Total Mortality, by Race/Ethnicity
We examined the association of coffee consumption and total mortality across the 5 racial/ethnic groups in the MEC (Table 3). We found no indication that the associations varied by race/ethnicity (P for heterogeneity = 0.166). Coffee consumption was significantly associated with lower risk for death in African Americans (P for trend = 0.001), Japanese Americans (P for trend < 0.001), Latinos (P for trend = 0.002), and whites (P for trend = 0.003). Although similar patterns were seen for Native Hawaiians, these associations did not reach statistical significance (P for trend = 0.141).
Table 3.
Coffee Consumption and Total Mortality in the Multiethnic Cohort, by Race/Ethnicity, 1993–2012*
| Coffee Consumption | African American (n = 31 514) |
Native Hawaiian (n = 13 496) |
Japanese American (n = 53 646) |
Latino (n = 40 770) |
White (n = 46 429) |
|||||
|---|---|---|---|---|---|---|---|---|---|---|
| Deaths, n | HR (95% CI) | Deaths, n | HR (95% CI) | Deaths, n | HR (95% CI) | Deaths, n | HR (95% CI) | Deaths, n | HR (95% CI) | |
| None | 3320 | 1.00 (reference) | 910 | 1.00 (reference) | 2043 | 1.00 (reference) | 1134 | 1.00 (reference) | 2053 | 1.00 (reference) |
| 1–3 cups/mo | 1419 | 0.95 (0.84–1.07) | 338 | 1.07 (0.75–1.53) | 1052 | 0.94 (0.83–1.05) | 644 | 1.09 (0.92–1.28) | 824 | 1.07 (0.88–1.28) |
| 1–6 cups/wk | 2323 | 0.94 (0.85–1.04) | 643 | 1.22 (0.89–1.66) | 1839 | 0.94 (0.85–1.04) | 1715 | 1.13 (0.99–1.29) | 1374 | 0.93 (0.79–1.08) |
| 1 cup/d | 4351 | 0.86 (0.79–0.93) | 1330 | 0.86 (0.67–1.11) | 5678 | 0.85 (0.79–0.92) | 3783 | 1.07 (0.95–1.20) | 4481 | 0.88 (0.78–0.99) |
| 2–3 cups/d | 2070 | 0.80 (0.72–0.90) | 863 | 0.94 (0.70–1.27) | 3227 | 0.80 (0.73–0.87) | 3208 | 0.99 (0.88–1.12) | 4027 | 0.81 (0.71–0.91) |
| ≥4 cups/d | 413 | 0.97 (0.78–1.20) | 229 | 0.75 (0.48–1.17) | 762 | 0.84 (0.72–0.97) | 987 | 0.88 (0.76–1.03) | 1357 | 0.89 (0.75–1.05) |
| P for trend | – | 0.001 | – | 0.141 | – | <0.001 | – | 0.002 | – | 0.003 |
| Increase per cup | – | 0.95 (0.92–0.98) | – | 0.95 (0.88–1.02) | – | 0.94 (0.92–0.97) | – | 0.97 (0.95–0.99) | – | 0.95 (0.92–0.98) |
| P for heterogeneity | – | 0.166 | – | – | – | – | – | – | – | – |
HR = hazard ratio.
The following variables were included to control for the effects of smoking: smoking status, average number of cigarettes, squared average number of cigarettes, number of years smoking (time-dependent), and number of years since quitting (time-dependent). The models were also adjusted for age at cohort entry, sex, body mass index, education, physical activity, alcohol consumption, total energy intake, energy from fat, and preexisting illness.
Association of Coffee Consumption With Cause-Specific Mortality
The 10 leading causes of death in the United States accounted for 81% of deaths in the MEC, with cardiovascular disease (36%) and cancer (31%) accounting for the largest proportions. We investigated the associations between coffee consumption and each of the 10 leading causes of death (Table 4). Coffee consumption was inversely associated with risk for death due to heart disease (P for trend < 0.001), cancer (P for trend = 0.023), chronic lower respiratory disease (P for trend = 0.015), stroke (P for trend < 0.001), diabetes (P for trend = 0.009), and kidney disease (P for trend < 0.001). There was no significant association between coffee consumption and deaths from influenza and pneumonia, Alzheimer disease, accidents, and intentional self-harm. In a competing risk analysis, the association of mortality with coffee consumption did not statistically differ among causes of death (P = 0.92).
Table 4.
Coffee Consumption and Cause-Specific Mortality in the Multiethnic Cohort, 1993–2012*
| Coffee Consumption | Heart Disease |
Cancer |
Chronic Lower Respiratory Disease |
Stroke |
Accident |
|||||
|---|---|---|---|---|---|---|---|---|---|---|
| Deaths, n | HR (95% CI) | Deaths, n | HR (95% CI) | Deaths, n | HR (95% CI) | Deaths, n | HR (95% CI) | Deaths, n | HR (95% CI) | |
| None | 2654 | 1.00 (reference) | 2732 | 1.00 (reference) | 372 | 1.00 (reference) | 698 | 1.00 (reference) | 69 | 1.00 (reference) |
| 1–3 cups/mo | 1210 | 0.97 (0.88–1.07) | 1239 | 1.03 (0.94–1.14) | 153 | 0.96 (0.72–1.30) | 299 | 0.94 (0.78–1.14) | 32 | 1.18 (0.63–2.22) |
| 1–6 cups/wk | 2257 | 0.97 (0.89–1.05) | 2335 | 0.99 (0.91–1.07) | 294 | 0.77 (0.60–0.99) | 569 | 0.96 (0.82–1.12) | 53 | 1.03 (0.61–1.75) |
| 1 cup/d | 5301 | 0.84 (0.79–0.90) | 6088 | 0.97 (0.91–1.03) | 791 | 0.73 (0.59–0.89) | 1409 | 0.88 (0.77–1.00) | 98 | 0.68 (0.43–1.08) |
| 2–3 cups/d | 3457 | 0.79 (0.73–0.85) | 4567 | 0.92 (0.86–0.98) | 635 | 0.68 (0.55–0.84) | 808 | 0.73 (0.63–0.84) | 95 | 0.81 (0.50–1.32) |
| ≥4 cups/d | 964 | 0.75 (0.68–0.84) | 1390 | 0.97 (0.87–1.06) | 238 | 0.79 (0.59–1.06) | 200 | 0.72 (0.57–0.91) | 19 | 0.73 (0.33–1.61) |
| P for trend | – | <0.001 | – | 0.023 | – | 0.015 | – | <0.001 | – | 0.24 |
| Increase per cup | – | 0.94 (0.92–0.95) | – | 0.98 (0.97–1.00) | – | 0.95 (0.90–1.00) | – | 0.91 (0.88–0.95) | – | 0.91 (0.80–1.04) |
|
Alzheimer Disease |
Diabetes Mellitus |
Influenza and Pneumonia |
Kidney Disease |
Intentional Self-Harm |
||||||
| None | 248 | 1.00 (reference) | 386 | 1.00 (reference) | 261 | 1.00 (reference) | 186 | 1.00 (reference) | 30 | 1.00 (reference) |
| 1–3 cups/mo | 117 | 1.01 (0.72–1.41) | 183 | 1.05 (0.83–1.34) | 106 | 0.95 (0.70–1.29) | 80 | 0.75 (0.52–1.08) | 15 | 1.06 (0.41–2.76) |
| 1–6 cups/wk | 173 | 0.92 (0.69–1.24) | 322 | 1.00 (0.82–1.22) | 231 | 1.12 (0.86–1.45) | 160 | 0.83 (0.61–1.12) | 24 | 0.73 (0.29–1.88) |
| 1 cup/d | 467 | 0.90 (0.71–1.14) | 704 | 0.85 (0.72–1.00) | 620 | 1.03 (0.84–1.28) | 289 | 0.60 (0.46–0.78) | 64 | 0.91 (0.45–1.86) |
| 2–3 cups/d | 332 | 1.16 (0.90–1.49) | 473 | 0.77 (0.64–0.93) | 361 | 0.90 (0.71–1.14) | 214 | 0.59 (0.45–0.79) | 59 | 1.17 (0.57–2.42) |
| ≥4 cups/d | 67 | 1.33 (0.86–2.04) | 135 | 0.86 (0.65–1.14) | 94 | 1.02 (0.72–1.45) | 46 | 0.42 (0.26–0.67) | 10 | 0.53 (0.16–1.82) |
| P for trend | – | 0.066 | – | 0.009 | – | 0.38 | – | <0.001 | – | 0.86 |
| Increase per cup | – | 1.07 (1.00–1.15) | – | 0.94 (0.90–0.99) | – | 0.98 (0.93–1.04) | – | 0.84 (0.77–0.91) | – | 0.97 (0.80–1.17) |
HR = hazard ratio.
The following variables were included to control for the effects of smoking: smoking status; average number of cigarettes; squared average number of cigarettes; number of years smoking (time-dependent); number of years since quitting (time-dependent); and interactions between ethnicity and smoking status, average number of cigarettes, squared average number of cigarettes, and number of years smoking. The models were also adjusted for age at cohort entry, sex, ethnicity, body mass index, education, physical activity, alcohol consumption, total energy intake, energy from fat, and preexisting illness.
Subgroup Analyses
Smoking is a known strong confounder of the coffee–mortality association. We therefore examined the associations between coffee consumption and mortality stratified by smoking status (Table 5). In never-smokers, former smokers, and current smokers, coffee consumption was inversely associated with total mortality (P for heterogeneity = 0.120).
Table 5.
Coffee Consumption and Total Mortality in the Multiethnic Cohort, by Smoking Status at Baseline, 1993–2012
| Coffee Consumption | Never-Smokers (n = 83 720) |
Former Smokers (n = 72 223) |
Current Smokers (n = 29 912) |
|||
|---|---|---|---|---|---|---|
| Deaths, n | HR (95% CI)* | Deaths, n | HR (95% CI)† | Deaths, n | HR (95% CI)† | |
| None | 4484 | 1.00 (reference) | 3656 | 1.00 (reference) | 1320 | 1.00 (reference) |
| 1–3 cups/mo | 1920 | 0.95 (0.85–1.05) | 1739 | 0.94 (0.85–1.03) | 618 | 1.16 (0.92–1.48) |
| 1–6 cups/wk | 3090 | 0.95 (0.86–1.04) | 3445 | 0.96 (0.89–1.04) | 1359 | 0.98 (0.81–1.17) |
| 1 cup/d | 6795 | 0.88 (0.81–0.95) | 8980 | 0.86 (0.81–0.92) | 3848 | 0.91 (0.78–1.06) |
| 2–3 cups/d | 3794 | 0.84 (0.77–0.92) | 5974 | 0.79 (0.74–0.85) | 3627 | 0.78 (0.67–0.91) |
| ≥4 cups/d | 657 | 0.87 (0.73–1.04) | 1409 | 0.71 (0.64–0.79) | 1682 | 0.79 (0.66–0.94) |
| P for trend | – | <0.001 | – | <0.001 | – | <0.001 |
| Increase per cup | – | 0.95 (0.93–0.98) | – | 0.93 (0.91–0.95) | – | 0.94 (0.91–0.97) |
| P for heterogeneity | – | 0.120 | – | – | – | – |
HR = hazard ratio.
Adjusted for age at cohort entry, sex, ethnicity, body mass index, education, physical activity, alcohol consumption, total energy intake, energy from fat, and preexisting illness.
The following variables were also included to control for the effects of smoking: average number of cigarettes; squared average number of cigarettes; number of years smoking (time-dependent); number of years since quitting (time-dependent); and interactions between ethnicity and average number of cigarettes, squared average number of cigarettes, and number of years smoking.
We conducted a stratified analysis by baseline health status (Appendix Table 3, available at Annals.org). We found significant inverse associations of coffee consumption with total mortality among participants with self-reported heart disease and cancer at baseline. Among participants without self-reported heart disease and cancer at baseline who were never-smokers, we saw similar inverse associations between coffee consumption and total mortality. We conducted stratified analysis by age at cohort entry (<55, 55 to 70, and >70 years) and education level (high school or less, vocational school or some college, and college graduate) (Appendix Table 4, available at Annals.org). Inverse associations were found in all subgroups (P for trend ≤ 0.014 for each), with a stronger association in younger participants (P for heterogeneity = 0.019). In sensitivity analyses excluding deaths within the first 5 years of follow-up, the inverse associations between total coffee consumption and total mortality remained statistically significant.
Discussion
In this large multiethnic population, we found an inverse association between coffee consumption and total mortality after adjustment for smoking and other potential confounders. Similar trends were observed for caffeinated and decaffeinated coffee. Among the 10 leading causes of death in the United States, mortality was inversely related to coffee consumption for heart disease, cancer, respiratory disease, stroke, diabetes, and kidney disease. Inverse associations were seen in never-smokers, former smokers, and current smokers; 4 of 5 racial/ethnic groups; those with and without preexisting heart disease and cancer; those with different education levels; and all age groups.
Overall, our finding of decreased risk for all-cause death with coffee consumption is consistent with meta-analyses (8, 20 –22) and subsequent cohort studies done in the United States (9, 10), Europe (23, 24), and Japan (25). Risk reduction for all-cause death in our study was 18% (CI, 14% to 21%) for 2 to 3 cups versus 0 cups of coffee per day, which was similar to previous reports from other large U.S. cohorts. The Prostate, Lung, Colorectal and Ovarian Cancer Screening Trial (10) saw a risk reduction of 18% (CI, 12% to 23%), and the National Institutes of Health–AARP Diet and Health Study (26) found risk reductions of 10% (CI, 7% to 14%) in men and 13% (CI, 8% to 17%) in women. In a pooled analysis of the Nurses’ Health Study, Nurses’ Health Study II, and Health Professionals Follow-up Study, drinking more than 1 to 3 cups of coffee per day was associated with 9% (CI, 5% to 12%) lower risk for all-cause death than drinking no coffee (9).
However, until now, few data have been available on the association between coffee consumption and mortality in nonwhites in the United States and elsewhere. Such investigations are important because lifestyle patterns and disease risks can vary substantially across racial/ethnic backgrounds, and findings in one group may not necessarily apply to others. On the other hand, findings that persist across different racial/ ethnic groups have greater biological plausibility. Because of the unique opportunity that the MEC provides, we were able to investigate the coffee–mortality associations in participants from 5 racial/ethnic backgrounds using the same method and as part of the same cohort. We saw similar inverse associations between coffee drinking and mortality in 4 of the 5 racial/ethnic groups; the association in Native Hawaiians did not reach statistical significance, likely owing to fewer participants in that group.
Our findings for specific causes of death were generally similar to those of previous cohorts (9, 10, 26). One difference was for cancer mortality. Several recent cohort studies (9, 10, 23, 25) and 2 meta-analyses (20, 21) of prospective studies reported no significant association between total cancer mortality and coffee consumption, although other studies have reported inverse associations (24). We saw a modest reduction in risk for cancer death (8% lower risk with 2 to 3 cups vs. 0 cups per day). One advantage of our study was our ability to comprehensively adjust for cigarette smoking, a strong cancer risk factor, which may have allowed us to observe an inverse association with cancer mortality. We note that our findings persisted across several strategies for controlling for smoking, including analyses by smoking subgroup and models that adjusted for smoking information collected only at baseline (smoking status, years smoking, and number of cigarettes).
We also examined whether associations varied by age at enrollment. Two previous studies have reported inconsistent associations between coffee drinking and mortality in younger people. One cohort reported increased risk for all-cause death among persons younger than 55 years who drank more than 4 cups per day (27), whereas a second study found no association among women younger than 50 years (23). We found inverse associations across categories of age at enrollment in our cohort, although the association seemed stronger in younger participants than in older ones. Hazard ratios among younger participants (<55 years) in the cohort were 0.85 (CI, 0.77 to 0.95) for 1 cup, 0.73 (CI, 0.66 to 0.82) for 2 to 3 cups, and 0.74 (CI, 0.64 to 0.85) for 4 or more cups per day. Therefore, our findings do not suggest a harmful effect of coffee consumption among younger adults.
Coffee contains many biologically active chemicals, including caffeine and phenolic compounds, that may impact health by means of various mechanisms, such as antioxidant and antimutagenic capacity, insulin sensitivity, liver function, and chronic inflammation (28–31). We observed similar associations for both caffeinated and decaffeinated coffee, as seen in most other studies, suggesting that these associations may be related not to caffeine but to the many other compounds found in coffee. However, future mechanistic work is needed to characterize the many compounds in coffee and elucidate possible physiologic effects.
Our study has several key strengths, including its prospective design, large sample size (>185 000 participants with >58 000 deaths), relatively long follow-up (an average of 16 years), and inclusion of substantial numbers of participants from various racial/ethnic backgrounds. To reduce the effect of reverse causality, we excluded deaths within the first 5 years of follow-up in sensitivity analyses and also restricted the analyses to participants who did not report preexisting disease. We had extensive information on potential confounders (for example, smoking, alcohol use, physical activity, and preexisting illness) because of our comprehensive baseline questionnaire.
Our study also has limitations. As with any observational study, we cannot exclude the possibility of residual or unmeasured confounding. However, we are reassured by similar findings within different racial/ethnic populations in our cohort and in previous studies in the United States, Europe, and Japan. Also, a formal sensitivity analysis showed that the coffee–mortality association was robust to all but very strong levels of unmeasured confounding, which seems unlikely. On the other hand, self-reported coffee consumption at baseline is subject to measurement error, and consumption might have changed throughout follow-up. Among the participants who responded to the repeated QFFQ in 2003 to 2007 (n = 84 170) (average 11.0 years between measurements), the intraclass correlation coefficient between the 2 QFFQs was 0.60, which reflects potential changes over time or misclassification of coffee consumption. In the subset of participants with follow-up data on coffee consumption, the analysis using a time-dependent model yielded similar results. Because the highest level of coffee consumption in the QFFQ was 4 or more cups per day, we were not able to examine associations with higher levels. A recent meta-analysis of 15 prospective studies found similar associations for 4 cups per day and 5 or more cups per day (21), although the numbers of participants drinking more than 5 cups per day in epidemiologic studies have typically been small. Future studies are needed to examine associations in the heaviest coffee drinkers to address potential toxicity at high doses. In addition, we lacked information on preparation, which may affect the composition and bioavailability of coffee compounds (32).
In summary, higher coffee consumption was associated with lower risk for all-cause death and death from heart disease, cancer, respiratory disease, stroke, diabetes, and kidney disease. Inverse associations were found in African Americans, Japanese Americans, Latinos, and whites; never-smokers, former smokers, and current smokers; those with preexisting heart disease or cancer; and healthy participants. Our findings support the recent dietary guidelines from the U.S. Department of Agriculture (33), which indicate that moderate coffee consumption can be integrated into a healthy diet and lifestyle, by confirming an inverse association with mortality and suggesting that association’s generalizability to different racial/ethnic groups.
Acknowledgments
Grant Support: By grant U01CA164973 from the National Cancer Institute.
Appendix
Appendix Table 1.
Coffee Consumption and Total Mortality in the Multiethnic Cohort, by Sex, 1993–2012
| Coffee Consumption | Participants, n | Deaths, n | Adjusted Hazard Ratio (95% CI) |
||
|---|---|---|---|---|---|
| Model 1* | Model 2† | Model 3‡ | |||
| Men (n = 83 811) | |||||
| None | 12 268 | 4378 | 1.00 (reference) | 1.00 (reference) | 1.00 (reference) |
| 1–3 cups/mo | 5466 | 2058 | 1.03 (0.98–1.09) | 1.01 (0.96–1.07) | 1.02 (0.94–1.10) |
| 1–6 cups/wk | 11 626 | 4324 | 1.04 (0.99–1.08) | 0.97 (0.93–1.01) | 1.01 (0.95–1.08) |
| 1 cup/d | 25 206 | 10 243 | 1.03 (1.00–1.07) | 0.92 (0.89–0.95) | 0.93 (0.88–0.98) |
| 2–3 cups/d | 22 278 | 7522 | 1.02 (0.98–1.05) | 0.84 (0.81–0.88) | 0.86 (0.82–0.92) |
| ≥4 cups/d | 6967 | 2275 | 1.16 (1.10–1.22) | 0.83 (0.79–0.87) | 0.84 (0.77–0.91) |
| P for trend | – | – | <0.001 | <0.001 | <0.001 |
| Increase per cup | – | – | 1.01 (1.00–1.02) | 0.95 (0.94–0.96) | 0.95 (0.94–0.97) |
| Women (n = 102 044) | |||||
| None | 17 814 | 5082 | 1.00 (reference) | 1.00 (reference) | 1.00 (reference) |
| 1–3 cups/mo | 7904 | 2219 | 0.97 (0.92–1.02) | 0.96 (0.91–1.01) | 0.99 (0.93–1.06) |
| 1–6 cups/wk | 13 011 | 3570 | 0.96 (0.92–1.00) | 0.92 (0.88–0.96) | 0.94 (0.89–1.00) |
| 1 cup/d | 32 282 | 9380 | 0.92 (0.89–0.95) | 0.84 (0.81–0.87) | 0.86 (0.82–0.90) |
| 2–3 cups/d | 25 004 | 5873 | 0.90 (0.86–0.93) | 0.77 (0.74–0.80) | 0.80 (0.76–0.84) |
| ≥4 cups/d | 6029 | 1473 | 1.08 (1.02–1.15) | 0.78 (0.74–0.83) | 0.83 (0.76–0.90) |
| P for trend | – | – | 0.169 | <0.001 | <0.001 |
| Increase per cup | – | – | 0.99 (0.98–1.00) | 0.93 (0.92–0.94) | 0.94 (0.93–0.96) |
| P for heterogeneity | – | – | – | – | 0.50 |
Adjusted for age at cohort entry and ethnicity.
The following variables were also included to control for the effects of smoking: smoking status; average number of cigarettes; squared average number of cigarettes; number of years smoking (time-dependent); number of years since quitting (time-dependent); and interactions between ethnicity and smoking status, average number of cigarettes, squared average number of cigarettes, and number of years smoking.
Further adjusted for body mass index, education, physical activity, alcohol consumption, total energy intake, energy from fat, and preexisting illness.
Appendix Table 2.
HRs for Consumption of ≥4 Cups per Day Compared With Nondrinkers, Corrected for Different Levels of Confounding by an Unmeasured Dichotomous Confounder Using Sensitivity Analysis*
| P1 | P0 | |||||||||
|---|---|---|---|---|---|---|---|---|---|---|
| 0.0 | 0.1 | 0.2 | 0.3 | 0.4 | 0.5 | 0.6 | 0.7 | 0.8 | 0.9 | |
| Γ = 1.2 | ||||||||||
| 0.0 | 0.79 (0.73–0.85) | – | – | – | – | – | – | – | – | – |
| 0.1 | 0.80 (0.74–0.87) | 0.79 (0.73–0.85) | – | – | – | – | – | – | – | – |
| 0.3 | 0.84 (0.77–0.90) | 0.82 (0.76–0.88) | 0.80 (0.74–0.87) | 0.79 (0.73–0.85) | – | – | – | – | – | – |
| 0.5 | 0.87 (0.80–0.94) | 0.85 (0.79–0.92) | 0.84 (0.77–0.90) | 0.82 (0.76–0.88) | 0.80 (0.74–0.87) | 0.79 (0.73–0.85) | – | – | – | – |
| 0.7 | 0.90 (0.83–0.97) | 0.88 (0.82–0.95) | 0.87 (0.80–0.93) | 0.85 (0.78–0.91) | 0.83 (0.77–0.90) | 0.82 (0.74–0.86) | 0.80 (0.74–0.86) | 0.79 (0.73–0.85) | – | – |
| 0.9 | 0.93 (0.88–1.02) | 0.91 (0.84–0.98) | 0.90 (0.83–0.96) | 0.88 (0.81–0.95) | 0.86 (0.80–0.93) | 0.85 (0.78–0.91) | 0.83 (0.77–0.90) | 0.82 (0.76–0.88) | 0.80 (0.74–0.86) | 0.79 (0.73–0.85) |
| Γ = 1.3 | ||||||||||
| 0.0 | 0.79 (0.73–0.85) | – | – | – | – | – | – | – | – | – |
| 0.1 | 0.81 (0.75–0.88) | 0.79 (0.73–0.85) | – | – | – | – | – | – | – | – |
| 0.3 | 0.86 (0.80–0.93) | 0.84 (0.77–0.90) | 0.81 (0.75–0.87) | 0.79 (0.73–0.85) | – | – | – | – | – | – |
| 0.5 | 0.91 (0.84–0.98) | 0.88 (0.82–0.95) | 0.86 (0.79–0.92) | 0.83 (0.77–0.90) | 0.81 (0.75–0.87) | 0.79 (0.73–0.85) | – | – | – | – |
| 0.7 | 0.96 (0.88–1.03) | 0.93 (0.86–1.00) | 0.90 (0.83–0.97) | 0.88 (0.81–0.94) | 0.85 (0.79–0.92) | 0.83 (0.77–0.89) | 0.81 (0.75–0.87) | 0.79 (0.73–0.85) | – | – |
| 0.9 | 1.00 (0.93–1.08) | 0.97 (0.90–1.05) | 0.95 (0.87–1.02) | 0.92 (0.85–0.99) | 0.90 (0.83–0.96) | 0.87 (0.81–0.94) | 0.85 (0.79–0.91) | 0.83 (0.77–0.89) | 0.81 (0.75–0.87) | 0.79 (0.73–0.85) |
| Γ = 1.5 | ||||||||||
| 0.0 | 0.79 (0.73–0.85) | – | – | – | – | – | – | – | – | – |
| 0.1 | 0.83 (0.77–0.89) | 0.79 (0.73–0.85) | – | – | – | – | – | – | – | – |
| 0.3 | 0.91 (0.84–0.98) | 0.86 (0.80–0.93) | 0.82 (0.76–0.89) | 0.79 (0.73–0.85) | – | – | – | – | – | – |
| 0.5 | 0.99 (0.91–1.06) | 0.94 (0.78–1.01) | 0.90 (0.82–0.96) | 0.86 (0.79–0.92) | 0.82 (0.76–0.88) | 0.79 (0.73–0.85) | – | – | – | – |
| 0.7 | 1.07 (0.98–1.15) | 1.02 (0.94–1.09) | 0.97 (0.90–1.04) | 0.93 (0.86–1.00) | 0.89 (0.82–0.96) | 0.85 (0.79–0.92) | 0.82 (0.76–0.88) | 0.79 (0.73–0.85) | – | – |
| 0.9 | 1.14 (1.06–1.23) | 1.09 (1.01–1.17) | 1.04 (0.96–1.12) | 1.00 (0.92–1.07) | 0.95 (0.88–1.03) | 0.92 (0.85–0.99) | 0.88 (0.81–0.95) | 0.85 (0.78–0.91) | 0.82 (0.76–0.88) | 0.79 (0.73–0.85) |
| Γ = 2.0 | ||||||||||
| 0.0 | 0.79 (0.73–0.85) | – | – | – | – | – | – | – | – | – |
| 0.1 | 0.87 (0.80–0.94) | 0.79 (0.73–0.85) | – | – | – | – | – | – | – | – |
| 0.3 | 1.03 (0.95–1.10) | 0.93 (0.86–1.00) | 0.86 (0.79–0.92) | 0.79 (0.73–0.85) | – | – | – | – | – | – |
| 0.5 | 1.18 (1.10–1.28) | 1.08 (1.00–1.16) | 0.99 (0.91–1.06) | 0.91 (0.84–0.98) | 0.85 (0.78–0.91) | 0.79 (0.73–0.85) | – | – | – | – |
| 0.7 | 1.34 (1.24–1.44) | 1.22 (1.13–1.31) | 1.12 (1.03–1.20) | 1.03 (0.95–1.11) | 0.96 (0.89–1.03) | 0.90 (0.83–0.96) | 0.84 (0.78–0.90) | 0.79 (0.73–0.85) | – | – |
| 0.9 | 1.50 (1.39–1.62) | 1.36 (1.26–1.47) | 1.25 (1.16–1.34) | 1.15 (1.07–1.24) | 1.07 (0.99–1.15) | 1.01 (0.92–1.08) | 0.94 (0.87–1.01) | 0.88 (0.82–0.95) | 0.83 (0.77–0.90) | 0.79 (0.73–0.85) |
HR = hazard ratio.
Values are HR (95% CI). T is the HR for mortality, and U is an unmeasured dichotomous confounder for non– coffee drinkers and for drinkers of ≥4 cups per day. P1 is the proportion exposed to U in the group exposed to ≥4 cups of caffeinated coffee, and P0 is the proportion exposed to U in the group not exposed to coffee. We assume that U is positively associated with coffee consumption, so that P1 ≥ P0. The corrected HR (HRcorrected) is computed as HRobs/([ΓP1 + {1 − P1}]/[ΓP0 + {1 − P0}]), where HRobs is the observed HR (0.79 in this case). Cells with no formatting represent settings where the corrected HR is <1 and is significant, boldface cells represent settings where the CI includes 1, and boldface and italic cells represent settings where the corrected HR is >1 and is significant.
Appendix Table 3.
Coffee Consumption and Total Mortality in the Multiethnic Cohort, by Sex, 1993–2012
| Coffee Consumption | Participants With Previous Heart Disease or Cancer (n = 32 607) |
Never-Smokers Without Previous Heart Disease or Cancer (n = 70 970) |
||
|---|---|---|---|---|
| Deaths, n | HR (95% CI)*† | Deaths, n | HR (95% CI)† | |
| None | 2886 | 1.00 (reference) | 3239 | 1.00 (reference) |
| 1–3 cups/mo | 1342 | 1.07 (0.96–1.19) | 1338 | 0.90 (0.81–1.01) |
| 1–6 cups/wk | 2417 | 1.00 (0.91–1.10) | 2240 | 0.94 (0.85–1.04) |
| 1 cup/d | 5783 | 0.88 (0.82–0.95) | 5032 | 0.87 (0.80–0.94) |
| 2–3 cups/d | 3780 | 0.84 (0.77–0.91) | 2848 | 0.83 (0.75–0.91) |
| ≥4 cups/d | 933 | 0.76 (0.66–0.87) | 521 | 0.87 (0.73–1.05) |
| P for trend | – | <0.001 | – | <0.001 |
| Increase per cup | – | 0.93 (0.91–0.95) | – | 0.96 (0.93–0.98) |
HR = hazard ratio.
The following variables were included to control for the effects of smoking: smoking status; average number of cigarettes; squared average number of cigarettes; number of years smoking (time-dependent); number of years since quitting (time-dependent); and interactions between ethnicity and smoking status, average number of cigarettes, squared average number of cigarettes, and number of years smoking.
Adjusted for age at cohort entry, sex, ethnicity, body mass index, education, physical activity, alcohol consumption, total energy intake, and energy from fat.
Appendix Table 4.
Coffee Consumption and Total Mortality, in the Multiethnic Cohort, by Age Group and Education Level, 1993–2012*
| Coffee Consumption | <55y (n = 58 812) |
55–70 y (n = 100 314) |
>70y (n = 26 729) |
|||
|---|---|---|---|---|---|---|
| Deaths, n | HR (95% CI)* | Deaths, n | HR (95% CI)* | Deaths, n | HR (95% CI)* | |
| None | 1353 | 1.00 (reference) | 5179 | 1.00 (reference) | 2928 | 1.00 (reference) |
| 1–3 cups/mo | 567 | 1.09 (0.94–1.26) | 2375 | 0.98 (0.92–1.05) | 1335 | 1.03 (0.94–1.14) |
| 1–6 cups/wk | 922 | 0.99 (0.88–1.13) | 4618 | 0.97 (0.92–1.03) | 2354 | 0.99 (0.91–1.08) |
| 1 cup/d | 1629 | 0.85 (0.77–0.95) | 11 249 | 0.89 (0.85–0.93) | 6745 | 0.90 (0.85–0.97) |
| 2–3 cups/d | 1589 | 0.73 (0.66–0.82) | 8139 | 0.83 (0.79–0.88) | 3667 | 0.85 (0.79–0.92) |
| ≥4 cups/d | 641 | 0.74 (0.64–0.85) | 2344 | 0.81 (0.75–0.87) | 763 | 0.96 (0.84–1.09) |
| P for trend | – | <0.001 | – | <0.001 | – | <0.001 |
| Increase per cup | – | 0.91 (0.89–0.94) | – | 0.95 (0.94–0.96) | – | 0.96 (0.94–0.98) |
| P for heterogeneity | – | 0.019 | – | – | – | – |
|
High School or Less (n = 81 248) |
Vocational School/Some College (n = 55 082) |
College Graduate (n = 49 525) |
||||
| None | 4879 | 1.00 (reference) | 2622 | 1.00 (reference) | 1959 | 1.00 (reference) |
| 1–3 cups/mo | 2135 | 1.00 (0.94–1.07) | 1255 | 1.02 (0.92–1.13) | 887 | 0.97 (0.86–1.11) |
| 1–6 cups/wk | 4403 | 0.97 (0.92–1.03) | 2105 | 0.96 (0.88–1.04) | 1386 | 0.96 (0.86–1.08) |
| 1 cup/d | 10 900 | 0.90 (0.86–0.94) | 5247 | 0.82 (0.77–0.88) | 3476 | 0.89 (0.81–0.98) |
| 2–3 cups/d | 6941 | 0.82 (0.78–0.87) | 3762 | 0.80 (0.74–0.86) | 2692 | 0.87 (0.78–0.95) |
| ≥4 cups/d | 1921 | 0.82 (0.76–0.88) | 1068 | 0.80 (0.71–0.90) | 759 | 0.90 (0.78–1.04) |
| P for trend | – | <0.001 | – | <0.001 | – | 0.014 |
| Increase per cup | – | 0.95 (0.94–0.96) | – | 0.94 (0.93–0.96) | – | 0.96 (0.94–0.99) |
| P for heterogeneity | – | 0.055 | – | – | – | – |
HR = hazard ratio.
The following variables were included to control for the effects of smoking: smoking status; average number of cigarettes; squared average number of cigarettes; number of years smoking (time-dependent); number of years since quitting (time-dependent); and interactions between ethnicity and average number of cigarettes, squared average number of cigarettes, and number of years smoking. The models were also adjusted for age at cohort entry, sex, ethnicity, body mass index, education, physical activity, alcohol consumption, total energy intake, energy from fat, and preexisting illness.
Footnotes
Disclosures: Dr. Wilkens reports grants from the National Cancer Institute during the conduct of the study. Authors not named here have disclosed no conflicts of interest. Disclosures can also be viewed at www.acponline.org/authors/icmje/ConflictOfInterestForms.do?msNum=M16-2472.
Reproducible Research Statement: Study protocol: Cohort description and questionnaires are available at www.uhcancercenter.org/research/the-multiethnic-cohort-study-mec. Statistical code: Available from Dr. Park (spark@cc.hawaii.edu). Data set: Not available.
References
- 1.Loftfield E, Freedman ND, Dodd KW, Vogtmann E, Xiao Q, Sinha R, et al. Coffee drinking is widespread in the United States, but usual intake varies by key demographic and lifestyle factors. J Nutr. 2016; 146:1762–8. doi: 10.3945/jn.116.233940 [DOI] [PMC free article] [PubMed] [Google Scholar]
- 2.Bøhn SK, Blomhoff R, Paur I. Coffee and cancer risk, epidemiological evidence, and molecular mechanisms. Mol Nutr Food Res. 2014; 58:915–30. doi: 10.1002/mnfr.201300526 [DOI] [PubMed] [Google Scholar]
- 3.Huxley R, Lee CM, Barzi F, Timmermeister L, Czernichow S, Perkovic V, et al. Coffee, decaffeinated coffee, and tea consumption in relation to incident type 2 diabetes mellitus: a systematic review with meta-analysis. Arch Intern Med. 2009;169:2053–63. doi: 10.1001/archinternmed.2009.439 [DOI] [PubMed] [Google Scholar]
- 4.Jiang X, Zhang D, Jiang W. Coffee and caffeine intake and incidence of type 2 diabetes mellitus: a meta-analysis of prospective studies. Eur J Nutr. 2014;53:25–38. doi: 10.1007/s00394-013-0603-x [DOI] [PubMed] [Google Scholar]
- 5.Saab S, Mallam D, Cox GA 2nd, Tong MJ. Impact of coffee on liver diseases: a systematic review. Liver Int. 2014;34:495–504. doi: 10.1111/liv.12304 [DOI] [PubMed] [Google Scholar]
- 6.Sääksjärvi K, Knekt P, Rissanen H, Laaksonen MA, Reunanen A, Männistö S. Prospective study of coffee consumption and risk of Parkinson’s disease. Eur J Clin Nutr. 2008;62:908–15. [DOI] [PubMed] [Google Scholar]
- 7.Hernán MA, Takkouche B, Caamaño-Isorna F, Gestal-Otero JJ. A meta-analysis of coffee drinking, cigarette smoking, and the risk of Parkinson’s disease. Ann Neurol. 2002;52:276–84. [DOI] [PubMed] [Google Scholar]
- 8.Je Y, Giovannucci E. Coffee consumption and total mortality: a meta-analysis of twenty prospective cohort studies. Br J Nutr. 2014; 111:1162–73. doi: 10.1017/S0007114513003814 [DOI] [PubMed] [Google Scholar]
- 9.Ding M, Satija A, Bhupathiraju SN, Hu Y, Sun Q, Han J, et al. Association of coffee consumption with total and cause-specific mortality in 3 large prospective cohorts. Circulation. 2015;132:2305–15. doi: 10.1161/CIRCULATIONAHA.115.017341 [DOI] [PMC free article] [PubMed] [Google Scholar]
- 10.Loftfield E, Freedman ND, Graubard BI, Guertin KA, Black A, Huang WY, et al. Association of coffee consumption with overall and cause-specific mortality in a large US prospective cohort study. Am J Epidemiol. 2015;182:1010–22. doi: 10.1093/aje/kwv146 [DOI] [PMC free article] [PubMed] [Google Scholar]
- 11.Kolonel LN, Henderson BE, Hankin JH, Nomura AM, Wilkens LR, Pike MC, et al. A multiethnic cohort in Hawaii and Los Angeles: baseline characteristics. Am J Epidemiol. 2000;151:346–57. [DOI] [PMC free article] [PubMed] [Google Scholar]
- 12.Stram DO, Hankin JH, Wilkens LR, Pike MC, Monroe KR, Park S, et al. Calibration of the dietary questionnaire for a multiethnic cohort in Hawaii and Los Angeles. Am J Epidemiol. 2000;151:358–70. [DOI] [PMC free article] [PubMed] [Google Scholar]
- 13.Setiawan VW, Wilkens LR, Lu SC, Hernandez BY, Le Marchand L, Henderson BE. Association of coffee intake with reduced incidence of liver cancer and death from chronic liver disease in the US Multiethnic Cohort. Gastroenterology. 2015;148:118–25. doi: 10.1053/j.gastro.2014.10.005 [DOI] [PMC free article] [PubMed] [Google Scholar]
- 14.National Center for Health Statistics. Health, United States, 2015: With Special Feature on Racial and Ethnic Health Disparities. DHHS publication no. 2016–1232. Hyattsville, MD: U.S. Department of Health and Human Services; 2016. [PubMed] [Google Scholar]
- 15.Haiman CA, Stram DO, Wilkens LR, Pike MC, Kolonel LN, Henderson BE, et al. Ethnic and racial differences in the smoking-related risk of lung cancer. N Engl J Med. 2006;354:333–42. [DOI] [PubMed] [Google Scholar]
- 16.Therneau TM, Grambsch PM. Modeling Survival Data: Extending the Cox Model. New York: Springer; 2000. [Google Scholar]
- 17.Makuch RW. Adjusted survival curve estimation using covariates. J Chronic Dis. 1982;35:437–43. [DOI] [PubMed] [Google Scholar]
- 18.Nieto FJ, Coresh J. Adjusting survival curves for confounders: a review and a new method. Am J Epidemiol. 1996;143:1059–68. [DOI] [PubMed] [Google Scholar]
- 19.Lin DY, Psaty BM, Kronmal RA. Assessing the sensitivity of regression results to unmeasured confounders in observational studies. Biometrics. 1998;54:948–63. [PubMed] [Google Scholar]
- 20.Malerba S, Turati F, Galeone C, Pelucchi C, Verga F, La Vecchia C, et al. A meta-analysis of prospective studies of coffee consumption and mortality for all causes, cancers and cardiovascular diseases. Eur J Epidemiol. 2013;28:527–39. doi: 10.1007/s10654-013-9834-7 [DOI] [PubMed] [Google Scholar]
- 21.Crippa A, Discacciati A, Larsson SC, Wolk A, Orsini N. Coffee consumption and mortality from all causes, cardiovascular disease, and cancer: a dose-response meta-analysis. Am J Epidemiol. 2014; 180:763–75. doi: 10.1093/aje/kwu194 [DOI] [PubMed] [Google Scholar]
- 22.Zhao Y, Wu K, Zheng J, Zuo R, Li D. Association of coffee drinking with all-cause mortality: a systematic review and meta-analysis. Public Health Nutr. 2015;18:1282–91. doi: 10.1017/S1368980014001438 [DOI] [PMC free article] [PubMed] [Google Scholar]
- 23.Löf M, Sandin S, Yin L, Adami HO, Weiderpass E. Prospective study of coffee consumption and all-cause, cancer, and cardiovascular mortality in Swedish women. Eur J Epidemiol. 2015;30:1027–34. doi: 10.1007/s10654-015-0052-3 [DOI] [PubMed] [Google Scholar]
- 24.Grosso G, Stepaniak U, Micek A, Stefler D, Bobak M, Pajak A. Coffee consumption and mortality in three Eastern European countries: results from the HAPIEE (Health, Alcohol and Psychosocial factors In Eastern Europe) study. Public Health Nutr. 2017;20:82–91. doi: 10.1017/S1368980016001749 [DOI] [PMC free article] [PubMed] [Google Scholar]
- 25.Saito E, Inoue M, Sawada N, Shimazu T, Yamaji T, Iwasaki M, et al. Association of coffee intake with total and cause-specific mortality in a Japanese population: the Japan Public Health Center-based Prospective Study. Am J Clin Nutr. 2015;101:1029–37. doi: 10.3945/ajcn.114.104273 [DOI] [PubMed] [Google Scholar]
- 26.Freedman ND, Park Y, Abnet CC, Hollenbeck AR, Sinha R. Association of coffee drinking with total and cause-specific mortality. N Engl J Med. 2012;366:1891–904. doi: 10.1056/NEJMoa1112010 [DOI] [PMC free article] [PubMed] [Google Scholar]
- 27.Liu J, Sui X, Lavie CJ, Hebert JR, Earnest CP, Zhang J, et al. Association of coffee consumption with all-cause and cardiovascular disease mortality. Mayo Clin Proc. 2013;88:1066–74. doi: 10.1016/j.mayocp.2013.06.020 [DOI] [PMC free article] [PubMed] [Google Scholar]
- 28.Loftfield E, Shiels MS, Graubard BI, Katki HA, Chaturvedi AK, Trabert B, et al. Associations of coffee drinking with systemic immune and inflammatory markers. Cancer Epidemiol Biomarkers Prev. 2015;24:1052–60. doi: 10.1158/1055-9965.EPI-15-0038-T [DOI] [PMC free article] [PubMed] [Google Scholar]
- 29.Martini D, Del Bo’ C, Tassotti M, Riso P, Del Rio D, Brighenti F, et al. Coffee consumption and oxidative stress: a review of human intervention studies. Molecules. 2016;21. doi: 10.3390/molecules21080979 [DOI] [PMC free article] [PubMed] [Google Scholar]
- 30.Akash MS, Rehman K, Chen S. Effects of coffee on type 2 diabetes mellitus. Nutrition. 2014;30:755–63. doi: 10.1016/j.nut.2013.11.020 [DOI] [PubMed] [Google Scholar]
- 31.Wadhawan M, Anand AC. Coffee and liver disease. J Clin Exp Hepatol. 2016;6:40–6. doi: 10.1016/j.jceh.2016.02.003 [DOI] [PMC free article] [PubMed] [Google Scholar]
- 32.Cornelis MC. Toward systems epidemiology of coffee and health. Curr Opin Lipidol. 2015;26:20–9. doi: 10.1097/MOL.0000000000000143 [DOI] [PubMed] [Google Scholar]
- 33.U.S. Department of Health and Human Services and U.S. Department of Agriculture. 2015–2020 Dietary Guidelines for Americans. 8th ed. HHS publication no. HHS-ODPHP-2015-2020-01-DGA-A. Washington, DC: U.S. Department of Health and Human Services; 2015. Accessed at http://health.gov/dietaryguidelines/2015/guidelines on 20 March 2017. [Google Scholar]