

Abstract
The mammalian skull is composed of the calvarial bones and cartilages. Malformation of craniofacial cartilage has been identified in multiple human syndromes. However, the mechanisms of their development remain largely unknown. In the present study, we identified Pdgfra as a novel player of chondrocranial cartilage development. Our data show that Pdgfra is required for normal chondrocranial cartilage development. Using tissue-specific genetic tools, we demonstrated that Pdgfra is essential for chondrocyte progenitors formation, but not in mature chondrocytes. Further analysis revealed that Pdgfra regulates chondrocytes progenitors development at two stages: in embryonic mesenchymal stem cells(eMSCs), Pdgfra directs their differentiation toward chondrocyte progenitors; in chondrocytes progenitors, Pdgfra activation promotes cell proliferation. We also found that excessive Pdgfra activity causes ectopic cartilage formation. Our data show that Pdgfra directs eMSCs differentiation via inhibiting Wnt9a transcription and its downstream signaling, and activating Wnt signaling rescues ectopic cartilage phenotype caused by excessive Pdgfra activity. In summary, our study dissected the role of Pdgfra signaling in chondrocranial cartilage formation, and illustrated the underlying mechanisms at multiple stages.
Keywords: Pdgfra, Wnt9a, embryonic mesenchymal stem cells, chondrocyte progenitors, chondrocranium
Summary Statement
Our study identified Pdgfra as a novel regulator of chondrocranial cartilage development and revealed that Pdgfra directs eMSCs fate via inhibiting Wnt/beta catenin signaling in this process.
Introduction
The mammalian skull is composed of two principle tissues, bone and cartilage. The roof of the skull is composed of the intramembranous bones, and the lateral portion and the base of the skull are initially formed as cartilages(Kawasaki et al., 2009; Kawasaki and Richtsmeier, 2017; McBratney-Owen et al., 2008). The chondrocranium is composed of these cartilages and the bones that later formed from them. It functions to protect the brain and sense organs. Based on the organs it protects, the chondrocranium is organized into three regions: braincase, nasal capsule and otic capsule(Moore, 1981). The braincase provides protection to the brain and eyes, and the nasal capsule and otic capsule protects the olfactory organs and hearing and balancing organs respectively(Kawasaki and Richtsmeier, 2017).
In mice, the chondrocranial development starts at embryonic day (E)11. The caudal chondrocranium forms first, followed by the formation of the nasal capsule at E12.5. By E15.5, the cartilaginous skull formation is completed following the fusion of these two parts via the midline stem and the lateral struts of the vault cartilages(Kawasaki and Richtsmeier, 2017; McBratney-Owen et al., 2008). Lineage tracing studies reveal that the chondrocranium shares common origins with other craniofacial skeletons and is derived from neural crest and mesoderm(Jiang et al., 2002; Kawasaki and Richtsmeier, 2017; Yoshida et al., 2008). The caudal chondrocranium is derived from mesoderm cells, and the rostral portion is originated predominantly from the neural crest(McBratney-Owen et al., 2008).
Malformations of chondrocranial cartilage have been reported in multiple human syndromes, and are proposed to lead a primary role in craniofacial anomalies(Captier et al., 2003; Kreiborg et al., 1993; Tokumaru et al., 1996). However, the molecular mechanisms regulating its development remain largely unknown. Previous studies showed that altered growth factor signaling activity are implicated in cranial cartilage formation. Among these, augmented Bmp signaling and Fgf signaling have been shown to disrupt nasal capsule cartilage development(Hayano et al., 2015; Holmes et al., 2018). Wnt9a deficiency or tissue specific inactivation of Wnt/beta-catenin signaling causes defects in caudal vault cartilage and cranial base cartilages(Goodnough et al., 2012; Hill et al., 2005; Nagayama et al., 2008; Spater et al., 2006; Tran et al., 2010). Identification of novel genetic regulators will help to further illustrate the development of chondrocranium and to better understand the etiology of related craniofacial diseases.
Platelet derived growth factor(Pdgf) signaling molecules play a pleiotropic role in embryo development(Ding et al., 2004; Fantauzzo and Soriano, 2016; He and Soriano, 2013; Klinghoffer et al., 2002; Soriano, 1997; Tallquist and Soriano, 2003). In previous study we have reported that global activation of Pdgfra signaling in mice causes craniosynostosis at the coronal sutures, accompanied by abnormal expansion and differentiation of underlying cartilage anlagen(He and Soriano, 2017), suggesting that Pdgfra is a potential regulator of chondrocranium development. In this study, we found that Pdgfra deficiency causes chondrocranial cartilage hypoplasia, and activation of Pdgfra leads to ectopic cartilage formation. Interestingly, tissue-specific manipulation of Pdgfra activity in chondrocytes only results in mild cartilage phenotype in mice. We showed that Pdgfra plays an instructive role in early embryonic mesenchymal stem cells(eMSCs) and directs their differentiation towards chondrocyte progenitors. Our data also revealed that Pdgfra orchestrates formation of Sox9+ chondrocytes progenitors via inhibiting Wnt9a/beta-catenin signaling pathway, and Pdgfra activation promotes proliferation of these Sox9+ cells. Taken together, we identified Pdgfra as a novel regulator of chondrocranial development, and showed that Pdgfra plays a crucial role in eMSCs differentiation and chondrocyte progenitor proliferation.
Results
Pdgfra is essential for chondrocranium development
To examine the role of Pdgfra in chondrocranium development, we have analyzed the cartilage phenotype of Pdgfra null mutants(PdgfraGFP/GFP) and their littermate controls. Because PdgfraGFP/GFP embryos exhibit lethality at E15.5, we have carried out whole mount alcian blue staining at this and earlier stages. We first confirmed that Pdgfra expression is ablated in PdgfraGFP/GFP embryo(FigS1). Our data show that Pdgfra deficiency leads to severe hypoplasia of craniofacial cartilages(Fig1A, B). In the mutant embryos, the nasal cartilage(NC), tectum transversum(TTR) and parietal cartilage(PC) are significantly smaller than the wild-type counterparts(Fig 1A, B). To identify these phenotypes in details, we have examined the transverse sections of E13.5 and E15.5 embryos. At E13.5, the wild-type NC is well formed and organized as a symmetric structure along the dorsal-ventral axis(Fig 1C); on the other hand, the mutant NC is separated(Fig 1D). At E15.5, the wild-type NC has further extended along the axis and well formed supporting the primitive nasal cavity(Fig 1E), while the mutant remains split, shortened and poorly organized(Fig 1F; Pdgfra+/+, n=4; PdgfraGFP/GFP, n=5). During normal embryogenesis, TTR forms around E13.5 and can be detected by alcian blue staining(Fig1G), and the PdgfraGFP/GFP TTR is significantly smaller than the control and is barely detected(Fig 1H). At E15.5, TTR is located underneath the coronal suture between frontal bone(FB) and parietal bone(PB) in the wild-type embryo(Fig1I)(He and Soriano, 2017); on the other hand, the mutant TTR is smaller and its location shifts toward the frontal bones(Fig1J, Pdgfra+/+, n=5; PdgfraGFP/GFP, n=5). These results demonstrate that Pdgfra is required for normal chondrocranial cartilage development.
Fig 1. Pdgfra is essential for normal chondrocranium development.
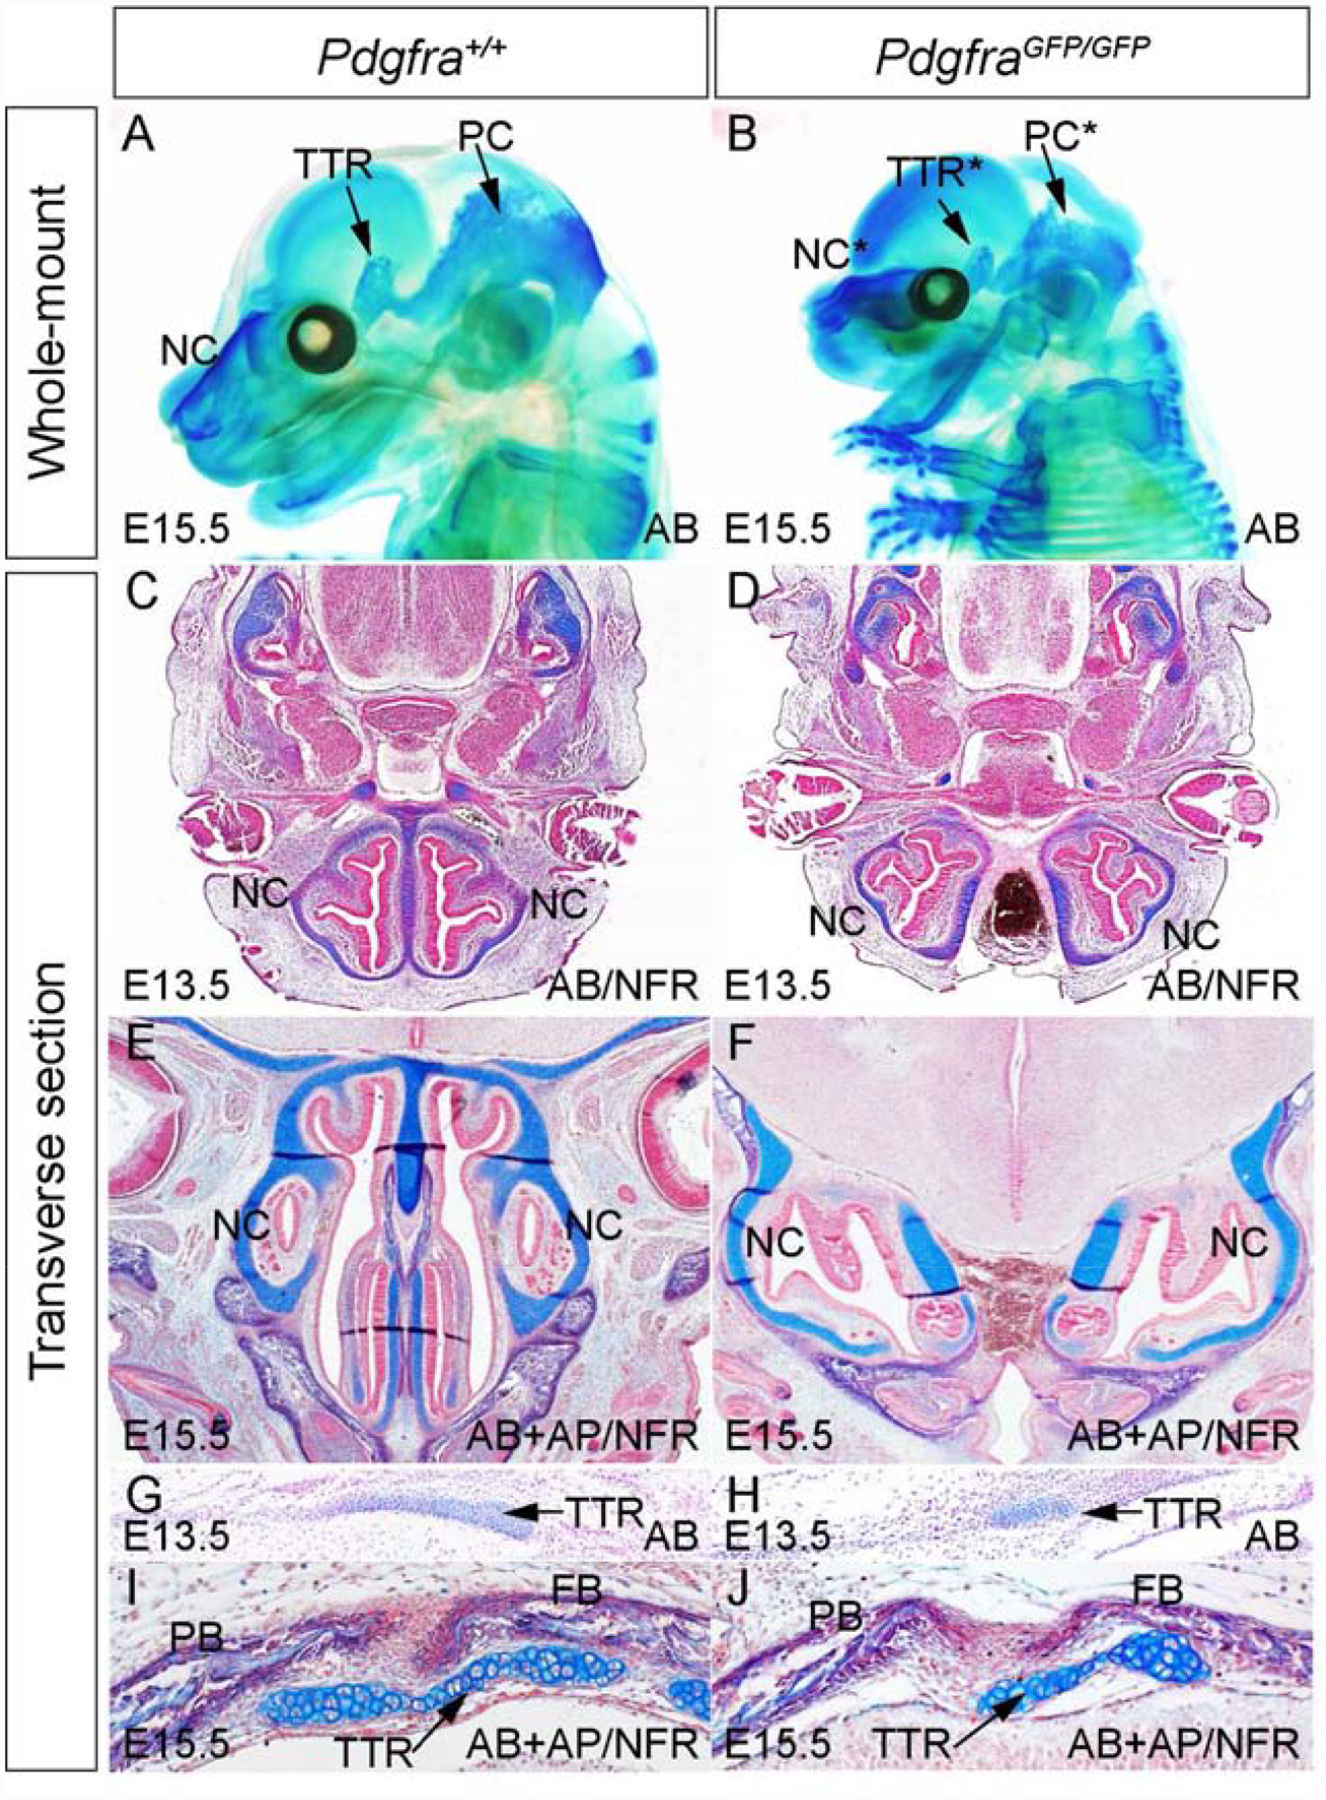
(A, B)Whole mount alcian blue staining of Pdgfra+/+ (A) and PdgfraGFP/GFP(B) embryos at E15.5. (C-F) Alcian blue staining on transverse sections across NC of Pdgfra+/+ (C, E) and PdgfraGFP/GFP(D, F) embryos at E13.5(C, D) and at E15.5(E, F). (G-J) Alcian blue staining on transverse sections of Pdgfra+/+ (G, I) and PdgfraGFP/GFP(H, J) embryos at the level of TTR at E13.5(G, H) and at E15.5(I, J). AB, alcian blue; AP, alkaline phosphatase; FB, frontal bone; NC, nasal cartilage; NFR, nuclear fast red; PB, parietal bone; PC, parietal cartilage; TTR, tectum transversum.
Pdgfra is dispensable for cell proliferation and survival in chondrocranial chondrocytes
Previous studies show Pdgfra is implicated in cell survival and proliferation during craniofacial development(He and Soriano, 2013; Soriano, 1997). To delineate the mechanisms of Pdgfra regulation on chondrocranial cartilage development, we have analyzed cell survival and proliferation rate in the chondrocranial chondrocytes. At E13.5, immunofluorescence assay using anti-cleaved caspase3 antibody identifies apoptotic cells in the trigeminal ganglia(TGG), but fails to detect any positive signal in NC(Fig 2A–D) or other cartilages(data not shown) from wild-type or PdgfraGFP/GFP embryos. Our data show 3.3%±1.3% of Pdgfra+/+ and 2.4%±1.0% of PdgfraGFP/GFP are undergoing apoptosis, and the difference is not statistically significant (p=0.26, n=5). BrdU labeling results show that the ratio of BrdU labeled chondrocytes is lower in mutant TTR and NC compared to wild-type counterparts, but the alteration is not statistically significant(Fig 2E–I, n=9 in each phenotype, P>0.05). These results indicate that Pdgfra is dispensable for chondrocytes survival and proliferation during chondrocranial development. In consistent with this notion, we found that chondrocytes-specific inactivation of Pdgfra using Col2a1Cre does not cause significant cartilage defect at E15.5(Fig 3A–D, Pdgfrafl/fl, n=5; Pdgfrafl/fl;Col2a1Cre, n=7)(Sakai et al., 2001), and the Pdgfrafl/fl;Col2a1Cre mice can survive to adulthood without any noticeable phenotype(data not shown, n=5).
Fig 2. Pdgfra plays a dispensable role in chondrocyte proliferation and survival.

(A-D) Immunofluorescence staining using anti-cleaved caspase3 antibody(green) on transverse sections of Pdgfra+/+ (A, C) and PdgfraGFP/GFP(B, D) embryos at the level of NC(A, B) and TGG(C, D) at E13.5. The slides were counterstained with DAPI(blue). TGG serves as positive control of the immunostaining assay. (E-H) BrdU labeling on transverse sections of Pdgfra+/+ (E, G) and PdgfraGFP/GFP(F, H) embryos at the level of TTR(E, F) and NC(G, H) at E13.5. (I) Statistical analysis of BrdU labeling results in (E-H). AB, alcian blue; NC, nasal cartilage; NFR, nuclear fast red; TTR, tectum transversum.
Fig 3. Chondrocyte-specific inactivation of Pdgfra does not alter chondrocranial cartilage formation.
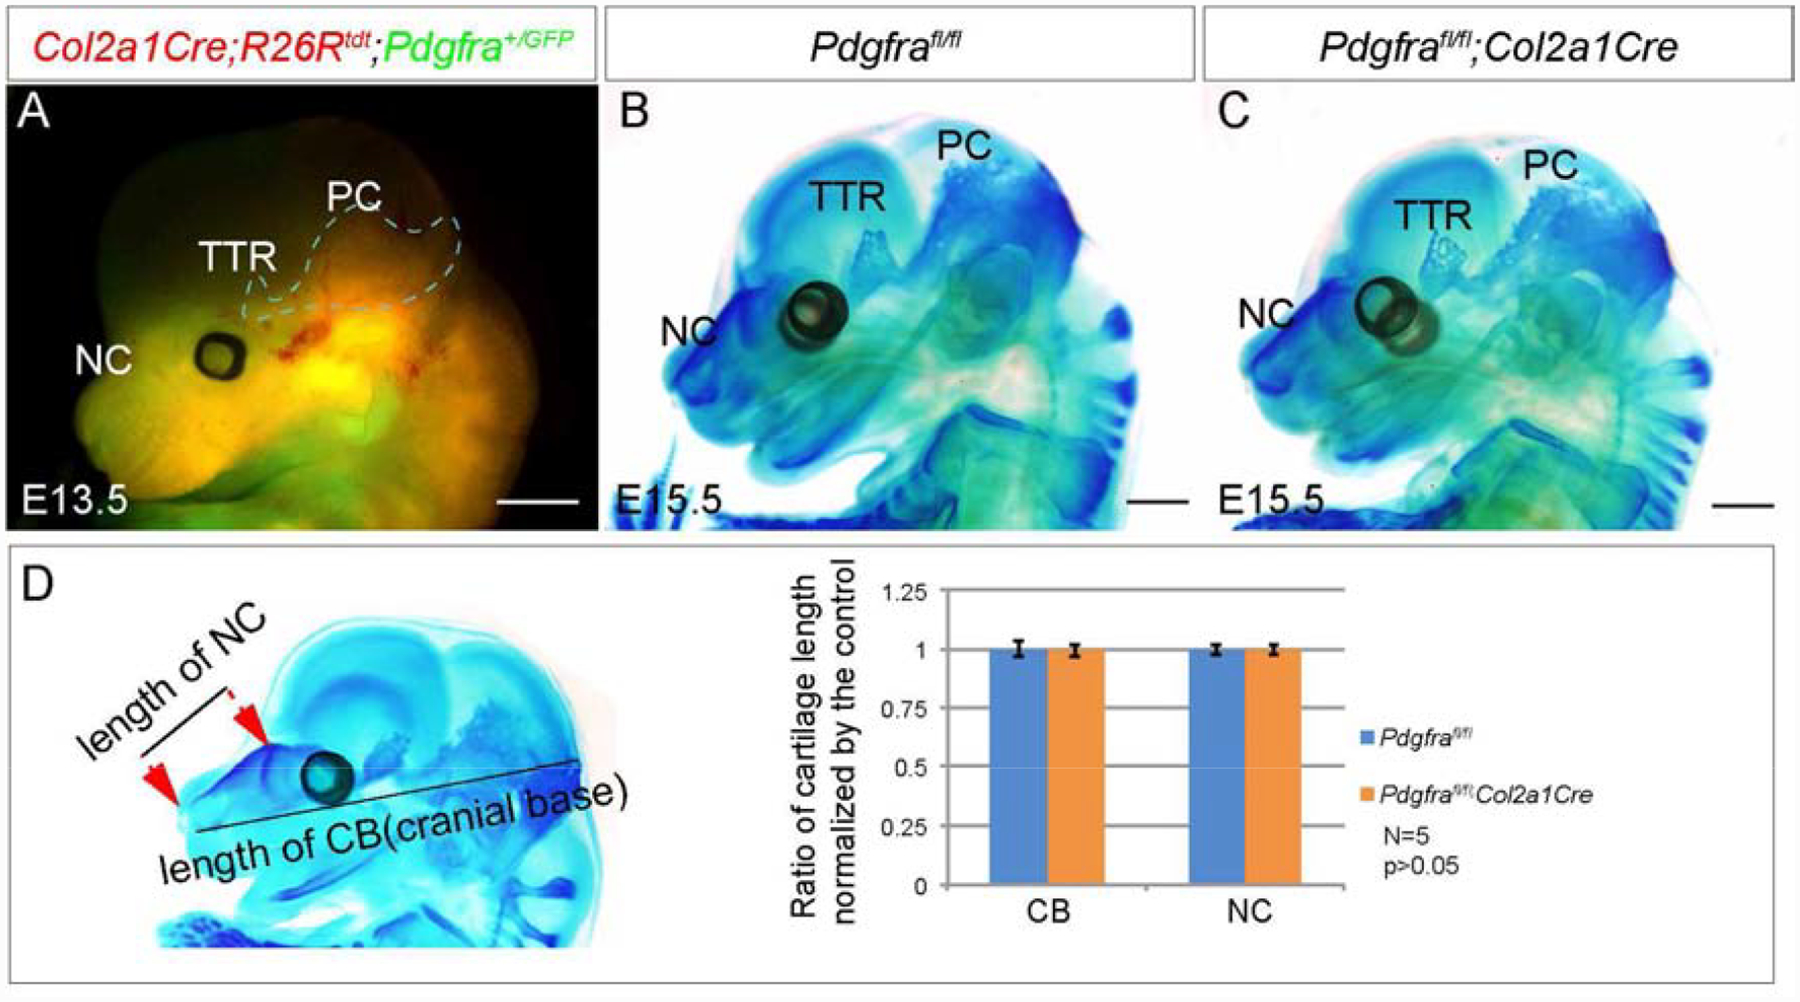
(A) Co-expression of Pdgfra+ and Col2a1+ cells in E13.5 embryonic head. Pdgfra+ cells are marked with EGFP(green fluorescence) and Col2a1+ cells are marked with tdTomato(red fluorescence) in Col2a1Cre;R26Rtdt;Pdgfra+/GFP embryo. (B, C) Whole mount alcian blue staining of Pdgfrafl/fl(B) and Pdgfrafl/fl;Col2a1Cre(C) embryos at E15.5. (D) Statistical analysis of the length of NC and cranial base in Pdgfrafl/fl and Pdgfrafl/fl;Col2a1Cre embryos at E15.5. N=5, P>0.05. NC, nasal cartilage; PB, parietal bone; PC, parietal cartilage; TTR, tectum transversum. Scale bar= 1mm.
Chondrocyte progenitor formation is impaired in Pdgfra deficient embryonic head
The different chondrocranial phenotypes of PdgfraGFP/GFP (Fig 1) and Pdgfrafl/fl;Col2a1Cre(Fig 3) suggests that Pdgfra plays an important role in chondrocyte progenitors rather than in chondrocytes. To test this hypothesis, we have examined the expression pattern of chondrocyte progenitor maker Sox9 and its downstream target Col2a1 in the Pdgfra null mutant embryos(Bi et al., 1999). In situ hybridization results show that in the wild-type embryo, Sox9 mRNA is expressed in the primitive TTR and NC(Fig 4A) at E13.5. In PdgfraGFP/GFP, both the expression level and domain of Sox9 mRNA is significantly decreased(Fig 4B). Similarly, Col2a1 expression level and pattern is also downregulated in PdgfraGFP/GFP(Fig 4D) as compared to that of littermate control(Fig 4C). These results indicate that Pdgfra plays an important role in chondrocyte progenitor formation.
Fig 4. Pdgfra deficiency affects chondrocyte progenitor gene expression in the developing chondrocranium.
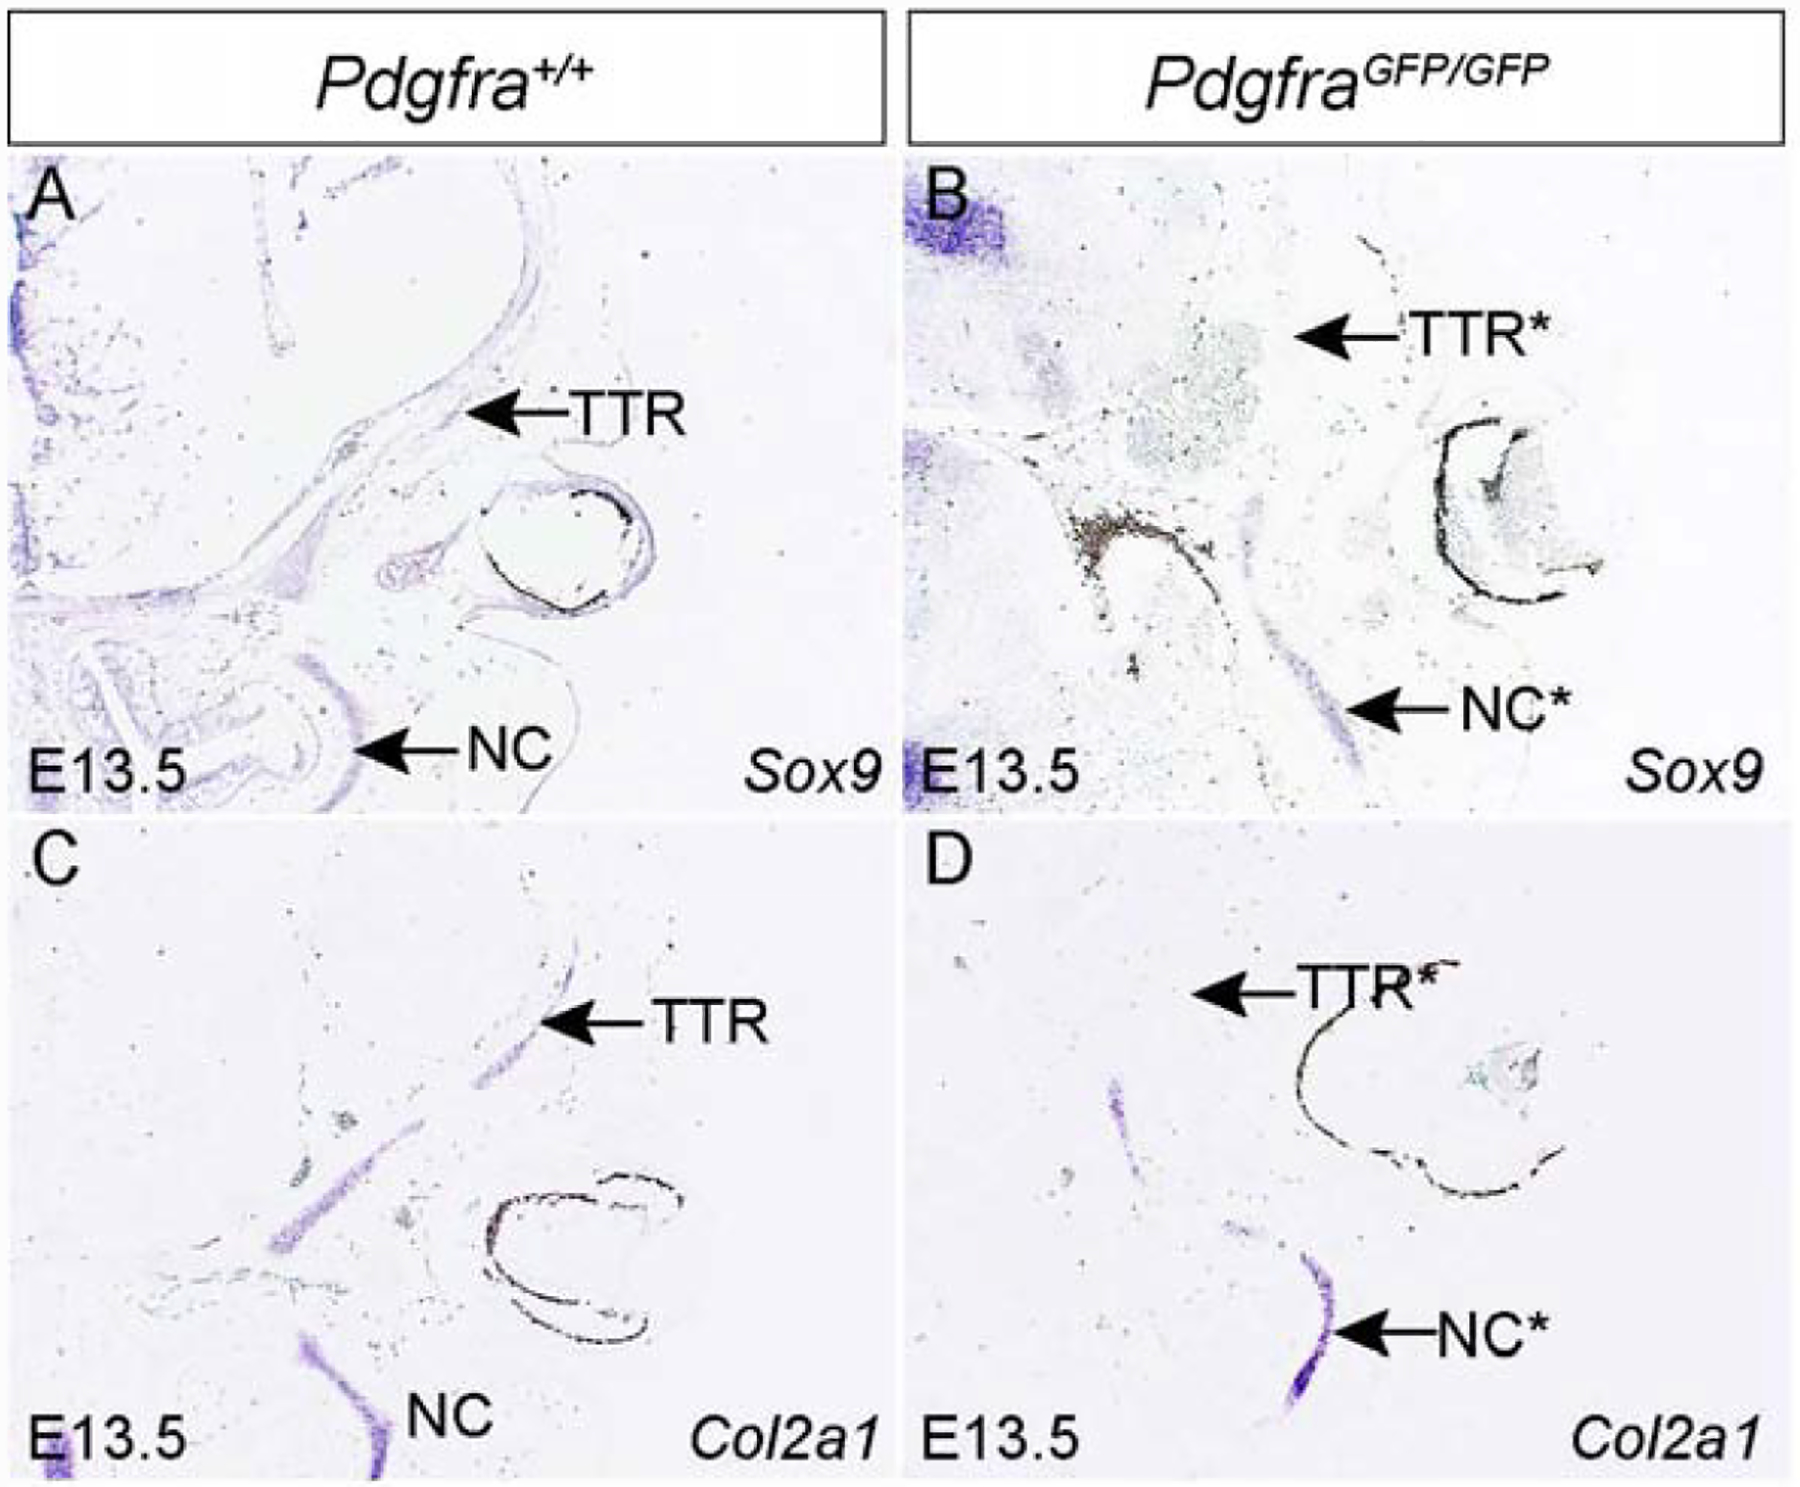
In situ hybridization results showing chondrocyte progenitor gene Sox9(A, B) and its downstream gene Col2a1(C, D) in Pdgfra+/+ (A, C) and PdgfraGFP/GFP(B, D) embryos at the level of NC and TTR at E13.5. NC, nasal cartilage; TTR, tectum transversum.
Augmented Pdgfra signaling in epiblasts leads to ectopic cartilage formation
To gain a systemic view of the role of Pdgfra in chondrocranial cartilage formation, we examined the cartilage phenotype in Pdgfra gain-of-function models. To this end we have generated Pdgfra+/K;Meox2Cre mice, which expresses a constitutively active Pdgfra using its endogenous promoter at stage of epiblasts(Olson and Soriano, 2009; Tallquist and Soriano, 2000). Alcian blue staining results show that in Pdgfra+/K;Meox2Cre embryos, the NC, TTR and PC are all expanded at E14.5(Fig 5A, B, Pdgfra+/+, n=4; Pdgfra+/K;Meox2Cre, n=5), and TTR and PC become connected(Fig 5B). Alcian blue staining on coronal sections confirms that in Pdgfra+/K;Meox2Cre embryos both NC and TTR cartilage significantly expands (Fig 5C–F), and the NC is fused with ala orbitalis(AO) in the mutant embryos(arrows in Fig 5F) but not in the control(Fig 5E). In addition, we identified ectopic cartilage anlagen at the dorsal side of the mutant forelimb digit 5(Fig 5H, Pdgfra+/+, n=4; Pdgfra+/K;Meox2Cre, n=5). These data demonstrate that global activation of Pdgfra in epiblasts not only causes expansion of the original cartilage skeleton, but also promotes ectopic cartilage formation in mice.
Fig 5. Augmented Pdgfra activity in epiblasts induces ectopic cartilage formation.
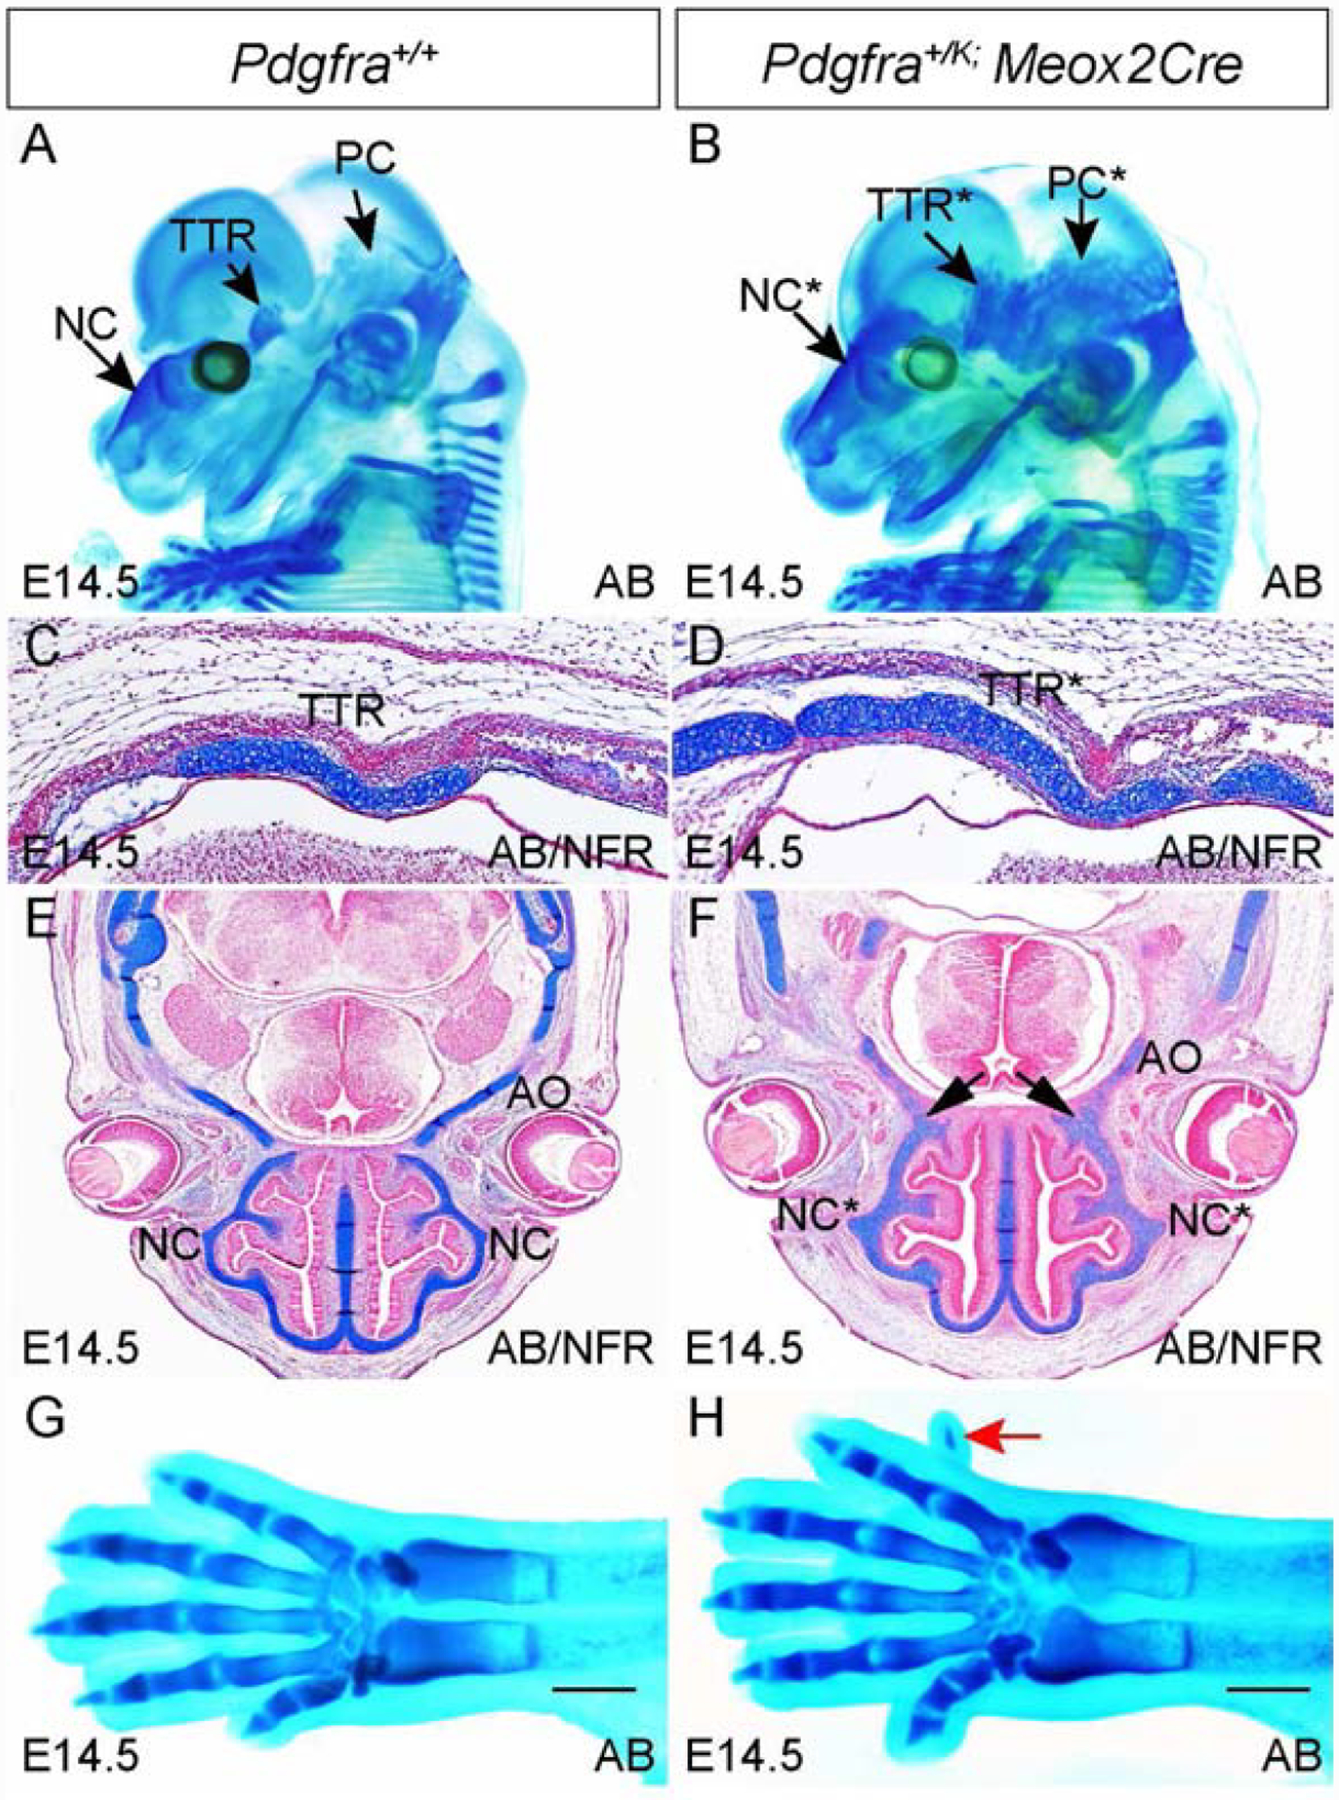
(A, B) Whole mount alcian blue staining of Pdgfra+/+(A) and Pdgfra+/K;Meox2Cre(B) embryos at E14.5. (C-F) Alcian blue staining on transverse sections at the level of TTR(C, D) and NC(E, F) of Pdgfra+/+(C, E) and Pdgfra+/K;Meox2Cre(D, F) embryos at E14.5. Arrows in F point to the fusion between NC and AO. (G, H) Dorsal view of alcian blue staining results of the forelimbs of Pdgfra+/+(G) and Pdgfra+/K;Meox2Cre(H) embryos. Red arrow points to extra digit in H. Scale bar= 1mm. AB, alcian blue; AO, ala
Pdgfra activation enhances chondrocyte progenitors formation in vitro
Chondrocyte development is initiated by multipotent mesenchymal progenitors differentiation, which is marked with Sox9 expression(Akiyama et al., 2002; Bi et al., 1999). These Sox9+ chondrocyte progenitors then differentiate into mature chondrocytes marked by Col2a1 expression. The phenotype of Pdgfra+/K;Meox2Cre embryos(Fig 5) indicates that Pdgfra activation might be implicated in one or multiple steps of this process. To delineate the mechanisms of ectopic cartilage formation with augmented Pdgfra activity, we have examined the impact of Pdgfra activation on eMSCs, chondrocyte progenitors, and chondrocytes, respectively.
First we examined whether Pdgfra activation directs mesenchymal stem cell differentiation towards chondrocyte progenitors. Previous studies show that Pdgfra expressing eMSCs emerge in mouse head from E13.5(Miwa and Era, 2018) and the craniofacial tissues are originated from neural crest and mesoderm(Jiang et al., 2002; McBratney-Owen et al., 2008; Yoshida et al., 2008). We asked what lineage the eMSCs arises from. To this end we have generated Wnt1Cre2;R26RtdT/+ or Mesp1Cre;R26RtdT/+ mice, in which the neural crest derived cells and mesoderm-derived cells are labeled with tdTomato, respectively(Lewis et al., 2013; Saga et al., 1999)(Fig 6A). Colony-forming unit(CFU) assay results using tdTomato+ cells sorted from E13.5 embryonic heads revealed that both neural crest derived cells and mesoderm derived cells are able to form colonies, and the colony number from distinct lineage is comparable(31.5±5.3 for each 5,000 neural crest cells and 29.5±4.4 for each 5,000 mesoderm cells; n=5 for each lineage)(Fig 6B). However, the ratio of multipotent colonies from the mesoderm(25%, 7/28) is significantly higher than that from the neural crest(4.2%, 1/24, p=0.038)(Fig 6C). These results indicate in E13.5 embryonic head, eMSCs arise predominantly from the mesoderm. We thus use mesoderm-derived eMSCs in the following experiments. To test the effect of Pdgfra activation on eMSCs differentiation, we have treated validated multipotent colonies with Pdgf-aa protein. Quantitative PCR(Q-PCR) data showed that expression of Sox9 and its downstream targets Col2a1 is significantly increased in 7 out of 8 colonies(Fig 6D), suggesting Pdgfra activation promotes chondrocyte progenitors formation by directing eMSCs differentiation.
Fig 6. Pdgfra activity promotes chondrocyte progenitor formation and proliferation.
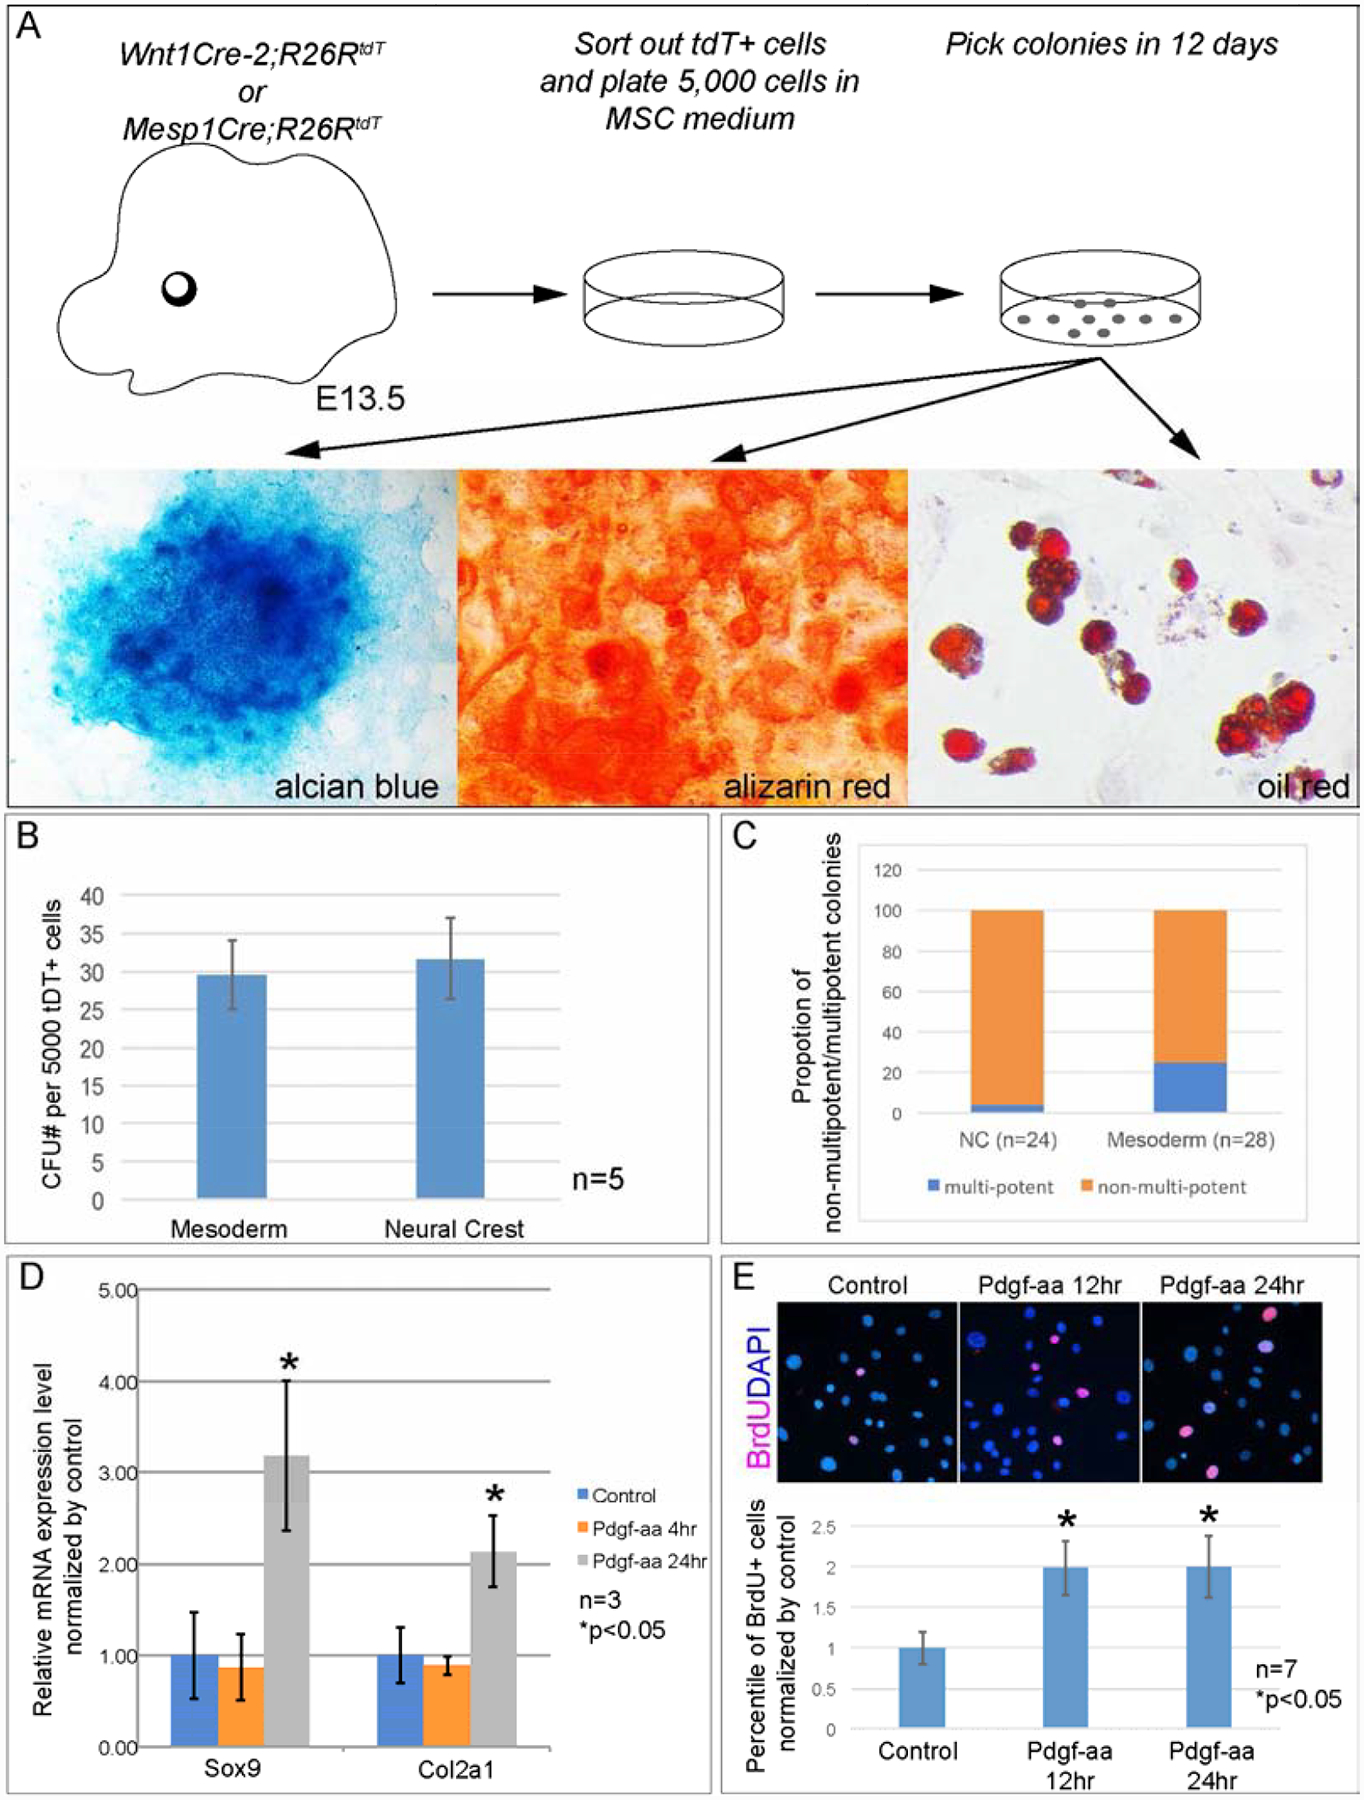
(A) Procedure of isolating and culturing eMSCs from distinct lineages of E13.5 embryonic heads. (B) Statistical analysis of CFU assay results of primary cells sorted from distinct lineages of E13.5 embryonic craniofacial cells. N=5. (C) Comparison of percentile of multipotent colonies from mesoderm and neural crest cells. (D) Q-PCR result of Sox9 and Col2a1 expression in representative eMSC colony isolated from mesoderm cells. N=3. (E) Statistical analysis of BrdU labeling assay in EGFP+ cells isolated from E12.5 Sox9+/IRES-EGFP embryos. P2 cells are treated with 10ng/ml Pdgf-aa for 12hr or 24hr. Percentile of BrdU+ cells are quantified and compared to untreated cells. N=7.
Next we examine the impact of Pdgfra activity on Sox9+ chondrocyte progenitors. To this end we have dissected embryonic heads from E12.5 Sox9+/IRES-EGFP embryos. Sox9+ cells were sorted using flow-cytometry for primary cell culture. BrdU labeling assay result shows that Pdgf-aa treatment increases proliferation rate of the chondrocyte progenitors(Fig 6E, n=6, p<0.01). Q-PCR data show expression level of Sox9 and Col2a1 remains comparable in the control and Pdgf-aa treated samples(Fig S2). These results indicate that Pdgfra activation promotes chondrocyte progenitors proliferation. Same assays have been carried out in Col2a1+ cells sorted from E13.5 Col2a1Cre;R26R+/tdT heads, and we did not detect significant change in cell proliferation rate in Pdgf-aa treated samples(Fig S3). These results indicate that Pdgfra does not promote cell proliferation in Col2a1+ mature chondrocytes, and Pdgfra might play distinct roles at different stages of chondrocyte development.
To test the impact of activating Pdgfra on chondrocranial development in vivo, we have crossed Pdgfra+/K allele with variant Cre lines, of which Wnt1Cre2 and Mesp1Cre drive Cre expression in chondrocyte progenitors from neural crest or mesoderm, and Col2a1Cre express Cre in mature chondrocytes. Since the chondrocranial cartilage formation in mice spans from E11-E16(McBratney-Owen et al., 2008), we have examined the chondrocranium phenotype at E13.5 and E15.5. First we confirmed activated Pdgfra signaling by immunostaining using anti-phospho-Pdgfra antibody(Fig S4) in TTR of each cohort. Whole-mount alcian blue staining data show that in wild-type embryos, NC and TTR are well demarcated from surrounding tissues, and PC is barely detected at E13.5 (Fig 7A, n=5). At the same stage, Pdgfra+/K;Wnt1Cre2 embryo exhibits an enlarged NC and apically elongated TTR(Fig 7B, n=3). Pdgfra+/K;Mesp1Cre embryo shows a NC comparable to the wild-type counterpart, while its TTR extends caudally(Fig 7C, n=5). At this stage, the NC and TTR of Pdgfra+/K;Col2a1Cre remain comparable to the wild-type control(Fig 7D, n=4). At E15.5, the NC, TTR and PC are well established and fused at brainbase in the wild-type embryos(Fig 7E, n=5), and the phenotypes in Pdgfra activation models become dramatic. In Pdgfra+/K;Wnt1Cre2 embryos, the NC has further extended dorsally and reached the forebrain region; and ectopic cartilages are observed between the enlarged TTR and PC, as well as along the coronal suture(red arrow heads in Fig 7F, n=3). In Pdgfra+/K;Mesp1Cre embryos, the NC remains comparable to the wild-type counterpart, while the TTR and PC expanded and are bridged at the dorsal region(Fig 7G, n=3). Compared to above models, Pdgfra+/K;Col2a1Cre embryos at E15.5 exhibit a much milder phenotype, although their TTR and NC are slightly enlarged compared to the control(Fig 7H, n=3). These data demonstrate that Pdgfra activation in progenitors causes more severe chondrocranial phenotype than in mature chondrocytes. This is in line with our in vitro assay results(Fig 6), and confirms that Pdgfra plays an important role at early stages of chondrocranial development.
Fig 7. Tissue-specific activation of Pdgfra in chondrocyte progenitors causes ectopic cartilage formation in developing chondrocranium.
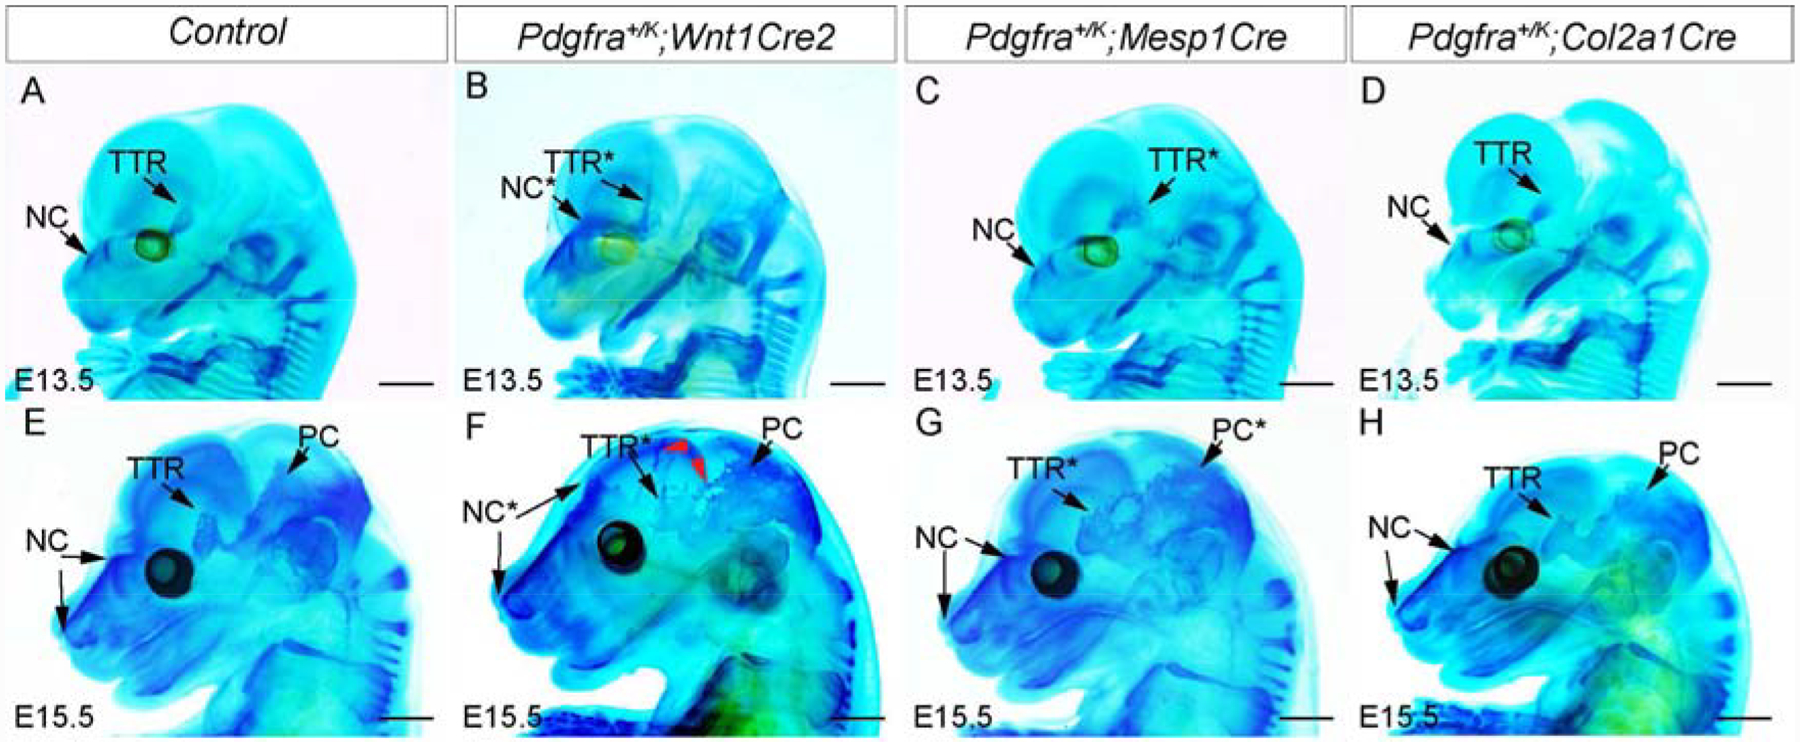
(A-H) Whole mount alcian blue staining of the wild-type littermate control(A, E), Pdgfra+/K;Wnt1Cre2(B, F), Pdgfra+/K;Mesp1Cre(C, G) and Pdgfra+/K;Col2a1Cre(D, H) at E13.5 and E15.5. The red arrowheads in F point to ectopic cartilages in Pdgfra+/K;Wnt1Cre2. Tissues with phenotype in mutant mice are marked with asterisks. NC, nasal cartilage; PB, parietal bone; PC, parietal cartilage; TTR, tectum transversum. Scale bar= 1 mm.
Wnt9a/beta-catenin signaling mediates Pdgfra regulation on TTR and PC development
Our previous study showed that Wnt9a and other regulators of Wnt signaling is enriched in Pdgfra transcriptional targets in mouse embryonic palatal mesenchymal cells(Vasudevan et al., 2015). Interestingly, Wnt signaling represses Sox9 transcription and chondrocytes formation(Akiyama et al., 2004; Goodnough et al., 2012). Wnt signaling is known to regulate cranial base development(Nagayama et al., 2008), and inactivating Wnt9a or Ctnnb1 causes ectopic cartilage formation in the calvaria(Goodnough et al., 2012; Spater et al., 2006) and resembles the phenotype of Pdgfra+/K;Mesp1Cre(Fig 7G). We thus asked whether Pdgfra regulates Wnt9a expression and Wnt signaling activity in mesoderm-derived chondrocytes. In situ hybridization results show that at E14.5, Wnt9a mRNA is detected in wild-type TTR and PC chondrocytes(Fig 8A, G), and its expression is downregulated in Pdgfra+/K;Mesp1Cre(Fig 8B, H). In the same tissues, the decreasing of Wnt9a expression is accompanied by increase of Sox9 and Col2a1 expression(Fig 8C–F, 8I–L). To identify the specific stage of Pdgfra in regulating Wnt9a and Sox9 expression, we have examined the alteration of their expression level in different lineages. Our q-PCR results show that in multiple eMSCs colonies, Pdgf-aa treatment represses Wnt9a expression and enhances Sox9 and Col2a1 expression, while augmentation of Wnt signaling activity by LiCl reversed the change of their expression(Fig 8M, 6 out of 7). At the same time, we did not detect significant change of Wnt9a or Sox9 expression either in Sox9+ or in Col2a1+ cells(data not shown). These results indicate that Wnt9a signaling acts downstream of Pdgfra specifically at the eMSCs stage, but not in chondrocyte progenitors or chondrocytes. Subsequently we tested whether the ectopic chondrocranial cartilage in Pdgfra+/K;Mesp1Cre could be corrected by manipulating Wnt signaling activity. Whole mount alcian blue staining results show that at E15.5, LiCl administration reduces cartilage formation in TTR of Pdgfra+/K;Mesp1Cre mice to 69.3%±18.9% of the TTR in non-treated animals(Fig 8N, p=0.045, n=7). These data demonstrated that Wnt signaling at least partially modulates Pdgfra regulation on chondrocranial cartilage formation in vivo.
Fig 8. Wnt9a/beta-catenin signaling mediates Pdgfra regulation on chondrocranium development in vivo.
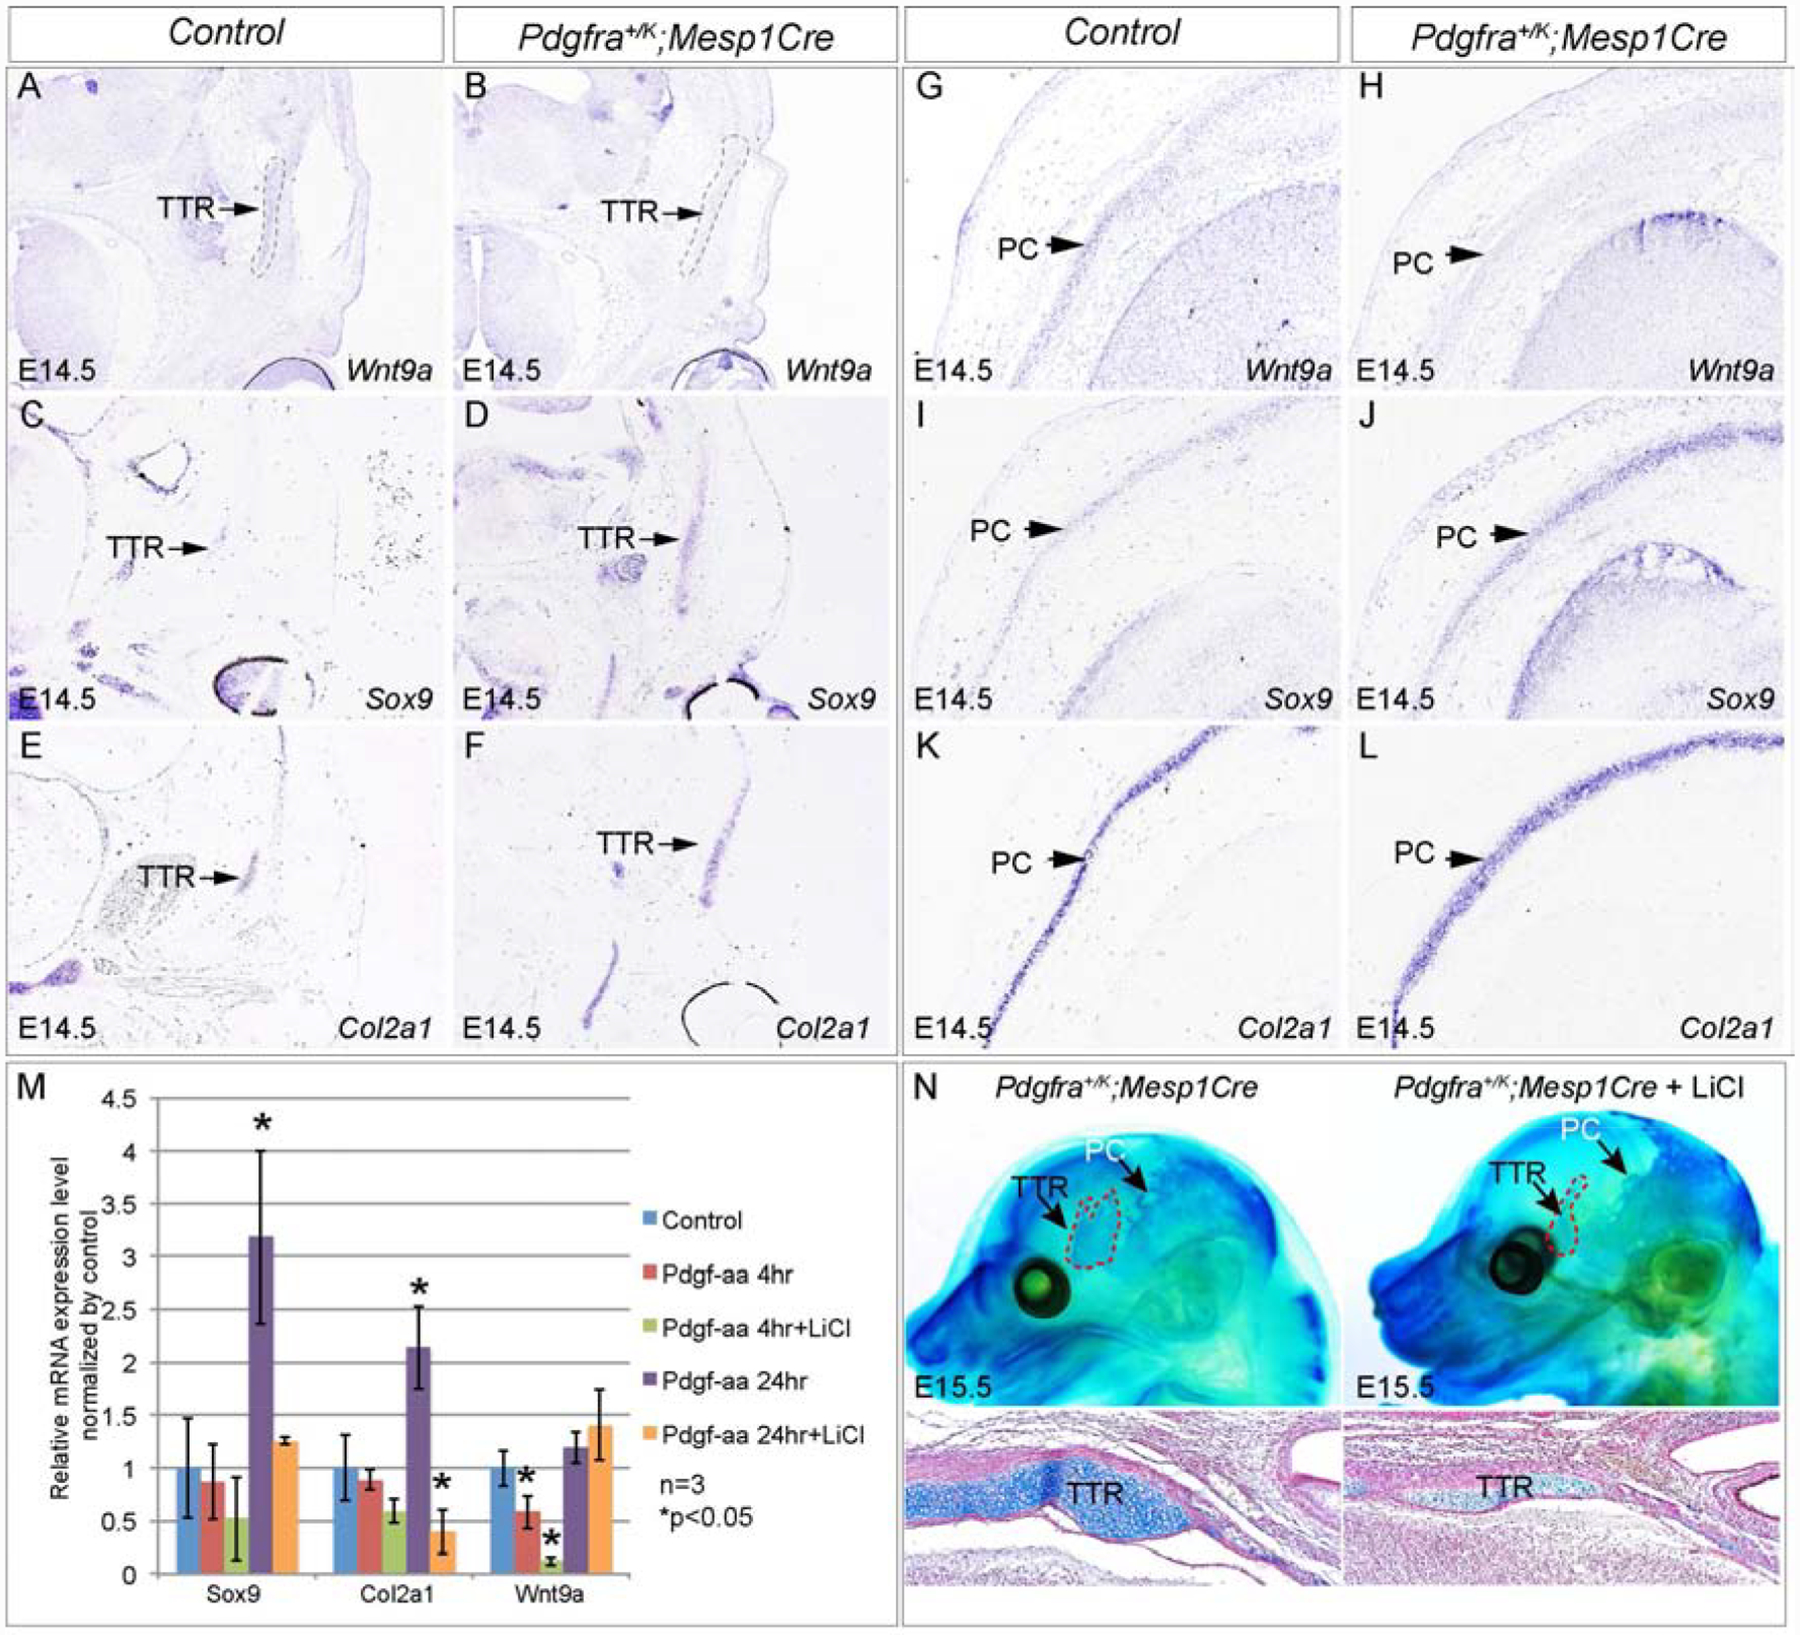
(A-L) In situ hybridization showing expression of Wnt9a(A, B, G, H), Sox9(C, D, I, J) and Col2a1(E, F, K, L), on transverse sections of the control littermate and Pdgfra+/K;Mesp1Cre embryos at the level of TTR(A-F) and at the level of PC(G-L), respectively. (M) Q-PCR result showing expression of Wnt9a, Sox9 and Col2a1 of a representative eMSC colony treated with Pdgf-aa and LiCl for 4 hours and 24 hours. N=3; asterisk, p<0.05. (N) Whole mount alcian blue staining of Pdgfra+/K;Mesp1Cre and Pdgfra+/K;Mesp1Cre treated with LiCl at E15.5. N=7. Red arrows point to reduction of cartilage formation in LiCl treated embryos. PC, parietal cartilage; TTR, tectum transversum.
Discussion
The chondrocranium is essential for normal craniofacial development, but the mechanisms regulating its formation remains largely unknown. In this study, we have identified that Pdgfra as a novel player of this process and a well-tuned Pdgfra activity level is critical for chondrocranial cartilage formation. Our study has further revealed that Pdgfra is critical for the early stages of this process, by directing eMSCs differentiation towards chondrocyte progenitors and promoting their proliferation. This notion is confirmed by animal models with tissue-specific manipulation of Pdgfra activity in different cell types. In addition, we demonstrated that Pdgfra represses Wnt9a transcription in eMSCs of the developing chondrocranium, and manipulating Wnt/beta-catenin signaling partially rescue the ectopic cartilage caused by excessive Pdgfra activity. Our data thus indicate that Pdgfra regulates chondrocranial development via modulating Wnt/beta-catenin signaling pathway.
There are very few studies focusing on the chondrocranial development. Of these Wnt signaling pathway has been shown critical to regulate chondrocyte progenitor gene Sox9 transcription and chondrocytes formation(Akiyama et al., 2002; Goodnough et al., 2012). Wnt9a deficiency causes ectopic cartilage formation in the developing calvaria(Spater et al., 2006). Tissue-specific inactivation of beta-catenin leads to more severe phenotype, with ectopic cartilage formation at cost of the calvarial osteoblasts(Goodnough et al., 2012). It has been shown in the cranial mesenchymal progenitors that beta-catenin regulates Twist1 transcription, which in turn bind to Sox9 promoter and repress its expression(Goodnough et al., 2012). However, it remains unclear how Wnt signaling is regulated in this process. Our data reveals that Pdgfra represses Wnt9a transcription, and activating Wnt signaling partially rescue the ectopic cartilage caused by excessive Pdgfra activity(Fig 8). We also examined Wnt9a expression in Pdgfra deficient model using in situ hybridization. Our data show that Wnt9a expression is comparable in the control and PdgfraGFP/GFP TTR(Fig S5), suggesting that Wnt9a expression is also regulated by other factors than Pdgfra. While increased Pdgfra activity inhibits Wnt9a expression, Pdgfra deficiency itself is not sufficient to increase Wnt9a expression and Wnt signaling activity. Our data further showed the Pdgfra/Wnt9a regulation in the eMSCs, but not in Sox9+ or Col2a1+ cells. These data indicate that Pdgfra lies upstream of Wnt9a signaling at very early stage of chondrocranial development.
Signaling crosstalk has been widely implicated during embryogenesis. Since Bmp signaling has been shown in nasal cartilage development(Hayano et al., 2015), we examined Bmp signaling activity in Pdgfra deficient sample. Our immunostaining data using anti-phospho-Smad1/5/9 show that Bmp signaling is decreased in PdgfraGFP/GFP nasal septum(data not shown). Pdgfra is a transmembrane receptor that belongs to a large family of typical receptor tyrosine kinases(RTKs). Pdgfra and other RTKs Fgfr1 and Fgfr2 share multiple downstream intracellular signaling pathways, and they are all critical for midfacial development(Brewer et al., 2015; He and Soriano, 2013; Rice et al., 2004; Soriano, 1997; Tallquist and Soriano, 2003). At the same time, excessive activity of Fgfr2 or Pdgfra both causes craniosynostosis in mice(He and Soriano, 2017; Holmes et al., 2009; Wang et al., 2005). These studies suggest Pdgfra and Fgfr2 might share similar mechanisms in regulating craniofacial development. Specifically on the context of chondrocranium, expression of Fgfr2S252W, a constitutive active mutant of Fgfr2, causes expansion of nasal cartilage and ectopic cartilage in the calvarium(Holmes and Basilico, 2012; Holmes et al., 2018). Our data show that augmented Pdgfra activity causes similar phenotype(Fig 5, 7), but to a more severe extent compared to those in Fgfr2 mutant. It has been shown Fgfr2 boosts Sox9 expression via MAPK signaling pathway in chondrocytes(Murakami et al., 2000). It would be interesting to investigate whether Fgfr2 also modulates Wnt signaling, or whether Pdgfra also acts via MAPK signaling in regulating Sox9 transcription in these cells.
Pdgfra has been a recognized marker gene of mesenchymal stem cells in adult tissues as its expression usually couples with other genes like Sca1 in multipotent cells, and Pdgfra expressing cells are located in stem cell niche(Farahani and Xaymardan, 2015). Does Pdgfra expression also mark pluripotent cells in developing embryos? A recent study showed that isolated Pdgfra+ cells from mouse embryos exhibit mesenchymal stem cell properties, including capacity of forming colonies and of differentiating into multiple cell types(Miwa and Era, 2018). It is also found that in embryonic head, Pdgfra+ cells start to form colonies. In the present work, our data show primary cells isolated from E13.5 embryonic head are positive for CFU assay as well. Our data further revealed that the cells from mesoderm or neural crest forms comparable number of colonies in CFU assay(Fig 6B). However, the capacity of these colonies to differentiate multiple lineages seems lineage-dependent, with 25% from mesoderm but only 6% from neural crest cells(Fig 6C). This discrepancy indicates that most mesenchymal stem cells are from mesoderm at this stage, and neural crest-derived cells have lost their multipotency at this stage. These results also show that not all the colonies are able to differentiate into multiple cell types, suggesting that besides CFU assay, more comprehensive methods should be applied when evaluate the potential of MSCs.
Previous study tested the role of Pdgfra in bone marrow derived MSCs from adult mice, and found that Pdgfra activation promotes MSCs migration and osteogenic differentiation via Bmp-Smad1/5/8 signaling(Li et al., 2014). This result is different from our data showing Pdgfra activation promotes eMSCs differentiation towards chondrocytes progenitors(Fig 6). This is likely caused by the heterogeneous nature of MSCs. We found even in eMSCs, Pdgf-aa treatment induce Sox9 expression in most but not all of the colonies(6/7). This result is validated in our in vivo model ectopic cartilage formation in Pdgfra+/K;Meox2 mice(red arrow in Fig 5H) and in Pdgfra+/K;Wnt1Cre2 mice(red arrow heads in Fig 7F). In these models, the ectopic cartilages are not continuous with existing chondrocranial elements, indicate that Pdgfra activation has shifted the original fate of eMSCs and directs them towards chondrocytes.
Materials and methods
Animals
All animal experimentation was approved by the Institutional Animal Care and Use Committee of Tulane University. Pdgfratm11(EGFP)Sor(Hamilton et al., 2003), referred to as Pdgfra+/GFP in the text; Pdgfratm12Sor(Olson and Soriano, 2009), referred to as Pdgfra+/K; and Gt(ROSA)26Sortm9(CAG-tdTomato)Hze(Madisen et al., 2010), referred to as R26RtdT, were all maintained on a C57BL/6J background. All other strains, including Pdgfratm8Sor(Tallquist and Soriano, 2003), referred to as PDGFRα+/fl; Meox2tm1(cre)Sor(Tallquist and Soriano, 2000), referred to as Meox2Cre; Tg(Wnt1-cre)2Sor(Lewis et al., 2013), referred to as Wnt1Cre2, Mesp1tm2(cre)Ysa(Saga et al., 1999), referred to as Mesp1Cre; and Col2a1Cre(Sakai et al., 2001) were maintained on a C57BL/6J; 129SvJaeSor (MGI:3044540) mixed genetic background. For embryo collection, the mating females were checked daily and noon on the day when vaginal plug was found was defined as embryonic day (E) 0.5.
Alcian blue staining
Whole mount alcian blue staining was performed as previously(Nagy et al., 2009). Briefly, timed embryos were dissected in ice cold PBS then fixed in Bouin’s fixative for 2 hours at room temperature. Following multiple washes with 0.1% ammonium hydroxide in 70% ethanol solution for 24 hours, the samples were equilibrated in 5% acetic acid for two hours and then in methanol, respectively. The embryos were subsequently stained with 0.05% alcian blue in 5% acetic acid for 2 hours. After staining, embryos were washed in 5% acetic acid, cleared in methanol, and finally stored in BABB solution (benzyl alcohol:benzyl benzoate at a ratio of 1:2). For LiCl administration, pregnant females were injected with 30μl of 0.6mM LiCl by intraperitoneal(IP) injection daily from E8.5 until dissection. Embryos were collected and stained with alcian blue as described above.
For sections, sections were deparaffinized in Histo-clear followed by graded ethanol and incubated in 0.03% nitro-blue tetrazolium chloride (NBT) and 0.02% 5-bromo-4-chloro-3-indolyphosphate p-toluidine salt (BCIP) to detect AP activity. Slides were then rinsed in water and dipped in 1% alcian blue 8GX (Alpha Aesar, J60122) in 0.1N HCl, and counterstained with 0.1% Nuclear Fast Red(NFR) (Across Organics, 211980050).
BrdU labeling
For mouse embryos, BrdU/PBS solution was administered by IP injection into pregnant females at 5mg/100 g body weight. After 1 hour, embryos were dissected and fixed in 4% Paraformaldehyde (PFA) overnight at 4°C. Samples were dehydrated and embedded in paraffin. Immunostaining was performed on 12 μm transverse sections according to standard protocols using anti-BrdU antibody (1:500, DSHB). Sections were counterstained with Nuclear Fast Red (Across Organics, 211980050) and Alcian Blue (Alfa Aesar, J60122) to facilitate quantification.
For cells, BrdU labeling was carried out as previous described(Yang et al., 2018). Statistical analysis was performed on data collected from at least three independent experiments. Statistical data are presented as mean ± SEM, and subjected to double tailed Student’s t-tests.
In situ hybridization and immunohistochemistry
In situ hybridization was carried out as described previously(Yang et al., 2018). For immunohistochemistry, samples were sectioned at 12μm and subjected to standard protocols using anti-cleaved caspase3 antibody(1:500, Cell Signaling Technology 9664), anti-phospho-Pdgfra (Tyr754) antibody (1:200, Thermo Fisher Scientific, 441008G), anti-phospho-Smad1/5/9 (1:200, Cell Signaling Technology, 13820) and Alexa FluoR 448 donkey anti-rabbit IgG secondary antibody (1:300, Abcam ab150073).
Quantitative PCR
Expression of Sox9, Col2a1 and Wnt9a mRNA were analyzed by real-time quantitative RT-PCR. Total RNA was extracted using the RNeasy Plus Mini Kit (Qiagen, 74106). First strand cDNA was synthesized using 0.5 to 1 μg of total RNA, oligo-dT primers and iScript Reverse Transcriptase (Bio-Rad, 1708891). Quantitative PCR was performed on Bio-Rad iCycler using iQ SYBR Green Supermix (Bio-Rad, 1708882). The following protocol was used: step 1: 95°C for 10min; step 2: 95°C for 15 s; step 3: 60° C for 60 s; repeat to step 2 39× (40 cycles in total). PCR products were run on agarose gel to confirm correct amplicon size. The specific gene’s cycle threshold (Ct) values were normalized to the housekeeping gene beta-actin. The primers are as follows: mouse Sox9, 5′- GAGCACTCTGGGCAATCTCA-3′ and 5′-GCTCAGTTCACCGATGTCCA −3′; mouse Col2a1, 5′-CATCTTGCCGCATCTGTGTG −3′ and 5′-GGCCCTAATTTTCCACTGGC −3′; mouse Wnt9a, 5′-GCAGCAAGTTTGTCAAGGAGTTCC-3′ and 5′-GCAGGAGCCAGACACACCATG-3′; mouse β-actin, 5′-GCAAGTGCTTCTAGGCGGAC-3′ and 5′-AAGAAAGGGTGTAAAACGCAGC-3’.
Cell sorting, culture and Colony-forming unit (CFU) assays
Embryonic heads were dissected in in ice-cold PBS with removal of brain and mandible. The tissues were digested with 0.25% Trypsin-EDTA (Corning, 25–053-CI) to get single cell suspension. Cells were sorted by a Becton-Dickinson FACS Aria Fusion cell sorter and the tdTomato-positive cells were collected in MEM alpha medium supplemented with 20% Fetal Bovine Serum (FBS), 100 U/ml penicillin, 100 μg/ml streptomycin and 10 mM HEPES.
Sorted cells were cultured in full MEM alpha medium (MEM alpha supplemented with 10% FBS, 100 U/ml penicillin, 100 μg/ml streptomycin and 55 μM beta-mercaptoethanol) and incubated at 37 °C, 5% CO2 in a humidified incubator. Medium was changed every 3–4 days.
For CFU assays, sorted cells were seeded in 6-well plates at a density of 5000 cells/well. After 14 days, colonies were fixed with methanol for 10 min and stained with 0.5% crystal violet for 10 min for colony visualization and quantification.
Isolation of Embryonic mesenchymal stem cells (eMSCs) and trilineage differentiation
For isolating embryonic mesenchymal stem cells, freshly sorted cells were seeded in 10cm-dishes at a density of 500 cells/cm2 in full MEM alpha medium. After 14 days, individual colonies were collected by trypsinization with TrypLE Express reagent (Gibco, 12605–028) in cloning cylinders and expanded for the trilineage differentiation study. For adipogenic and osteogenic differentiation, cells were seeded in 24-well plates at 1 ×10⁴/well and cultured in MesenCult Adipogenic and Osteogenic differentiation medium (STEMCELL Technologies, 05507 and 05504), respectively for up to 10 days. To induce chondrogenic differentiation, 10 μl of cell suspension at a density of 2×10⁷/ml were dropped at the center of 24-well plates. 3 hours later, full MEM alpha medium was added. Cells were then cultured in MesenCult-ACF chondrogenic differentiation medium (STEMCELL Technologies, 05455) for up to 10 days.
Differentiated cells were fixed with 4% PFA and stained with 0.18% oil Red O, 2% Alizarin Red or 1% Alcian blue, respectively. Only the clones capable to differentiate into all three lineages were counted as eMSCs and used for further experiments.
Supplementary Material
Pdgfra is a novel regulator of chondrocranial development
Pdgfra directs eMSCs differentiation towards chondrocyte progenitor fate
Pdgfra regulates eMSCs differentiation via Wnt9a transcription and Wnt signaling
Alteration of Wnt signaling rescues ectopic cartilage caused by excessive Pdgfra activity during TTR development
Acknowledgments
We thank Emily Orsino, Gerrit Holleman, and Lauren Fidelak for their excellent genotyping work. We are grateful to our lab colleagues for their critical and constructive comments. We thank Dr. YiPing Chen for the gift of pSmad1/5/9 antibody.
Funding
This work was supported by NIH/National Institute of Dental and Craniofacial Research grants R00DE024617 and R01DE028918 to F.H.
Footnotes
Publisher's Disclaimer: This is a PDF file of an unedited manuscript that has been accepted for publication. As a service to our customers we are providing this early version of the manuscript. The manuscript will undergo copyediting, typesetting, and review of the resulting proof before it is published in its final form. Please note that during the production process errors may be discovered which could affect the content, and all legal disclaimers that apply to the journal pertain.
Competing interests
The authors declare no competing or financial interests.
References
- Akiyama H, Chaboissier MC, Martin JF, Schedl A and de Crombrugghe B (2002). The transcription factor Sox9 has essential roles in successive steps of the chondrocyte differentiation pathway and is required for expression of Sox5 and Sox6. Genes Dev. 16, 2813–2828. [DOI] [PMC free article] [PubMed] [Google Scholar]
- Akiyama H, Lyons JP, Mori-Akiyama Y, Yang X, Zhang R, Zhang Z, Deng JM, Taketo MM, Nakamura T, Behringer RR, et al. (2004). Interactions between Sox9 and beta-catenin control chondrocyte differentiation. Genes Dev. 18, 1072–1087. [DOI] [PMC free article] [PubMed] [Google Scholar]
- Bi W, Deng JM, Zhang Z, Behringer RR and de Crombrugghe B (1999). Sox9 is required for cartilage formation. Nat. Genet 22, 85–89. [DOI] [PubMed] [Google Scholar]
- Brewer JR, Molotkov A, Mazot P, Hoch RV and Soriano P (2015). Fgfr1 regulates development through the combinatorial use of signaling proteins. Genes Dev. 29, 1863–1874. [DOI] [PMC free article] [PubMed] [Google Scholar]
- Captier G, Leboucq N, Bigorre M, Canovas F, Bonnel F, Bonnafe A and Montoya P (2003). Plagiocephaly: morphometry of skull base asymmetry. Surg. Radiol. Anat 25, 226–233. [DOI] [PubMed] [Google Scholar]
- Ding H, Wu X, Bostrom H, Kim I, Wong N, Tsoi B, O’Rourke M, Koh GY, Soriano P and Betsholtz C (2004). A specific requirement for PDGF-C in palate formation and PDGFR-alpha signaling. Nat. Genet 36, 1111–1116. [DOI] [PubMed] [Google Scholar]
- Fantauzzo KA and Soriano P (2016). PDGFRbeta regulates craniofacial development through homodimers and functional heterodimers with PDGFRalpha. Genes Dev. 30, 2443–2458. [DOI] [PMC free article] [PubMed] [Google Scholar]
- Farahani RM and Xaymardan M (2015). Platelet-Derived Growth Factor Receptor Alpha as a Marker of Mesenchymal Stem Cells in Development and Stem Cell Biology. Stem cells international 2015, 362753–362753. [DOI] [PMC free article] [PubMed] [Google Scholar]
- Goodnough LH, Chang AT, Treloar C, Yang J, Scacheri PC and Atit RP (2012). Twist1 mediates repression of chondrogenesis by beta-catenin to promote cranial bone progenitor specification. Development 139, 4428–4438. [DOI] [PMC free article] [PubMed] [Google Scholar]
- Hamilton TG, Klinghoffer RA, Corrin PD and Soriano P (2003). Evolutionary Divergence of Platelet-Derived Growth Factor Alpha Receptor Signaling Mechanisms. Mol. Cell. Biol 23, 4013–4025. [DOI] [PMC free article] [PubMed] [Google Scholar]
- Hayano S, Komatsu Y, Pan H and Mishina Y (2015). Augmented BMP signaling in the neural crest inhibits nasal cartilage morphogenesis by inducing p53-mediated apoptosis. Development 142, 1357–1367. [DOI] [PMC free article] [PubMed] [Google Scholar]
- He F and Soriano P (2013). A critical role for PDGFRalpha signaling in medial nasal process development. PLoS Genet. 9, e1003851. [DOI] [PMC free article] [PubMed] [Google Scholar]
- He F and Soriano P (2017). Dysregulated PDGFRalpha signaling alters coronal suture morphogenesis and leads to craniosynostosis through endochondral ossification. Development 144, 4026–4036. [DOI] [PMC free article] [PubMed] [Google Scholar]
- Hill TP, Spater D, Taketo MM, Birchmeier W and Hartmann C (2005). Canonical Wnt/beta-catenin signaling prevents osteoblasts from differentiating into chondrocytes. Dev. Cell 8, 727–738. [DOI] [PubMed] [Google Scholar]
- Holmes G and Basilico C (2012). Mesodermal expression of Fgfr2S252W is necessary and sufficient to induce craniosynostosis in a mouse model of Apert syndrome. Dev. Biol 368, 283–293. [DOI] [PMC free article] [PubMed] [Google Scholar]
- Holmes G, Rothschild G, Roy UB, Deng CX, Mansukhani A and Basilico C (2009). Early onset of craniosynostosis in an Apert mouse model reveals critical features of this pathology. Dev. Biol 328, 273–284. [DOI] [PMC free article] [PubMed] [Google Scholar]
- Holmes G, Rourke C, Motch Perrine SM, Lu N, van Bakel H, Richtsmeier JT and Jabs EW (2018). Midface and upper airway dysgenesis in FGFR2-related craniosynostosis involves multiple tissue-specific and cell cycle effects. Development 145, dev166488. [DOI] [PMC free article] [PubMed] [Google Scholar]
- Jiang X, Iseki S, Maxson RE, Sucov HM and Morriss-Kay GM (2002). Tissue origins and interactions in the mammalian skull vault. Dev. Biol 241, 106–116. [DOI] [PubMed] [Google Scholar]
- Kawasaki K, Buchanan AV and Weiss KM (2009). Biomineralization in humans: making the hard choices in life. Annu. Rev. Genet 43, 119–142. [DOI] [PubMed] [Google Scholar]
- Kawasaki K and Richtsmeier JT (2017). Association of the Chondrocranium and Dermatocranium in Early Skull Formation. In Building Bones: Bone Formation and Development in Anthropology, pp. 52. [Google Scholar]
- Klinghoffer RA, Hamilton TG, Hoch R and Soriano P (2002). An Allelic Series at the PDGFalphaR Locus Indicates Unequal Contributions of Distinct Signaling Pathways During Development. Dev. Cell 2, 103–113. [DOI] [PubMed] [Google Scholar]
- Kreiborg S, Marsh JL, Cohen MM Jr., Liversage M, Pedersen H, Skovby F, Borgesen SE and Vannier MW (1993). Comparative three-dimensional analysis of CT-scans of the calvaria and cranial base in Apert and Crouzon syndromes. J. Craniomaxillofac. Surg 21, 181–188. [DOI] [PubMed] [Google Scholar]
- Lewis AE, Vasudevan HN, O’Neill AK, Soriano P and Bush JO (2013). The widely used Wnt1-Cre transgene causes developmental phenotypes by ectopic activation of Wnt signaling. Dev. Biol 379, 229–234. [DOI] [PMC free article] [PubMed] [Google Scholar]
- Li A, Xia X, Yeh J, Kua H, Liu H, Mishina Y, Hao A and Li B (2014). PDGFAA promotes osteogenic differentiation and migration of mesenchymal stem cell by down-regulating PDGFRalpha and derepressing BMP-Smad1/5/8 signaling. PLoS ONE 9, e113785. [DOI] [PMC free article] [PubMed] [Google Scholar]
- Madisen L, Zwingman TA, Sunkin SM, Oh SW, Zariwala HA, Gu H, Ng LL, Palmiter RD, Hawrylycz MJ, Jones AR, et al. (2010). A robust and high-throughput Cre reporting and characterization system for the whole mouse brain. Nat. Neurosci 13, 133–140. [DOI] [PMC free article] [PubMed] [Google Scholar]
- McBratney-Owen B, Iseki S, Bamforth SD, Olsen BR and Morriss-Kay GM (2008). Development and tissue origins of the mammalian cranial base. Dev. Biol 322, 121–132. [DOI] [PMC free article] [PubMed] [Google Scholar]
- Miwa H and Era T (2018). Tracing the destiny of mesenchymal stem cells from embryo to adult bone marrow and white adipose tissue via Pdgfralpha expression. Development 145. [DOI] [PubMed] [Google Scholar]
- Murakami S, Kan M, McKeehan WL and de Crombrugghe B (2000). Up-regulation of the chondrogenic Sox9 gene by fibroblast growth factors is mediated by the mitogen-activated protein kinase pathway. Proc. Natl. Acad. Sci. U. S. A 97, 1113–1118. [DOI] [PMC free article] [PubMed] [Google Scholar]
- Nagayama M, Iwamoto M, Hargett A, Kamiya N, Tamamura Y, Young B, Morrison T, Takeuchi H, Pacifici M, Enomoto-Iwamoto M, et al. (2008). Wnt/beta-catenin signaling regulates cranial base development and growth. J. Dent. Res 87, 244–249. [DOI] [PubMed] [Google Scholar]
- Nagy A, Gertsenstein M, Vintersten K and Behringer R (2009). Alcian Blue Staining of the Mouse Fetal Cartilaginous Skeleton. Cold Spring Harb. Protoc 2009, pdb.prot5169. [DOI] [PubMed] [Google Scholar]
- Olson LE and Soriano P (2009). Increased PDGFRalpha activation disrupts connective tissue development and drives systemic fibrosis. Dev. Cell 16, 303–313. [DOI] [PMC free article] [PubMed] [Google Scholar]
- Rice R, Spencer-Dene B, Connor EC, Gritli-Linde A, McMahon AP, Dickson C, Thesleff I and Rice DPC (2004). Disruption of Fgf10/Fgfr2b-coordinated epithelial-mesenchymal interactions causes cleft palate. J. Clin. Invest 113, 1692–1700. [DOI] [PMC free article] [PubMed] [Google Scholar]
- Saga Y, Miyagawa-Tomita S, Takagi A, Kitajima S, Miyazaki J and Inoue T (1999). MesP1 is expressed in the heart precursor cells and required for the formation of a single heart tube. Development 126, 3437–3447. [DOI] [PubMed] [Google Scholar]
- Sakai K, Hiripi L, Glumoff V, Brandau O, Eerola R, Vuorio E, Bosze Z, Fassler R and Aszodi A (2001). Stage-and tissue-specific expression of a Col2a1-Cre fusion gene in transgenic mice. Matrix Biol. 19, 761–767. [DOI] [PubMed] [Google Scholar]
- Soriano P (1997). The PDGF alpha receptor is required for neural crest cell development and for normal patterning of the somites. Development 124, 2691–2700. [DOI] [PubMed] [Google Scholar]
- Spater D, Hill TP, O’Sullivan RJ, Gruber M, Conner DA and Hartmann C (2006). Wnt9a signaling is required for joint integrity and regulation of Ihh during chondrogenesis. Development 133, 3039–3049. [DOI] [PubMed] [Google Scholar]
- Tallquist MD and Soriano P (2000). Epiblast-restricted Cre expression in MORE mice: a tool to distinguish embryonic vs. extra-embryonic gene function. Genesis 26, 113–115. [DOI] [PubMed] [Google Scholar]
- Tallquist MD and Soriano P (2003). Cell autonomous requirement for PDGFR in populations of cranial and cardiac neural crest cells. Development 130, 507–518. [DOI] [PubMed] [Google Scholar]
- Tokumaru AM, Barkovich AJ, Ciricillo SF and Edwards MS (1996). Skull base and calvarial deformities: association with intracranial changes in craniofacial syndromes. AJNR Am. J. Neuroradiol 17, 619–630. [PMC free article] [PubMed] [Google Scholar]
- Tran TH, Jarrell A, Zentner GE, Welsh A, Brownell I, Scacheri PC and Atit R (2010). Role of canonical Wnt signaling/ss-catenin via Dermo1 in cranial dermal cell development. Development 137, 3973–3984. [DOI] [PMC free article] [PubMed] [Google Scholar]
- Vasudevan HN, Mazot P, He F and Soriano P (2015). Receptor tyrosine kinases modulate distinct transcriptional programs by differential usage of intracellular pathways. Elife 4. [DOI] [PMC free article] [PubMed] [Google Scholar]
- Wang Y, Xiao R, Yang F, Karim BO, Iacovelli AJ, Cai J, Lerner CP, Richtsmeier JT, Leszl JM, Hill CA, et al. (2005). Abnormalities in cartilage and bone development in the Apert syndrome FGFR2(+/S252W) mouse. Development 132, 3537–3548. [DOI] [PubMed] [Google Scholar]
- Yang T, Moore M and He F (2018). Pten regulates neural crest proliferation and differentiation during mouse craniofacial development. Dev. Dyn 247, 304–314. [DOI] [PMC free article] [PubMed] [Google Scholar]
- Yoshida T, Vivatbutsiri P, Morriss-Kay G, Saga Y and Iseki S (2008). Cell lineage in mammalian craniofacial mesenchyme. Mech. Dev 125, 797–808. [DOI] [PubMed] [Google Scholar]
Associated Data
This section collects any data citations, data availability statements, or supplementary materials included in this article.