Abstract
Mercury (Hg) is a naturally occurring element that bonds with organic matter and, when converted to methylmercury, is a potent neurotoxicant. Here we estimate potential future releases of Hg from thawing permafrost for low and high greenhouse gas emissions scenarios using a mechanistic model. By 2200, the high emissions scenario shows annual permafrost Hg emissions to the atmosphere comparable to current global anthropogenic emissions. By 2100, simulated Hg concentrations in the Yukon River increase by 14% for the low emissions scenario, but double for the high emissions scenario. Fish Hg concentrations do not exceed United States Environmental Protection Agency guidelines for the low emissions scenario by 2300, but for the high emissions scenario, fish in the Yukon River exceed EPA guidelines by 2050. Our results indicate minimal impacts to Hg concentrations in water and fish for the low emissions scenario and high impacts for the high emissions scenario.
Subject terms: Biogeochemistry, Climate sciences, Ecology, Environmental sciences
Permafrost locks away the largest reservoir of mercury on the planet, but climate warming threatens to thaw these systems. Here the authors use models to show that unconstrained fossil fuel burning will dramatically increase the amount of mercury released into future ecosystems.
Introduction
Naturally occurring and anthropogenic Hg deposits on land from the atmosphere and bonds to receptor sites in plant organic matter1. Microbial decay eventually consumes the organic matter2, releasing the Hg. Permafrost is soil at or below 0 °C for at least two consecutive years and the active layer is the surface layer of soil above permafrost that thaws in summer and refreezes in winter. Sedimentation in permafrost regions has buried vegetation over thousands of years, freezing organic matter at the bottom of the active layer into permafrost3. Once frozen, microbial decay effectively ceases, locking the accumulated Hg into the permafrost. Based on soil measurements, permafrost regions store an estimated 1656 ± 962 Gg Hg in the top three meters of soil, of which 793 ± 461 Gg Hg are frozen in permafrost1. Observations indicate accelerated permafrost thaw over the past 30–40 years4,5. Model projections estimate a 30–99% reduction in northern hemisphere permafrost extent by 21006,7. When permafrost thaws, microbial decay of the stored organic matter will resume and release Hg, but how much, where, and when remain unclear.
Atmospheric deposition is the dominant source of Hg to the terrestrial biosphere8,9. Because Hg bonds to organic matter, the terrestrial carbon cycle modulates the terrestrial Hg cycle. Hg has three uptake pathways: (1) bonding to soil organic matter8,10,11, (2) stomatal leaf uptake12,13, and (3) root absorption12,14. Once absorbed by plants, translocation by phloem assimilates Hg into leaves and wood12,13. The deposition of dead leaves, roots, and stems transfers additional Hg to the soil11,15.
Hg has four release pathways: (1) evasion into the atmosphere after microbial decay11, (2) leaf stomata transpiration14, (3) fire11, and (4) leaching into groundwater followed by eventual export by rivers into the oceans16. Microbial decay frees Hg from organic matter, but plants and soil organic matter reabsorb11 most of this liberated Hg. Whether leaves represent an Hg source or sink depends on the concentration gradient between the stomata and the atmosphere14. Fire consumes soil organic matter, emitting carbon dioxide and Hg into the atmosphere11. Once leached into water, bound to Dissolved Organic Carbon (DOC) and Particulate Organic Carbon (POC), Hg can methylate, entering the food chain and accumulating in various species, particularly fish8.
The biological and physical processes that control the carbon cycle also control the Hg cycle2,9,16. We added Hg to the Simple Biosphere/Carnegie-Ames-Stanford Approach (SiBCASA) terrestrial biogeochemistry model17 (Fig. 1, Methods). The model accounts for all uptake pathways of Hg except leaf stomatal uptake. The model includes soil evasion and leaching Hg release pathways, but not stomatal transpiration and fire. We ran simulations from 1901 to 2299 using Representative Concentration Pathways 4.5 and 8.5 (hereafter RCP45 and RCP85). RCP45 represents a scenario close to the global target of 2 °C warming above pre-industrial levels while RCP85 represents a high emissions scenario of unconstrained burning of fossil fuels. We initialize the simulated Hg to a depth of three meters using observed values1 and ran the model for five thousand years to reach steady state where Hg losses balance gains. In 1901, SiBCASA simulates a total of 1370 ± 770 Gg Hg for all soils in permafrost regions, of which 863 ± 485 Gg Hg is frozen in permafrost, matching observed values within uncertainty1. SiBCASA simulates 507 ± 284 Gg Hg in the active layer, which agrees within uncertainty with observed estimates18 of 408 Gg Hg. SiBCASA accounts for the fact that microbial decay in frozen soil becomes limited to thin water films around soil particles19. Previous models did not account for this, resulting in high microbial decay and low soil Hg in permafrost regions2. Of the Hg released during microbial decay, we assume 16% evades into the atmosphere as gaseous elemental Hg0 2, 1.5% is exported to rivers as the aqueous HgII cation16,20,21 and the remaining Hg is recycled back into plants and soil organic matter2. Based on observations, we assume 1% of HgII export methylates into the aqueous monomethyl mercury (MeHg)16. We estimate total Hg concentration in fish by multiplying the simulated MeHg by an empirical relationship of observed fish concentrations as a function of MeHg concentration in water (Supplementary Fig. 1).
Fig. 1. A schematic of our terrestrial mercury (Hg) model.
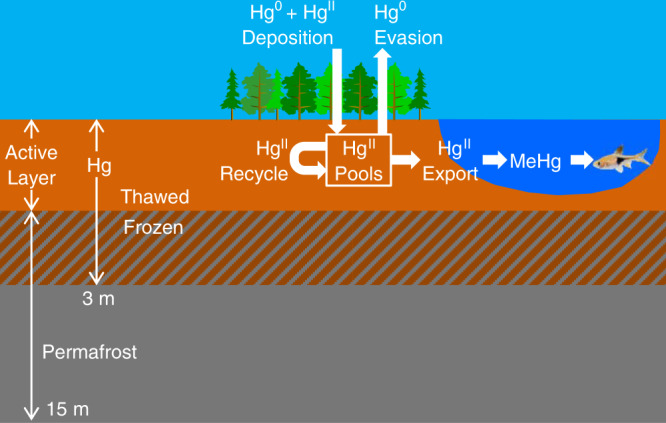
The soil extends down to 15 meters with an active layer that thaws in summer and refreezes in winter. The organic carbon and Hg extend down to three meters. Hg deposits onto the surface from the atmosphere and bonds to plant and soil organic matter. As organic matter decays, elemental mercury (Hg0) is released into the atmosphere, some mercury cation (HgII) is exported into rivers, and the remaining HgII is recycled back into the organic matter. We use empirical relationships to estimate methyl mercury (MeHg) concentrations in water from HgII export and total Hg concentrations in fish from MeHg concentrations.
We assume many processes remain constant that will likely change over time and space. For example, we assume constant atmospheric deposition of Hg0 to isolate the thawing permafrost signal, but changing anthropogenic and permafrost emissions will cause this to change over time. We assume constant Yukon River Basin (YRB) discharge, but warming temperatures and thawing permafrost will change the magnitude and timing of the seasonal water flow. We assume constant rates of DOC and POC leaching from soil, constant methylation rates, and steady accumulation of Hg in fish. However, large-scale permafrost thaw will change local hydrology, likely changing these rates22,23.
Here, we estimate potential future Hg releases from thawing permafrost for the circumpolar Arctic and impacts to Hg concentrations in water and fish in the YRB. We leverage a full-physics model of the terrestrial carbon cycle to simulate potential future changes in the terrestrial Hg cycle. We predict minimal Hg releases and small increases in Hg concentrations in water and fish for a low emissions scenario and large Hg releases and increases to Hg concentrations in water and fish for the high emissions scenario.
Results and discussion
Net Hg flux to the atmosphere
Our simulations indicate thawing permafrost will result in net Hg0 fluxes to the atmosphere from permafrost regions comparable to the current total global anthropogenic emissions by 2200 under RCP8524,25 (Fig. 2). The net Hg0 flux is the Hg0 evasion into the atmosphere minus Hg0 deposition from the atmosphere. The net Hg0 fluxes hover around zero during the 1900s, indicating a rough balance between Hg0 deposition and evasion. The permafrost begins to thaw after 1980 (Supplementary Fig. 2) and by 2000 the decay of previously frozen organic matter increases, along with net Hg0 fluxes. By 2300, 29% of the permafrost in the top three meters of soil thaws for RCP45 and 84% of permafrost thaws for RCP85. For RCP45, the net Hg0 flux increases to 0.5 ± 0.3 Gg Hg year−1 and permafrost regions become a weak source of Hg0 to the atmosphere. For RCP85, the permafrost regions become a strong source of Hg0 to the atmosphere, peaking at 1.9 ± 1.1 Gg Hg year−1, comparable to current global anthropogenic emissions8 of ~2 Gg Hg year−1. Most of the net Hg0 fluxes result from the decay of old, currently frozen organic matter, so Fig. 2 indicates an injection of pre-industrial Hg into the modern Hg cycle. By 2300, we estimate permafrost regions will contribute a cumulative total of 101 ± 57 Gg Hg for RCP45 and 428 ± 244 Gg Hg for RCP85 to the global Hg cycle (Supplementary Fig. 3).
Fig. 2. Annual net elemental mercury (Hg0) flux into the atmosphere.
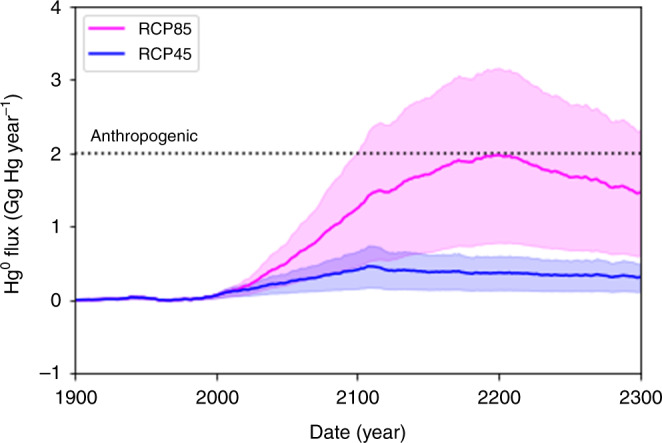
The net flux is Hg0 evasion into the atmosphere minus Hg0 deposition from the atmosphere, summed across all permafrost regions. The shaded areas represent uncertainty in the net Hg0 flux and the dashed line represents current global anthropogenic emissions.
Our model does not include atmospheric transport, so we cannot predict where and when Hg0 emitted from permafrost regions will redeposit onto the surface. The total, pan-Arctic net Hg0 flux for RCP85 appears consistent in magnitude with global total anthropogenic emissions. However, unlike point sources typical of anthropogenic Hg, we expect to see the net Hg0 flux distributed across the vast Arctic landscape. Although thawed, the organic matter will decay slowly with a characteristic time scale of 75 years due to wet soils and periodic refreezing26. Once the permafrost thaws and the decay of organic matter resumes, Hg0 release from permafrost regions will likely persist for centuries.
The vegetation and soil organic matter act as a buffer to slow Hg0 evasion. In our model, 82.5% of the Hg released due to microbial decay recycles back into the organic matter. This recycling explains why we see a 30-year lag between the start of large-scale permafrost thaw in the 1990s and the increase in Hg0 evasion after 2020. Continual Hg deposition onto the surface also partially compensates for losses due to microbial decay. SiBCASA accounts for the northward migration of the tree line and enhanced photosynthesis due to warmer temperatures, longer growing seasons, and higher atmospheric carbon dioxide concentrations. This increased photosynthesis compensates for the loss of soil organic matter in thawed permafrost, resulting in a relatively constant ratio of Hg to carbon in plants (Supplementary Fig. 4).
Spatial distribution of Hg losses
Projected Hg losses occur in areas with the greatest thaw and the largest amount of frozen carbon (Fig. 3). For RCP45, permafrost thaw occurred along the entire southern margin of permafrost regions in the discontinuous permafrost zone. However, the greatest Hg losses occur only in thawed areas with large amounts of frozen carbon, specifically the lower YRB near the delta and the upper Mackenzie basin in Canada. This estimate does not account for Hg losses in areas susceptible to thermokarst or soil collapse during thaw, which our model does not include27. RCP85 showed extensive thaw everywhere with small Hg losses in areas with little frozen carbon, such as the Brooks Range, and the largest Hg losses in areas with the most frozen carbon, like the North Slope, Alaska. The other major rivers in North America and Eurasia showed the same pattern of Hg losses in areas of greatest thaw and the largest amount of frozen carbon (Supplementary Fig. 5).
Fig. 3. Cumulative mercury (Hg) loss per area by 2300.
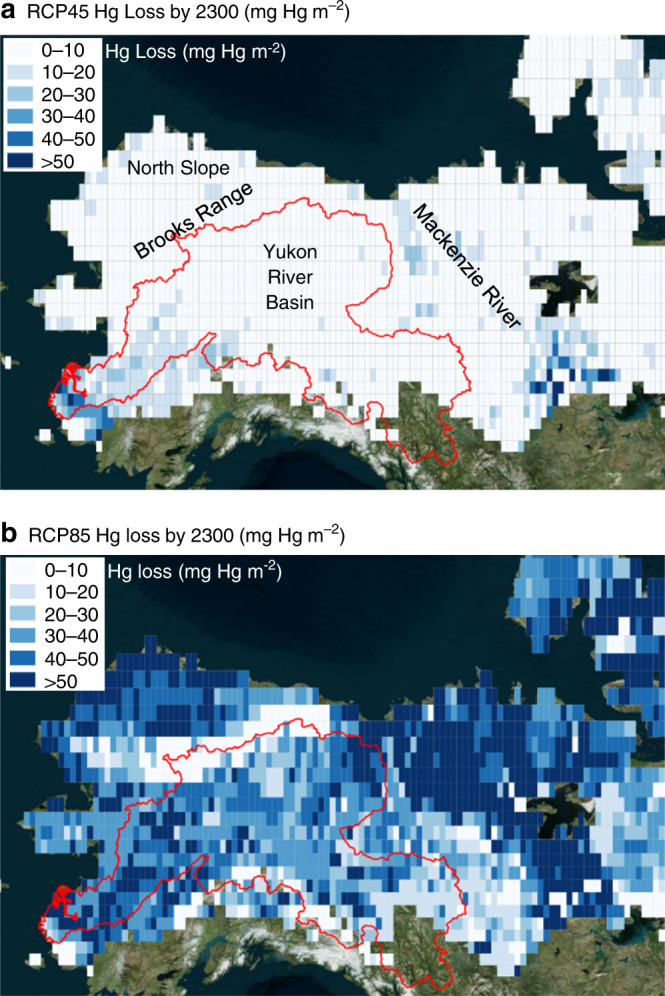
Total Hg loss is net elemental mercury (Hg0) flux to the atmosphere plus mercury cation (HgII) export by rivers summed from 1901 to 2300. The red outline indicates the spatial extent of the Yukon River Basin.
Export of Hg by the Yukon River
The simulated export of aqueous HgII in the YRB shows small increases for RCP45 and large increases for RCP85 (Fig. 4, Supplementary Fig. 6). In 2003, the simulated HgII export for the YRB is 4.8 ± 2.7 Mg Hg year−1 while the observed export derived from in situ measurements is 4.4 ± 0.7 Mg Hg year−1, indicating our model matches observations within uncertainty16. RCP45 shows relatively small increases in HgII export, consistent with permafrost thaw primarily in the lower Yukon near the delta. In contrast, RCP85 shows permafrost thaw throughout the YRB resulting in a doubling of HgII export by 2100 and a tripling by 2200.
Fig. 4. Mercury cation (HgII) export for the Yukon River Basin (YRB).
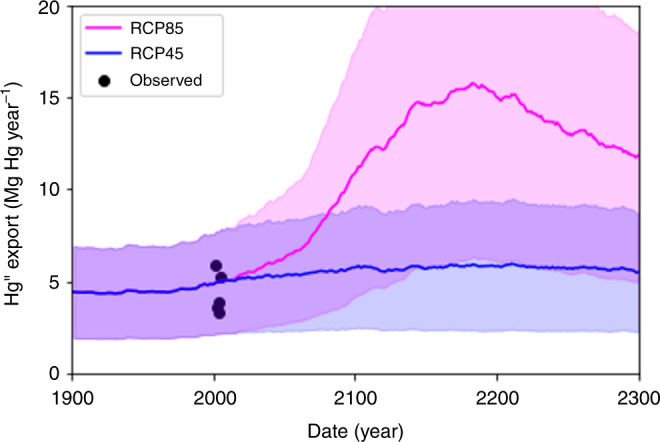
The annual riverine HgII export is the sum of HgII export across the YRB outlined in Fig. 3. The shaded areas represent uncertainty and the black dots indicate observed riverine export16.
Hg concentrations in the Yukon River
We compared simulated Hg concentrations in the Yukon River to the United States Environmental Protection Agency (EPA) former ambient water quality criterion28 of 12 ng Hg L−1 (Fig. 5). We see a minimum HgII concentration in winter when ice covers the river and a peak in spring when snowmelt increases discharge and HgII export. The HgII concentrations decrease by mid-summer to a relatively constant value and then further decrease in fall when the Yukon River begins to freeze over. In 2003, 85% of observed HgII concentrations in summer exceeded 12 ng Hg L−1 while we simulate nearly 100% exceedance. Nevertheless, the simulated HgII concentrations appear consistent with observed values16 (Supplementary Fig. 7).
Fig. 5. Mercury cation (HgII) concentrations in the Yukon River.
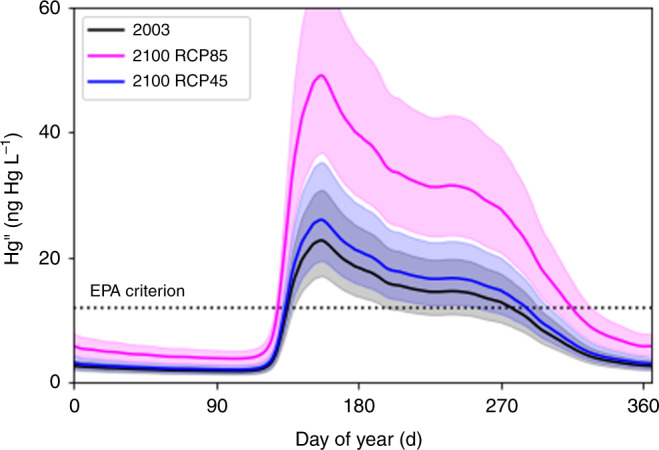
We calculated daily HgII concentrations at Pilot Station, Alaska on the Yukon River. The shaded areas represent uncertainties and the dashed line represents the former EPA ambient water quality criterion28 of 12 ng Hg L−1.
Warming due to climate change will increase Hg concentrations in the Yukon River, particularly for RCP85 (Fig. 5). We simulate large-scale thawing throughout the YRB along with the appearance of taliks or layers of unfrozen ground where microbial decay and associated HgII export can persist throughout winter. For RCP45, we simulate limited thawing in the YRB. HgII concentrations increase by 14% in 2100 compared to 2003, a change well within the 30% uncertainty of simulated values. In contrast, the HgII concentrations for RCP85 increase by 116% in 2100 compared to 2003, more than double 2003 values. For RCP45, the number of days per year that exceed 12 ng Hg L−1 increase from 132 days to 152 days by 2100 (Supplementary Fig. 8). RCP85 exceeds 12 ng Hg L−1 for 188 days per year. For RCP85, Hg concentrations peak around 2160 (not shown), with 208 days exceeding 12 ng Hg L−1.
Hg concentration in fish
Large-scale permafrost thaw may increase the concentration of Hg in fish (Fig. 6). We estimate the concentration of total Hg in fish (Hgfish) from simulated MeHg (Supplementary Figs. 1 and 9). The simulated Hgfish falls well within the expected range of observed values29,30. Hgfish varies among fish species and our estimates represent an average for all fish. For RCP45, the average Hgfish only increases by 21% by 2100 due to limited thawing in the YRB. However, for RCP85, Hgfish increases by 175% by 2100 and 222% by 2300. The EPA based its criterion of 0.3 g Hg g−1 wet weight on the reference dose for MeHg assuming average consumption rates31,32. For RCP45, Hgfish does not exceed 0.3 g Hg g−1 wet weight, but for RCP85, Hgfish exceeds 0.3 g Hg g−1 wet weight by 2150.
Fig. 6. Mercury (Hg) concentration in fish in the Yukon River.
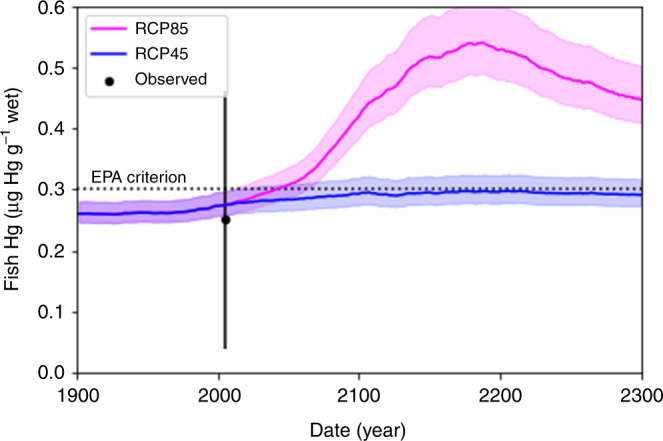
The shaded areas represent uncertainty in the simulated values and the dashed line represents the EPA criterion. The dot and vertical error bar shows the median and range of observed concentrations in fish29,30.
Summary
Our results indicate large impacts to Hg concentrations in water and fish in the YRB for the high emissions scenario and minimal impacts of Hg contamination for the low emissions scenario. The Hg0 annual, pan-Arctic flux to the atmosphere by 2100 for RCP85 is nearly double that of RCP45 and consistent in magnitude to current anthropogenic fluxes. RCP85 has twice the HgII peak riverine concentration and annual HgII export for the YRB in 2100 compared to RCP45. By 2100, RCP85 exceeds EPA water quality criterion for the entire spring, summer, and fall, while RCP45 shows no significant increase in Hg concentration in water. Our results indicate a modest or small increase in Hg concentrations in water and fish in permafrost regions under RCP45. However, for RCP85, the scenario of unconstrained burning of fossil fuels, our results indicate substantial increases in Hg concentrations in water and fish due to the release of Hg from thawing permafrost.
Methods
Model overview
We estimated Hg releases from permafrost regions using projections of the Simple Biosphere/Carnegie-Ames-Stanford Approach (SiBCASA) model. SiBCASA is a full-physics land surface parameterization with fully coupled carbon, water, and energy cycles17. SiBCASA has a full soil model with prognostic soil temperature and moisture with 25 layers extending down to 15 meters. The permafrost dynamics and soil biogeochemistry models account for (1) the effects of soil organic matter on soil properties, (2) wind compaction of snow, (3) frozen soil biogeochemistry, (4) a dynamic organic layer, and (5) liquid water content in frozen soils26,33–36.
Model pool structure
SiBCASA assumes vegetation growth, death, and microbial decay control Hg uptake and release from the terrestrial ecosystem2. We divide the carbon and Hg into 13 pools representing different vegetation and soil components, such as leaves or humus17. The flow of carbon from one pool to the next represents the life cycle of organic matter: photosynthesis produces starch, which plants use to grow leaves, roots, and wood. When the plants die, they produce litter and woody debris, which microbes consume to produce humus. Each time carbon and Hg transfers from one pool to another, some is lost as respiration of CO2 and evasion of Hg0 to the atmosphere. Each soil layer contains a complete set of carbon and Hg pools. SiBCASA accounts for the effects of soil temperature and moisture on microbial decay. In frozen soil and permafrost, SiBCASA limits microbial decay to thin water films surrounding soil particles35. Here, we report total Hg losses and gains summed over all pools and all layers within the soil column.
Simulated Hg pathways
We assume total atmospheric Hg deposition consists of 71% Hg0 and 29% HgII based on observations9. SiBCASA has two uptake pathways, bonding to soil organic matter and root absorption. We assume all Hg gets oxidized to HgII during uptake and evenly distribute the HgII between the two pathways. SiBCASA has two release pathways: aqueous export of HgII by rivers and evasion of Hg0 to the atmosphere after microbial decay. We assume HgII export to rivers results primarily from leaching of Dissolved Organic Carbon (DOC) and Particulate Organic Carbon (POC). We assume a DOC leaching fraction of total respiration of 1.5 × 10⁻³ g C g C−1 based on laboratory measurements and a POC to DOC ratio of 9:1 to get a total aqueous HgII export fraction of 1.5%16,20,21 or 1.5 × 10⁻² g HgII g Hg−1. After microbial decay, we assumed an atmospheric Hg0 evasion fraction of 16%2 or 0.16 g Hg0 g Hg−1. The remaining 82.5% of released Hg recycles back into the organic matter. We neglect Hg emissions due to fire and other potential Hg sources, such as glacial melt and leaching from bedrock.
We estimated HgII export for the Yukon River Basin (YRB) by summing HgII export for all pixels in the YRB and compared the result with observed values of HgII export16. We estimated an annual average Hg concentration in the Yukon River by dividing the annual export by the observed average discharge rate at Pilot Station, Alaska. We assumed daily Hg concentration is proportional to the discharge rate16 and used the median seasonal cycle in observed discharge rates measured at the Pilot Station gaging station37. We estimated methyl mercury (MeHg) concentrations using the observed ratio of 1%16 (Supplementary Fig. 9). We estimated fish Hg concentrations (Hgfish) by multiplying simulated MeHg by a regression of observed Hgfish to observed MeHg (Supplementary Fig. 1).
Uncertainty
We calculated uncertainty in all estimated parameters using Gaussian error propagation. We assumed independent errors and combined them in quadrature. The largest single source of uncertainty comes from the map of soil Hg used to initialize our model1. The next largest source of uncertainty comes from variability in predicted climate, represented as the standard deviation in simulated Hg fluxes for the five Coupled Model Intercomparison Project (CMIP5) simulations. The spread between models increased over time such that climate uncertainty varied from zero in the modern era to a peak of 37% after 2200. We calculated uncertainties for all regressions as the root mean square error (RMSE) of the residuals between the regression model and the original data. The RMSE varied between 5 and 15% for the various regression coefficients and model parameters, but these did not strongly contribute to overall uncertainty. The largest sources of uncertainty dominate overall uncertainty because we combine them in quadrature using Gaussian error propagation. The overall uncertainty varied from 30 to 60% and tended to increase over time, reflecting the increased uncertainty in climate. The largest, single source of uncertainty in these projections is the amount of soil Hg in permafrost regions.
Model simulations
We ran simulations from 1901 to 2299 with a spatial resolution of 0.5 × 0.5 degrees latitude and longitude for the permafrost domain using output from five models in the fifth CMIP5 for Representative Concentration Pathways (RCP) 4.5 and 8.5 (RCP45 and RCP85 in the main text). We initialized the Hg pools down to three meters depth with a map of permafrost Hg based on observations1 and spun up the model for 5000 years to steady state initial conditions in 1901 with randomly selected weather years between 1901 and 1910. Steady state initial conditions in 1901 assumes Hg0 and HgII deposition from the atmosphere balances Hg0 evasion and HgII export. The resulting Hg atmospheric deposition rate of 0.75 Gg Hg year−1 or 0.9 ng Hg m−2 h−1 appears consistent with observed values of 1.4 ± 1.0 ng Hg m−2 h−1 on the North Slope of Alaska9. The simulations start at steady state in 1901, but after 1901 the pools and simulated flux drift in response to climate. The magnitude and range of simulated Hg0 flux and HgII export appear consistent with observed values38 (Supplementary Figs. 10, 11, and 12).
Supplementary information
Acknowledgements
We thank Richard Webb for valuable help and technical advice. Funding came from the NASA grants NNX10AR63G, NNX06AE65G, NNX13AM25G, and NNX17AC59A; NOAA grant NA09OAR4310063; and NSF grants ARC 10901962, 1204167, and 1553171 and AGS 1900795. Funding came from the Next‐Generation Ecosystem Experiments (NGEE Arctic) project, supported by the Office of Biological and Environmental Research in the U.S. DOE Office of Science. The use of any trade, product, or firm names is for descriptive purposes only and does not imply endorsement by the U.S. Government.
Author contributions
K.S. wrote the paper and modified SiBCASA to include Hg. Y.E. and E.J. made the required model simulations. P.F.S. developed the original concept and collected most of the data used to parameterize the model. R.G.S. and K.P.W. provided analysis and measurements for model evaluation. E.M.S. provided analysis related to EPA criterion.
Data availability
This article includes all data generated or used during this study in its Supplementary Dataset files.
Competing interests
The authors declare no competing interests.
Footnotes
Peer review information Nature Communications thanks the anonymous reviewers for their contributions to the peer review of this work.
Publisher’s note Springer Nature remains neutral with regard to jurisdictional claims in published maps and institutional affiliations.
Supplementary information
Supplementary information is available for this paper at 10.1038/s41467-020-18398-5.
References
- 1.Schuster PF, et al. Permafrost stores a globally significant amount of mercury. Geophys. Res. Lett. 2018;45:1463–1471. doi: 10.1002/2017GL075571. [DOI] [Google Scholar]
- 2.Smith-Downey NV, Sunderland EM, Jacob DJ. Anthropogenic impacts on global storage and emissions of mercury from terrestrial soils: Insights from a new global model. J. Geophys. Res. 2010;115:G03008. doi: 10.1029/2009JG001124. [DOI] [Google Scholar]
- 3.Zimov, S. A. et al. Permafrost carbon: Stock and decomposability of a globally significant carbon pool. Geophys. Res. Lett. 33, 10.1029/2006GL027484 (2006).
- 4.Romanovsky V, Grosse G, Marchenko S. Past, present and future of permafrost in a changing world. Geo. Soc. Am. 2008;40:397. [Google Scholar]
- 5.Biskaborn, et al. Permafrost is warming at a global scale. Nat. Comm. 2019;10:264. doi: 10.1038/s41467-018-08240-4. [DOI] [PMC free article] [PubMed] [Google Scholar]
- 6.Koven CD, Riley WJ, Stern A. Analysis of permafrost thermal dynamics and response to climate change in the CMIP5 Earth System Models. J. Clim. 2013;V26:1887–1900. [Google Scholar]
- 7.McGuire AD, et al. Dependence of the evolution of carbon dynamics in the northern permafrost region on the trajectory of climate change. Proc. Natl Acad. Sci. USA. 2018;115/15:3882–3887. doi: 10.1073/pnas.1719903115. [DOI] [PMC free article] [PubMed] [Google Scholar]
- 8.Driscoll CT, Mason RP, Chan HM, Jacob DJ, Pirrone N. Mercury as a global pollutant: sources, pathways, and effects. Environ. Sci. Technol. 2013;47:4967–4983. doi: 10.1021/es305071v. [DOI] [PMC free article] [PubMed] [Google Scholar]
- 9.Obrist D, et al. Tundra uptake of atmospheric elemental mercury drives Arctic mercury pollution. Nature. 2017;547:201–204. doi: 10.1038/nature22997. [DOI] [PubMed] [Google Scholar]
- 10.Skyllberg U, Bloom PR, Qian J, Lin CM, Bleam WF. Complexation of mercury(II) in soil organic matter: EXAFS evidence for linear two-coordination with reduced sulfur groups. Environ. Sci. Technol. 2006;40:4174–4180. doi: 10.1021/es0600577. [DOI] [PubMed] [Google Scholar]
- 11.Giesler R, Clemmensen KE, Wardle DA, Klaminder J, Bindler R. Boreal forests sequester large amounts of mercury over millennial time scales in the absence of wildfire. Environ. Sci. Technol. 2017;51:2621–2627. doi: 10.1021/acs.est.6b06369. [DOI] [PubMed] [Google Scholar]
- 12.Arnold J, Gustin MS, Weisberg PJ. Evidence for nonstomatal uptake of Hg by Aspen and translocation of Hg from foliage to tree rings in Austrian pine. Environ. Sci. Technol. 2018;52:1174–1182. doi: 10.1021/acs.est.7b04468. [DOI] [PubMed] [Google Scholar]
- 13.Clackett SP, Porter TJ, Lehnherr I. 400-year record of atmospheric mercury from tree-rings in Northwestern Canada. Environ. Sci. Technol. 2018;52:9625–9633. doi: 10.1021/acs.est.8b01824. [DOI] [PubMed] [Google Scholar]
- 14.Lindberg SE, Hanson PJ, Meyers TP, Kim KH. Air/surface exchange of mercury vapor over forests - the need for a reassessment of continental biogenic emissions. Atm. Environ. 1998;32:895–908. doi: 10.1016/S1352-2310(97)00173-8. [DOI] [Google Scholar]
- 15.Jiskra M, et al. Mercury deposition and re-emission pathways in boreal forest soils investigated with Hg isotope signatures. Environ. Sci. Technol. 2015;49:7188–7196. doi: 10.1021/acs.est.5b00742. [DOI] [PubMed] [Google Scholar]
- 16.Schuster PF, et al. Mercury export from the Yukon River Basin and potential response to a changing climate. Environ. Sci. Technol. 2011;45:9262–9267. doi: 10.1021/es202068b. [DOI] [PubMed] [Google Scholar]
- 17.Schaefer K, et al. Combined Simple Biosphere/Carnegie-Ames-Stanford Approach terrestrial carbon cycle model. J. Geophys. Res. 2008;113:G03034. doi: 10.1029/2007JG000603. [DOI] [Google Scholar]
- 18.Olson C, Jiskra M, Biester H, Chow J, Obrist D. Mercury in active-layer Tundra soils of Alaska: concentrations, pools, origins, and spatial distribution. Glob. Biogeochemical Cycles. 2018;32:1058–1073. doi: 10.1029/2017GB005840. [DOI] [Google Scholar]
- 19.Mikan CJ, Schimel JP, Doyle AP. Temperature controls of microbial respiration in arctic tundra soils above and below freezing. Soil Biol. Biochem. 2002;34:1785–1795. doi: 10.1016/S0038-0717(02)00168-2. [DOI] [Google Scholar]
- 20.Wang Z, Roulet N. Comparison of plant litter and peat decomposition changes with permafrost thaw in a subarctic peatland. Plant Soil. 2017;417:197–216. doi: 10.1007/s11104-017-3252-7. [DOI] [Google Scholar]
- 21.Wickland KP, et al. Dissolved organic carbon and nitrogen release from boreal Holocene permafrost and seasonally frozen soils of Alaska. Environ. Res. Lett. 2018;13:065011. doi: 10.1088/1748-9326/aac4ad. [DOI] [Google Scholar]
- 22.Striegl RG, Aiken GR, Dornblaser MM, Raymond PA, Wickland KP. A decrease in discharge-normalized DOC export by the Yukon River during summer through autumn. Geophys. Res. Lett. 2005;32:L21413. doi: 10.1029/2005GL024413. [DOI] [Google Scholar]
- 23.Walvoord MA, Striegl RG. Increased groundwater to stream discharge from permafrost thawing in the Yukon River basin: potential impacts on lateral export of carbon and nitrogen. Geophys. Res. Lett. 2007;34:L12402. doi: 10.1029/2007GL030216. [DOI] [Google Scholar]
- 24.Holmes CD, et al. Global atmospheric model for mercury including oxidation by bromine atoms. Atmos. Chem. Phys. 2010;10:12037–12057. doi: 10.5194/acp-10-12037-2010. [DOI] [Google Scholar]
- 25.Pacyna JM, et al. Current and future levels of mercury atmospheric pollution on a global scale. Atmos. Chem. Phys. 2016;16:12495–12511. doi: 10.5194/acp-16-12495-2016. [DOI] [Google Scholar]
- 26.Schaefer, K., Zhang, T., Bruhwiler, L. & Barrett, A. P. Amount and timing of permafrost carbon release in response to climate warming. Tellus Series B Chem. Phys. Met.10.1111/j1600-0889201100527x (2011).
- 27.St Pierre KA, et al. Unprecedented increases in total and methyl mercury concentrations downstream of retrogressive thaw slumps in the western Canadian arctic. Environ. Sci. Technol. 2018;52:14099–14109. doi: 10.1021/acs.est.8b05348. [DOI] [PubMed] [Google Scholar]
- 28.EPA. Ambient water quality criteria for mercury. U.S. Environmental Protection Agency, 440/5-84-026 (https://www.epa.gov/sites/production/files/2019-03/documents/ambient-wqc-mercury-1984.pdf) (1984).
- 29.Brumbaugh, W. G., Krabbenhoft, D. P., Helsel, D. R., Wiener, J. G., & Echols, K. R. A national pilot study of mercury contamination of aquatic ecosystems along multiple gradients: bioaccumulation in fish, Biological Science Report. USGS/BRD/BSR-2001-0009 (2001).
- 30.Scudder E, et al. Optimizing fish sampling for fish-mercury bioaccumulation factors. Chemosphere. 2015;135:467–473. doi: 10.1016/j.chemosphere.2014.12.068. [DOI] [PubMed] [Google Scholar]
- 31.National Research Council. Toxicological effects of methylmercury.10.17226/9899 (The National Academies Press, Washington, DC, 2000). [PubMed]
- 32.Borum, D., Manibusan, M. K., Schoeny, R., Winchester, E. L. Water quality criterion for the protection of human health: methylmercury. EPA-823-R-01-001 (U.S. Environmental Protection Agency, Washington, DC 20460, 2001).
- 33.Schaefer K, et al. Improving simulated soil temperatures and soil freeze/thaw at high-latitude regions in the Simple Biosphere/Carnegie-Ames-Stanford Approach model. J. Geophys. Res. 2009;114:F02021. doi: 10.1029/2008JF001125. [DOI] [Google Scholar]
- 34.Schaefer K, Lantuit H, Romanovsky VE, Schuur EAG, Witt R. The impact of the permafrost carbon feedback on global climate. Env. Res. Lett. 2014;9:085003. doi: 10.1088/1748-9326/9/8/085003. [DOI] [Google Scholar]
- 35.Schaefer, K. & Jafarov, E. A parameterization of respiration in frozen soils based on substrate availability. Biogeosciences13, 1991–2001. www.biogeosciences.net/13/1991/2016/ (2016).
- 36.Jafarov E, Schaefer K. The importance of a surface organic layer in simulating permafrost thermal and carbon dynamics. Cryosphere. 2016;10:465–475. doi: 10.5194/tc-10-465-2016. [DOI] [Google Scholar]
- 37.USGS, United States Geological Survey. Data inventory page for site 15565447-Yukon River at Pilot Station, Alaska. U.S. Geological Survey, https://waterdata.usgs.gov/nwis/inventory/site_no=15565447 (2019).
- 38.Agnan Y, Le Dantec T, Moore CW, Edwards GC, Obrist D. New constraints on terrestrial surface atmosphere fluxes of gaseous elemental mercury using a global database. Environ. Sci. Technol. 2016;50:507–524. doi: 10.1021/acs.est.5b04013. [DOI] [PubMed] [Google Scholar]
Associated Data
This section collects any data citations, data availability statements, or supplementary materials included in this article.
Supplementary Materials
Data Availability Statement
This article includes all data generated or used during this study in its Supplementary Dataset files.


