

Abstract
Background:
Alterations in brain-gut-microbiome interactions have been implicated as an important factor in obesity. We aimed to explore the relationship between food addiction (FA) and the brain-gut-microbiome axis using a multi’omics approach involving microbiome data, metabolomics, and brain imaging.
Methods:
Brain MRI was obtained in 105 females. FA was defined using the Yale Food Addiction Scale. Fecal samples were collected for sequencing and metabolomics. Statistical analysis was done using multivariate analyses and machine learning algorithms.
Results:
Of the females with obesity, 33.3% exhibited FA as compared to 5.3% and 0.0% of overweight and normal BMI females, respectively (p=0.0001). Based on a multilevel sparse partial least square discriminant analysis, there was a difference in the gut microbiome of females with FA versus those without. Differential abundance testing showed Bacteroides, Megamonas, Eubacterium and Akkermansia were statistically associated with FA (q-value<0.05). Metabolomics showed that indolepropionic acid was inversely correlated to FA. FA was also correlated with increased connectivity within the brain’s reward network, specifically between the intraparietal sulcus, brain stem and putamen.
Conclusion:
This is the first study to examine food addiction along the brain-gut-microbiome axis and it supports the idea of targeting the brain-gut-microbiome axis for the treatment of FA and obesity.
Keywords: obesity, females, brain-gut microbiome interactions, 16S RNA, metabolomics, food addiction
INTRODUCTION
Obesity has reached global epidemic proportions and has become the leading preventable cause of death, both in the United States and worldwide. Current estimated global prevalence rates are as high as 500 million adults who are considered obese, and these numbers continue to rise dramatically.(1) Obesity is associated with many comorbidities including numerous cancers and musculoskeletal disorders, diabetes, and premature mortality from cardiovascular disease (CVD).(2) In addition to health detriments, economic and social consequences of obesity are compounding. In 2011, medical costs associated with treatment of preventable diseases associated with obesity were estimated to increase by $48–66 billion/year in the U.S. alone, with an estimated 65 million more adults to become obese by 2030.(3)
Food addiction (FA) is a potential driver of obesity where the hedonic aspect of ingestive behaviors overrides the homeostatic mechanisms.(4) Overeating and sedentary lifestyles result in a positive energy imbalance, leading to adipose tissue accumulation. According to the Diagnostic and Statistical Manual of Mental Disorders (DSM-IV), criteria for the diagnosis of substance addiction includes: 1) taking the substance in larger amounts than was intended, 2) inability to control its use, 3) taking the substance for a longer period of time than was intended, and 4) continued use despite adverse consequences.(5) For those that study FA, the Yale Food Addiction Scale (YFAS) has been developed and validated as a psychometrically sound measure to operationalize human cases of FA using the DSM-IV criteria for substance abuse.(4) While many believe that FA is a distinct entity from other behavioral eating disorders, the concept of food addiction is still a controversial issue even within the newest update of the DSM-V.(6)
Both obesity and FA can affect the connectivity of the brain. In several human cross-sectional studies, obesity has been shown to be significantly associated to alterations of the brain’s dopaminergic pathways in the brain’s reward system (i.e. striatum, prefrontal cortical regions and amygdala).(7) These alterations are associated with dysregulation of reward sensitivity, motivation, and impulse control associated with unregulated ingestive behaviors.(7) FA has been shown to be correlated with neural activation in key reward brain regions which are activated in other addiction disorders and contributes to increased cravings, reduced inhibitory control related to ingestive behaviors, and higher levels of obesity.(8) Recent evidence has shown that obesity with hedonic or disinhibited eating patterns is associated with increased dopaminergic and GABA signaling both in animal and human models of food addiction and obesity.(6)
The gut microbiome is also another area that is gaining recognition as a significant player in the etiology of many diseases as well as obesity. Research has shown that deviation from a core, lean gut microbiome profile is reflective of obesity.(9) In addition to reduced bacterial diversity, there is alteration in bacterial gene representation and phylum-level modifications.(9) Obesity-associated gut microbiomes also show altered pathways of food metabolism. Correlations between obesity pathophysiology and the gut microbiome have been observed through metagenomic and biochemical analyses, demonstrating that obese gut microbiomes absorb energy at higher efficiencies than lean gut microbiomes.(10) This superfluous harvesting of energy results in accumulation of body fat. Existing studies have focused on the effect of short chain fatty acids (SCFAs) on ingestive behavior in animal models.(11) However, given our current understanding of the gut microbiome and obesity, there are very few studies that have examined the relationship between the gut microbiome and its metabolites with ingestive behaviors in obesity, especially in humans. Among these very few studies, tryptophan metabolites have been most closely implicated in modulating brain-gut-microbiome interactions within this context.(12)
Given these relationships, we aimed to test the hypothesis that the role of microbial profiles and tryptophan metabolites were significantly associated with food addiction as well as key reward regions of the brain in females with high BMI.
METHODS
Subject population
The prevalence of FA differs by sex, with females with obesity having a higher prevalence (15–30%) than males with obesity (~5%).(6) Due to the higher prevalence of FA in females,(6) we focused our analysis to female subjects. The sample was comprised of 105 right-handed female subjects, between the age of 18–50 years old without significant medical or psychiatric conditions. Medical and psychiatric conditions were screened using a standardized screening sheet and a physical exam by a trained registered nurse. Subjects were excluded for the following reasons: pregnant or lactating, substance use disorder, abdominal surgery, tobacco dependence (half a pack or more daily), extreme strenuous exercise (>8h of continuous exercise per week), current or past psychiatric illness and major medical (including inflammatory bowel disease, active malignancy, organ failure, and diabetes) or neurological conditions (including Alzheimer’s disease, Parkinson’s disease, history of stroke, traumatic brain injury, or seizure disorder). Subjects taking medications that interfere with the central nervous system or regular use of analgesic drugs were excluded. Since female sex hormones such as estrogen are known to effect brain structure and function, we only included females who were premenopausal. Subjects with hypertension, diabetes, metabolic syndrome or eating disorders were excluded to minimize confounding effects. No subjects exceeded 400lbs due to magnetic resonance imaging scanning weight limits. Subjects were also excluded if they had been on antibiotics or probiotics with 3 months of recruitment.
Multimodal magnetic resonance brain imaging (MRI), anthropometrics (height, body weight, and waist-hip ratio measurements, body mass index), measures of appetite and FA, and stool samples for 16S ribosomal RNA gene sequencing and metabolomics were collected.
All procedures complied with the principles of the Declaration of Helsinki and were approved by the Institutional Review Board at our institution (IRB # 16–000187).
Food Addiction Questionnaire
FA was assessed using the Yale Food Addiction Scale (YFAS) questionnaire, a 25-item scale developed to assess food addiction by assessing signs of substance-dependence symptoms in eating behavior.(13) This scale is based upon the substance dependence criteria as found in the DSM-4 (e.g., tolerance [marked increase in amount; marked decrease in effect], withdrawal [agitation, anxiety, physical symptoms], and loss of control [eating to the point of feeling physical ill]).(13) The YFAS questionnaire is a 25-question survey that measures several aspects of FA behavior: food dependence, withdrawal, tolerance, continued use despite problems, time spent eating, loss of control, inability to cut down, and clinically significant impairment. Food addiction was defined as having a YFAS symptom count ≥3 with clinically significant impairment or distress. Clinically significant impairment or distress was defined as having a at least one positive response to the following two questions in the YFAS questionnaire: “My behavior with respect to food and eating causes significant distress” and “I experience significant problems in my ability to function effectively (daily routine, job/school, social activities, family activities, health difficulties) because of food and eating,” similar to previously published works.(6) The YFAS has displayed a good internal reliability (Kuder–Richardson α=0.86).(13)
Intestinal Microbial 16S rRNA Gene Sequencing
Stool was collected within 1 week of the patient’s brain MRI scan. All samples were stored at −80°C before 16S rRNA sequencing. DNA was extracted from frozen fecal samples using the PowerSoil DNA Isolation Kit (MO BIO Laboratories, Carlsbad, CA) with bead beating following the manufacturers protocol. The V4 hypervariable region of the 16S rRNA gene was amplified using the 515F and 806R primers. PCR products were purified by a commercial kit and sequenced on the Illumina HiSeq 2500 platform. The base pair reads were processed using QIIME v1.9.1 with default parameters. The taxonomic assignments of sequences were performed using closed reference operational taxonomic unit (OTU) picking in QIIME against the Greengenes database pre-clustered at 97% identity. OTUs were removed if they were present in less than 10% of samples.
Fecal metabolomics
Fecal samples were aliquoted under liquid nitrogen and shipped to Metabolon for processing and analysis as a single batch on their global metabolomics and bioinformatics platform. Data was curated by mass spectroscopy using established protocols and software as previously described. Because of our interest in the gut-brain axis in obesity, only tryptophan derived metabolites were examined.
Brain Magnetic Resonance Imaging
Whole brain structural and anatomical connectivity (diffusion tensor imaging; DTI) data was acquired using a 3.0T Siemens Prisma MRI scanner (Siemens, Erlangen, Germany). DTI measures the microscopic properties of white-matter and fiber track connectivity. Detailed information on the standardized acquisition protocols, quality control measures, and image preprocessing are provided in previously published studies.(14)
Acquisition:
Structural MRI.
High resolution T1-weighted images were acquired: echo time/ repetition time (TE/TR) =3.26ms/2200ms, field of view (FOV)=220×220mm slice thickness=1mm, 176 slices, 256×256 voxel matrices, and voxel size=0.86×0.86×1mm.
Diffusion-weighted MRI. Diffusion-weighted magnetic resonance imaging was acquired according to two comparable acquisition protocols, in either 61 or 64 noncolinear directions with b=1000 s mm−2, with 8 or 1 b=0 s mm−2 images respectively, TE/TR= =88ms/ TR=9500 ms, and FOV =256 mm with an acquisition matrix of 128×128, and a slice thickness of 2 mm, resulting in DTI data with 2mm isotropic resolution.
Quality Control and Preprocessing of images:
Structural images were included based on compliance with acquisition protocol, full brain coverage, minimal motion (Gibbs ringing), absence of flow/zipper, and minor atrophy/vascular degeneration. Preprocessing for quality control involved bias field correction, co-registration, motion correction, spatial normalization, tissue segmentation, Fourier transformation for frequency distribution, and specific quantitative checks for DTI images (apparent diffusion coefficient and fractional anisotropy [FA]) as previously described.(15) Preprocessing for diffusion-weighted imaging included visually checking for artifacts and motion on the raw diffusion weighted and b0 images, visual assessment of FA and mean diffusivity (MD) map quality, as well checking for physiologically feasible FA and MD values (FA of 0–0.1 and MD of 3–4 μm2/ms in ventricles, and FA of 0.6–0.9 and MD of 0.6–0.9 μm2/ms in splenium of corpus callosum). Maximum relative motion thresholds for translation and rotation for each direction (x, y, and z) were set at 2mm and 2°, respectively. No subjects presented with serious adverse imaging artifacts and no subjects exceeded motion thresholds.
Structural Image Parcellation and Anatomical Pairwise Network Construction:
T1-image segmentation and regional parcellation were conducted using FreeSurfer v.5.3.0(16, 17) following the nomenclature described in the Destrieux and Harvard-Oxford subcortical atlas.(18) This parcellation results in the labeling of 165 regions, 74 bilateral cortical structures, 7 subcortical structures, the midbrain, and the cerebellum.(19)
Regional parcellation and tractography results were combined to produce a weighted, undirected connectivity matrix. The final estimate of white matter connectivity between each of the brain regions was determined based on the number of fiber tracts intersecting each region. Weights of the connections were then expressed as the absolute fiber count divided by the individual volumes of the two interconnected regions.(20)
Brain Regions of Interest
Based on previous research,(14) regions of interest were restricted to core regions of the reward network (basal ganglia: caudate nucleus, globus pallidum, putamen, thalamus, nucleus accumbens (NAcc), amygdala, and brainstem [including the substantia nigra/SN and ventral tegmental area/VTA]), as these regions have been implicated in brain-gut axis alterations associated with obesity.(21)
Statistical Analysis
Baseline demographic characteristics differences were compared using student’s test for continuous variables and chi-squared test for categorical variables. Means are expressed with their respective standard deviation. Multilevel sparse partial least square linear discriminant analysis (sPLS-DA) was done to analyze microbiome data using the Mixomics package in R (http://www.R-project.org). sPLS-DA identifies OTUs that discriminated subjects with no FA from those with FA by simultaneously performing feature selection and modeling using lasso penalization. sPLS-DA operates using a supervised framework to find linear combinations of a limited set of variables, here OTUs, that predicts FA status, similar to prior published works.(22) Microbial alpha diversity (i.e. diversity within a sample) were calculated in QIIME using OTU-level data rarefied to 34,222 sequences. The significance of differences in alpha diversity metrics - Faith’s phylogenetic diversity (Faith’s PD), Chao1, and Shannon index - was calculated by analysis of variance. Association of microbial genera with or without FA were evaluated using DESeq2 in R, which employs an empirical Bayesian approach to shrink dispersion and fit non-rarified count data to a negative binomial model. P-values for differential abundance were converted to q-values to correct for multiple hypothesis testing (< 0.05 for significance). Metabolomics data were normalized and then fitted to a gaussian model with the limma package in R. Brain imaging data was compared between individuals without FA as compared to those with FA using a generalized linear model in R and p-values adjusted using false discover rate for multiple comparisons. Because obesity is closely related to FA, microbial analysis, metabolomics, and brain imaging analysis was all adjusted for obesity by doing subgroup analysis of obese patients with or without FA, and normal weight individual versus patients with obesity without FA. A BMI of <25 was considered normal, a BMI ≥ 30 as obese. To determine microbial associations with brain imaging data and metabolomics, significant variables were dichotomized based on their median values before being applied to DESEq2 in R.
Random Forest Classifier
A random forest classifier was created in R to identify obese subjects with FA using the randomForest package (https://cran.r-project.org/web/packages/randomForest) with 1001 trees and mtry=2. The number of trees were varied from 100 to 10,000 at intervals of 500, and 1000 trees were selected as the parameter as it minimized the out-of-bag estimate of error. An odd number was used to prevent theoretical ties that may occur from forest generation. Similarly, various mtry were selected and an mtry of 2 was used as it gave the highest area under the receiver operating curve (AUC). Features in the random forest classifier included OTUs that were significantly different by DESeq2 analysis and metabolites and brain imaging data that was statistically different in obese subjects with FA. The accuracy of the random forest classifier was estimated using a 5-fold cross-validation.
RESULTS
Patient Characteristics
105 female subjects were enrolled in the study. The average age was 32.4 years ± 10.2. Based on a YFAS symptom count of ≥3 with clinically significant impairment or distress, indicating the presence of FA, 19 subjects (18.1%) were identified with FA (Table 1). There was no statistical difference by age in subjects with FA as compared to those without FA. 89.5% (17/19) of the subjects with FA were obese as compared to 39.5% (34/86) of subjects without FA. The average BMI in subjects with FA was 35.6 ± 5.3 and the average BMI in subjects without FA was 29.1 ± 5.4 (p-value=0.0001). There were no statistical differences between subjects with FA or without FA in regards to race or ethnicity (p-value =0.55).
Table 1:
Baseline Characteristics by Food Addiction
| No Food Addiction (No FA) (n=86) | Food Addiction (FA) (n=19) | p-value | |
|---|---|---|---|
| Age (mean +/− SD) (yrs) | 33.19 ± 10.31 | 28.57 ± 8.66 | 0.07 |
| BMI (mean +/− SD) | 29.1 ± 5.4 | 35.6 ± 5.3 | 0.0001 |
| Normal Weight (n=16) % | 18.60 | 0.00 | 0.0001 |
| Overweight (n=38) % | 41.86 | 10.52 | |
| Obese (n=51) % | 39.53 | 89.47 | |
| YFAS Symptom Count (mean +/− SD) | 1.15 ± 0.77 | 3.63 ± 1.16 | <0.0001 |
| Race/Ethnicity | |||
| Hispanic (n=41) % | 36.05 | 52.63 | 0.55 |
| Caucasian (n=28) % | 23.26 | 42.11 | |
| African American (n=13) % | 12.79 | 10.53 | |
| Asian (n=21) % | 20.93 | 15.79 | |
| Other (n=2) % | 2.33 | 0 | |
SD: Standard deviation
Gut microbial signature as it relates to food addiction
There were no statistical differences in beta-diversity using Bray-Curtis dissimilarity between obese subjects with or without FA. There were also no statistical differences in any alpha diversity metrics between the microbial samples of obese subjects with FA as compared to those without FA (Supplemental Figure 1). However, there was a significant difference in alpha diversity metrics by race/ethnicity with Caucasians and African-Americans having higher diversity than Hispanics (Supplemental Figure 1). After adjusting for race/ethnicity there were no differences in subjects with a BMI of ≥25 to normal weight individuals by any alpha diversity metric. The taxonomic profiles of subjects with FA compared to subjects without FA on a phylum and genus level are summarized in Figure 1a and 1b, respectively. DESEq2 analysis of patients without FA identified 22 distinct OTUs that were associated with obesity as compared to normal weight individuals (Figure 1c). Six OTUs were negatively correlated and 16 OTUs were positively correlated to obesity. The four highest abundant OTUs belong to the genera Bacteroides, and Prevotella. The OTU with the greatest negative fold change was Akkermansia muciniphila. All DESEq2 outputs including fold changes are summarized in the Supplemental Tables. DESEq2 analysis of patients with obesity identified 15 OTUs that were associated with FA (Figure 1d). Ten OTUs were negatively associated with FA and 5 OTUs were positively associated with FA. The largest abundant OTU belonged to the genus Bacteroides, while the OTU with the largest positive fold change was Megamonas and the OTU with the largest negative fold change was Eubacterium biforme. Similarly to patients with obesity without FA as compared to normal weight patients, Akkermansia muciniphila was negatively associated with FA in patients with obesity.
Figure 1: Several taxa are associated with food addiction.
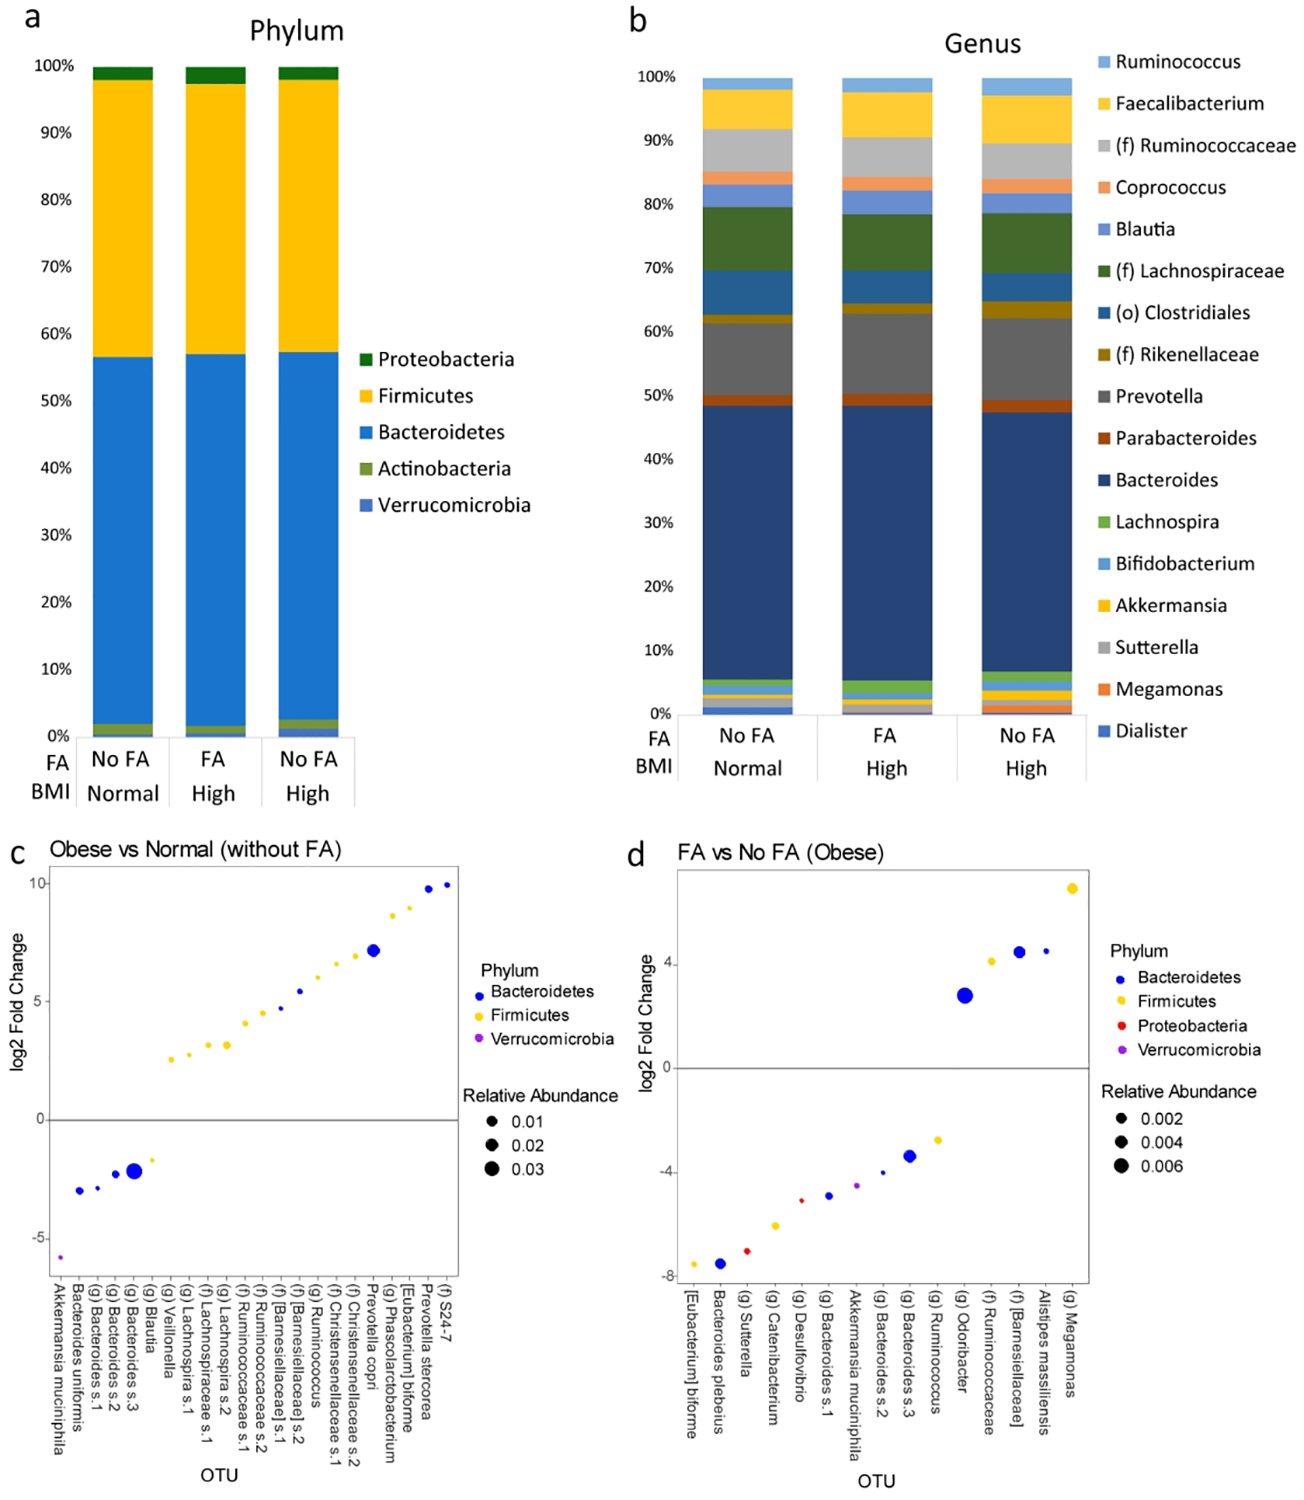
Taxonomic profiles between subjects with No Food Addiction (No FA) and Food Addiction (FA) on a (a) phylum and (b) genus level. Only taxa ≥ 1% relative abundance are shown. (c) DESEq2 analysis of patients without FA comparing those with obesity and those with normal BMI showing several OTUs associated with Obesity. (d) DESEq2 analysis of only patients with obesity showing several OTUs that are associated with FA.
Supervised learning methods were applied to identify a distinct microbial signature that differentiated between obese subjects and normal weight subjects without FA (Figure 2a and 2b) as well as obese subjects with or without FA (Figure 2c and 2d). Through the model, patients with normal BMIs were separated from patients with obesity by differences in OTUs belonging to such taxa as Bacteroides, Blautia, Lachnospiraceae, Ruminococcaceae, Roseburia, Faecalibacterium and Clostridium. In patients with obesity, over 30 different OTUs separated patients with FA from those without FA. Notable OTUs that distinguished patients without FA included Eubacterium biforme and Bacteroides. Streptococcus was the taxa with the largest contribution for obese subjects with FA.
Figure 2: A distinct microbial profile differentiates subjects with obesity and food addiction from those without.
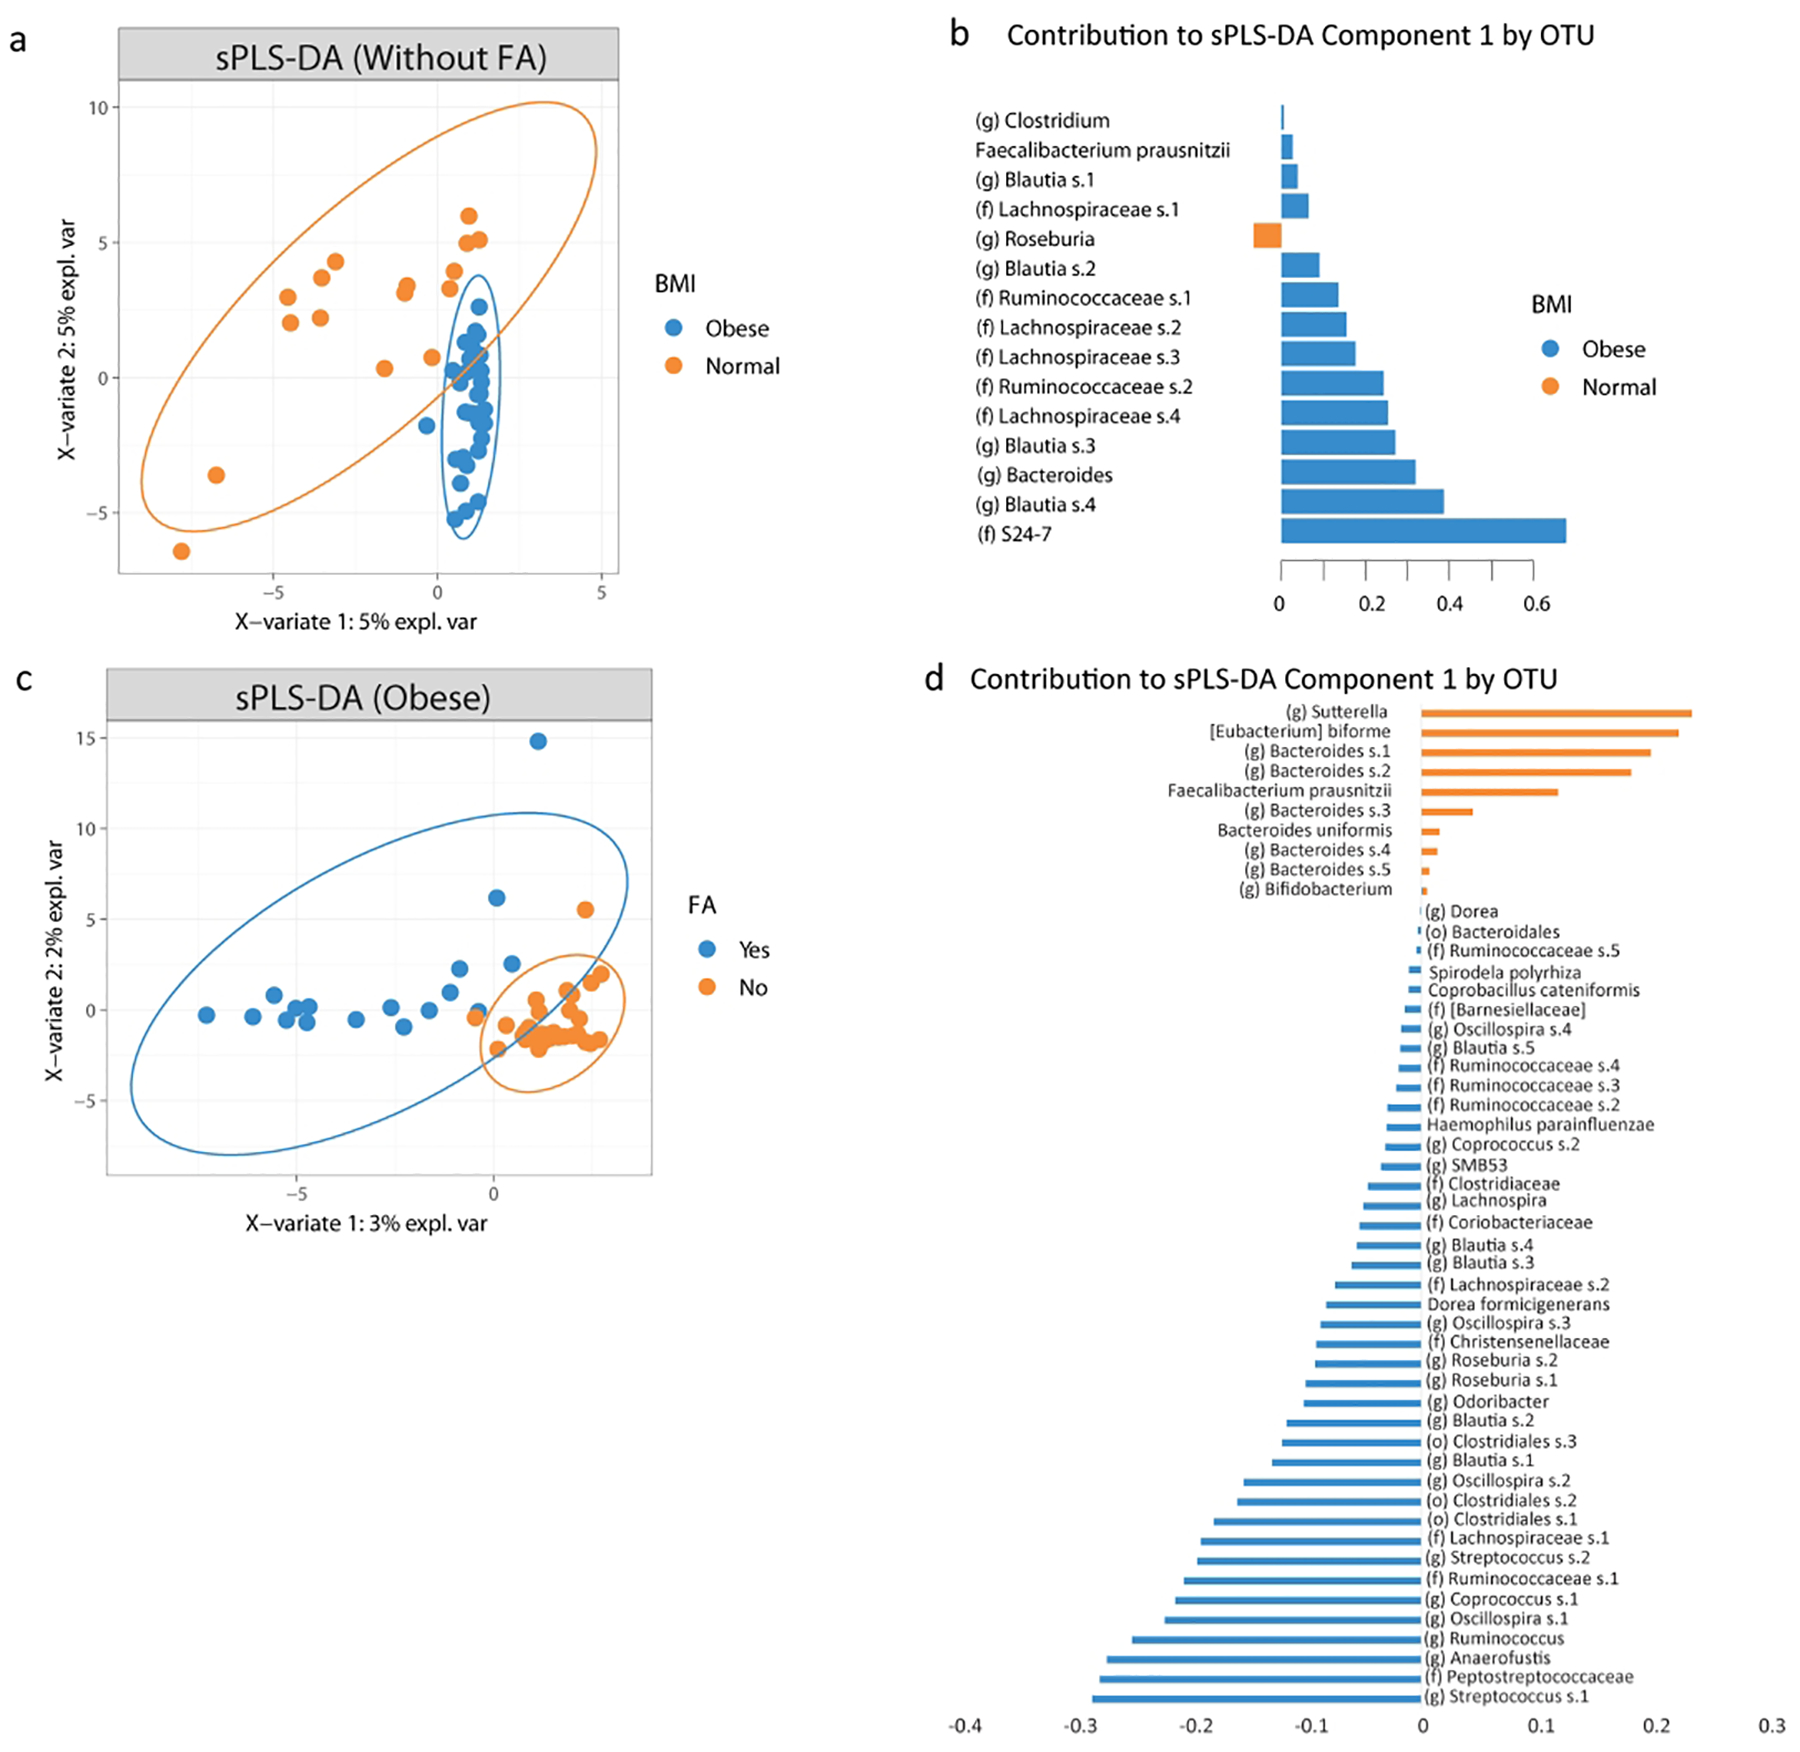
A) Plot of the partial least square discriminant analysis of the gut microbiome composition between subjects with obesity without food addiction versus those with normal BMI and without FA along with their 95% confidence ellipses and B) contributing OTUs to component 1. C) Plot of the partial least square discriminant analysis of the gut microbiome composition between obese subjects with food addiction versus those without FA along with their 95% confidence ellipses and D) contributing OTUs to component 1.
Brain reward networks and food addiction
DTI pairwise MRI showed greater anatomical connectivity between the putamen (a key reward region) and the brain stem (Cohen’s d =1.12, p.adj value= 0.0415) and intraparietal sulcus/transverse parietal sulcus (IntPS/TrPS) (Cohen’s d=0.89, p.adj value=0.002) in obese subjects with FA compared to those subjects without FA (Figure 3a, 3b, 3c). Using DESEq2 analysis and dichotomizing the brain imaging data based on their respective median values, 17 OTUs were associated with an increase communication between the brain stem and the putamen (Figure 3e). Similarly, 10 OTUs were associated with an increase communication between the putamen and the IntPS/TrPS (Figure 3f). The OTU belonging to the genus Megamonas was positively associated with increase connectivity in both of these brain regions. Conversely, OTUs that belonged to Bacteroides and Eubacterium were negatively associated with the connections of both of these brain regions. Akkermansia was also negatively associated with the connection between the putamen and the IntPS/TrPS but was not associated with the connection between the putamen and the brain stem. There were no significant differences in DTI pairwise MRI brain imaging of patients with obesity without FA as compared to normal weight individuals. There were also no significant differences when comparing obese and overweight patients without FA to normal weight individuals.
Figure 3: Brain imaging and Indolepropionate is associated with food addiction.
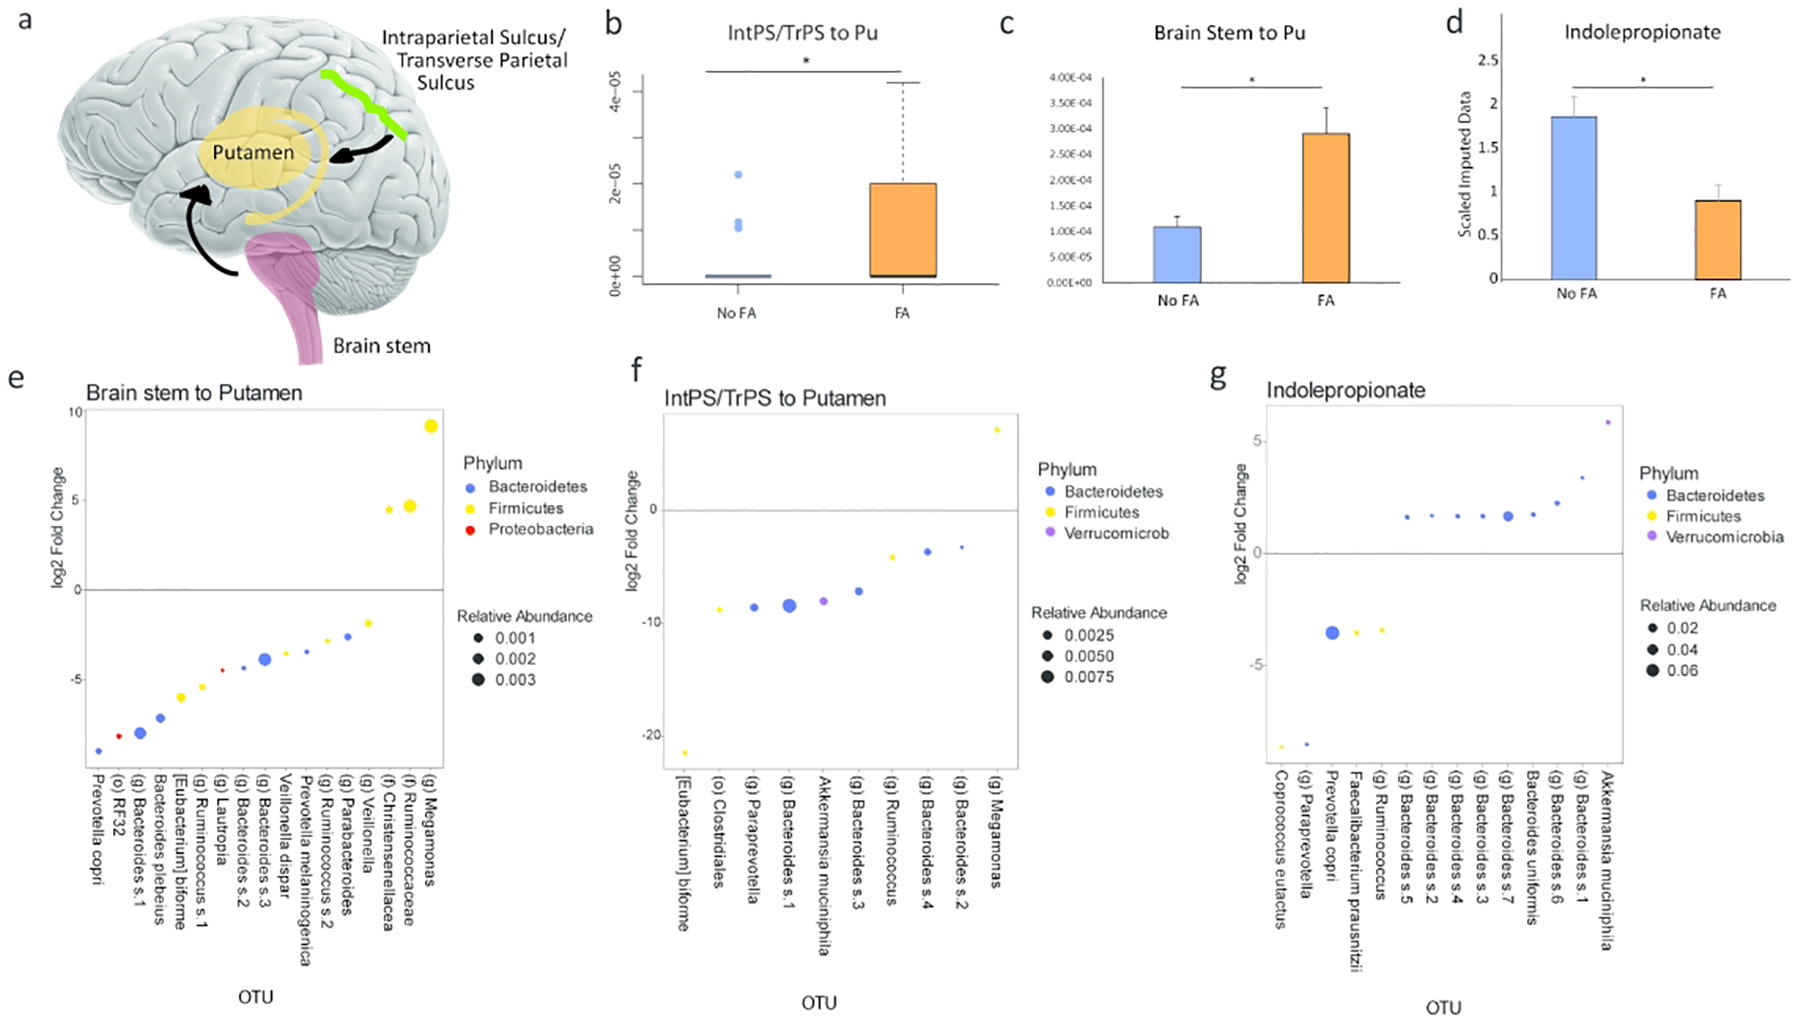
DTI pairwise showed that the communication between the intraparietal sulcus/transverse parietal (IntPS/TrPS) sulcus and brain stem to the putamen was positively associated with Food Addiction (FA) in patients with obesity. A) Schematic diagram of the significant brain region associated with food addiction and its quantification (B and C). D) Levels of fecal indolepropionate in obese subjects with or without food addiction (FA). E) DESEq2 analysis in obese subjects showing several OTUs associated with increase connectivity between the brain stem and the putamen. F) DESEq2 analysis in obese subjects showing several OTUs associated with increase connectivity between the IntPS/TrPS to the putamen. G) The OTUs that are correlated to fecal indolepropionate by DESEq2 in patients with obesity. IntPS/TrPS: intraparietal sulcus/transverse parietal sulcus. Pu: Putamen.
Indolepropionate is associated with food addiction
By analyzing fecal metabolites that were related to tryptophan metabolism, we found that indolepropionate was negatively associated with FA in patients with obesity (Cohen’s d, 0.74, p-value=0.045) (Figure 3d). The findings of all other tryptophan metabolites and their association with FA are summarized in Supplemental Table 5. By analyzing the level of indolepropionate with fecal microbiome data, we discovered 14 OTUs that were correlated with indolepropionate (Figure 3g). The highest abundant OTU that positively correlated to indolepropionate belonged to the genus Bacteroides. The highest abundant OTU that was negatively correlated to indolepropionate belonged to the genus Prevotella. All the OTUs that were positively associated with indolepropionate belonged to Akkermansia muciniphila and Bacteroides. There were no significant differences in fecal tryptophan metabolites of patients with obesity without FA as compared to normal weight individuals. There were also no significant differences in fecal metabolites when comparing obese and overweight patients without FA to normal weight individuals.
Random forest classifier based on brain imaging, fecal metabolite, and 16S sequencing accurately identifies subjects with food addiction
Using the significant findings on brain imaging, fecal metabolite, and DESEq2 analysis of the fecal microbiome, a random forest classifier was created with a high accuracy for predicting obese subjects with FA behaviors. The AUC in 5-fold cross-validation was 0.81 (Figure 4a). The contribution of each variable was expressed with a variable importance score, which measures the decrease in accuracy of the classifier if that feature was removed. The variables with the highest scores were those pertaining to brain imaging and indolepropionate. Seven OTUs also contributed significantly to the classifier and those OTUs belonged to Barnesiellaceae, Ruminococcaceae, Desulfovibrio, Bacteroides, Eubacterium, and Megamonas (Figure 4b).
Figure 4:
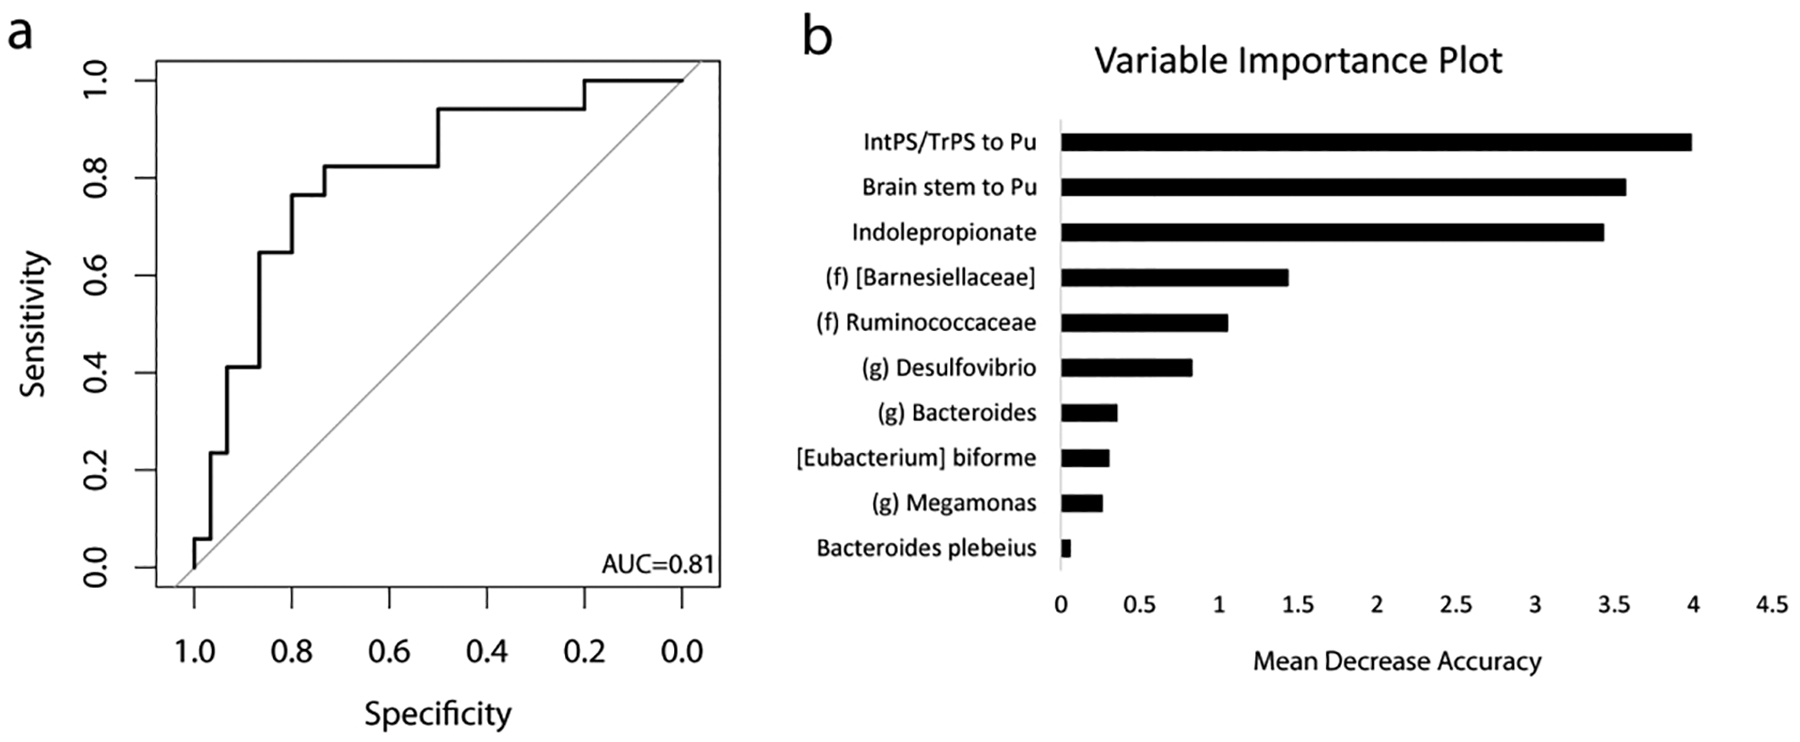
Combining fecal metabolite with 16S and brain imaging data, a highly accurate classifier is created that identifies subjects with food addiction (FA). A) ROC curve for the random forest classifier (AUCROC =0.81). B) Variable importance plot of each factor on the accuracy of the classifier. IntPS/TrPS: intraparietal sulcus/transverse parietal sulcus. Pu: Putamen.
DISCUSSION
To our knowledge, this is the first study to utilize a systems biology approach to demonstrate associations between FA and changes in brain-gut-microbiome interactions by analyzing fecal microbes, metabolites, and anatomical connectivity (DTI) brain data. FA behaviors in females were associated with a distinct microbial profile, increased connectivity with the putamen of the reward center of the brain, and a decrease in indolepropionate, a tryptophan derived microbial metabolite.
The study results indicated a strong negative association between Bacteroides, Akkermansia, and Eubacterium with FA. Bacteroides is the major genus belonging to the phylum Bacteroidetes. In both human and mouse studies, a rise in Bacteroidetes is often associated with a leaner phenotype.(10) In bariatric studies, subjects that had the most significant weight loss were those that had higher levels of Bacteroides and lower levels of Prevotella.(23) In a prospective study, Bacteroides species were higher in lean individuals and those subjects who were able to achieve weight loss as compared to subjects with obesity.(24) Whether the associations noted between Bacteroides and obesity are causative is still an area of active research. In our data, Bacteroides was positively associated with indolepropionate and negatively associated with brain regions related to FA.
Akkermansia was also another genus that was significantly associated with FA, brain imaging, and fecal metabolites. Akkermansia is a mucin-degrading bacterium that has been extensively studied for its protective role in metabolic syndrome and insulin sensitivity both in human and mouse studies.(25) In a study of 41 females with obesity undergoing calorie restriction, an increase in relative abundance of Akkermansia was associated with improved fasting glucose, waist-to-hip ratio, and subcutaneous adipocyte diameter.(26) This led to a recent phase 1 randomized double-blind, placebo-controlled clinical trial showing that Akkermansia supplementation in obese/overweight volunteers led to improved insulin sensitivity, reduced plasma cholesterol, and a trend towards decreased body weight and fat mass.(27)
However, unlike Akkermansia and Bacteroides, Eubacterium biforme has not been as well studied with regards to obesity or metabolic syndrome. In our study we show Eubacterium to be negatively associated with FA as well as key areas of the brain reward network. Similar to Bacteroides, Eubacterium is known to be a significant producer of short-chain fatty acids.(28) Short-chain fatty acids is the by-product of bacterial fermentation of indigestible dietary fiber. The most abundant short-chain fatty acid is butyrate and several animal studies have shown that butyrate can be protective against obesity by increasing GLP-1, leptin release, and increasing fatty acid oxidation.(28) Butyrate is also able to communicate directly with the central nervous system by crossing the blood-brain barrier and activating the vagus nerve and hypothalamus. (28)
While Akkermansia, Bacteroides, and Eubacterium were negatively associated with FA, Megamonas was one of the few bacteria that was both positively associated with FA and an increased activity of the reward network of the brain. In human studies, Megamonas has been associated with an increase prevalence of prediabetes (29) and childhood obesity.(30) In context, these associations between the gut microbiome and obesity may be mediated through interactions involving the gut-brain axis.
In our study, we also saw that alpha diversity did not differ between subjects with or without FA but it was seen that alpha diversity did differ by race and ethnicity, which may be a reflection of dietary differences across these groups. Larger samples, will allow for future analyses to account for cultural factors and for race and ethnicity differences.
Analysis of fecal metabolites revealed a negative association between indolepropionate and FA. Microbial analysis showed that Bacteroides and Akkermansia was positively correlated with indolepropionate while bacteria belonging to the phylum Firmicutes were negatively associated. This finding is in line with the numerous studies that have shown an increase in Firmicutes and a decrease in Bacteroides in patients with diabetes, metabolic syndrome and obesity.(31) Indolepropionate belongs to a larger class of tryptophan-derived metabolites termed “indoles.” In contrast to other tryptophan derived metabolites (serotonin, kynurenine), which have also been implicated in brain-gut-microbiome interactions in obesity, indoles are the result of exclusively microbial metabolism, in which most undigested dietary tryptophan in the gut is converted to indoles.(32) The results we present here are consistent with our previously published work, where we describe associations between indoles on key regions of the extended reward network and both obesity and FA.(12) Indoles play an important role in modulating kynurenine synthesis, reducing central nervous system inflammation, improving the mucosal intestinal barrier, and altering GLP-1 secretion(33, 34)- all of which have been shown to be disrupted in states of obesity. Although indolepropionate has been less extensively studied, previous work has demonstrated a neuroprotective role of indolepropionate against Alzheimer’s disease and neural oxidative stress.(35) Furthermore, a Finnish study of 200 subjects showed that a higher level of serum indolepropionate acid was associated with a reduce risk of type 2 diabetes.(36) This data suggests that indolepropionate may have both local protective effects on intestinal barrier function as well as remote effects on preserving β-cell function and central nervous system inflammation.
In this study we were also able to demonstrate that decreased fecal indolepropionate was associated with not only increased FA behaviors, but that this was related to increased connectivity between key reward regions involving the putamen. In line with the previous fecal microbiome data in FA and indolepropionate, we see a negative association of Bacteroides and Akkermansia to the connectivity between the putamen and the intraparietal sulcus. Normal eating behavior is under the control of the brain’s homeostatic system and hedonic system, which includes regions involved in the processing of food-seeking behavior, inhibition, and integrating information to make decisions regarding food intake.(37, 38) However, in both FA and obesity, activity within the extended reward network can override the homeostatic system.(8, 37) This dominance of hedonic over homeostatic influences on eating behavior has been related to the ubiquitous presence of cheap, highly palatable, high caloric foods, which are enhanced for taste and salience. This hedonic dominance not only leads to increases in cravings and ingestion of these foods, but environmental factors such as stress and adversity can serve as conditional cues for future food intake and long-term weight gain.(39) Some studies have indicated that overconsumption of highly palatable foods rich in calories, fat, and sugar reduce the reward thresholds of such foods when ingested, and therefore require a higher intake to generate the same satisfaction.(40)
Integrating the significant findings on brain imaging, fecal metabolites, and the fecal microbiome, we created a random forest classifier, which demonstrated a high accuracy for predicting obese individuals with FA behaviors. Next to indolepropionate and connectivity of key reward network region (the putamen), the bacterial genera with significant contribution to the classifier that were also significant in other analysis belonged to Bacteroides, Eubacterium, and Megamonas.
There are several limitations to our study. Because of the cross-sectional design the results only show associations between behavior, gut microbiome and brain structure. However, in the absence of a truly valid food addiction model in animals and the challenges of doing studies in humans that address the bidirectional BGM interactions, cross sectional studies are essential first steps to identify correlations within the BGM axis in humans. Another limitation is that this study enrolled only females, and due to the lower prevalence rates of FA in males compared to females, it would require larger sample sizes to observe the same effects in males. Lastly, this data should be validated in an external cohort to confirm the accuracy of the classifier.
In conclusion, food addiction refers to maladaptive ingestive behaviors resulting from a shift from primarily homeostatic to hedonic regulatory mechanisms of food intake which primarily occurs in individuals with obesity. This shift reflects alterations at all levels of the BGM axis. The results of our study suggest that FA behavior may be mediated via effects of the gut microbiome and their metabolites on the reward centers of the brain (Figure 5). If confirmed in follow up studies, these findings suggest the possibility of targeting the brain-gut-microbiome axis to combat FA behavior and obesity.
Figure 5:
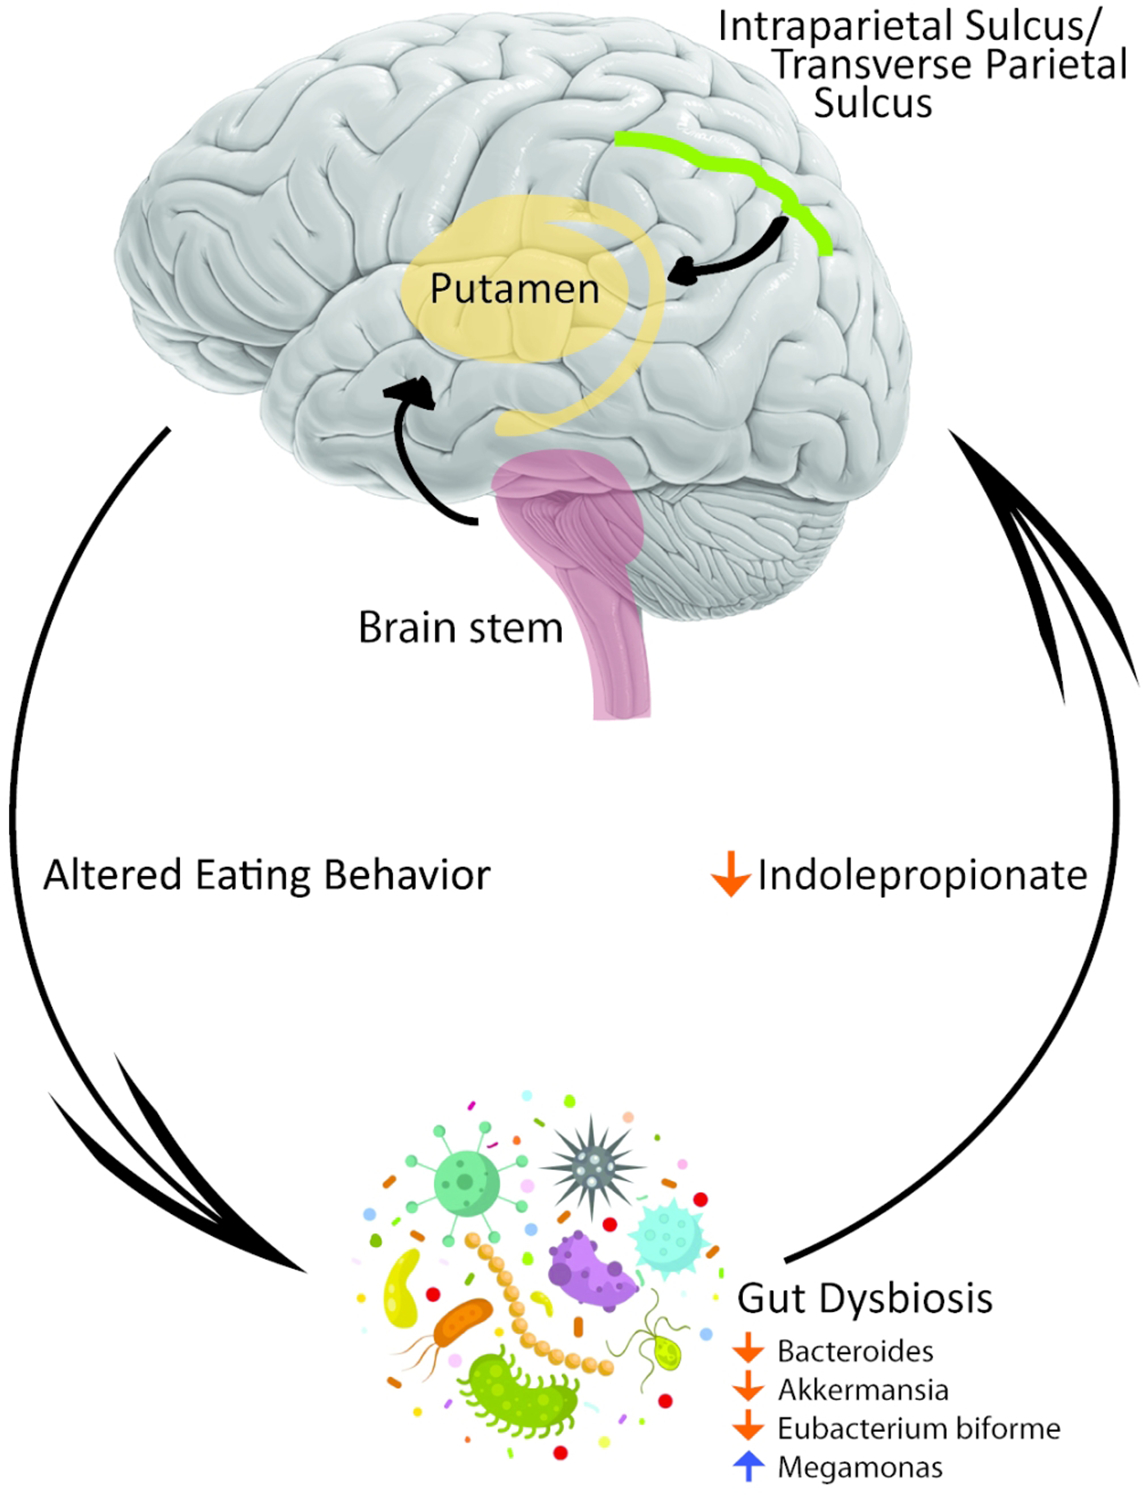
Proposed schematic diagram that connects the gut microbiome to food addiction (FA) via changes in metabolite and changes in connectivity of the brain’s reward system.
Supplementary Material
What is already known about this subject?
Food addiction to highly processed foods is more prevalent in women than in men and is a potential cause of obesity
The gut microbiome plays a very distinct role in the regulation of obesity through alterations in metabolism
Little is known about the biochemical pathways that lead to food addiction
What are the new findings in the manuscript?
We discovered a novel association between the brain-gut-microbiome axis and food addiction
Food addiction is associated with gut dysbiosis characterized by an overabundance of Megamonas and a reduction of Akkermansia, Eubacterium, and Bacteroides
This gut dysbiosis is associated with a reduction in a neuroprotective tryptophan-related metabolite, indolepropionate, and increase communication between certain reward regions of the brain
How does the findings change the direction of research or clinical practice?
Gut dysbiosis or fecal metabolites can be used as biomarkers for patients with food addiction
Understanding the downstream signaling of indolepropionate may lead to a better understanding of food addiction and obesity
Focusing on the gut microbiome or on indolepropionate may lead to novel therapeutics against food addiction and obesity
Acknowledgements/Funding Support:
This research was supported by grants from the National Institutes of Health including K23 DK106528 (AG), T32 DK 7180-44 (TD), ULTR001881/DK041301 (UCLA CURE/CTSI Pilot and Feasibility Study; AG), R01 DK048351 (EAM); VA Career Development Award IK2CX001717 (JPJ); and pilot funds provided for brain scanning by the Ahmanson-Lovelace Brain Mapping Center. Preliminary data was reported in an abstract presented as a poster at The Obesity Week (TOS), Las Vegas, NV, 2019. U.S. Provisional Patent No.: 62/885,010
Footnotes
Conflicts of Interest: No conflicts of interest exist
References
- 1.Seidell JC, Halberstadt J. The global burden of obesity and the challenges of prevention. Ann Nutr Metab 2015;66 Suppl 2: 7–12. [DOI] [PubMed] [Google Scholar]
- 2.Reilly JJ, Kelly J. Long-term impact of overweight and obesity in childhood and adolescence on morbidity and premature mortality in adulthood: systematic review. Int J Obes (Lond) 2011;35: 891–898. [DOI] [PubMed] [Google Scholar]
- 3.Wang YC, McPherson K, Marsh T, Gortmaker SL, Brown M. Health and economic burden of the projected obesity trends in the USA and the UK. Lancet 2011;378: 815–825. [DOI] [PubMed] [Google Scholar]
- 4.Gearhardt AN, Corbin WR, Brownell KD. Development of the Yale Food Addiction Scale Version 2.0. Psychol Addict Behav 2016;30: 113–121. [DOI] [PubMed] [Google Scholar]
- 5.Corwin RL, Grigson PS. Symposium overview--Food addiction: fact or fiction? J Nutr 2009;139: 617–619. [DOI] [PMC free article] [PubMed] [Google Scholar]
- 6.Gordon EL, Ariel-Donges AH, Bauman V, Merlo LJ. What Is the Evidence for “Food Addiction?” A Systematic Review. Nutrients 2018;10. [DOI] [PMC free article] [PubMed] [Google Scholar]
- 7.Fletcher PC, Kenny PJ. Food addiction: a valid concept? Neuropsychopharmacology 2018;43: 2506–2513. [DOI] [PMC free article] [PubMed] [Google Scholar]
- 8.Lindgren E, Gray K, Miller G, Tyler R, Wiers CE, Volkow ND, et al. Food addiction: A common neurobiological mechanism with drug abuse. Front Biosci (Landmark Ed) 2018;23: 811–836. [DOI] [PubMed] [Google Scholar]
- 9.Turnbaugh PJ, Hamady M, Yatsunenko T, Cantarel BL, Duncan A, Ley RE, et al. A core gut microbiome in obese and lean twins. Nature 2009;457: 480–484. [DOI] [PMC free article] [PubMed] [Google Scholar]
- 10.Turnbaugh PJ, Ley RE, Mahowald MA, Magrini V, Mardis ER, Gordon JI. An obesity-associated gut microbiome with increased capacity for energy harvest. Nature 2006;444: 1027–1031. [DOI] [PubMed] [Google Scholar]
- 11.Goswami C, Iwasaki Y, Yada T. Short-chain fatty acids suppress food intake by activating vagal afferent neurons. J Nutr Biochem 2018;57: 130–135. [DOI] [PubMed] [Google Scholar]
- 12.Osadchiy V, Labus JS, Gupta A, Jacobs J, Ashe-McNalley C, Hsiao EY, et al. Correlation of tryptophan metabolites with connectivity of extended central reward network in healthy subjects. PLoS One 2018;13: e0201772. [DOI] [PMC free article] [PubMed] [Google Scholar]
- 13.Gearhardt AN, Corbin WR, Brownell KD. Preliminary validation of the Yale Food Addiction Scale. Appetite 2009;52: 430–436. [DOI] [PubMed] [Google Scholar]
- 14.Gupta A, Mayer EA, Acosta JR, Hamadani K, Torgerson C, van Horn JD, et al. Early adverse life events are associated with altered brain network architecture in a sex-dependent manner. Neurobiol Stress 2017;7: 16–26. [DOI] [PMC free article] [PubMed] [Google Scholar]
- 15.Gupta A, Mayer EA, Labus JS, Bhatt RR, Ju T, Love A, et al. Sex commonalities and differences in obesity-related alterations in intrinsic brain activity and connectivity. Obesity In press. [DOI] [PMC free article] [PubMed] [Google Scholar]
- 16.Fischl B, Salat DH, Busa E, Albert M, Dieterich M, Haselgrove C, et al. Whole brain segmentation: automated labeling of neuroanatomical structures in the human brain. Neuron 2002;33: 341–355. [DOI] [PubMed] [Google Scholar]
- 17.Dale AM, Fischl B, Sereno MI. Cortical surface-based analysis - I. Segmentation and surface reconstruction. NeuroImage 1999;9: 179–194. [DOI] [PubMed] [Google Scholar]
- 18.Destrieux C, Fischl B, Dale A, Halgren E. Automatic parcellation of human cortical gyri and sulci using standard anatomical nomenclature. Neuroimage 2010;53: 1–15. [DOI] [PMC free article] [PubMed] [Google Scholar]
- 19.Irimia A, Van Horn JD. The structural, connectomic and network covariance of the human brain. Neuroimage 2012;66C: 489–499. [DOI] [PMC free article] [PubMed] [Google Scholar]
- 20.Irimia A, Chambers MC, Torgerson CM, Van Horn JD. Circular representation of human cortical networks for subject and population-level connectomic visualization. Neuroimage 2012;60: 1340–1351. [DOI] [PMC free article] [PubMed] [Google Scholar]
- 21.Mayer EA. Gut feelings: the emerging biology of gut-brain communication. Nat Rev Neurosci 2011;12: 453–466. [DOI] [PMC free article] [PubMed] [Google Scholar]
- 22.Sanmiguel CP, Jacobs J, Gupta A, Ju T, Stains J, Coveleskie K, et al. Surgically Induced Changes in Gut Microbiome and Hedonic Eating as Related to Weight Loss: Preliminary Findings in Obese Women Undergoing Bariatric Surgery. Psychosom Med 2017;79: 880–887. [DOI] [PMC free article] [PubMed] [Google Scholar]
- 23.Furet JP, Kong LC, Tap J, Poitou C, Basdevant A, Bouillot JL, et al. Differential adaptation of human gut microbiota to bariatric surgery-induced weight loss: links with metabolic and low-grade inflammation markers. Diabetes 2010;59: 3049–3057. [DOI] [PMC free article] [PubMed] [Google Scholar]
- 24.Remely M, Hippe B, Zanner J, Aumueller E, Brath H, Haslberger AG. Gut Microbiota of Obese, Type 2 Diabetic Individuals is Enriched in Faecalibacterium prausnitzii, Akkermansia muciniphila and Peptostreptococcus anaerobius after Weight Loss. Endocr Metab Immune Disord Drug Targets 2016;16: 99–106. [DOI] [PubMed] [Google Scholar]
- 25.Macchione IG, Lopetuso LR, Ianiro G, Napoli M, Gibiino G, Rizzatti G, et al. Akkermansia muciniphila: key player in metabolic and gastrointestinal disorders. Eur Rev Med Pharmacol Sci 2019;23: 8075–8083. [DOI] [PubMed] [Google Scholar]
- 26.Dao MC, Everard A, Aron-Wisnewsky J, Sokolovska N, Prifti E, Verger EO, et al. Akkermansia muciniphila and improved metabolic health during a dietary intervention in obesity: relationship with gut microbiome richness and ecology. Gut 2016;65: 426–436. [DOI] [PubMed] [Google Scholar]
- 27.Depommier C, Everard A, Druart C, Plovier H, Van Hul M, Vieira-Silva S, et al. Supplementation with Akkermansia muciniphila in overweight and obese human volunteers: a proof-of-concept exploratory study. Nat Med 2019;25: 1096–1103. [DOI] [PMC free article] [PubMed] [Google Scholar]
- 28.Liu H, Wang J, He T, Becker S, Zhang G, Li D, et al. Butyrate: A Double-Edged Sword for Health? Adv Nutr 2018;9: 21–29. [DOI] [PMC free article] [PubMed] [Google Scholar]
- 29.Zhang X, Shen D, Fang Z, Jie Z, Qiu X, Zhang C, et al. Human gut microbiota changes reveal the progression of glucose intolerance. PLoS One 2013;8: e71108. [DOI] [PMC free article] [PubMed] [Google Scholar]
- 30.Maya-Lucas O, Murugesan S, Nirmalkar K, Alcaraz LD, Hoyo-Vadillo C, Pizano-Zarate ML, et al. The gut microbiome of Mexican children affected by obesity. Anaerobe 2019;55: 11–23. [DOI] [PubMed] [Google Scholar]
- 31.Castaner O, Goday A, Park YM, Lee SH, Magkos F, Shiow STE, et al. The Gut Microbiome Profile in Obesity: A Systematic Review. Int J Endocrinol 2018;2018: 4095789. [DOI] [PMC free article] [PubMed] [Google Scholar]
- 32.Kennedy PJ, Cryan JF, Dinan TG, Clarke G. Kynurenine pathway metabolism and the microbiota-gut-brain axis. Neuropharmacology 2017;112: 399–412. [DOI] [PubMed] [Google Scholar]
- 33.Martin CR, Osadchiy V, Kalani A, Mayer EA. The Brain-Gut-Microbiome Axis. Cell Mol Gastroenterol Hepatol 2018;6: 133–148. [DOI] [PMC free article] [PubMed] [Google Scholar]
- 34.Chimerel C, Emery E, Summers DK, Keyser U, Gribble FM, Reimann F. Bacterial metabolite indole modulates incretin secretion from intestinal enteroendocrine L cells. Cell Rep 2014;9: 1202–1208. [DOI] [PMC free article] [PubMed] [Google Scholar]
- 35.Hwang IK, Yoo KY, Li H, Park OK, Lee CH, Choi JH, et al. Indole-3-propionic acid attenuates neuronal damage and oxidative stress in the ischemic hippocampus. J Neurosci Res 2009;87: 2126–2137. [DOI] [PubMed] [Google Scholar]
- 36.de Mello VD, Paananen J, Lindström J, Lankinen MA, Shi L, Kuusisto J, et al. Indolepropionic acid and novel lipid metabolites are associated with a lower risk of type 2 diabetes in the Finnish Diabetes Prevention Study. Sci Rep 2017;7: 46337. [DOI] [PMC free article] [PubMed] [Google Scholar]
- 37.Volkow ND, Wang GJ, Baler RD. Reward, dopamine and the control of food intake: implications for obesity. Trends Cogn Sci 2011;15: 37–46. [DOI] [PMC free article] [PubMed] [Google Scholar]
- 38.Wijngaarden MA, Veer IM, Rombouts SA, van Buchem MA, Willems van Dijk K, Pijl H, et al. Obesity is marked by distinct functional connectivity in brain networks involved in food reward and salience. Behav Brain Res 2015;287: 127–134. [DOI] [PubMed] [Google Scholar]
- 39.Sinha R. Role of addiction and stress neurobiology on food intake and obesity. Biol Psychol 2018;131: 5–13. [DOI] [PMC free article] [PubMed] [Google Scholar]
- 40.Nunes-Neto PR, Kohler CA, Schuch FB, Solmi M, Quevedo J, Maes M, et al. Food addiction: Prevalence, psychopathological correlates and associations with quality of life in a large sample. J Psychiatr Res 2018;96: 145–152. [DOI] [PubMed] [Google Scholar]
Associated Data
This section collects any data citations, data availability statements, or supplementary materials included in this article.