

Abstract
Resting‐state functional MRI (RfMRI) analyses have identified two anatomically separable fronto‐parietal attention networks in the human brain: a bilateral dorsal attention network and a right‐lateralised ventral attention network (VAN). The VAN has been implicated in visuospatial cognition and, thus, potentially in the unilateral spatial neglect associated with right hemisphere lesions. Its parietal, frontal and temporal endpoints are thought to be structurally supported by undefined white matter tracts. We investigated the white matter tract connecting the VAN. We used three approaches to study the structural anatomy of the VAN: (a) independent component analysis on RfMRI (50 subjects), defining the endpoints of the VAN, (b) tractography in the same 50 healthy volunteers, with regions of interest defined by the MNI coordinates of cortical areas involved in the VAN used in a seed‐based approach and (c) dissection, by Klingler’s method, of 20 right hemispheres, for ex vivo studies of the fibre tracts connecting VAN endpoints. The VAN includes the temporoparietal junction and the ventral frontal cortex. The endpoints of the superior longitudinal fasciculus in its third portion (SLF III) and the arcuate fasciculus (AF) overlap with the VAN endpoints. The SLF III connects the supramarginal gyrus to the ventral portion of the precentral gyrus and the pars opercularis. The AF connects the middle and inferior temporal gyrus and the middle and inferior frontal gyrus. We reconstructed the structural connectivity of the VAN and considered it in the context if the pathophysiology of unilateral neglect and right hemisphere awake brain surgery.
Keywords: arcuate fasciculus, resting state, tractography, ventral attention network, white matter
Three‐dimensional visualisation of the ventral activation network (VAN) activation peaks superimposed on a grid of MNI coordinates. The SLF III connects the supramarginal gyrus to the ventral portion of the precentral gyrus and the pars opercularis. The arcuate fasciculus connects the middle and inferior temporal gyrus and the middle and inferior frontal gyrus. We reconstructed the structural connectivity of the VAN, and considered it in the context if the pathophysiology of unilateral neglect and right hemisphere awake brain surgery.

1. INTRODUCTION
The non‐dominant hemisphere (the right hemisphere in right‐handed individuals) plays an important role in spatial consciousness, emotion and other cognitive processes. Unilateral spatial neglect (USN) is a tragic consequence of lesions in this hemisphere, corresponding to a lack of detection of stimuli contralateral to the lesion and thus to a lack of response to such stimuli (Vallar & Perani, 1986; Mesulam, 1999), whereas basic sensory and motor functions remain intact (Lemée et al., 2018). It has diverse aetiologies, from neurological causes (stroke, infection) to pre‐ and post‐neurosurgery deficits. The prognosis of USN is poor in terms of recovery for routine activities, and rehabilitation is very difficult due to associated anosognosia (Jehkonen et al., 2000). This syndrome has been attributed to a disruption of the function of spatial attention distribution, preventing a conscious perception of contralateral events and interaction with them (Heilman & Van Den Abell, 1980; Mesulam, 1990; Vuilleumier et al., 2002).
Functional task‐based MRI explores cognitive function through activation paradigms involving the stimulation of specific cognitive processes. By contrast, resting‐state MRI (R‐MRI) is a complementary MRI technique that can be used to explore the spontaneous synchronisation of brain areas in the absence of an activation task (Biswal et al., 1995; Damoiseaux et al., 2006; Smith et al., 2009). The working hypothesis is that brain areas displaying a spontaneous synchronisation of low‐frequency fMRI oscillations over time belong to the same functional network. The correlation structure of these networks reflects the neuroanatomical substrate of task‐induced activity through a data‐driven method not requiring prior knowledge (Fox et al., 2005; Mitchell et al., 2013). The exploration of attentional networks by functional activation MRI is challenging in the absence of a reliable activation paradigm suitable for use with the short acquisition processes of MRI. Attentional networks were, therefore, first studied by resting‐state MRI. Fox et al. (2006) identified a bilateral dorsal attention network (DAN) and a right‐lateralised ventral attention network (VAN) by R‐MRI. Corbetta showed that USN was caused by VAN dysfunction (Shulman et al., 2010; Corbetta & Shulman, 2011). Cortical damage and white matter disconnection can trigger USN (Lunven et al., 2015; Lunven & Bartolomeo, 2017). The components of attentional networks are, therefore, thought to be connected structurally, via specific periventricular white matter association fibres (Doricchi et al., 2008; Umarova et al., 2010).
A number of different nomenclatures have been applied to white‐matter anatomy, resulting in classification discrepancies between studies (Bernard et al., 2019). The nomenclature of the arcuate fasciculus (AF), for example, has changed over time, making it difficult to carry out literature reviews of the relationships between the AF and the superior longitudinal fascicle in its third portion (SLF III). Classical anatomical and clinical studies considered the AF and the long inner segment of the SLF III to be part of the same fasciculus, connecting the posterior superior temporal gyrus (Wernicke’s area) to the inferior frontal gyrus (Broca’s area) (Catani et al., 2005). However, more recent anatomical studies based on the use of post‐mortem fibre microdissection techniques have suggested that the differentiation of these two structures, with AF as a fronto‐temporal tract and the SLF III as a fronto‐parietal tract (Schmahmann & Pandya, 2007; Wedeen et al., 2008; Yagmurlu et al., 2016).
The white matter tracts serving as the anatomical substrate of the VAN have yet to be investigated in systematic studies. An understanding of the anatomical and functional support of attentional networks is crucial to improvements in our understanding of visuospatial cognition and in pre‐ and perioperative management in awake brain neurosurgery on the right hemisphere. Our objective was therefore to investigate the white matter tracts supporting VAN connectivity.
2. METHODS
We studied the white matter anatomy of the VAN cortical nodes by R‐MRI, tractography and white matter dissection.
2.1. Resting‐state fMRI
We performed independent component analysis on 50 healthy subjects, using R‐MRI to define the cortical nodes of the VAN.
2.1.1. Study population
Inclusion criteria
The participants were healthy right‐handed adult volunteers, without psychiatric disorders, who agreed to participate in the ICA‐language study in our laboratory (CPP Agreement number 2012/25, clinicalTrials.gov NCT02577757). All subjects gave written, informed consent before enrolment in this study.
Exclusion criteria
Subjects with a psychiatric disorder, or who were under the age of 18 years, or who were unable to read or write French were excluded from this study. Subjects with contraindications for MRI (claustrophobia, pregnancy, implanted with metallic foreign bodies, pacemakers, etc.) were excluded from this study.
2.1.2. R‐MRI data acquisition
All datasets were acquired on a 3.0 Tesla MR Scanner (Magnetom® Skyra Medical Systems™). During image acquisition, subjects were placed in a supine position, in the dark, with their heads immobilised with foam pads and straps. The subjects were fitted with earphones. They were asked to empty their minds and to watch a black screen with a red cross in the centre, through a prism. An echo planar imaging (EPI) sequence was used for each fMRI, with the following parameters: TR = 2,280 ms, TE = 30 ms, flip angle = 90°, 42 axial interleaved slices, each 4 mm thick, in‐plane matrix = 64 × 64 with a field of view = 168 × 187 mm, yielding a voxel size of 3 × 3 × 4 mm, covering the whole brain, including the cerebellum.
2.1.3. Analysis of imaging data
Preprocessing
Preprocessing was performed with SPM8 (Wellcome Department of Imaging Neuroscience, University College, London, UK, http://www.fil.ion.ucl.ac.uk/spm) running under matlab (the MathWorks). Each patient’s native space images were corrected for time delays between slices. All the images were then realigned with the first volume of the first session and unwrapped to correct for head movements and susceptibility distortions. The three‐dimensional dataset was segmented in native space, using the VBM 8.0 toolbox for SPM®, and co‐registered with the mean functional image, using grey‐matter segmentation as a reference image. The co‐registered grey‐matter segmentation was then used for the spatial normalisation of data into a standard template provided by the Montreal Neurological Institute (MNI‐template), with a final resolution of 3 × 3 × 3 mm.
Spatial independent component analysis
A spatial independent component analysis (sICA) approach was used, based on a customised version of the Infomax algorithm running in matlab, for the identification of large‐scale networks (Marrelec et al., 2006). Fifty‐five resting‐state networks (RsN) (corresponding to spontaneously synchronised brain areas) were identified on the pre‐processed images of each individual run. Individual spatial components were thresholded at z = 2.
2.1.4. Identification of the ventral attentional network
The VAN can be distinguished from other cognitive networks (language, salience, DAN, fronto‐parietal control, default mode) on the basis of its specific activity: activation of the right temporoparietal junction (TPJ), the right ventral frontal cortex (VFC) and the supramarginal gyrus (Corbetta et al., 2008; Sylvester et al., 2013). It was challenging to distinguish between the VAN and the salience network in some cases. Unlike the VAN, the salience network (SN) contains the anterior dorsal cingulum, the pre‐motor supplementary area and the anterior insula‐frontal operculum (Uddin et al., 2011; Farrant & Uddin, 2015). The MNI coordinates of the maximum activation peaks of significant clusters in the VAN were determined. Anatomical labels were then attributed to these maximal activation peaks with the Anatomy toolbox for SPM (http://www.fz‐juelich.de/inm/inm‐1/DE/Forschung/_docs/SPMAnatomyToolbox/SPMAnatomyToolbox_node.html). After identification at the individual level, a second‐order analysis was performed, in the form of a one‐sample t‐test on the unthresholded t‐maps of the VAN. We corrected for multiple comparisons at the voxel level.
2.2. Tractography
2.2.1. Data acquisition and preprocessing
Diffusion data were acquired with a magnetisation‐prepared, single‐shot gradient echo planar imaging (EPI) sequence (echo time 64 ms, repetition time 10 s, flip angle 90°, FOV 256 × 256 × 120 mm3, acquisition matrix 128 × 128 × 60 voxels of 2 × 2 × 2 mm3). Diffusion gradients were applied in 32 non‐collinear directions. Modified TEND algorithms (medinria software), based on B0 analysis, were used to correct geometric distortions (Weinstein et al., 1999). An optimal alignment of T1‐weighted and diffusion‐weighted images was achieved by affine transformation estimated with an automatic registration algorithm based on mutual information (Wiest‐Daesslé et al., 2007). Registration was performed between T1 and the diffusion‐free weighted image (B0). The brain and the external traces of the sulci were extracted (Le Goualher et al., 1997) from the T1 data after denoising (Coupé et al., 2008) and intensity inhomogeneity bias correction.
2.2.2. Tracking
The VAN encompass two distinct areas (the TPJ and frontal cortex). We therefore extracted white matter fibre bundles with a two‐region of interest (ROI) approach. For each set of diffusion‐weighted data, a tensor estimation was performed, with a log‐Euclidean metric (Fillard et al., 2007) and streamline tractography, on the whole brain, with medinria version 1.9.0 (Asclepios Research Project; INRIA Sophia Antipolis, France) and the following set of parameters: the fractional anisotropy (FA) threshold was set to 0.2, as suggested by Mori & van Zijl (2007) and Magro et al., (2014), and the smoothness parameter was set to 20, as recommended by Weinstein et al. (1999) for association tracts. The ROIs were created with TPJ (Table 1, cluster 1) and frontal (Table 1, cluster 2, 5 and 11) MNI coordinates for activation peaks obtained with MRICRON from the T1‐weighted data. The data were then imported into medinria. Finally, MRI tracks were reconstructed for each volunteer with a pair of ROIs within the same hemisphere used as seeds for the extraction of putative pathways (Lawes et al., 2008). The right TPJ activation MNI coordinates defined the first ROI (Table 1, cluster 1). The second ROI was defined by the frontal VAN activations (Table 1, clusters 2, 5 and 11).
Table 1.
Mean activity peaks identified in RfMRI for the resting‐state network corresponding to the VAN
| VAN activation peak | Cluster | Localisation | MNI coordinates | ||
|---|---|---|---|---|---|
| x | y | z | |||
| Temporoparietal junction | 1 |
|
63 | −46 | 19 |
| 62 | −46 | 6 | |||
| 54 | −22 | −18 | |||
| Ventral frontal cortex | 2 |
|
48 | 27 | −8 |
| 54 | 26 | −12 | |||
| 46 | 20 | 18 | |||
| 5 |
|
46 | 6 | 51 | |
| 45 | 9 | 46 | |||
| 11 |
|
−45 | 17 | 19 | |
Maximal activation peaks (p < .001) were obtained with a cluster threshold of 5 voxels; the corresponding anatomical locations were derived from the anatomy toolbox in SPM (x, y, z = coordinates in the normalised space MNI).
The temporoparietal junction activation peak was defined by cluster 1.
The lateral frontal cortex areas were defined by clusters 2, 5 and 11.
2.3. White matter dissection
We studied fibre tracts connecting the cortical nodes of the VAN by Klingler’s method (27–30). We studied 20 heads from adult cadavers obtained from the body donation programme of our institution (the Angers Anatomical Laboratory). The specimens were fixed by incubation in 10% formalin for 15 days. The right hemispheres were extracted and the arachnoid and vascular structures gently removed. The hemispheres were frozen at −15°C for 15 days. Careful dissection was then performed with a foam spatula, in a lateral‐to‐medial direction, under optical magnification, to excise the cortex and the U‐shaped fibres. Once the subcortical fibre tracts had been identified, further dissection was performed with metal microdissectors (31). Photographs were obtained at each stage of the dissection, with a Nikon D5600 camera. The VAN fibre tracts were identified on the basis of their endpoints and the orientation of the fibres, which made it possible to distinguish each separate fibre tract (Bernard et al., 2019).
3. RESULTS
3.1. Identification of cortical brain areas corresponding to the ventral attention network by resting‐state functional MRI
We included 50 right‐handed subjects in this study. For each subject, we were able to identify a resting‐state network (RsN) corresponding to the VAN. Figure 1 shows a second‐order analysis of correlation maps for the 50 subjects. As expected, given the criteria for VAN identification, the corresponding voxels were significantly correlated with the right temporoparietal junction and the ventral frontal cortex defining the VAN (Table 1). Eight of the 12 significantly activated supratentorial peaks of connectivity of the VAN were located in the right hemisphere. The two main clusters included the TPJ, especially the area surrounding the superior temporal sulcus (STS; Figures 1 and 2) and the VFC. As shown in Figure 1, the ‘temporal’ activation (cluster 1, Table 1 and Figure 2) identified in the second‐order analysis was not purely temporal, as it also included the supramarginal gyrus and the lower part of the angular gyrus. This cluster had an anterior extension towards the middle temporal gyrus, crossing the superior temporal sulcus. The activated frontal clusters were centred on the pars triangularis, its extension from the precentral gyrus to the pars orbitalis being circular in shape. Note that the posterior part of the middle frontal gyrus was contiguous to this activation peak.
Figure 1.
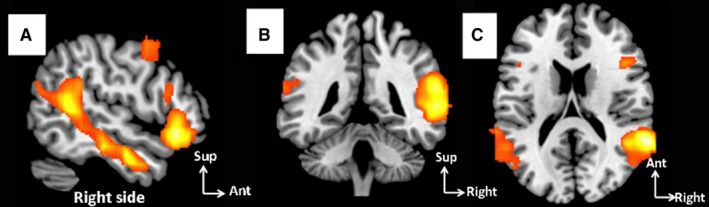
Study of the connectivity of the ventral attention network (VAN) by resting‐state MRI. (a‐c) Resting‐state MRI study of the VAN activation peak: (a) sagittal, (b) coronal, (c) axial views [Colour figure can be viewed at wileyonlinelibrary.com]
Figure 2.

Three‐dimensional visualisation of the VAN activation peaks superimposed on a grid of MNI coordinates. The AF was the second fibre tract connecting the lower part of the TPJ to the anterior part of the lateral frontal VAN component, including the VFC [Colour figure can be viewed at wileyonlinelibrary.com]
3.2. Identification of the white matter tracts of the ventral attention network by tractography and with Klingler’s method
3.2.1. Superficial anatomy analysis by Klingler’s method
We first studied the sulci and gyri of the lateral part surface of the right hemisphere. Sulcal organisation was found to be fairly uniform in the temporal, parietal and frontal lobes studied, regardless of the method used. As Klingler’s method is destructive, we first identified the cortical structures. The lateral part of the temporal lobe of the 20 right hemispheres dissected was typically split by the superior and inferior temporal sulci, into three parallel temporal gyri: the superior (T1), middle (T2) and inferior (T3) gyri. In all dissected specimens, the SMG and AG were separated by the intermediate parietal sulcus of Jensen. However, some temporal lobe variants were observed: T1 was interrupted by a short vertical sulcus in four hemispheres (20%), T2 was divided in two (10%) and T3 in four (20%) hemispheres. Cortical bridges linking T1 to T2 were observed in three specimens (15%), and bridges linking T2 and T3 were observed in the other 17 cases (85%). Despite these variants, we were able to identify the cortical connections of the VAN in all specimens.
3.2.2. Removal of U‐shaped fibres
For identification of the fibre tracts connecting the TPJ and the frontal component of the VAN (VFC, precentral gyrus, pars opercularis and middle frontal gyrus) we first removed the U‐shaped fibres. The techniques used (tractography and Klingler’s method) made it possible to expose the SLF III and the lateral part of the AF in the postero‐superior portion of the temporal lobe, down to the SMG, in all specimens (Figure 3 ).
Using previously defined tractographic parameters, we were able to remove almost all the U‐shaped fibres after the identification of the major fibre tracts by tracking. In 32 subjects (64%), we encountered U‐shaped fibres surrounding the inferior parietal lobule. However, these U‐shaped fibres did not interfere with fibre tract identification.
By contrast, in ex vivo dissection, the removal of these U‐shaped fibres was an essential independent step. At the subcortical level, short ‘U’ association fibres were encountered and exposed without technical difficulty on the lateral surface of the temporal lobe and the inferior parietal lobule (IPL). As theses fibres did not connect the frontal and temporal VAN components, we progressively removed the short association fibres.
3.2.3. Identification of the SLF III
The SLF III was identified by tractography and with Klingler’s method as the superficial tract connecting the upper and posterior parts of the TPJ to the posterior part of the frontal VAN components. The SLF III was the only tract connecting the supramarginal component of the TPJ to the frontal VAN.
The SLF III fibres were oriented horizontally. Many of the frontal fibres (50% in the dissected specimens) ran from the ventral portion of the precentral gyrus (cluster 5), and the posterior part of the pars opercularis (cluster 11), to the supramarginal gyrus (75%, cluster 1; Figure 3). In these cases, the SLF III connected VAN clusters 5 and 11 to cluster 1.
Figure 3.

Main anterior endpoint of the SLF III. (a) Klingler’s dissection. (b) Three‐dimensional tractography view. In white matter dissection and tractography, frontal fibres run from the ventral portion of the precentral gyrus (pcg), and the posterior part of the pars opercularis (IFG Pars op), to the supramarginal gyrus (smg). The arcuate fasciculus (AF) was located between the SLF III and deeper horizontal association fibres. These deeper fibres were exposed, and corresponded to the most lateral layer of the stratum sagittal (SS). * U‐shaped fibres [Colour figure can be viewed at wileyonlinelibrary.com]
We observed two patterns in terms of the anterior endpoints of this tract. The first was an exclusive connection with the ventral portion of the precentral gyrus (20%, Figure 4). This cortical area overlaps with cluster 5. The second was an exclusive connection with the posterior portion of the pars opercularis (10%, cluster 11). In the remaining 20% of subjects studied, it was impossible to determine the anterior endpoint of this tract. Two types of posterior endpoints were found for this tract: connection exclusively to the supramarginal gyrus (80%, cluster 1) and connection to both the supramarginal gyrus and the posterior part of the superior temporal gyrus (in the region just posterior to Heschl’s gyrus) (10%, cluster 1). In the remaining subjects, it was impossible to determine the anterior endpoint of this tract.
Figure 4.

Variation of the SLF III anterior endpoint: exclusive to the precentral gyrus (pcg). (a) Klingler’s dissection; (b) Three‐dimensional tractography [Colour figure can be viewed at wileyonlinelibrary.com]
3.2.4. Arcuate fasciculus
The AF was the second fibre tract connecting the lower part of the TPJ to the anterior part of the lateral frontal VAN component, including the VFC.
Tractography repeatedly showed the AF to be deeper than the SLF III. Similarly, during fibre dissections and after the lifting of the SLF III, the lateral surface of the long segment of the AF was completely exposed. The posterior portion of the long‐segment fibres of the AF were oriented vertically within the temporal lobe. Here, the AF fibres ran laterally and perpendicular to the fibres of the sagittal stratum (i.e. the densely packed fibres located on the lateral surface of the ventricular atrium and composed of the optic radiations, inferior fronto‐occipital fasciculus and tapetum), which are oriented horizontally (Figures 3 and 5). The AF fibres curved around the caudal limit of the insula and then ran off in a horizontal direction (Figures 3, 5 and 6) within the white matter of the parietal and frontal operculum.
Figure 5.

(a) Arcuate fasciculus dissection (AF). (b) Tractography of the arcuate fasciculus. The lower part of the TPJ is connected to the frontal part of the VAN by the arcuate fasciculus. Mfg: middle frontal gyrus; pcg, precentral gyrus; IFG pars op, inferior frontal gyrus pars opercularis; white arrowhead, caudal limit of the insula [Colour figure can be viewed at wileyonlinelibrary.com]
Figure 6.

(a) Fibre dissection of the white matter of the lateral part of the right hemisphere: After determining the anatomy of the cortex and identifying the cortical region of interest for the ventral attention network, we removed the cortex and subcortical ‘U’ association fibres from the study area (*) to expose longer association tracts. Progressing in a lateral to medial direction, the first long association bundle encountered in the temporoparietal junction was the superior longitudinal fasciculus in its third portion (SLF III, black arrowhead). Longer arcuate fibres directly linked the frontal and temporal lobes, running around the circular sulcus of the insula. In this specimen, the precentral, post‐central and the majority of the most of the inferior parietal gyri were removed. The exploration of the association fibres located medial to the SLF III (that is, the AF, white arrowhead) began with the section of the SLF III close to the supramarginal gyrus. (b) Tractography (sagittal slices) showing the white matter supporting the VAN. The SLF III (green) runs from the supramarginal gyrus (temporoparietal junction) to the ventral portion of the precentral gyrus and the pars opercularis (posterior part of the VFC). The AF (red) fibres connect the middle and inferior temporal gyrus (temporoparietal junction) and the middle and inferior frontal gyrus. agwm, angular gyrus white matter; AF, arcuate fasciculus; F1, superior frontal gyrus; F2, middle frontal gyrus; F3, inferior frontal gyrus; T1, superior temporal gyrus; T2, middle temporal gyrus, T3, inferior temporal gyrus; sts, superior temporal sulcus; mts, middle temporal sulcus [Colour figure can be viewed at wileyonlinelibrary.com]
The AF mostly had anterior endpoints connecting to the ventral portion of the precentral gyrus and the pars opercularis (65%, Figures 5 and 6, clusters 5 and 11), and posterior endpoints connecting to both the middle and inferior temporal gyrus (60%, Figure 3a and Figure 5, cluster 1).
The anterior endpoints of this bundle were also connected to the posterior middle frontal gyrus (20%, Figure 5, cluster 5) or to the pars triangularis (10%, cluster 2), whereas the posterior endpoints connected exclusively to the middle temporal gyrus (35%, cluster 1). The anterior and posterior terminations of this bundle were not determined in one Klingler dissection (5%) due to the prior destruction of the anatomy of the cortex through the extensive removal of grey matter. In our study, we identified no direct connections of the superior temporal gyrus and the frontal cortical area.
3.3. Comparison of the VAN cortical nodes and white matter bundles identified with the three techniques
The connectivity of the VAN determined by sICA was spatially and anatomically consistent with the white matter bundles studied with Klingler’s method and tractography. We found no direct white matter connection between the medial frontal activation peak (cluster 6, 7, 9) and the other activation peaks. In all specimens, the SLF III connected the upper and posterior parts of the TPJ (cluster 1) to the posterior part of the VFC (Figures 3, 5 and 6; clusters 5, 6). The SLF III was the only tract that connected the supramarginal component of the TPJ to the posterior frontal part of the VAN. Both the AF and the SLFIII connected the lower part of the TPJ to the VFC.
4. DISCUSSION
This study highlights the overlap between the cortical endpoints of the SLF III and the arcuate fasciculus and the connections of the VAN. The SLF III connects the supramarginal gyrus to the ventral portion of the precentral gyrus and the pars opercularis, whereas the AF connects the middle and inferior temporal gyrus to the middle and inferior frontal gyrus.
4.1. Comparison with published findings
We found that the SLF III and the AF structurally connected the VAN cortical nodes, located in the right TPJ and VFC. In the right hemisphere, the cortical areas and white matter fascicles involved in visuospatial cognition appeared to mirror those involved in language (Yagmurlu et al., 2016; Bernard et al., 2019), with a perisylvian network connecting the temporoparietal junction and the frontal inferior cortex. This study was not designed to compare language network and VAN anatomy, so we cannot draw definitive conclusions on this point. However, it could be argued that the cortical VAN activation peaks and white matter support display similarities to the features of the language network in the contralateral hemisphere. Is this apparent anatomical symmetry of the brain total or partial? This question has been heavily debated and has raised several other interesting questions concerning determinism and brain anatomy. For example, several diffusion tensor imaging (DTI) studies have reported a high prevalence of leftward asymmetry in perisylvian white matter volumes (Parker et al., 2005; Dorsaint‐Pierre et al., 2006). By contrast, some authors have reported the presence of a right arcuate fasciculus (AF) in only 40% of their subjects, whereas others have reported the presence of such a structure in all subjects studied (Gharabaghi et al., 2009), as reported here. Anatomically, the structure of the white matter may be considered mostly symmetric, as the counterparts of left‐hemisphere white matter fascicles have been identified in the right hemisphere. Moreover, most post‐mortem fibre dissection studies have reported no significant difference between the left and right white matter fascicles in terms of cortical endpoints (Yagmurlu et al., 2016) or fascicle volumes (Mars et al., 2011; Geng & Vossel, 2013; Yagmurlu et al., 2016).
As for language in the dominant hemisphere, the SLF III and the AF appear to constitute a major, but not exclusive, right‐sided component of visuospatial cognition (Yagmurlu et al., 2016; Bernard et al., 2019). Indeed, the VAN may also be involved in other right hemisphere functions relating to non‐verbal communication, such as the recognition of facial emotions and prosody (Sammler et al., 2015; Bernard et al., 2018b).
An understanding of the white matter supporting the functions of the VAN should shed light on USN. This condition is highly heterogeneous in terms of its severity and manifestations (Halligan & Marshall, 1992). It is a complex set of signs and symptoms, rather than a single syndrome (Bernard et al., 2018b). Studies based on structural brain imaging have identified three major cortical areas straddling the sylvian fissure, overlapping with our VAN cortical activation peaks as potentially responsible for the core deficit: (a) the VFC (Husain & Kennard, 1996; Committeri et al., 2007; Rengachary et al., 2011), (b) the TPJ (Vallar & Perani, 1986; Mort et al., 2003; Karnath et al., 2011; Rengachary et al., 2011; Chechlacz et al., 2012) and (c) the STG, MTG and underlying insula (Karnath et al., 2011; Rengachary et al., 2011; Chechlacz et al., 2012). Tract tracing, myelin staining and DTI techniques have suggested that a dense perisylvian network connects these three cortical sites (Karnath et al., 2011). These connections have been implicated in the brain lesions of patients suffering from USN in studies of single cases or small series of cases (Thiebaut de Schotten et al., 2005; He et al., 2007; Urbanski et al., 2008; Shinoura et al., 2009) and in a recent group study in which a statistical voxelwise lesion‐behaviour mapping approach was applied to a large cohort of patients with acute right hemisphere stroke (Karnath et al., 2011). Network dysfunction induced by damage to white matter tracts, such as the SLF III and the AF in particular, might provide a more detailed explanation as to why USN develops as a disconnection syndrome in large networks of connected brain areas (Bartolomeo et al., 2007).
Spatial neglect can be observed following injury to other white matter tracts. Several studies have suggested a role for the SLF II in VAN structural connectivity (Geng & Vossel, 2013), contrary to our findings. However, this tract seems to be more involved in associating the DAN and the VAN, because the SLF II has cortical endpoints in both attention systems (inferior parietal lobule and posterior dorsolateral prefrontal cortex). The SLF II may explain the functional disconnection between these two networks (Bartolomeo et al., 2007; Geng & Vossel, 2013; Zhang et al., 2017). Moreover, direct electrical stimulation during brain surgery in conscious patients and in DTI studies has revealed a potential rare involvement of the IFOF in USN. According to Herbet et al. (2017), the first reports highlighting the role of the right IFOF in USN suggested that signs of neglect may result from a deprivation of top‐down modulation from anterior frontal areas over the visual cortex, or a lack of visual input to the frontal areas (Urbanski et al., 2008; Bartolomeo, 2013; Herbet et al., 2017).
4.2. Limitations
The main limitation of R‐MRI lies in the difficulty distinguishing between the VAN and other resting‐state networks (RsN). The first step in R‐MRI was determining which of the 55 RsNs corresponded to the VAN, language and other networks. A major criterion for identifying the language RsN in healthy volunteers is an expected left‐lateralisation in right‐handed subjects. However, in clinical practice, 4%–18% of right‐handed individuals have been found to use their right hemisphere for language processing (Knecht et al., 2000). It may, therefore, be difficult to distinguish between the VAN and language networks in such patients. A distinction between the activation peaks for the VAN and language RsNs is crucial for correct identification of the VAN (Corbetta et al., 2008). The main difference between the VAN and language networks concerns the activation of the inferior parietal lobule. In the VAN, parietal lobe activity generally involves the supramarginal gyrus and the temporoparietal junction in both adults (Corbetta et al., 2008) and children (Sylvester et al., 2013). By contrast, in the language network, the angular gyrus is preferentially activated (Vigneau et al., 2006; Lemée et al., 2019). We detected no involvement of the angular gyrus in VAN activation peaks or in white matter support: the SLF III connected the supramarginal gyrus to the VFC.
Similarly, the distinction between the VAN and the salience network (SN) could be challenging. The definition of the VAN, like that of the AF, may be confusing due to the differences in nomenclature between studies. The VAN was first identified by R‐MRI by Fox et al. (2006) and was described as an RsN correlated to a region of interest that had been shown to be part of the SN (Uddin et al., 2011). Based on this initial description, (Srhidaran et al. 2007; Srhidaran et al., 2008) indiscriminately referred to the VAN and the SN as the same network. Recent studies of connectivity have shown that the VAN and SN are separate networks. In the study by Lemee et al. and several other major studies, the SN was identified on the basis of the presence of cingulo‐opercular components (Vigneau et al., 2006; Corbetta et al., 2008; Lemée et al., 2019). In our study, the VAN and the SN were clearly different spatial components.
Another limitation of R‐MRI analysis was reviewed by Lee et al. (2013; p. 2). Resting‐state data can be analysed in various ways, including seed‐based approaches, independent component analysis, graphical methods, clustering algorithms, neural networks and pattern classifiers. The advantage of ICA over seed‐based approaches is that it is data‐driven. However, it requires expert knowledge to identify the RsNs visually. Whatever the method used, several key issues must be considered, including test‐retest reproducibility and inter‐subject variability (Chou et al., 2012) concerning RsN detection.
Clinical inferences from R‐MRI must be tempered by our current lack of knowledge about the relationship between RsN and task‐induced activity. RsN may be defined as brain areas presenting statistically coherent activity during the acquisition time corresponding to a coherent fluctuation of the BOLD fMRI signal. Historically, such coherent activity at rest was first described in the motor sensory (Biswall) cortex. It was subsequently detected in areas involved in other cognitive functions, such as language. However, these networks were described at rest, and little is known about the dynamic interactions and recombination of areas of activity across them. Furthermore, the neural signal correlated to the BOLD effect analysed by fMRI appears to differ between networks.
Both gross fibre dissection and diffusion tensor imaging techniques present limitations that can affect the study of cortical connections. Fibre dissection is of limited value for studies of white matter connectivity in areas of crossing fibres. In the frontal operculum, the fibres of the AF intersect strongly with the terminal branches of other long association fascicles (particularly the IFOF and the frontal aslant tract) and the corticospinal tract. Conversely, dissection can isolate fibres of up to 2 mm in diameter. Moreover, in fibre dissection, the extensive removal of grey matter can lead to a loss of important cortical landmarks, making it difficult to analyse the precise cortical terminations of a specific fibre tract.
Imaging techniques are not subject to the same limitations but they are susceptible to noise, poor resolution, contamination from adjacent bundles and abrupt changes in fibre direction. Moreover, there is a large difference in the ages of subjects studied by fibre dissection (performed after the death of the subjects, who therefore tend to be old) and those studied by DTI tractography (usually young, healthy volunteers). This difference may affect the findings, as white matter connectivity may change with age. Nevertheless, the major observations were consistent across the subjects studied by DTI tractography and fibre dissection.
4.3. Perspectives
The exploitation of these results in current clinical practice is challenging. A better understanding of the interactions between cortical activation peaks on R‐MRI and fibre tracts would make it possible to prevent the creation of lesions leading to unilateral neglect during brain surgery. We are currently combining R‐MRI studies of the VAN with preoperative tractography, with a view to improving our understanding of the individual anatomical relationships between right‐side brain tumours and the functional networks involved in USN. The possible uses of these data in brain surgery on conscious patients are promising. However, as in activation‐functional MRI for exploring the cognitive function of the right hemisphere, it is essential to use specific tests that are reproducibly achievable during cortical electrical stimulation. USN can be identified clinically before or after surgery, but the development of a peroperative test for patients undergoing surgery in a conscious state remains difficult and is currently restricted to specific study protocols (Bernard et al., 2018a; Bernard & Menei, 2019).
5. CONCLUSION
We show here that the ventral attention network is structurally connected by the SLF III and the arcuate fasciculus. The SLF III connects the temporoparietal junction to the ventral frontal cortex in a horizontal and superficial manner. The arcuate fasciculus connects the lower part of the temporoparietal junction to the anterior part of the ventral frontal cortex in a more profound manner. A better knowledge of the white matter anatomy of the VAN would help neurosurgeons to preserve this functional network and to prevent postoperative unilateral neglect.
CONFLICT OF INTEREST
None of the authors has any conflict of interest or financial disclosure relating to this study to declare. This manuscript has not been published elsewhere, in whole or in part, or submitted elsewhere for review.
AUTHOR CONTRIBUTIONS
All the authors played a full role in this study. Dr Bernard performed the dissections and the literature review and wrote the manuscript. Dr Bernard, Dr Lemée and Dr Ter Minassian performed the resting state and tractography study (acquisition of data). Dr Mazerand, Dr Lemée, Dr Ter Minassian and Dr Leiber revised and corrected the elements of the manuscript and figures relating to neurosurgery and radiology (critical review of the manuscript). Prof. Menei and Dr Ter Minassian initiated this study, and revised and improved the elements of the manuscript dealing with neuroscience (concept/design, data analysis, critical review of the manuscript and approval of the article).
Acknowledgement
We than Fanny Leluan‐Higgins (native English speaker) for her insight and advice concerning this article.
Bernard F, Lemee J‐M, Mazerand E, Leiber L‐M, Menei P, Ter Minassian A. The ventral attention network: the mirror of the language network in the right brain hemisphere. J. Anat. 2020;237:632–642. 10.1111/joa.13223
Data availability statement
All authors shared new data along with the paper.
REFERENCES
- Bartolomeo, P. (2013) Attention Disorders after Right Brain Damage: Living in Halved Worlds. London: Springer. [Google Scholar]
- Bartolomeo, P. , Thiebaut de Schotten, M. and Doricchi, F. (2007) Left unilateral neglect as a disconnection syndrome. Cerebral Cortex, 17, 2479–2490. [DOI] [PubMed] [Google Scholar]
- Bernard, F. and Menei, P. (2019) Oncology meets art: A way to understand patients’ symptoms. The Lancet Oncology, 20, 27 10.1016/S1470-2045(18)30920-3 [DOI] [PubMed] [Google Scholar]
- Bernard, F. , Lemée, J.‐M. , Aubin, G. , Ter Minassian, A. and Menei, P. (2018a) Using a virtual reality social network during awake craniotomy to map social cognition: Prospective trial. Journal of Medical Internet Research, 20, e10332. [DOI] [PMC free article] [PubMed] [Google Scholar]
- Bernard, F. , Lemée, J.‐M. , Ter Minassian, A. and Menei, P. (2018b) Right hemisphere cognitive functions: From clinical and anatomic bases to brain mapping during awake craniotomy part i: clinical and functional anatomy. World Neurosurgery, 118, 348–359. [DOI] [PubMed] [Google Scholar]
- Bernard, F. , Zemmoura, I. , Ter Minassian, A. , Lemée, J.‐M. and Menei, P. (2019) Anatomical variability of the arcuate fasciculus: a systematical review. Surgical and Radiologic Anatomy, 41(8), 889–900 10.1007/s00276-019-02244-5 [DOI] [PubMed] [Google Scholar]
- Biswal, B. , Yetkin, F.Z. , Haughton, V.M. and Hyde, J.S. (1995) Functional connectivity in the motor cortex of resting human brain using echo‐planar MRI. Magnetic Resonance in Medicine, 34, 537–541. [DOI] [PubMed] [Google Scholar]
- Catani, M. , Jones, D.K. and ffytche, D.H. (2005) Perisylvian language networks of the human brain. Annals of Neurology, 57, 8–16. [DOI] [PubMed] [Google Scholar]
- Chechlacz, M. , Rotshtein, P. and Humphreys, G.W. (2012) Neuroanatomical dissections of unilateral visual neglect symptoms: ALE meta‐analysis of lesion‐symptom mapping. Frontiers in Human Neuroscience, 6, 230. [DOI] [PMC free article] [PubMed] [Google Scholar]
- Chou, Y.‐H. , Panych, L.P. , Dickey, C.C. , Petrella, J.R. and Chen, N.‐K. (2012) Investigation of long‐term reproducibility of intrinsic connectivity network mapping: A resting‐state fMRI study. American Journal of Neuroradiology, 33, 833–838. [DOI] [PMC free article] [PubMed] [Google Scholar]
- Committeri, G. , Pitzalis, S. , Galati, G. , Patria, F. , Pelle, G. , Sabatini, U. et al. (2007) Neural bases of personal and extrapersonal neglect in humans. Brain J Neurol, 130, 431–441. [DOI] [PubMed] [Google Scholar]
- Corbetta, M. , Patel, G. and Shulman, G.L. (2008) The reorienting system of the human brain: from environment to theory of mind. Neuron, 58, 306–324. [DOI] [PMC free article] [PubMed] [Google Scholar]
- Corbetta, M. and Shulman, G.L. (2011) Spatial neglect and attention networks. Annual Review of Neuroscience, 34, 569–599. [DOI] [PMC free article] [PubMed] [Google Scholar]
- Coupé, P. , Yger, P. , Prima, S. , Hellier, P. , Kervrann, C. and Barillot, C. (2008) An optimized blockwise nonlocal means denoising filter for 3‐D magnetic resonance images. IEEE Transactions on Medical Imaging, 27, 425–441. [DOI] [PMC free article] [PubMed] [Google Scholar]
- Damoiseaux, J.S. , Rombouts, S.A.R.B. , Barkhof, F. , Scheltens, P. , Stam, C.J. , Smith, S.M. et al. (2006) Consistent resting‐state networks across healthy subjects. Proceedings of the National Academy of Sciences of the United States of America, 103, 13848–13853. [DOI] [PMC free article] [PubMed] [Google Scholar]
- Doricchi, F. , Thiebautdeschotten, M. , Tomaiuolo, F. and Bartolomeo, P. (2008) White matter (dis)connections and gray matter (dys)functions in visual neglect: Gaining insights into the brain networks of spatial awareness. Cortex, 44, 983–995. [DOI] [PubMed] [Google Scholar]
- Dorsaint‐Pierre, R. , Penhune, V.B. , Watkins, K.E. , Neelin, P. , Lerch, J.P. , Bouffard, M. et al. (2006) Asymmetries of the planum temporale and Heschl’s gyrus: Relationship to language lateralization. Brain J Neurol, 129, 1164–1176. [DOI] [PubMed] [Google Scholar]
- Farrant, K. and Uddin, L.Q. (2015) Asymmetric development of dorsal and ventral attention networks in the human brain. Developmental Cognitive Neuroscience, 12, 165–174. [DOI] [PMC free article] [PubMed] [Google Scholar]
- Fillard, P. , Pennec, X. , Arsigny, V. and Ayache, N. (2007) Clinical DT‐MRI estimation, smoothing, and fiber tracking with log‐Euclidean metrics. IEEE Transactions on Medical Imaging, 26, 1472–1482. [DOI] [PubMed] [Google Scholar]
- Fox, M.D. , Snyder, A.Z. , Vincent, J.L. , Corbetta, M. , Van Essen, D.C. and Raichle, M.E. (2005) The human brain is intrinsically organized into dynamic, anticorrelated functional networks. Proceedings of the National Academy of Sciences of the United States of America, 102, 9673–9678. [DOI] [PMC free article] [PubMed] [Google Scholar]
- Fox, M.D. , Corbetta, M. , Snyder, A.Z. , Vincent, J.l and Raichle, M.E. (2006) Spontaneous neuronal activity distinguishes human dorsal and ventral attention systems. Proceedings of the National Academy of Sciences of the United States of America, 103, 10046–10051. [DOI] [PMC free article] [PubMed] [Google Scholar]
- Geng, J.J. and Vossel, S. (2013) Re‐evaluating the role of TPJ in attentional control: contextual updating? Neuroscience and Biobehavioral Reviews, 37, 2608–2620. [DOI] [PMC free article] [PubMed] [Google Scholar]
- Gharabaghi, A. , Kunath, F. , Erb, M. , Saur, R. , Heckl, S. , Tatagiba, M. et al. (2009) Perisylvian white matter connectivity in the human right hemisphere. BMC Neuroscience, 10, 15. [DOI] [PMC free article] [PubMed] [Google Scholar]
- Halligan, P.W. and Marshall, J.C. (1992) Left visuo‐spatial neglect: a meaningless entity? Cortex J Devoted Study Nerv Syst Behav, 28, 525–535. [DOI] [PubMed] [Google Scholar]
- He, B.J. , Snyder, A.Z. , Vincent, J.L. , Epstein, A. , Shulman, G.L. and Corbetta, M. (2007) Breakdown of functional connectivity in frontoparietal networks underlies behavioral deficits in spatial neglect. Neuron, 53, 905–918. [DOI] [PubMed] [Google Scholar]
- Heilman, K.M. and Van Den Abell, T. (1980) Right hemisphere dominance for attention: the mechanism underlying hemispheric asymmetries of inattention (neglect). Neurology, 30, 327–330. [DOI] [PubMed] [Google Scholar]
- Herbet, G. , Yordanova, Y.N. and Duffau, H. (2017) Left spatial neglect evoked by electrostimulation of the right inferior fronto‐occipital fasciculus. Brain Topography, 30, 747–756. [DOI] [PubMed] [Google Scholar]
- Husain, M. and Kennard, C. (1996) Visual neglect associated with frontal lobe infarction. Journal of Neurology, 243, 652–657. [DOI] [PubMed] [Google Scholar]
- Lemée, J.M. , Bernard, F. , Ter Minassian, A. and Menei, P. (2018) Right hemisphere cognitive functions: from clinical and anatomical bases to brain mapping in awake craniotomy Part II: Review about the previous experiences and reflexion about the neuropsychological tasks and their validity for awake surgery reste de la ref ? Neurosurgery;118:360–367. [DOI] [PubMed] [Google Scholar]
- Jehkonen, M. , Ahonen, J.P. , Dastidar, P. , Koivisto, A.‐M. , Laippala, P. , Vilkki, J. et al. (2000) Visual neglect as a predictor of functional outcome one year after stroke. Acta Neurologica Scandinavica, 101, 195–201. [DOI] [PubMed] [Google Scholar]
- Karnath, H.‐O. , Rennig, J. , Johannsen, L. and Rorden, C. (2011) The anatomy underlying acute versus chronic spatial neglect: A longitudinal study. Brain, 134, 903–912. [DOI] [PMC free article] [PubMed] [Google Scholar]
- Knecht, S. , Deppe, M. , Dräger, B. , Bobe, L. , Lohmann, H. , Ringelstein, E.‐B. et al. (2000) Language lateralization in healthy right‐handers. Brain, 123(Pt 1), 74–81. [DOI] [PubMed] [Google Scholar]
- Lawes, I.N.C. , Barrick, T.R. , Murugam, V. Spierings, N. , Evans, D.R. , Song, M. and Clark, C.A. (2008) Atlas‐based segmentation of white matter tracts of the human brain using diffusion tensor tractography and comparison with classical dissection. NeuroImage, 39, 62–79. [DOI] [PubMed] [Google Scholar]
- Le Goualher, G. , Barillot, C. and Bizais, Y. (1997) Modeling cortical sulci with active ribbons. International Journal of Pattern Recognition and Artificial Intelligence, 11, 1295–1315. [Google Scholar]
- Lee, M.H. , Smyser, C.D. and Shimony, J.S. (2013) Resting‐state fMRI: A review of methods and clinical applications. American Journal of Neuroradiology, 34, 1866–1872. [DOI] [PMC free article] [PubMed] [Google Scholar]
- Lemée, J.‐M. , Berro, H. , Bernard, F. , Leiber, L.‐M. , Menei, P. and Ter Minassian, A. et al. (2019) Resting‐state functional magnetic resonance imaging versus task‐based activity for language mapping and correlation with perioperative cortical mapping. Brain Behavior, 9(10), e01362. [DOI] [PMC free article] [PubMed] [Google Scholar]
- Lunven, M. and Bartolomeo, P. (2017) Attention and spatial cognition: Neural and anatomical substrates of visual neglect. Annals of Physical and Rehabilitation Medicine, 60, 124–129. [DOI] [PubMed] [Google Scholar]
- Lunven, M. , Thiebaut De Schotten, M. , Bourlon, C. , Duret, C. , Migliaccio, R. , Rode, G. et al. (2015) White matter lesional predictors of chronic visual neglect: A longitudinal study. Brain, 138, 746–760. [DOI] [PMC free article] [PubMed] [Google Scholar]
- Magro, E. , Moreau, T. , Seizeur, R. , Zemmoura, I. , Gibaud, B. and Morandi, X. (2014) Connectivity within the primary motor cortex: A DTI tractography study. Surgical and Radiologic Anatomy, 36, 125–135. 10.1007/s00276-013-1160-y [DOI] [PubMed] [Google Scholar]
- Marrelec, G. , Krainik, A. , Duffau, H. , Pélégrini‐Issac, M. , Lehéricy, S. , Doyon, J. et al. (2006) Partial correlation for functional brain interactivity investigation in functional MRI. NeuroImage, 32, 228–237. [DOI] [PubMed] [Google Scholar]
- Mars, R.B. , Jbabdi, S. , Sallet, J. , O’Reilly, J.X. , Croxson, P.l. , Olivier, E. et al. (2011) Diffusion‐weighted imaging tractography‐based parcellation of the human parietal cortex and comparison with human and macaque resting‐state functional connectivity. Journal of Neuroscience, 31, 4087–4100. [DOI] [PMC free article] [PubMed] [Google Scholar]
- Mesulam, M.M. (1990) Large‐scale neurocognitive networks and distributed processing for attention, language, and memory. Annals of Neurology, 28, 597–613. [DOI] [PubMed] [Google Scholar]
- Mesulam, M.M. (1999) Spatial attention and neglect: parietal, frontal and cingulate contributions to the mental representation and attentional targeting of salient extrapersonal events. Philosophical Transactions of the Royal Society of London. Series B, Biological sciences, 354, 1325–1346. [DOI] [PMC free article] [PubMed] [Google Scholar]
- Mitchell, T.J. , Hacker, C.D. , Breshears, J.D. , Szrama, N.P. , Sharma, M. , Bundy, D.T. et al. (2013) A novel data‐driven approach to preoperative mapping of functional cortex using resting‐state functional magnetic resonance imaging. Neurosurgery, 73, 969–983. [DOI] [PMC free article] [PubMed] [Google Scholar]
- Mori, S. and van Zijl, P. (2007) Human white matter atlas. American Journal of Psychiatry, 164, 1005. [DOI] [PubMed] [Google Scholar]
- Mort, D.J. , Malhotra, P. , Mannan, S.K. , Rorden, C. , Pambakian, A. , Kennard, C. et al. (2003) The anatomy of visual neglect. Brain J Neurol, 126, 1986–1997. [DOI] [PubMed] [Google Scholar]
- Parker, G.J.M. , Luzzi, S. , Alexander, D.C. , Wheeler‐Kingshott, C.A.M. , Ciccarelli, O. and Lambon Ralph, M.A. (2005) Lateralization of ventral and dorsal auditory‐language pathways in the human brain. NeuroImage, 24, 656–666. [DOI] [PubMed] [Google Scholar]
- Rengachary, J. , He, B.J. , Shulman, G.L. and Corbetta, M. (2011) A behavioral analysis of spatial neglect and its recovery after stroke. Frontiers in Human Neuroscience, 5, 29. [DOI] [PMC free article] [PubMed] [Google Scholar]
- Sammler, D. , Grosbras, M.‐H. , Anwander, A. , Bestelmeyer, P.E.G. and Belin, P. (2015) Dorsal and ventral pathways for prosody. Current Biology, 25, 3079–3085. [DOI] [PubMed] [Google Scholar]
- Schmahmann, J.D. and Pandya, D.N. (2007) Cerebral white matter–historical evolution of facts and notions concerning the organization of the fiber pathways of the brain. J Hist Neurosci, 16, 237–267. [DOI] [PubMed] [Google Scholar]
- Shinoura, N. , Suzuki, Y. , Yamada, R. , Tabei, Y. , Saito, K. and Yagi, K. (2009) Damage to the right superior longitudinal fasciculus in the inferior parietal lobe plays a role in spatial neglect. Neuropsychologia, 47, 2600–2603. [DOI] [PubMed] [Google Scholar]
- Shulman, G.L. , Pope, D.L.W. , Astafiev, S.V. and Corbetta, M. (2010) Right hemisphere dominance during spatial selective attention and target detection occurs outside the dorsal frontoparietal network. Journal of Neuroscience, 30, 3640–3651. [DOI] [PMC free article] [PubMed] [Google Scholar]
- Smith, S.M. , Fox, P.T. , Miller, K.L. , Glahn, D.C. , Fox, P.M. , Mackay, C.E. et al. (2009) Correspondence of the brain’s functional architecture during activation and rest. Proceedings of the National Academy of Sciences of the United States of America, 106, 13040–13045. [DOI] [PMC free article] [PubMed] [Google Scholar]
- Sridharan, D. , Levitin, D.J. , Chafe, C.H. , Berger, J. and Menon, V. (2007) Neural dynamics of event segmentation in music: Converging evidence for dissociable ventral and dorsal networks. Neuron, 55, 521–532. 10.1016/j.neuron.2007.07.003 [DOI] [PubMed] [Google Scholar]
- Sridharan, D. , Levitin, D.J. and Menon, V. (2008) A critical role for the right fronto‐insular cortex in switching between central‐executive and default‐mode networks. Proceedings of the National Academy of Sciences of the United States of America, 105, 12569–12574. [DOI] [PMC free article] [PubMed] [Google Scholar]
- Sylvester, C.M. , Barch, D.M. , Corbetta, M. , Power, J.D. , Schlaggar, B.L. and Luby, J.L. (2013) Resting state functional connectivity of the ventral attention network in children with a history of depression or anxiety. Journal of the American Academy of Child and Adolescent Psychiatry, 52, 1326–1336.e5. [DOI] [PMC free article] [PubMed] [Google Scholar]
- Thiebaut de Schotten, M. , Urbanski, M. , Duffau, H. , Volle, E. , Lévy, R. , Dubois, B. , et al. (2005) Direct evidence for a parietal‐frontal pathway subserving spatial awareness in humans. Science, 309, 2226–2228. [DOI] [PubMed] [Google Scholar]
- Uddin, L.Q. , Supekar, K.S. , Ryali, S. and Menon, V. (2011) Dynamic reconfiguration of structural and functional connectivity across core neurocognitive brain networks with development. Journal of Neuroscience, 31, 18578–18589. [DOI] [PMC free article] [PubMed] [Google Scholar]
- Umarova, R.M. , Saur, D. , Schnell, S. , Kaller, C.P. , Vry, M.‐S. , Glauche, V. et al. (2010) Structural connectivity for visuospatial attention: significance of ventral pathways. Cerebral Cortex, 20, 121–129. [DOI] [PubMed] [Google Scholar]
- Urbanski, M. , Thiebaut de Schotten, M. , Rodrigo, S. , Catani, M. , Oppenheim, C. , Touze, E. et al. (2008) Brain networks of spatial awareness: evidence from diffusion tensor imaging tractography. Journal of Neurology, Neurosurgery and Psychiatry, 79, 598–601. [DOI] [PMC free article] [PubMed] [Google Scholar]
- Vallar, G. and Perani, D. (1986) The anatomy of unilateral neglect after right‐hemisphere stroke lesions. A clinical/CT‐scan correlation study in man. Neuropsychologia, 24, 609–622. [DOI] [PubMed] [Google Scholar]
- Vigneau, M. , Beaucousin, V. , Hervé, P.Y. , Duffau, H. , Crivello, F. , Houdé, O. et al. (2006) Meta‐analyzing left hemisphere language areas: phonology, semantics, and sentence processing. NeuroImage, 30, 1414–1432. [DOI] [PubMed] [Google Scholar]
- Vuilleumier, P. , Armony, J.L. , Clarke, K. , Husain, M. , Driver, J. and Dolan, R.J. (2002) Neural response to emotional faces with and without awareness: Event‐related fMRI in a parietal patient with visual extinction and spatial neglect. Neuropsychologia, 40, 2156–2166. [DOI] [PubMed] [Google Scholar]
- Wedeen, V.J. , Wang, R.P. , Schmahmann, J.D. , Benner, T. , Tseng, W.Y.I. , Dai, G. et al. (2008) Diffusion spectrum magnetic resonance imaging (DSI) tractography of crossing fibers. NeuroImage, 41, 1267–1277. [DOI] [PubMed] [Google Scholar]
- Weinstein, D. , Kindlmann, G. and Lundberg, E. (1999) Tensorlines: Advection‐diffusion based propagation through diffusion tensor fields In Proceedings of the Conference on Visualization’99: Celebrating Ten Years. IEEE Computer Society Press, pp. 249–253. [Google Scholar]
- Wiest‐Daesslé, N. , Prima, S. , Morrissey, S.P. and Barillot, C. (2007) Validation of a new optimisation algorithm for registration tasks in medical imaging In 2007 4th IEEE International Symposium on Biomedical Imaging: From Nano to Macro. IEEE, pp. 41–44. [Google Scholar]
- Yagmurlu, K. , Middlebrooks, E.H. , Tanriover, N. and Rhoton, A.L. (2016) Fiber tracts of the dorsal language stream in the human brain. Journal of Neurosurgery, 124, 1396–1405. [DOI] [PubMed] [Google Scholar]
- Zhang, R. , Geng, X. and Lee, T.M.C. (2017) Large‐scale functional neural network correlates of response inhibition: an fMRI meta‐analysis. Brain Structure and Function, 222, 3973–3990. [DOI] [PMC free article] [PubMed] [Google Scholar]
Associated Data
This section collects any data citations, data availability statements, or supplementary materials included in this article.
Data Availability Statement
All authors shared new data along with the paper.