We described the HERV and MaLR transcriptome in PBMCs, finding that about 8.4% of the LTR retrotransposon loci were expressed and identifying the betaretrovirus-like HERVs as those with the highest percentage of expressed loci. We found 4,607 HERV and MaLR loci that were modulated as a result of in vivo stimulation with LPS. The HERV-H group showed the highest number of differentially expressed most intact proviruses. We characterized the HERV and MaLR loci as differentially expressed, checking their genomic context of insertion and observing a general colocalization with genes that are involved and modulated in the immune response, as a consequence of LPS stimulation. The analyses of HERV and MaLR expression and modulation show that these LTR retrotransposons are expressed in PBMCs and regulated in inflammatory settings. The similar regulation of HERVs/MaLRs and genes after LPS stimulation suggests possible interactions of LTR retrotransposons and the immune host response.
KEYWORDS: HERV, MaLR, PBMCs, LPS, immunity, RNA-Seq, human
ABSTRACT
Human endogenous retroviruses (HERVs) and mammalian apparent long terminal repeat (LTR) retrotransposons (MaLRs) are retroviral sequences that integrated into germ line cells millions of years ago. Transcripts of these LTR retrotransposons are present in several tissues, and their expression is modulated in pathological conditions, although their function remains often far from being understood. Here, we focused on the HERV/MaLR expression and modulation in a scenario of immune system activation. We used a public data set of human peripheral blood mononuclear cells (PBMCs) RNA-Seq from 15 healthy participants to a clinical trial before and after exposure to lipopolysaccharide (LPS), for which we established an RNA-Seq workflow for the identification of expressed and modulated cellular genes and LTR retrotransposon elements.
IMPORTANCE We described the HERV and MaLR transcriptome in PBMCs, finding that about 8.4% of the LTR retrotransposon loci were expressed and identifying the betaretrovirus-like HERVs as those with the highest percentage of expressed loci. We found 4,607 HERV and MaLR loci that were modulated as a result of in vivo stimulation with LPS. The HERV-H group showed the highest number of differentially expressed most intact proviruses. We characterized the HERV and MaLR loci as differentially expressed, checking their genomic context of insertion and observing a general colocalization with genes that are involved and modulated in the immune response, as a consequence of LPS stimulation. The analyses of HERV and MaLR expression and modulation show that these LTR retrotransposons are expressed in PBMCs and regulated in inflammatory settings. The similar regulation of HERVs/MaLRs and genes after LPS stimulation suggests possible interactions of LTR retrotransposons and the immune host response.
INTRODUCTION
A large proportion of the human genome consists of repeated elements, including human endogenous retroviruses (HERVs) and mammalian apparent long terminal repeat (LTR) retrotransposons (MaLRs) (1). These elements are remnants of ancestral and independent infections within the germ line cells that took place millions of years ago (2). At the time of integration, the HERV genome was composed of four retroviral genes (gag, pro, pol, and env) flanked by two LTRs. The genomic structure of MaLRs, being more ancient retroviral elements, is similar but characterized by the absence of the env gene (3, 4). Over time, most of these elements have accumulated abundant mutations, often compromising their coding capability. A great number of HERV insertions are now present as solitary LTRs, generated by recombination occurrences (2, 4), as clearly observable when comparing human LTR retrotransposons integrations with their orthologs in other primates (5, 6). The potential involvement of these elements in human biology has been investigated in several studies (7) which have shown the presence of few preserved retroviral open reading frames expressed in human tissues (8–10), including Syncytin-1, a functional HERV-W envelope protein that is involved in the trophoblastic cells fusion during placenta development (11, 12). Another important function of HERV and MaLR insertions is linked to species’ evolutionary development. For example, data suggest that the high density of HERV integrations had a role in promoting and maintaining the diversity of multigenic regions, as in the case of human major histocompatibility complex (13–15). Furthermore, the promoters, enhancers, and polyadenylation signals within the LTR sequence allow the proviral and solitary LTRs to play a role in the expression of certain host genes (16). More specifically, the integration of newly provided LTR regulatory signals in proximity of the ends of a host gene can result in the modulation of its expression (16), while the presence of viral promoters or polyadenylation signals near the gene or within its introns can lead to altered RNA splicing (16–19). In this respect, the HERV and MaLR contribution in shaping and influencing the human innate immunity is a topic of particular interest (20). Indeed, in some cases, LTR retrotransposon derived antigens could be recognized as pathogen-associated molecular patterns by pattern recognition receptors (PRRs), such as transmembrane Toll-like receptor proteins (21, 22). In these cases, the activation of PRRs evokes complex cellular signaling pathways altering gene expression to transduce proinflammatory signals (20). Even though, on the one hand, it has been hypothesized that these interactions with PRRs contribute positively in shaping the evolution of the immune response (21, 23), on the other hand, the same mechanisms have been investigated for their possible contribution to the development of autoimmunity and inflammatory diseases (9, 24–26), such as multiple sclerosis (27, 28). Accordingly, the activation of the immune response through treatments with LPS or tumor necrosis factor alpha (TNF-α) can lead to an increase in HERV and MaLR expression (29, 30). For instance, a recent microarray-based study revealed the in vitro modulation of HERV/MaLR expression in peripheral blood mononuclear cells (PBMCs) after high- and low-dose LPS and gamma interferon (IFN-γ) stimulation (29). A similar approach demonstrated HERV/MaLR in vivo modulation in samples of blood in various contexts of injuries, also introducing a possible role of HERVs/MaLRs close to immunity-related genes in the regulation of their expression (31). In any case, many questions regarding the actual role of HERV and MaLR expression in immunity are still unanswered, and, in this respect, the characterization of individual LTR retrotransposons’ genomic localization and coding capacity could help us to understand their potential effects (32). To identify possible interactions between LTR retrotransposons and the immune host response, we describe here the HERV and MaLR transcriptome in PBMC samples from patients stimulated in vivo with LPS. Indeed, this experimental design mimicked a Gram-negative induced inflammation. We focused our attention on the identification of HERV/MaLR loci that are expressed and modulated after stimulation with LPS. In addition, we checked for similar regulation of HERV/MaLR and gene expression.
RESULTS
Description of the LTR retrotransposon transcriptome in PBMCs.
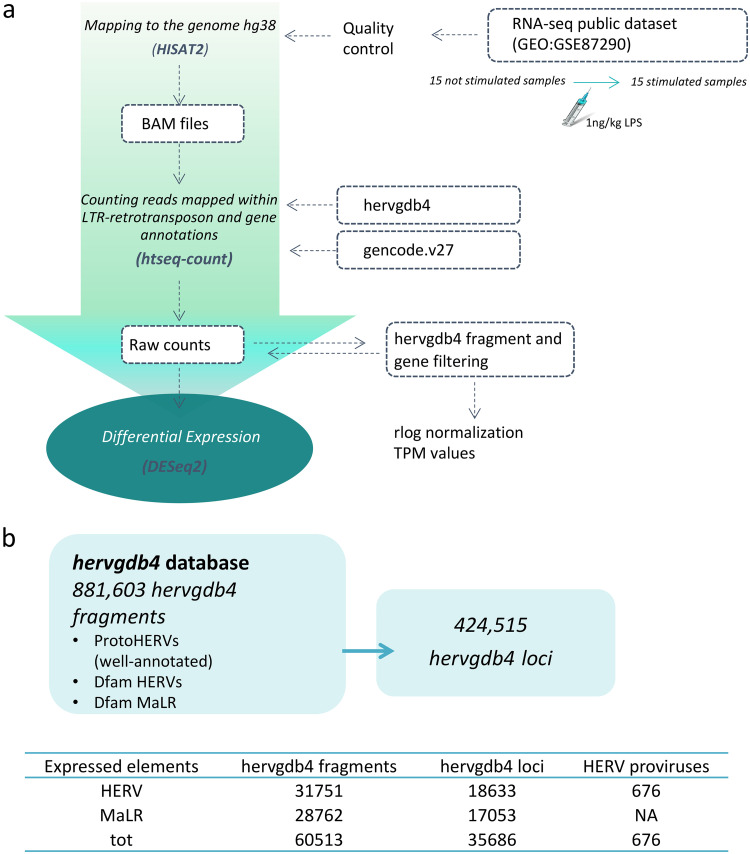
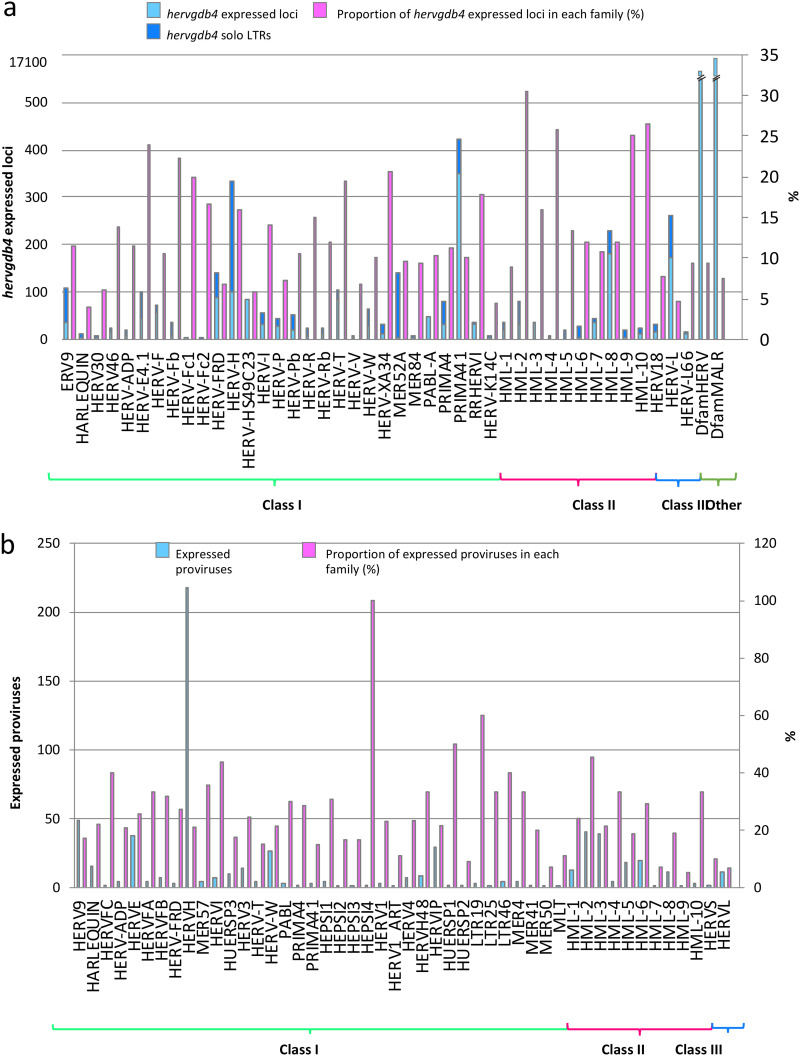
To detect the HERV/MaLR transcriptome in PBMCs, we defined an RNA-Seq pipeline to be used on a public RNA-Seq data set (GEO GSE87290) that included the PBMC transcriptome of 15 healthy volunteers before and 2 h after in vivo stimulation with 1 ng/kg LPS. The results showed that we were able to discriminate a total of 424,515 loci included in the hervgdb4 database, comprising 197,341 HERV loci and 227,174 MaLR loci (33). Of note, since the hervgdb4 database has been created as part of the design of Affymetrix HERV-V3 array probes (33), the HERV and MaLR loci are included in the database as 881,603 hervgdb4 fragments (single genes or functional portion of LTRs) belonging to 424,515 loci (Fig. 1) (33). Moreover, according to the annotation accuracy of the fragments and to their source, the loci were part of two different subsets: (i) the highly informative HERV_prototypes and (ii) the roughly annotated HERV_Dfam and MaLR_Dfam, both collected from the Dfam database (Fig. 1) (34). Our analysis showed that 18,633 HERV hervgdb4 loci and 17,053 MaLR hervgdb4 loci were expressed in both stimulated and unstimulated PBMC samples, for a total of 35,686 loci accounting for ∼8.4% of the LTR retrotransposons in the human genome (Fig. 1). The majority of the expressed LTR retrotransposons were part of the roughly annotated HERV_Dfam and MaLR_Dfam subset, for which no information about the groups was available. Among the expressed loci included in the well-annotated HERV_prototypes, 2,084 were members of the class I gamma/epsilon-like, 527 of the class II beta-like, and 310 of the class III spuma-like (Fig. 2a). When considering only the absolute number of expressed loci, just ahead form the HERV-H group, the PRIMA41 group was the one most represented. Instead, when considering the percentage of expressed HERV_prototype loci among the total members of the same group, the most recently integrated group HERV-K(HML-2) showed the highest transcriptional activity, with more than 30% of expressed loci. The HML-10, HML-8, and HML-9 groups were also very active, with a proportion of 25.8, 26.4, and 25% expressed loci, respectively. In general, the class II beta-like groups showed the greatest percentage of overall activation. The proportions of expressed proviruses compared to solitary LTRs within the I, II, and III classes were 55, 61, and 64%, respectively (data not shown).
FIG 1.
Experimental design of differential expression analysis. (a) RNA-Seq workflow for the identification of modulated HERVs and MalRs. The input files used are given in blue boxes. (b) Scheme showing the composition of the hervgdb4 database. The amounts of expressed hervgdb4 fragments and loci were obtained by filtering the raw counts and are summarized in the table at the bottom of the figure. The coordinates of the expressed ReTe most-intact proviruses were obtained by using the findOverlaps function from package Iranges and the coordinates of the expressed hervgdb4 fragments.
FIG 2.
LTR retrotransposon transcriptome in PBMCs. (a and b) Basal expression of the hervgdb4 loci (a) and of the mostly intact HERV loci reported in Vargiu et al. (4) (b) in PBMCs. All of the expressed elements are arranged by retroviral classes and groups.
In order to better define the HERV transcriptome in PBMCs and to assess the link between transcriptional activity and HERV integrity, we decided to analyze the most intact proviruses as identified, classified, and characterized by Vargiu et al. (4). These sequences have been collected after analysis of the human genome assembly GRCh 37/hg19 with the software RetroTector (ReTe), which searched for the presence of conserved retroviral motif hits and reconstructed from these the coordinates of 3,173 HERVs satisfying distance constraints (4, 35). Using these data sets, we identified 723 expressed ReTe proviruses, finding also in this case a large proportion of expressed beta-like elements. HML-4 (6 of 12 ReTe proviruses) and HERV-K(HML-2) (43 of 92 ReTe proviruses) were the most active groups (Fig. 2b). The group with the highest number of expressed ReTe proviruses was the class I gamma-like HERV-H with 241 active loci, representing 23% of the whole group.
Distinct transcriptional patterns induced by LPS stimulation.
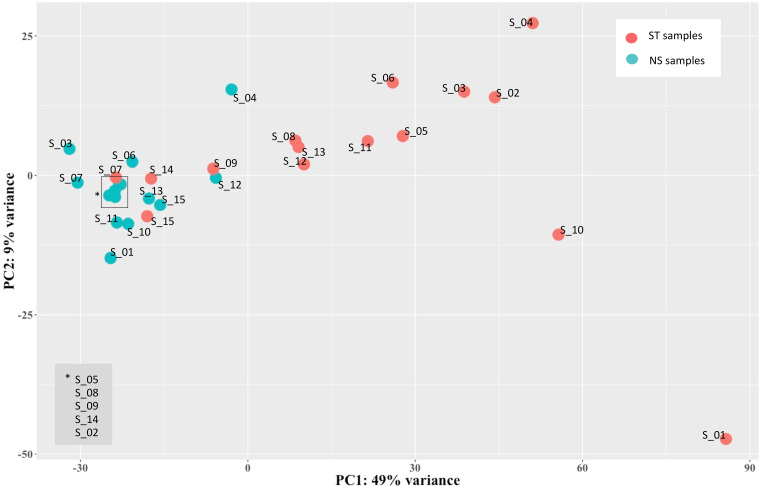
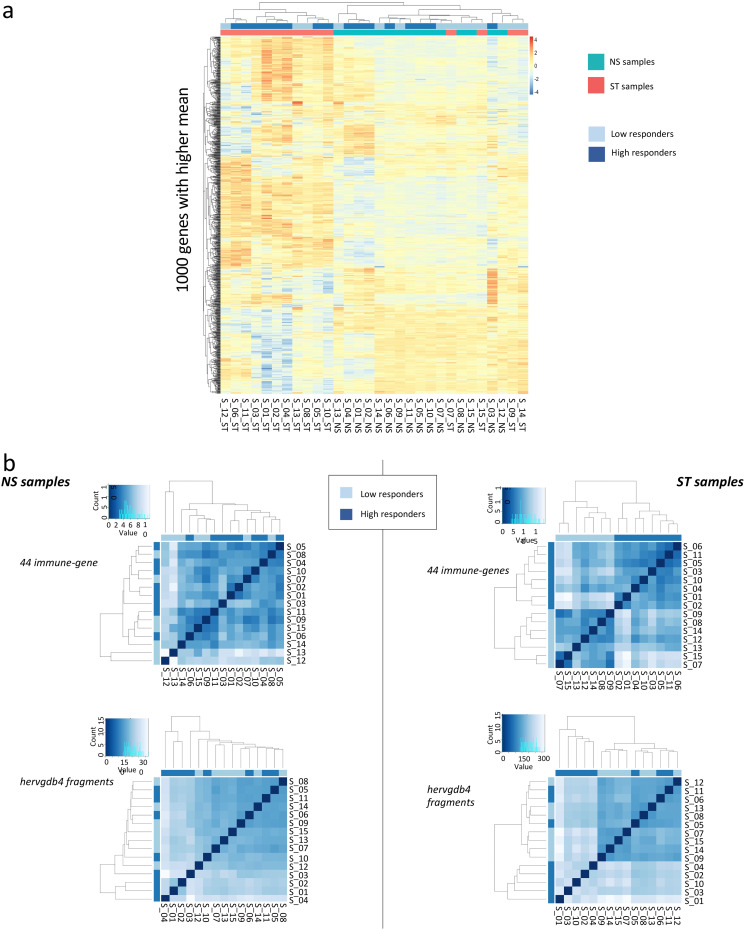
Next, aiming to assess the variability across the 30 PBMC samples and to detect specific signatures induced by LPS stimulation, we analyzed the expression data of hervgdb4 fragments using unsupervised principal component analysis (PCA) (Fig. 3). The first principal component (PC1) explained the 49% of the variance across samples, and the clustering was specifically related to the LPS response, showing differences in HERV/MaLR expression between LPS-stimulated and unstimulated samples. Of note, the LPS-stimulated samples 7, 9, 14, and 15 clustered together with the unstimulated ones. These data suggested that the LPS response is the principal determinant defining the HERV/MaLR expression intersample variability, showing patterns of hervgdb4 fragments’ activation specific for each of the two conditions. We further investigated the transcriptional signatures of the samples by performing hierarchical clustering on the 1,000 hervgdb4 fragments with the highest mean of read counts across samples (Fig. 4a). The results showed clear differences in the expression of hervgdb4 fragments across samples in relation to LPS stimulation. However, both PCA and hierarchical clustering analyses showed that the LTR retrotransposon expression profile of samples 7, 9, 14, and 15 after LPS stimulation was similar to the profiles of the LPS-unstimulated samples. Such behavior was confirmed by hierarchical clustering performed on the 1,000 human genes with the highest mean of reads count among samples, in which the same four samples showed again the typical profiles of the LPS-unstimulated ones (data not shown). This result suggests the presence of transcriptional differences among samples depending on interindividual variability to immune response, which in turn affected both LTR retrotransposon and cellular gene expression. Hence, we tried to obtain more information on the interpersonal reaction to LPS by investigating the pattern of expression of a subset of 44 genes that had been previously reported to be a specific signature of induced cytokine response (36). As shown in the heatmap of sample-to-sample Euclidean distances, while in the absence of stimulation no evident differences between samples were found for these 44 genes, after LPS injection, two clusters that reflected the traits of the inflammatory response were observed, clearly dividing high responders from low responders (Fig. 4b). Of note, since these 44 genes were shown to be able of deconvoluting complex responses to immune stimulation, we expected that the variability between low and high responders would be well defined. Subsequently, we analyzed the Euclidean sample-to-sample distances as defined by the expression of all the hervgdb4 fragments (Fig. 4b). Interestingly, as shown for the 44 immunity genes, also for hervgdb4 fragments no sample clustering was observed in the LPS-unstimulated sample, whereas in LPS-stimulated samples two clusters were formed, roughly corresponding to the previously identified low and high responders to immune stimulation. However, the three low-responder samples clustering with the high-responder ones did not coincide with the four LPS-stimulated samples that showed a pattern of hervgdb4 fragment expression similar to the LPS-unstimulated samples in Fig. 4a, suggesting that factors other than the severity of inflammatory response may contribute to (rather than interfere with) the interindividual variability for hervgdb4 fragment expression.
FIG 3.
PCA of samples. PCA was performed on rlog-normalized hervgdb4 fragment expression data. It is possible to see the division between nonstimulated and stimulated samples according to the PC1.
FIG 4.
Heatmaps of the overall similarity between samples. (a) Hierarchical clustering of the top 1,000 hervgdb4 fragments with the highest average of rlog-normalized counts. The top 1,000 hervgdb4 fragments are in rows, and the samples are in columns. rlog-normalized counts are color-scaled from blue (minimum) to red (maximum). Correlation distance measure has been used in clustering columns. Samples are annotated by condition (aquamarine, not stimulated; red, LPS stimulated) and inflammatory response (light blue, low responders; deep blue, high responders). The two clusters highlight specific signatures induced by LPS. (b) Hierarchical clustering of the Euclidean sample-to-sample distance before (NS samples) and after LPS injection (ST samples). We searched for difference related to the pattern of expression of the 44 genes that captured the diversity of complex innate immune responses (36) (44 immune genes) and of the hervgdb4 fragments. The distance values are blue scaled, as represented in the color key and histogram legends. The state of inflammatory response of each sample are indicated in light blue (low responders) and deep blue (high responders). High and low responders showed different responses to inflammation.
Differential LTR retrotransposon expression in PBMCs.
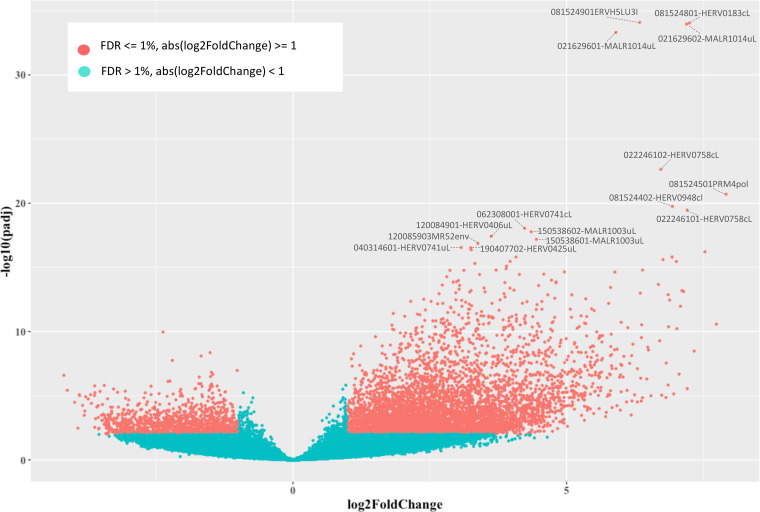
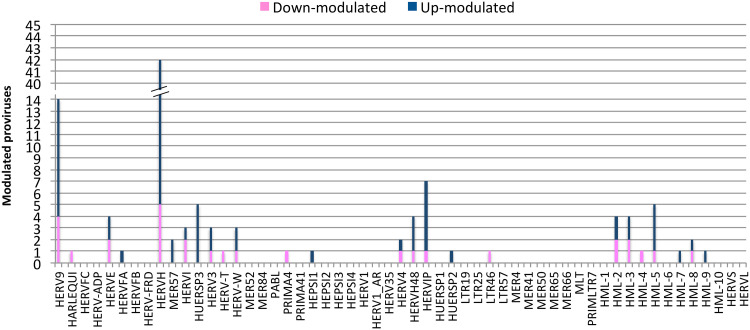
Once we determined that the variability across samples mostly fitted with LPS stimulation, we evaluated the hervgdb4 fragments for differential expression between the two conditions. After applying a statistical filter (false discovery rate [FDR] ≤ 0.01 and absolute log2-fold change values of ≥1), we identified a total of 6,452 (11% of the total expressed) differentially expressed hervgdb4 fragments (see Table S1 in the supplemental material). We represented all the expressed hervgdb4 fragments in a volcano plot, where they are indicated as points that spread according to the log2-fold change on the x axes and to the adjusted P value on the y axes (Fig. 5). It is worth noting that the great majority of hervgdb4 fragments were upregulated, showing a general trend of LTR retrotransposon upregulation in PBMCs after LPS stimulation. In fact, among the 6,452 hervgdb4 fragments, 5,383 (83%) were upregulated, while 1,069 (17%) were downregulated after stimulation (Table 1). The mentioned differentially expressed 6,452 hervgdb4 fragments belonged to 4,607 hervgdb4 loci, including 3,688 loci (80%) upregulated and 919 loci (20%) downregulated. We then focused on the mostly intact ReTe HERV proviruses, observing that 115 of them were differentially expressed (17% of the ReTe HERV expressed proviruses): 86 were upregulated, while 29 were downregulated. Of the 55 HERV differentially overexpressed groups, 6 included only upregulated proviruses, 13 included both up- and downregulated proviruses and 5 only-downregulated proviruses (Fig. 6). Importantly, we found 23 groups that were constitutively expressed in PBMCs but were not differentially expressed by the stimulation.
FIG 5.
Differential HERV/MaLR expression analysis. Volcano plot of the differentially expressed hervgbd4 fragments. Each point represents hervgbd4 fragments, which spread according to the log2-fold change (x axis) and the log10-adjusted P values (y axis). Red points indicate significantly modulated hervgbd4 fragments. For 15 hervgbd4 fragments with the lowest adjusted P values, the names are indicated.
TABLE 1.
LTR retrotransposon modulationa
| Category | No. expressed |
No. modulated |
||
|---|---|---|---|---|
| Non-DE | DE (%)b | Upmodulated | Downmodulated | |
| hervgdb4 fragments | 53,799 | 6,714 (12) | 5,460 | 1,254 |
| hervgdb4 loci | 32,890 | 2,796 (8) | 1,720 | 1,076 |
| HERV proviruses | 614 | 62 (10) | 46 | 16 |
Different proportions of up- and downregulated hervgdb4 fragments, hervgdb4 loci, and ReTe proviruses in PBMCs after in vivo LPS stimulation. DE, differentially expressed.
Proportion of expressed elements that are modulated.
FIG 6.
Differentially expressed ReTe HERV proviruses. A bar plot shows the distribution of differentially expressed ReTe HERV proviruses across retroviral groups. The y axes represent the number of modulated proviruses, and the family groups are indicated on the x axis. Different colors show up- and downregulation.
Concordant modulation of LTR retrotransposons and colocalized immunity-related genes.
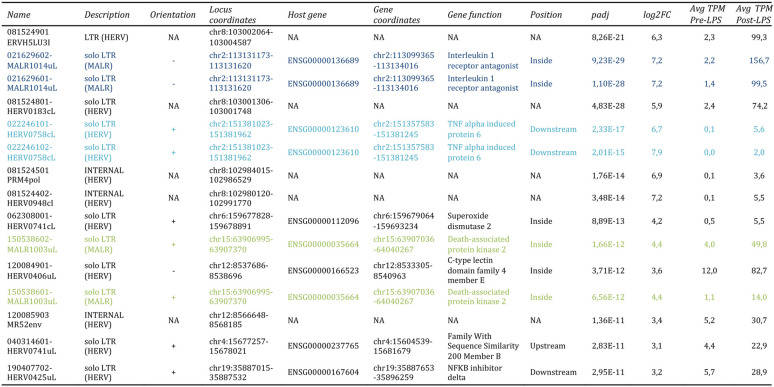
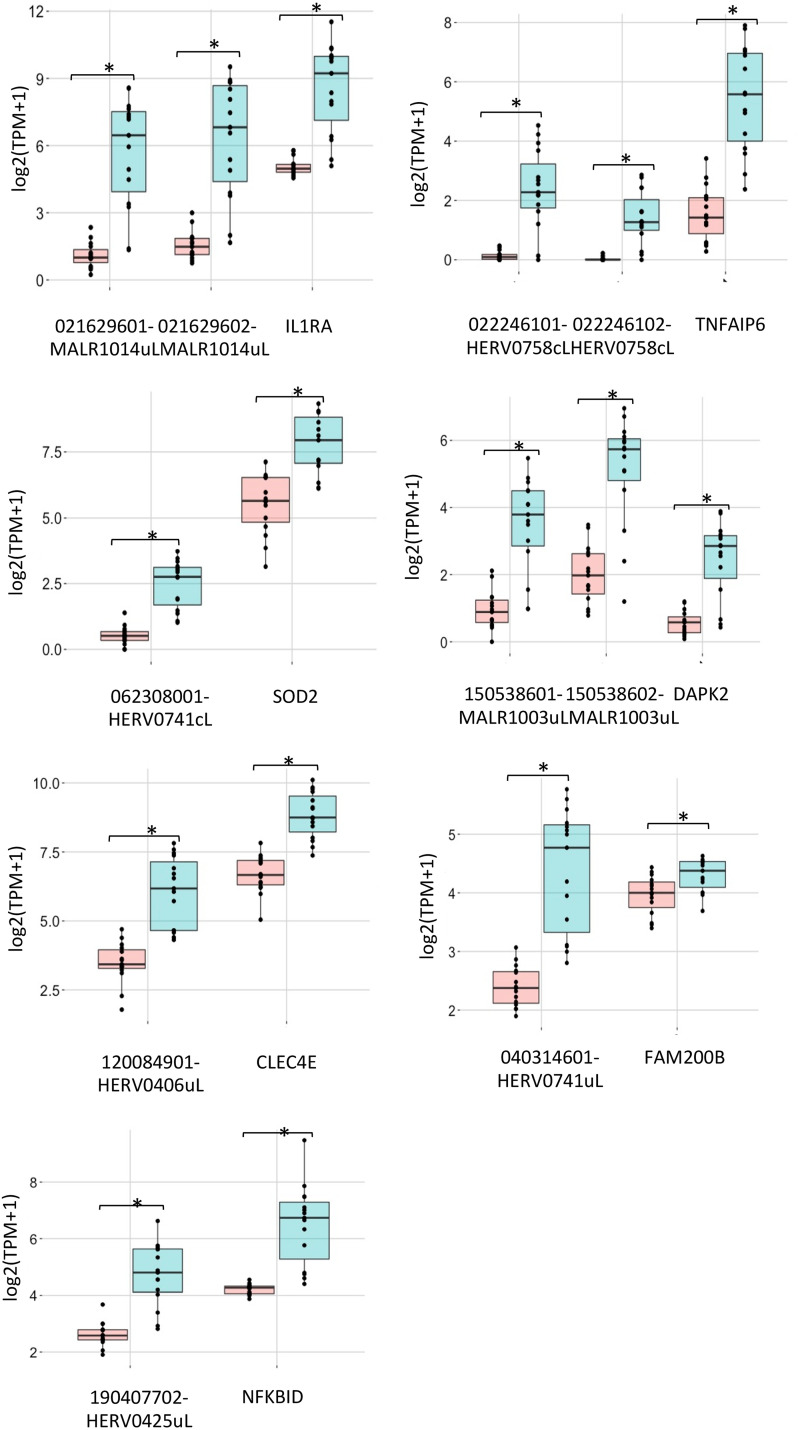
To gain more insights into the LTR retrotransposon modulation, we focused on the 15 hervgdb4 fragments with the highest differential expression according to their adjusted P value (Table 2 and Fig. 5). Importantly, all these 15 highly modulated hervgdb4 fragments were upregulated after LPS stimulation. We used transcript-per-million (TPM) normalization to quantify the expression levels of the fragments before and after the LPS stimulation (Table 2) and, subsequently, we investigated their context of insertion. Interestingly, we found that, among the 15 most highly modulated LTR retrotransposons, 10 were neighbor integrations (within a 10-kb window of distance) of human coding genes. In particular, 6 of them were inside, 3 were downstream, and 1 was upstream of the colocalized gene. We therefore analyzed the modulation of these human genes, observing that all of them were upregulated as a consequence of LPS stimulation, as summarized in Fig. 7. The fragment with the lowest adjusted P value (6.99E–36) was 081524901ERVH5LU3I, at coordinates chr8:103002077-103002365. This fragment is the U3 region of a 5′LTR belonging to a HERVH provirus (chr8:103002064-103004587), and its expression levels were increased from an average TPM value of 2.4 to an average TPM value of 124.5 after LPS stimulation. It is worth noting that, even if this LTR sequence is not colocalized with coding genes, it is integrated into a promoter-flanking region that is affected by copy number variation according to ENSEMBL annotations (data not shown), possibly suggesting a potential transcriptional control role. Also, fragment 081524801-HERV0183cL, part of a solo LTR (chr8:103001306-103001748) within the same region as 081524901ERVH5LU3I, increased its average TPM value from 2.4 to 74.2. Fragments 021629602-MALR1014uL and 021629601-MALR1014uL were part of the same solo LTR at coordinates chr2:113131173-113131620. This solo LTR is integrated within the intron of the interleukin-1 receptor antagonist gene (IL-1RA), which codes for a protein known to have an anti-inflammatory role (37). Both gene and solo-LTR significantly increased their expression levels after LPS administration, showing high average TPM values in stimulated samples (Table 2). Similarly, fragments 022246101-HERV0758cL and 022246102-HERV0758cL, part of the same solo LTR at coordinates chr2:113131173-113131620, showed a pattern of upregulation comparable with their neighbor gene, namely, TNF-α-induced protein 6 (TNFAIP6). Thus, in this case, the solo LTR is colocalized with a gene that is involved in immunity, having a known regulatory function (38). Instead, fragments 081524501PRM4pol and 081524402-HERV0948cI, which are portions of the internal regions in proviral loci chr8:102984015-102986529 and chr8:102980120-102991770, respectively, were found to be intergenic integration. The basal expression levels of both fragments were 0.1 TMP, increasing to 3.6 and 5.5 TPM, respectively, after stimulation. Next, we found that fragment 062308001-HERV0741cL, a solo LTR in chr6:159677828-159678891, is integrated within the intron of the superoxide dismutase 2 gene. Of note, fragments 150538602-MALR1003uL and 150538601-MALR1003uL, both part of a solo LTR in chr15:63906995-63907370, showed an average TPM increase from 3.7 and 1.0 to 49.7 and 14.9, respectively, after stimulation and are integrated within the 3′ untranslated region of the death-associated protein kinase 2 (DAPK2) gene. Fragment 120084901-HERV0406uL, a solo LTR in locus chr12:8537686-8538696, is integrated inside the C-type lectin domain family 4 member E (CLEC4E) gene and increased its average TPM values from 1.0 to 87.2. The fragments 120085903MR52env (chr12:8566648-8568185), representing an intergenic integration, and 040314601-HERV0741uL (chr4:15677257-15678021), being inserted upstream the family with sequence similarity 200 member B gene (FAM200B), showed a >5-fold increase in average TPM after LPS stimulation. Finally, the fragment at coordinates chr19:35887015-35887532, which increased its average TPM values from 5.7 to 28.9, is integrated downstream of the NF-κB inhibitor delta gene.
TABLE 2.
Top 15 most DE hervgdb4 fragmentsa
The table provides a description of the 15 most differentially expressed (DE) hervgdb4 fragments, including their expression levels indicated as transcript-per-million (TPM) values and their context of insertion. Fragments with the same locus are highlighted by the same colors.
FIG 7.
Coregulation of hervgbd4 fragments and human genes. A boxplot shows the TMP expression values of the hervgbd4 fragments colocalized with human genes and neighbor genes. The red boxes indicate values from nonstimulated samples; blue boxes indicate values from stimulated samples. Significant modulations according to DESeq2 analysis (Padj < 0.01) are marked by asterisks.
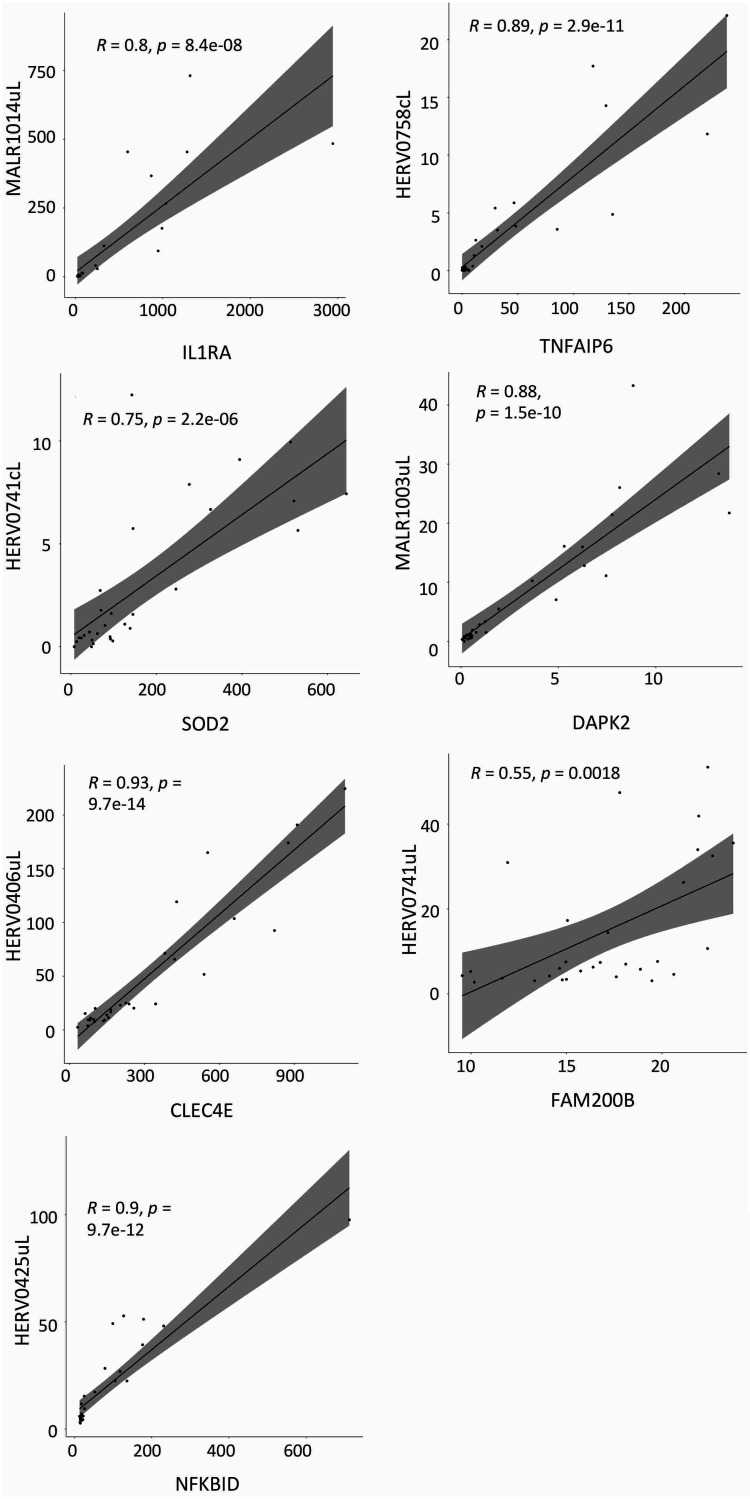
For all these HERVs and MaLRs colocalized with human genes, we hypothesized a correlation between their expression levels. We hence visualized the TPM values in scatterplots and measured the Pearson correlation (Fig. 8), which allows to quantify possible linear correlation between two variables. In all cases, the correlation coefficients (R) were positive, indicating a positive linear correlation between HERVs/MaLRs and colocalized immunity-related genes. In particular, we observed a strong correlation (R > 0.7) between all the HERVs/MaLRs and gene pairs, except for that between HERV0741uL (chr4:15677257-15678021) and the FAM200B gene.
FIG 8.
Scatterplots of hervgbd4 fragments and human gene expression. TMP expression values of the hervgbd4 fragments colocalized with human genes and neighbor genes are visualized in scatterplots, where the linear regression curve is quantified by Pearson correlation. Correlation coefficients (R) and P values for such correlations are indicated in each plot. All scatterplots show a positive (R > 0) linear correlation between the hervgbd4 fragment and gene TPM values.
To assess a possible impact of the 10 HERV and MaLR elements on the expression of colocalized cellular genes, we then reconstructed the transcripts associated with their genomic positions in the human genome. In particular, we were interested in the presence of chimeric transcripts, including within their sequences both LTR retrotransposon and gene portions. The results indicated that no chimeric transcript was present, so that all the 10 HERV and MaLR elements were shown to be transcriptional units different from those of the genes (data not shown).
DISCUSSION
We used an RNA-Seq approach and the hervgdb4 database (33) to obtain an overview of the specific LTR retrotransposon transcriptome in PBMCs. This analysis has allowed us, for the first time, to investigate the comprehensive HERV and MaLR proviruses and solo-LTR expression in human patients mimicking Gram-negative bacterial infection, reveling a total of 35,686 LTR retrotransposon elements expressed in PBMCs.
Previously, the same database has been used by Mommert et al. (29) to identify expressed and modulated loci in an ex vivo system of LPS stimulation and endotoxin tolerance through microarray analyses (29). In this regard, the percentage of expressed elements in this in vivo model (6.8% of hervgdb4 fragments and 8.4% of hervgdb4 loci expressed) was slightly higher than the one measured in in vitro experiments (5.6% of hervgdb4 fragments). Among all HERV groups, class II members appeared to be the most active ones, with HERV-K(HML-2) being the most expressed group in PBMCs. This group is also one of the most investigated due to recent HERV-K(HML-2) integrations and the hypothesized implication of some of the active loci in several diseases (39–42). Groups belonging to class III were indeed generally less active. In comparison to Mommert et al. (29), who reported an abundant activation of class I and of all class III groups, the LTR retrotransposon expression among classes showed some differences. These differences can be explained by (i) the technologies and methods that have been used (in vivo versus ex vivo, microarray versus RNA-Seq) and (ii) the great differences in the basal transcriptional activity of each individual, which have been already observed in PBMCs (43). Moreover, the use of the Vargiu et al. database (4) has allowed to analyze the expression of the most intact HERV proviruses, for which it is possible to hypothesize a higher likelihood of protein production. Of note, the pattern of counts distribution among classes of the most intact HERV proviruses is similar to the one obtained when considering the hervgdb4 loci, and it is mostly in agreement with the information on HERV-H, HERV-K(HML-2), HERV-E, and HERV-W transcriptional activity in PBMCs that have been reported in previous studies (37). However, such studies provided information on the overall expression of the above groups but no information on the individual loci, here reported for the first time. Moreover, the expression of HERV-E has been previously reported to be characteristic of only a small percentage of the subjects analyzed, while a large portion of both hervgdb4 loci (the 24% of the group) and most intact HERVs (the 28% of the group) was observed to be expressed in PBMCs in the present study.
The analysis of the variability among the 30 samples analyzed showed differences between nonstimulated and LPS-stimulated samples. Indeed, in both PCA analysis and hierarchical clustering the nonstimulated and stimulated samples spread in two distinct clusters. However, a great interpersonal variability in the response of patients to LPS is also evident. This heterogeneity in the HERVs and MaLRs expression, as a consequence of LPS stimulus, is in line with the already observed strong interindividual variability of gene expression in response to microbial agents (36, 44). Importantly, the definition of such variability should be a necessary foundation for better understanding a possible implication of HERV and MaLR expression in immunity and diseases.
The analysis of in vivo HERV and MaLR modulation revealed a total of 6,452 hervgdb4 fragments modulated in PBMCs, with a clear trend of upregulation induced by LPS response (81%). In comparison to Mommert et al. (29), in which 111 differentially expressed HERVs and MaLRs (44 downregulated and 67 upregulated) have been identified, a larger number of differentially expressed elements was observed, which can be explained by the different sensitivity of the methods used. Specifically, only 18 of the modulated hervgdb4 fragments identified by Mommert et al. are included in the present results, suggesting that the two models are not equal but complementary. Moreover, another study has identified a list of LTR retrotransposons that were IFN induced (45), and a proportion of them (about 16%) were observed in this study to be also LPS induced (data not shown). This highlights the importance of investigating the LTR retrotransposon modulation in several conditions, but it also suggests that distinctive patterns of LTR retrotransposon induction, if used as a biomarker, may become indicative to separate physiological from pathological conditions. The LPS stimulus also provoked a strong activation of the most intact ReTe proviruses. Importantly, not all the groups responded in the same way to the LPS stimulation.
Among the 15 most modulated hervgdb4 fragments, 10 were colocalized with human genes. We used the average expression level of the most differentially expressed human gene, IL1A (ENSG00000115008), which showed an average TMP of 19.4 after LPS stimulation (data not shown), for comparison to understand a possible biological meaning of the expression of the fragments we observed to be modulated. In general, all the fragments are not only modulated, but they are also generally medium or highly expressed. Among 12 hervgdb4 loci, 10 are LTRs, including 9 solo LTRs. Such an observation could be integrated in other studies on transcription factor binding sites (TFBS) provided by HERVs and MaLRs (14), including those for NF-κB, IRFs, and STATs, suggesting a possible HERV and MaLR activation in immunity (46, 47). In addition, 10 hervgdb4 fragments are neighbor integrations of human genes that are also activated after the inflammatory response. Of particular interest is the identification of three solo LTRs localized outside the modulated genes, since the possible presence of promoters or polyadenylation signals may play a role in the regulation of the nearby gene. Specifically, the solo LTRs in chr2:151381023-151381962 and chr19:35887015-35887532 are integrated downstream of the TNF-α-induced protein 6 gene (TNFAIP6) and NF-κB inhibitor delta (NFKBID), respectively. Interestingly, although the most differentially expressed genes identified are mainly those coding for proteins that are positive regulators of immunity, such as IL-1A and IL-1B (data not shown), these data showed a strong upregulation of LTR retrotransposons colocalized with genes coding for cellular inhibitors of these proteins. Hence, if on the one hand it has been suggested that a subset of HERVs hold TFBSs (47) that may increase their activation in immunity, on the other hand, the gene products of TNFAIP6 and NFKBID are potentially able to inhibit this phenomenon (48, 49). For this reason, these data underline the complexity of the relationship between the HERV/MaLR modulation and the immune response, especially if hypothesizing their active role in the regulation of the colocalized immunity-related genes. The results we obtained on the evaluation of the transcripts in the region of the higher concordant modulation of HERVs/MaLRs and the neighboring genes suggested that these elements are not included in chimeric transcripts with the genes. However, these data cannot exclude a role of LTR retrotransposons on the regulation of genes related to immunity, since more focused analyses would be necessary to investigate the phenomenon. Moreover, the positive linear correlation we observe between HERVs, MaLRs, and immunity-related genes suggest that the expression of particular HERVs and MaLRs could be used as markers of the immune activation and of the expression of immunity-related genes.
Indeed, present data may give the basis to clarify the LTR retrotransposons’ involvement in the regulation of immune functions, but further studies are needed to clarify these mechanisms and may help us to understand how HERVs and MaLRs contribute to the complexity of immune response.
Conclusions.
We used RNA-Seq transcriptome data from 15 healthy participants to a clinical trial injected with LPS to identify expressed and modulated LTR retrotransposon elements. Such an RNA-Seq-based approach revealed the basal expression of 18,633 HERV hervgdb4 loci, including those of 723 most intact ReTe proviruses and of 17,053 MaLR hervgdb4 loci in PBMCs. To assess the specific signatures induced by LPS, we investigated the sample-to-sample differences, which showed a specific pattern of hervgdb4 fragments expression as a consequence of inflammation. We therefore evaluated the hervgdb4 fragments modulation, identifying a total of 6,452 differentially expressed elements, observing a general trend of activation of the LTR retrotransposons after LPS stimulation. Of note, the HERV/MaLR regulation was similar to that of colocalized cellular genes, suggesting possible interactions between LTR retrotransposons and the immune response. We observed that HERV and MaLR loci are responsive to immune activation and that there is a strong correlation between their expression and the expression of certain genes that are immunity related. This suggests possible applications of HERVs and MaLRs as biomarkers in immunity settings, and it highlights the importance of investigating the role of LTR retrotransposon expression in the context of activation of the immune response and autoimmunity. However, further analyses are required to evaluate whether such modulation is involved in the regulation of immune response and to better assess the significance of LTR retrotransposon expression in immunity.
MATERIALS AND METHODS
RNA-Seq data and quality control.
We used a publicly available RNA-Seq data set (GEO GSE87290), including the transcriptome of PBMCs from healthy humans (n = 15) before and after 1 ng/kg LPS exposure. Specifically, whole blood RNA samples were collected at baseline and at 2 h after LPS stimulation. PBMCs were isolated from whole blood immediately after collection (50).
We checked the quality of the RNA sequences by using FastQC Galaxy version 0.72 (http://www.bioinformatics.babraham.ac.uk/projects/fastqc). Low-quality reads were trimmed with Trim Galore! v.0.4.3.1 (https://github.com/FelixKrueger/TrimGalore). All of the mentioned analyses were performed using locally installed Galaxy release_17.09 (http://galaxyproject.org/).
Reads mapping and counting.
HISAT2 Galaxy version 2.1.0 was used with default parameters to map reads to genome assembly hg38. We assessed the quality of the alignments by using the stats function of bamtools Galaxy version 2.0.1 (51). We counted the reads mapping to each hervgdb4 fragment and human gene by using the “union” mode in htseq-count Galaxy version 0.6.1galaxy3 (52), the hervgdb4 database (33), and gencode.v27 (53) for, respectively, LTR retrotransposon and gene annotations. All of the mentioned analyses were done on locally installed Galaxy release_17.09. We calculated the expression values of the expressed hervgdb4 fragments and genes as transcripts per million (TPM).
Raw data filtering and transcriptome analysis.
We selected all the genes and hervgdb4 fragments with at least 1 count in at least 10 samples, conventionally considering them as expressed in at least one experimental condition, and we used the obtained data for the analysis of HERV/MaLR transcriptome in PBMCs. We used the GenomicRanges v.1.30.3 (54) R (v3.4.4) package to obtain the coordinates of the most intact HERV proviruses (4) from those of the expressed hervgdb4 fragments.
Hierarchical clustering.
The DESeq2 v.1.18.1 R (v3.4.4) package (55) has been used to perform regularized logarithm transformation (rlog) normalization on human genes and HERV/MaLR raw counts. From the output of the normalization, we extracted the HERV/MaLR rlog counts, and we assessed the interpersonal variability through PCA and heatmapping. The PCA was built with the function plotPCA in DESeq2 v.1.18.1 and visualized using ggplot 3.0.0 in R (v3.4.4). The Heatmap of the 1000 hervgdb4 fragments with the higher average rlog counts across samples was built through the pheatmap 1.0.10 R (v3.4.4) package, considering the correlation distance across samples in column. The “dist” function in DESeq2 v.1.18.1 was applied to the transpose of the rlog transformed count matrix to get Euclidean sample-to-sample distances; the heatmaps were built using the pheatmap 1.0.10 R (v3.4.4) package.
Differential gene and hervgdb4 fragment expression analysis.
We performed a differential expression analysis of the genes and hervgdb4 fragments by using the DESeq2.v.1.18.1 R (version 3.4.4) package (55) and the filtered raw counts as input. During the analysis, the FDR and adjusted P value were used for multiple test comparisons according to the Benjamini-Hochberg procedure (56). We used a threshold (FDR ≤ 0.01 and absolute values of log2-fold change ≥ 1) to identify the modulated elements. The differentially expressed hervgdb4 fragments were visualized in a volcano plot built by using ggplot 3.0.0 in R (v3.4.4). We sorted the hervgdb4 fragments by adjusted P values to recognize the mostly differentially expressed. We compared the TPM expression values with the filtered adjusted P values (≤0.01) to determine the relative distributions, as described in Fig. 1. We manually checked for the presence of neighbor genes on ENSEMBL (57), within a 10-kb window of distance from the nearest-neighbor gene. For the 10 most modulated elements colocalized with human genes, we reconstructed the transcripts. The transcripts were reconstructed using Trinity v2.5.1 (58) on a subset of reads mapping in genome ranges that included the LTR retrotransposons, the human gene, and a flanking region of 500 bp. The transcripts have been mapped to the genome assembly hg38 by gmap-2019.09.12 (59) and finally visualized in Integrative Genomics Viewer (IGV) (60). The limits of the LTR retrotransposons analyzed have been manually inspected through the sashimi-plot function of IGV.
Supplementary Material
ACKNOWLEDGMENTS
This work was supported by grants from the Ministero dell’Istruzione, dell’Università e della Ricerca (CCI2014IT16M2OP005).
Footnotes
Supplemental material is available online only.
REFERENCES
- 1.Hattori M. 2005. Finishing the euchromatic sequence of the human genome. Tanpakushitsu Kakusan Koso 50:162–168. [PubMed] [Google Scholar]
- 2.Bannert N, Kurth R. 2006. The evolutionary dynamics of human endogenous retroviral families. Annu Rev Genomics Hum Genet 7:149–173. doi: 10.1146/annurev.genom.7.080505.115700. [DOI] [PubMed] [Google Scholar]
- 3.Smit A. 1993. Identification of a new, abundant superfamily of mammalian LTR-transposons. Nucleic Acids Res 21:1863–1872. doi: 10.1093/nar/21.8.1863. [DOI] [PMC free article] [PubMed] [Google Scholar]
- 4.Vargiu L, Rodriguez-Tomé P, Sperber GO, Cadeddu M, Grandi N, Blikstad V, Tramontano E, Blomberg J. 2016. Classification and characterization of human endogenous retroviruses; mosaic forms are common. Retrovirology 13:2–29. doi: 10.1186/s12977-015-0232-y. [DOI] [PMC free article] [PubMed] [Google Scholar]
- 5.Grandi N, Cadeddu M, Blomberg J, Mayer J, Tramontano E. 2018. HERV-W group evolutionary history in non-human primates: characterization of ERV-W orthologs in Catarrhini and related ERV groups in Platyrrhini. BMC Evol Biol 18:6–14. doi: 10.1186/s12862-018-1125-1. [DOI] [PMC free article] [PubMed] [Google Scholar]
- 6.Grandi N, Cadeddu M, Blomberg J, Tramontano E. 2016. Contribution of type W human endogenous retrovirus to the human genome: characterization of HERV-W proviral insertions and processed pseudogenes. Retrovirology 13:1–25. doi: 10.1186/s12977-016-0301-x. [DOI] [PMC free article] [PubMed] [Google Scholar]
- 7.Grandi N, Pisano MP, Tramontano E. 2019. The emerging field of human endogenous retroviruses: understanding their physiological role and contribution to diseases. Future Virol 14:441–444. doi: 10.2217/fvl-2019-0061. [DOI] [Google Scholar]
- 8.Seifarth W, Frank O, Zeilfelder U, Spiess B, Greenwood AD, Hehlmann R, Leib-Mösch C. 2005. Comprehensive analysis of human endogenous retrovirus transcriptional activity in human tissues with a retrovirus-specific microarray. J Virol 79:341–352. doi: 10.1128/JVI.79.1.341-352.2005. [DOI] [PMC free article] [PubMed] [Google Scholar]
- 9.Grandi N, Tramontano E. 2018. HERV envelope proteins: physiological role and pathogenic potential in cancer and autoimmunity. Front Microbiol 9:1–26. [DOI] [PMC free article] [PubMed] [Google Scholar]
- 10.Schiavetti F, Thonnard J, Colau D, Boon T, Coulie PG. 2002. A human endogenous retroviral sequence encoding an antigen recognized on melanoma by cytolytic T lymphocytes. Cancer Res 62:5510–5516. [PubMed] [Google Scholar]
- 11.Blond J-L, Lavillette D, Cheynet V, Bouton O, Oriol G, Chapel-Fernandes S, Mandrand B, Mallet Fois, Cosset F-L. 2000. An envelope glycoprotein of the human endogenous retrovirus HERV-W is expressed in the human placenta and fuses cells expressing the type D mammalian retrovirus receptor. J Virol 74:3321–3329. doi: 10.1128/JVI.74.7.3321-3329.2000. [DOI] [PMC free article] [PubMed] [Google Scholar]
- 12.Mi S, Lee X, Li X, Veldman GM, Finnerty H, Racie L, LaVallie E, Tang XY, Edouard P, Howes S, Keith JC, McCoy JM. 2000. Syncytin is a captive retroviral envelope protein involved in human placental morphogenesis. Nature 403:785–789. doi: 10.1038/35001608. [DOI] [PubMed] [Google Scholar]
- 13.Doxiadis GGM, de Groot N, Bontrop RE. 2008. Impact of endogenous intronic retroviruses on major histocompatibility complex class II diversity and stability. J Virol 82:6667–6677. doi: 10.1128/JVI.00097-08. [DOI] [PMC free article] [PubMed] [Google Scholar]
- 14.Pisano MP, Grandi N, Cadeddu M, Blomberg J, Tramontano E. 2019. Comprehensive characterization of the human endogenous retrovirus HERV-K(HML-6) group: overview of structure, phylogeny, and contribution to the human genome. J Virol 93:1–19. doi: 10.1128/JVI.00110-19. [DOI] [PMC free article] [PubMed] [Google Scholar]
- 15.Grandi N, Cadeddu M, Pisano MP, Esposito F, Blomberg J, Tramontano E. 2017. Identification of a novel HERV-K(HML10): comprehensive characterization and comparative analysis in non-human primates provide insights about HML10 proviruses structure and diffusion. Mob DNA 8:1–18. [DOI] [PMC free article] [PubMed] [Google Scholar]
- 16.van de Lagemaat LN, Medstrand P, Mager DL. 2006. Multiple effects govern endogenous retrovirus survival patterns in human gene introns. Genome Biol 7:R86–R84. doi: 10.1186/gb-2006-7-9-r86. [DOI] [PMC free article] [PubMed] [Google Scholar]
- 17.Pi W, Zhu X, Wu M, Wang Y, Fulzele S, Eroglu A, Ling J, Tuan D. 2010. Long-range function of an intergenic retrotransposon. Proc Natl Acad Sci U S A 107:12992–12997. doi: 10.1073/pnas.1004139107. [DOI] [PMC free article] [PubMed] [Google Scholar]
- 18.Macfarlan TS, Gifford WD, Driscoll S, Lettieri K, Rowe HM, Bonanomi D, Firth A, Singer O, Trono D, Pfaff SL. 2012. Embryonic stem cell potency fluctuates with endogenous retrovirus activity. Nature 487:57–63. doi: 10.1038/nature11244. [DOI] [PMC free article] [PubMed] [Google Scholar]
- 19.Grow EJ, Flynn RA, Chavez SL, Bayless NL, Wossidlo M, Wesche DJ, Martin L, Ware CB, Blish CA, Chang HY, Pera RAR, Wysocka J. 2015. Intrinsic retroviral reactivation in human preimplantation embryos and pluripotent cells. Nature 522:221–225. doi: 10.1038/nature14308. [DOI] [PMC free article] [PubMed] [Google Scholar]
- 20.Grandi N, Tramontano E. 2018. Human endogenous retroviruses are ancient acquired elements still shaping innate immune responses. Front Immunol 9:1–16. [DOI] [PMC free article] [PubMed] [Google Scholar]
- 21.Hurst TP, Magiorkinis G. 2015. Activation of the innate immune response by endogenous retroviruses. J Gen Virol 96:1207–1218. doi: 10.1099/jgv.0.000017. [DOI] [PubMed] [Google Scholar]
- 22.Chiappinelli KB, Strissel PL, Desrichard A, Li H, Henke C, Akman B, Hein A, Rote NS, Cope LM, Snyder A, Makarov V, Budhu S, Slamon DJ, Wolchok JD, Pardoll DM, Beckmann MW, Zahnow CA, Merghoub T, Chan TA, Baylin SB, Strick R. 2015. Inhibiting DNA methylation causes an interferon response in cancer via dsRNA including endogenous retroviruses. Cell 162:974–986. doi: 10.1016/j.cell.2015.07.011. [DOI] [PMC free article] [PubMed] [Google Scholar]
- 23.Aswad A, Katzourakis A. 2012. Paleovirology and virally derived immunity. Trends Ecol Evol 27:627–636. doi: 10.1016/j.tree.2012.07.007. [DOI] [PubMed] [Google Scholar]
- 24.Mangeney M, Renard M, Schlecht-Louf G, Bouallaga I, Heidmann O, Letzelter C, Richaud A, Ducos B, Heidmann T. 2007. Placental syncytins: genetic disjunction between the fusogenic and immunosuppressive activity of retroviral envelope proteins. Proc Natl Acad Sci U S A 104:20534–20539. doi: 10.1073/pnas.0707873105. [DOI] [PMC free article] [PubMed] [Google Scholar]
- 25.Meylan F, De Smedt M, Leclercq G, Plum J, Leupin O, Marguerat S, Conrad B. 2005. Negative thymocyte selection to HERV-K18 superantigens in humans. Blood 105:4377–4382. doi: 10.1182/blood-2004-07-2596. [DOI] [PubMed] [Google Scholar]
- 26.Hummel J, Kämmerer U, Müller N, Avota E, Schneider-Schaulies S. 2015. Human endogenous retrovirus envelope proteins target dendritic cells to suppress T-cell activation. Eur J Immunol 45:1748–1759. doi: 10.1002/eji.201445366. [DOI] [PubMed] [Google Scholar]
- 27.Madeira A, Burgelin I, Perron H, Curtin F, Lang AB, Faucard R. 2016. MSRV envelope protein is a potent, endogenous and pathogenic agonist of human Toll-like receptor 4: relevance of GNbAC1 in multiple sclerosis treatment. J Neuroimmunol 291:29–38. doi: 10.1016/j.jneuroim.2015.12.006. [DOI] [PubMed] [Google Scholar]
- 28.De La Hera B, Varadé J, García-Montojo M, Alcina A, Fedetz M, Alloza I, Astobiza I, Leyva L, Fernández O, Izquierdo G, Antigüedad A, Arroyo R, Álvarez-Lafuente R, Vandenbroeck K, Matesanz F, Urcelay E. 2014. Human endogenous retrovirus HERV-Fc1 association with multiple sclerosis susceptibility: a meta-analysis. PLoS One 9:e90182. doi: 10.1371/journal.pone.0090182. [DOI] [PMC free article] [PubMed] [Google Scholar]
- 29.Mommert M, Tabone O, Oriol G, Cerrato E, Guichard A, Naville M, Fournier P, Volff JN, Pachot A, Monneret G, Venet F, Brengel-Pesce K, Textoris J, Mallet F. 2018. LTR-retrotransposon transcriptome modulation in response to endotoxin-induced stress in PBMCs. BMC Genomics 19:1–17. doi: 10.1186/s12864-018-4901-9. [DOI] [PMC free article] [PubMed] [Google Scholar]
- 30.Johnston JB, Silva C, Holden J, Warren KG, Clark AW, Power C. 2001. Monocyte activation and differentiation augment human endogenous retrovirus expression: implications for inflammatory brain diseases. Ann Neurol 50:434–442. doi: 10.1002/ana.1131. [DOI] [PubMed] [Google Scholar]
- 31.Tabone O, Mommert M, Jourdan C, Cerrato E, Legrand M, Lepape A, Allaouchiche B, Rimmelé T, Pachot A, Monneret G, Venet F, Mallet F, Textoris J. 2019. Endogenous retroviruses transcriptional modulation after severe infection, trauma, and burn. Front Immunol 10:1–12. [DOI] [PMC free article] [PubMed] [Google Scholar]
- 32.Grandi N, Tramontano E. 2017. Integrations and their mobilization by L1 machinery: contribution to the human transcriptome and impact on the host physiopathology. Viruses 9:162–137. doi: 10.3390/v9070162. [DOI] [PMC free article] [PubMed] [Google Scholar]
- 33.Becker J, Pérot P, Cheynet V, Oriol G, Mugnier N, Mommert M, Tabone O, Textoris J, Veyrieras JB, Mallet F. 2017. A comprehensive hybridization model allows whole HERV transcriptome profiling using high density microarray. BMC Genomics 18:286–214. doi: 10.1186/s12864-017-3669-7. [DOI] [PMC free article] [PubMed] [Google Scholar]
- 34.Hubley R, Finn RD, Clements J, Eddy SR, Jones TA, Bao W, Smit AFA, Wheeler TJ. 2016. The Dfam database of repetitive DNA families. Nucleic Acids Res 44:D81–D89. doi: 10.1093/nar/gkv1272. [DOI] [PMC free article] [PubMed] [Google Scholar]
- 35.Sperber G, Lövgren A, Eriksson N, Benachenhou F, Blomberg J. 2009. RetroTector online, a rational tool for analysis of retroviral elements in small and medium size vertebrate genomic sequences. BMC Bioinformatics 10:S4–S7. doi: 10.1186/1471-2105-10-S6-S4. [DOI] [PMC free article] [PubMed] [Google Scholar]
- 36.Urrutia A, Duffy D, Rouilly V, Posseme C, Djebali R, Illanes G, Libri V, Albaud B, Gentien D, Piasecka B, Hasan M, Fontes M, Quintana-Murci L, Albert ML, Abel L, Alcover A, Astrom K, Bousso P, Bruhns P, Cumano A, Demangel C, Deriano L, Di Santo J, Dromer F, Eberl G, Enninga J, Fellay J, Freitas A, Gelpi O, Gomperts-Boneca I, Hercberg S, Lantz O, Leclerc C, Mouquet H, Pellegrini S, Pol S, Rogge L, Sakuntabhai A, Schwartz O, Schwikowski B, Shorte S, Soumelis V, Tangy F, Tartour E, Toubert A, Ungeheuer MN, Quintana-Murci L, Albert ML, Milieu Intérieur Consortium. 2016. Standardized whole-blood transcriptional profiling enables the deconvolution of complex induced immune responses. Cell Rep 16:2777–2791. doi: 10.1016/j.celrep.2016.08.011. [DOI] [PubMed] [Google Scholar]
- 37.Arend WP, Gabay C. 2000. Physiologic role of interleukin-1 receptor antagonist. Arthritis Res 2:245–245. doi: 10.1186/ar94. [DOI] [PMC free article] [PubMed] [Google Scholar]
- 38.Lee TH, Wisniewski HG, Vilcek J. 1992. A novel secretory tumor necrosis factor-inducible protein (TSG-6) is a member of the family of hyaluronate binding proteins, closely related to the adhesion receptor CD44. J Cell Biol 116:545–557. doi: 10.1083/jcb.116.2.545. [DOI] [PMC free article] [PubMed] [Google Scholar]
- 39.Subramanian RP, Wildschutte JH, Russo C, Coffin JM. 2011. Identification, characterization, and comparative genomic distribution of the HERV-K (HML-2) group of human endogenous retroviruses. Retrovirology 8:90. doi: 10.1186/1742-4690-8-90. [DOI] [PMC free article] [PubMed] [Google Scholar]
- 40.Young GR, Terry SN, Manganaro l, Cuesta-Dominguez A, Deikus G, Bernal-Rubio D, Campisi L, Fernandez-Sesma A, Sebra R, Simon V, Mulder LCF. 2017. HIV-1 infection of primary CD4+ T cells regulates the expression of specific human endogenous retrovirus HERV-K (HML-2) elements. J Virol 92:1–13. doi: 10.1128/JVI.01507-17. [DOI] [PMC free article] [PubMed] [Google Scholar]
- 41.Mayer J, Harz C, Sanchez L, Pereira GC, Maldener E, Heras SR, Ostrow LW, Ravits J, Batra R, Meese E, García-Pérez JL, Goodier JL. 2018. Transcriptional profiling of HERV-K (HML-2) in amyotrophic lateral sclerosis and potential implications for expression of HML-2 proteins. Mol Neurodegener 13:39. doi: 10.1186/s13024-018-0275-3. [DOI] [PMC free article] [PubMed] [Google Scholar]
- 42.Ma W, Hong Z, Liu H, Chen X, Ding L, Liu Z, Zhou F, Yuan Y. 2016. Human endogenous retroviruses-k (HML-2) expression is correlated with prognosis and progress of hepatocellular carcinoma. Biomed Res Int 2016:1–9. doi: 10.1155/2016/8201642. [DOI] [PMC free article] [PubMed] [Google Scholar]
- 43.Balestrieri E, Pica F, Matteucci C, Zenobi R, Sorrentino R, Argaw-Denboba A, Cipriani C, Bucci I, Sinibaldi-Vallebona P. 2015. Transcriptional activity of human endogenous retroviruses in human peripheral blood mononuclear cells. Biomed Res Int 2015:164529–164529. doi: 10.1155/2015/164529. [DOI] [PMC free article] [PubMed] [Google Scholar]
- 44.Ferguson JF, Patel PN, Shah RY, Mulvey CK, Gadi R, Nijjar PS, Usman HM, Mehta NN, Shah R, Master SR, Propert KJ, Reilly MP. 2013. Race and gender variation in response to evoked inflammation. J Transl Med 11:1–9. doi: 10.1186/1479-5876-11-63. [DOI] [PMC free article] [PubMed] [Google Scholar]
- 45.Attig J, Young GR, Stoye JP, Kassiotis G. 2017. Physiological and pathological transcriptional activation of endogenous retroelements assessed by RNA-sequencing of B lymphocytes. Front Microbiol 8:1–11. [DOI] [PMC free article] [PubMed] [Google Scholar]
- 46.Douville R, Liu J, Rothstein J, Nath A. 2011. Identification of active loci of a human endogenous retrovirus in neurons of patients with amyotrophic lateral sclerosis. Ann Neurol 69:141–151. doi: 10.1002/ana.22149. [DOI] [PMC free article] [PubMed] [Google Scholar]
- 47.Chuong EB, Elde NC, Feschotte C. 2016. Regulatory evolution of innate immunity through co-option of endogenous retroviruses. Science 351:1083–1087. doi: 10.1126/science.aad5497. [DOI] [PMC free article] [PubMed] [Google Scholar]
- 48.Dyer DP, Salanga CL, Johns SC, Valdambrini E, Fuster MM, Milner CM, Day AJ, Handel TM. 2016. The anti-inflammatory protein TSG-6 regulates chemokine function by inhibiting chemokine/glycosaminoglycan. J Biol Chem 291:12627–12640. doi: 10.1074/jbc.M116.720953. [DOI] [PMC free article] [PubMed] [Google Scholar]
- 49.Tao Z, Fusco A, Huang D-B, Gupta K, Young Kim D, Ware CF, Van Duyne GD, Ghosh G. 2014. p100/IκBδ sequesters and inhibits NF-κB through kappaBsome formation. Proc Natl Acad Sci U S A 111:15946–15951. doi: 10.1073/pnas.1408552111. [DOI] [PMC free article] [PubMed] [Google Scholar]
- 50.Fort A, Hashimoto K, Yamada D, Salimullah M, Keya CA, Saxena A, Bonetti A, Voineagu I, Bertin N, Kratz A, Noro Y, Wong C-H, de Hoon M, Andersson R, Sandelin A, Suzuki H, Wei C-L, Koseki H, Hasegawa Y, Forrest ARR, Carninci P, Consortium TF, FANTOM Consortium. 2014. Deep transcriptome profiling of mammalian stem cells supports a regulatory role for retrotransposons in pluripotency maintenance. Nat Genet 46:558–566. doi: 10.1038/ng.2965. [DOI] [PubMed] [Google Scholar]
- 51.Barnett DW, Garrison EK, Quinlan AR, Strömberg MP, Marth GT, Api T. 2011. BamTools: a C++ API and toolkit for analyzing and managing BAM files. Bioinformatics 27:1691–1692. doi: 10.1093/bioinformatics/btr174. [DOI] [PMC free article] [PubMed] [Google Scholar]
- 52.Anders S, Pyl PT, Huber W. 2015. Genome analysis HTSeq: a Python framework to work with high-throughput sequencing data. Bioinformatics 31:166–169. doi: 10.1093/bioinformatics/btu638. [DOI] [PMC free article] [PubMed] [Google Scholar]
- 53.Harrow J, Frankish A, Gonzalez JM, Tapanari E, Diekhans M, Kokocinski F, Aken BL, Barrell D, Zadissa A, Searle S, Barnes I, Bignell A, Boychenko V, Hunt T, Kay M, Mukherjee G, et al. . 2012. GENCODE: the reference human genome annotation for The ENCODE Project. Genome Res 22:1760–1774. doi: 10.1101/gr.135350.111. [DOI] [PMC free article] [PubMed] [Google Scholar]
- 54.Lawrence M, Huber W, Pagès H, Aboyoun P, Carlson M, Gentleman R, Morgan MT, Carey VJ. 2013. Software for computing and annotating genomic ranges. PLoS Comput Biol 9:e1003118. doi: 10.1371/journal.pcbi.1003118. [DOI] [PMC free article] [PubMed] [Google Scholar]
- 55.Love MI, Huber W, Anders S. 2014. Moderated estimation of fold change and dispersion for RNA-seq data with DESeq2. Genome Biol 15:550–521. doi: 10.1186/s13059-014-0550-8. [DOI] [PMC free article] [PubMed] [Google Scholar]
- 56.Benjamini Y, Hochberg Y. 1995. Controlling the false discovery rate: a practical and powerful approach to multiple testing. J R Stat Soc 57:289–300. doi: 10.1111/j.2517-6161.1995.tb02031.x. [DOI] [Google Scholar]
- 57.Aken BL, Ayling S, Barrell D, Clarke L, Curwen V, Fairley S, Fernandez Banet J, Billis K, García Girón C, Hourlier T, Howe K, Kähäri A, Kokocinski F, Martin FJ, Murphy DN, Nag R, Ruffier M, Schuster M, Tang YA, Vogel JH, White S, Zadissa A, Flicek P, Searle SMJ. 2016. 2016. The Ensembl gene annotation system. Database 2016:baw093–19. doi: 10.1093/database/baw093. [DOI] [PMC free article] [PubMed] [Google Scholar]
- 58.Grabherr MG, Haas BJ, Yassour M, Levin JZ, Thompson DA, Amit I, Adiconis X, Fan L, Raychowdhury R, Zeng Q, Chen Z, Mauceli E, Hacohen N, Gnirke A, Rhind N, di Palma F, Birren BW, Nusbaum C, Lindblad-Toh K, Friedman N, Regev A. 2011. Full-length transcriptome assembly from RNA-Seq data without a reference genome. Nat Biotechnol 29:644–652. doi: 10.1038/nbt.1883. [DOI] [PMC free article] [PubMed] [Google Scholar]
- 59.Wu TD, Watanabe CK. 2005. GMAP: a genomic mapping and alignment program for mRNA and EST sequences. Bioinformatics 21:1859–1875. doi: 10.1093/bioinformatics/bti310. [DOI] [PubMed] [Google Scholar]
- 60.Robinson JT, Thorvaldsdóttir H, Winckler W, Guttman M, Lander ES, Getz G, Mesirov JP. 2011. Integrative genomics viewer. Nat Biotechnol 29:24–26. doi: 10.1038/nbt.1754. [DOI] [PMC free article] [PubMed] [Google Scholar]
Associated Data
This section collects any data citations, data availability statements, or supplementary materials included in this article.


