

Abstract
Clathrin mediated endocytosis (CME) has been extensively studied in living cells by quantitative total internal reflection fluorescence microscopy (TIRFM). Fluorescent protein fusions to subunits of the major coat proteins, clathrin light chains or the heterotetrameric adaptor protein (AP2) complexes, have been used as fiduciary markers of clathrin coated pits (CCPs). However, the functionality of these fusion proteins has not been rigorously compared. Here, we generated stable cells lines overexpressing mRuby‐CLCa and/or μ2‐eGFP, σ2‐eGFP, two markers currently in use, or a novel marker generated by inserting eGFP into the unstructured hinge region of the α subunit (α‐eGFP). Using biochemical and TIRFM‐based assays, we compared the functionality of the AP2 markers. All of the eGFP‐tagged subunits were efficiently incorporated into AP2 and displayed greater accuracy in image‐based CCP analyses than mRuby‐CLCa. However, overexpression of either μ2‐eGFP or σ2‐eGFP impaired transferrin receptor uptake. In addition, μ2‐eGFP reduced the rates of CCP initiation and σ2‐eGFP perturbed AP2 incorporation into CCPs and CCP maturation. In contrast, CME and CCP dynamics were unperturbed in cells overexpressing α‐eGFP. Moreover, α‐eGFP was a more sensitive and accurate marker of CCP dynamics than mRuby‐CLCa. Thus, our work establishes α‐eGFP as a robust, fully functional marker for CME.
Keywords: AP2, clathrin‐mediated endocytosis, retroviral expression, total internal reflection fluorescence microscopy, transferrin receptor
Fluorescent protein fusions are used as fiduciary markers to study clathrin‐mediated endocytosis (CME). However, their functionality has not been rigorously compared. Here, we introduce a novel marker generated by inserting eGFP into the hinge region of the AP2 α subunit (α‐eGFP). Using biochemical and imaging‐based studies its functionality was compared to that of commonly used μ2‐eGFP and σ2‐eGFP fusions. Only cells overexpressing α‐eGFP exhibited unperturbed CME and clathrin coated pit dynamics, establishing it as a robust fiduciary marker for CME.
1. INTRODUCTION
The uptake of macromolecular cargo into cells plays an essential role in cell physiology. The major entry pathway in mammalian cells is clathrin‐mediated endocytosis (CME), a cargo‐concentrative, regulated process named after the major coat protein, clathrin. 1 , 2 , 3 CME is initiated by adaptor proteins that recruit clathrin and recognize cargo receptors to cluster them into growing clathrin coated pits (CCPs). 4 , 5 These adaptors, along with other accessory proteins contribute to the maturation of CCPs. To measure CME in living cells, researchers traditionally use constituents of the clathrin coat conjugated to fluorescent proteins (FPs), coupled with quantitative, live‐cell total internal reflection fluorescence microscopy (TIRFM). 6 , 7 , 8 , 9 Custom software enables the accurate detection and tracking of thousands of CCPs and measurement of the rates of CCP initiation, stabilization, growth, and maturation. 7 , 10 , 11
As the major and defining coat protein, FP‐tagged versions of the clathrin light chain (CLC) have proven to be invaluable tools to measure CCP dynamics. 8 , 12 Because CLC must be incorporated with clathrin heavy chains to form functional triskelia, overexpressing CLCs does not affect overall triskelia concentration or the rates of CME. Most studies use eGFP‐CLCa, the predominant light chain isoform in nonneuronal cells, 13 because overexpression of CLCb alters CCP dynamics. 14 A drawback of this marker is that clathrin also functions in vesicle formation from intracellular organelles 15 and forms static structures on endosomes, 16 potentially complicating analysis and interpretation.
An alternative and more selective marker of CME is the AP2 (adaptor protein 2) complex that specifically targets CCP assembly on the plasma membrane (PM). 17 , 18 AP2 is a heterotetramer composed of 4 subunits: α, β2, μ2, and σ2. 19 The complex has a globular core formed by all subunits, in which μ2 and σ2, at the center, are framed by the two helical solenoid domains of α and β2. The α and β2 adaptins also have C‐terminal appendage domains connected to their corresponding core regions by unstructured and flexible hinges. 4 , 20 The β2 hinge contains a canonical clathrin‐binding box motif (LLNLD), 21 , 22 thought to be required for clathrin recruitment and assembly. 19 μ2, which has two folded domains, μ2N and μ2C connected by a flexible linker, undergoes a large conformational change upon AP2 activation 23 in which μ2C moves away from the core to expose binding sites on μ2 and σ2 that recognize endocytic cargo containing tyrosine (Yxxϕ or NPXY)‐ and dileucine (D/ExxLL/I or DXXLL)‐motifs, respectively. 24
AP2 complexes are the second most abundant component of the endocytic clathrin coat. 25 , 26 Given their specificity as a marker for CME, several FP‐tagged AP2 complexes have also been extensively used to track and study CCP dynamics. 8 , 27 , 28 , 29 FPs have been fused to both the C‐terminus 29 and N‐terminus 28 of the α subunit, the C‐terminus of β2, 29 the C‐terminus of σ2, 8 , 30 and in an unstructured ~110 aa loop extending from within the μ2C domain 31 While in most cases the FP‐fused subunits are overexpressed, both μ2‐GFP 32 and σ2‐GFP 33 , 34 , 35 fusions have also been created by genome‐editing proteins. In all cases, the FP‐tagged subunits are assumed to be incorporated into holo‐AP2 complexes, although the degree of incorporation is rarely reported, but see Cocucci, et al. 36 β2 has its own limitations as it can also be incorporated into AP1 complexes, 29 , 37 , 38 especially when overexpressed. Moreover, overexpressed and isolated β2 subunits can also be targeted to CCPs. 39
Although FP‐AP2 fusions have been increasingly used as fiduciary markers of CCPs, comprehensive comparisons of their functionality have not been conducted, yet are essential because of the potential caveats of tagging AP2 subunits. For instance, as a result of their small size and their packing within the AP2 core, tagging the μ2 and σ2 subunits may prevent their binding to specific cargo. Moreover, the added size of a tag can impose constraints on motility that could adversely affect conformational changes, leading to the formation of dysfunctional complexes. Previous studies have indeed shown that despite being incorporated into AP2 complexes and being recruited to CCPs, a C‐terminally tagged α subunit is unable to rescue CME of transferrin after knockdown of endogenous α. 40 Other anomalies have also been observed, for example N‐terminally tagged α subunit could not be detected on western blots using anti‐α antibodies, 28 so the degree of its incorporation into AP2 complexes could not be assessed. Given these concerns, we reasoned that the large (~80aa) unstructured hinge region of α, which has no known binding partners might be an optimal site for generating a functional FP‐α fusion.
To be used as an efficient fiduciary marker for CME, FP‐tagged subunits should be efficiently incorporated into AP2 complexes that are targeted to CCPs on the PM, should not perturb the kinetics of CME or CCP dynamics compared to the well‐established marker FP‐CLCa, and should robustly report the dynamic behavior of CCPs. Here, based on these criteria, we rigorously compare the biochemical and functional properties of a new eGFP‐tagged α‐adaptin with previously employed, but yet incompletely characterized, μ2‐eGFP 41 and σ2‐eGFP 8 , 30 subunits. While all three tagged subunits are efficiently incorporated into AP2 complexes, targeted to CCPs and able to report CCP dynamics, only α‐eGFP does so without perturbing CME.
2. RESULTS
To comparatively assess the properties of eGFP‐tagged AP2 subunits as faithful markers for CME and CCP dynamics, retroviruses encoding eGFP‐tagged α, μ2 or σ2 subunits were generated and used to infect human ARPE cells for stable expression. eGFP insertion sites for μ2 and σ2 were based on previously published work (Figure 1A,B). Specifically, μ2‐eGFP was derived from an internal HA‐tagged rat AP2M1 cDNA obtained from A. Sorkin. 41 eGFP along with a 6‐nucleotide LE linker (encoding Leucine and Glutamate) were inserted in‐frame downstream of the 11‐aa HA tag, which is inserted at aa237 in μ2. A second LE linker was added at the C‐terminus of eGFP followed by the remaining AP2M1 sequence, starting at aa447. σ2‐eGFP was obtained from T. Kirchhausen and encodes an eGFP fusion protein linked to the C‐terminus of AP2S1 by a flexible DPPVAT linker. 8 The linker also encodes a Kozak consensus sequence, which could act a secondary ribosomal binding site (Figure 1A,B). For the α subunit, an eGFP tag was inserted in‐frame at aa689 in the unstructured hinge region of a hybrid mouse α subunit construct (see Section 8) obtained from M.S. Robinson (Figure 1A,B).
FIGURE 1.
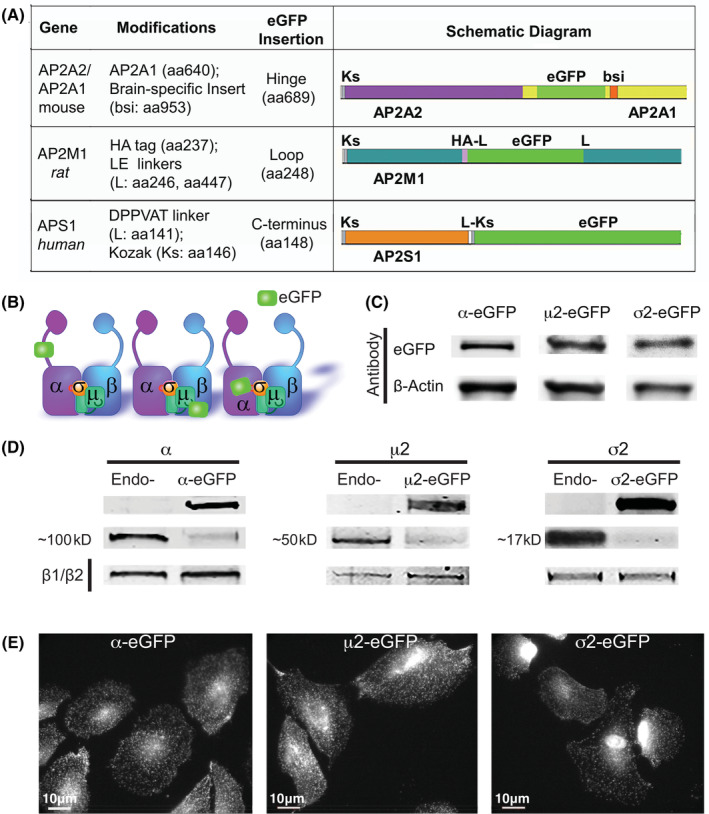
Design and validation of cell lines carrying eGFP‐tagged AP2 subunits. A, Table with construct details, and their corresponding schematic diagram. Table includes gene name, cDNA species source, modifications made to the protein structure, and site of eGFP insertion. Individual construct diagrams illustrate eGFP insertion, Kozak sequence (Ks), bsi (brain specific insert), linker (L) and Human influenza hemagglutinin tag (HA). B, Illustration of the AP2 protein complex including location of eGFP tag on each construct. C, western blot of stable ARPE cells overexpressing the indicated AP2 subunit using antibodies against GFP and β‐actin as loading control. D, Western blot of ARPE cells overexpressing eGFP‐tagged AP2 (‐eGFP) subunits compared to a parental line expressing only endogenous proteins (Endo‐). Antibodies specific to each subunit were used: α MA3‐061 with endogenous band at 100 kD, μ2 in‐house with band at ~50 kD, and σ2 ab128950 at ~17 kD. E, Immunofluorescence images of cells overexpressing eGFP‐tagged AP2 subunits
Two weeks after transduction, cells were FACS‐sorted for matching, moderate levels of eGFP expression (Figure 1C). These cells were then allowed to expand for 3 more weeks, and checked by western blot for eGFP‐tagged protein expression relative to endogenous levels in parental cells (Figure 1D). At steady state, each subunit was expressed at ~2‐5‐fold higher levels relative to endogenous protein levels observed in the parental wild type cell lines (Endo‐). As expected, when the overexpressed eGFP‐subunits are incorporated into intact AP2 complexes, the corresponding endogenous subunit are displaced and down‐regulated (Figure 1D).
These cell lines were frozen in multiple vials for use in all subsequent analyses. We note that with time in culture, expression levels of tagged subunits decreased (Figure S1A). This was especially true for μ2‐eGFP and σ2‐eGFP, hinting that these constructs might adversely affect cell proliferation so that cells expressing less eGFP‐tagged AP2 have a competitive advantage. For this reason, all experiments were done within 4 weeks after thawing.
Epifluorescence imaging of generated cell lines revealed that each of the eGFP‐tagged AP2 subunits localized, as expected, to punctate structures at the cell surface (Figure 1E). However, we also detected eGFP fluorescence accumulation in the nucleus of σ2‐eGFP expressing cells, which could also be seen in earlier publications. 8 Western blotting of σ2‐eGFP cells revealed significant levels of free‐eGFP (Figure S1B), suggesting that this construct is susceptible to cleavage, or that the spurious Kozak sequence at the 5′ end of eGFP may enable synthesis independent of σ2 expression. We favor the latter as we did not detect significant untagged σ2 in these cells.
3. α‐eGFP, μ2‐eGFP, AND σ2‐eGFP ARE EFFICIENTLY INCORPORATED INTO AP2 COMPLEXES
The first criteria to be met for these tagged AP2 subunits to serve as a robust fiduciary marker for CCPs is their ability to be efficiently incorporated into AP2 complexes. To test this, we first performed eGFP pulldowns using GFP‐nAb agarose beads and measured if each eGFP‐tagged subunit can pulldown the other subunits of the AP2 tetramer (Figure 2A). Interestingly, we note that overexpression of α‐eGFP results in an increase in expression of endogenous μ2 and σ2 (Figure 2A, input). Pulldown efficiencies for eGFP‐tagged subunits ranged between 76% and 85% (Figure 2B). Quantification of the data (Figure 2C) shows that α‐eGFP was able to pulldown 99.3 ± 7.4% of endogenous μ2 and 78.8 ± 0.7% of endogenous σ2. Similarly, 94.1 ± 4.2% of available α2 and 68 ± 6.3% of σ2 co‐immuno‐precipitated with μ2‐eGFP, while 98.7 ± 0.9 of α2 and 79.5 ± 4.1% of endogenous μ2 co‐immuno‐precipitated with σ2‐eGFP (Figure 2C). These data establish that endogenous subunits efficiently coassemble with each of the eGFP‐tagged subunits to form holo‐AP2 complexes.
FIGURE 2.
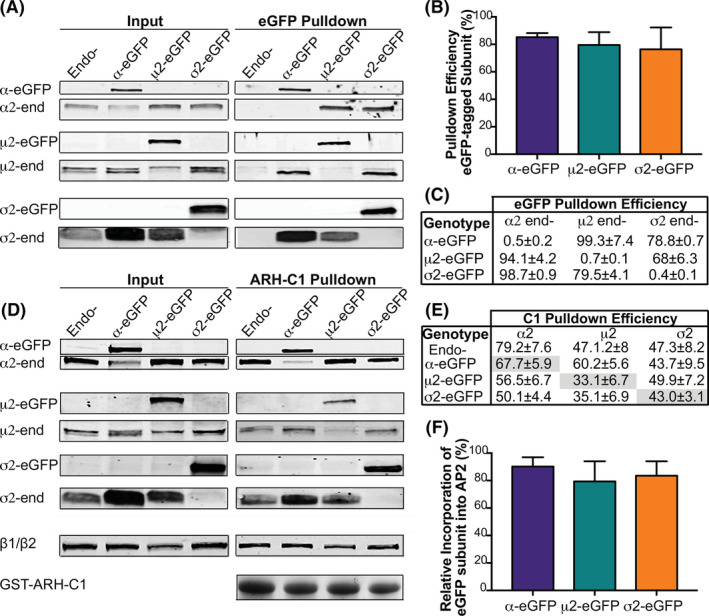
α‐eGFP, μ2‐eGFP and σ2‐eGFP are efficiently incorporated into AP2 complexes. A, Representative western blot of pulldown of eGFP‐tagged subunits using a GFP‐trap. Input is 75% of pulldown. Endo‐ is the parental cell line control. Quantification of pulldown efficiency of eGFP‐tagged proteins B, and pulldown efficiency of endogenous (end‐) subunits binding to eGFP‐AP2 + bead complex, C. Results are an average of 4 experiments and their corresponding SE. D, Representative western blot of AP2 complex pulldowns using C1‐ARH‐GST, which binds preferentially to β2. Endo‐ is the parental cell line. GST‐ARH‐C1 is visualized in‐gel by a trihalo‐UV reaction, and the β1/β2 subunits by western blot. E, Quantification of pulldown efficiency for eGFP‐tagged (shaded gray), and endogenous AP2 subunits. Results for each graph are averages of n = 3 ± SE. F, Relative incorporation of tagged subunits into AP2 complexes as a percent of total. Subunit‐specific antibodies were used for quantification. Error bars represent SD
Given that the eGFP‐tagged subunits are overexpressed, we next measured the fraction of tagged subunits incorporated into AP2 complexes. For this, AP2 complexes were pulled‐down based on the high affinity binding of β2 with the C1‐domain of ARH (autosomal recessive hypercholesteremia) using GST‐C1‐ARH 42 (Figure 2D, and quantified in Figure 2E,F). Each experiment also included a pulldown using GST alone as bait to check for specificity of signal (Figure S1C). As a control, we measured the efficiency of pulldown of endogenous α2, μ2 and σ2 subunits from parental cell lysates. As antibodies able to distinguish β1 and β2 subunits are not available, we were unable to measure the efficiency of pulldown of β2. However, we found, in nontranfected parent cells that ~80% of α, but only ~50% of μ2 and σ2 subunits were pulled down by GST‐C1‐ARH, suggesting that even at endogenous levels of expression, the pools of free μ2 and σ2 subunits are higher than of α (Figure 2E). As expected given that they are overexpressed, the percent of each tagged subunit pulled down along with β2 was lower than endogenous (Figure 2E, gray). Comparing the pulldown efficiencies in cells expressing tagged subunits relative to endogenous (Figure 2E, Endo‐), these data again indicate higher levels of free μ2‐EGFP and σ2‐EGFP than α‐EGFP, as might be expected given that other AP2 subunits are selectively upregulated in α‐EGFP overexpressing cells. Finally, we quantified the relative incorporation of each eGFP subunit into the AP2 complex, measured as the percentage of tagged subunit over total (tagged/tagged ± endogenous ×100%). Indicative of functionality, each subunit efficiently displaced their endogenous counterpart such that eGFP‐tagged species accounted for 90.2 ± 2.8% of α, 78.4 ± 7.3% of μ2 and 83.6 ± 5.3% σ2 subunits in their respective AP2 complexes (Figure 2F). Together, these experiments revealed that α‐eGFP, μ2‐eGFP, and σ2‐eGFP are all efficiently incorporated into fully formed AP2 complexes in overexpressing, stable ARPE cells.
4. α‐eGFP, μ2‐eGFP, AND σ2‐eGFP ARE DIFFERENTIALLY TARGETED TO THE MEMBRANE AND INCORPORATED INTO CCPS
The ability of AP2 complexes to be recruited to the PM and trigger CCP assembly depends on a series of activating conformational changes necessary for AP2 targeting to the PM and into CCPs. 23 , 43 As these could be impaired by bulk GFP tags, especially in the core μ2 and σ2 subunits, we next compared the ability of AP2 complexes bearing the eGFP‐tagged subunits to associate with the PM and colocalize with CCPs. Consistent with the higher cytosolic pools of free μ2 and σ2 subunits detected in our pulldown assays (Figure 2C,E), subcellular fractionation revealed a greater enrichment of α on wild type membrane fractions compared to μ2 and σ2 (Figure 3A,B). However, we observed no significant differences in the enrichment of AP2 complexes bearing either α‐eGFP or μ2‐eGFP in membrane fractions compared to their respective endogenous counterparts (Figure 3A,B). In contrast, the observed ratios for σ2‐eGFP were ~ half of that observed for its endogenous counterpart. This lower ratio could reflect the high σ2 overexpression which allows for an increase in free cytosolic eGFP‐tagged subunits. Consistent with this, overexpression of individual eGFP‐subunits did not affect the membrane: cytosol ratios of the other endogenous subunits. However, as these differences could not be fully accounted for by the relative incorporation into AP2 complexes, especially comparing μ2 with σ2, these data suggest potential defects in the membrane recruitment of AP2 complexes bearing σ2‐eGFP.
FIGURE 3.
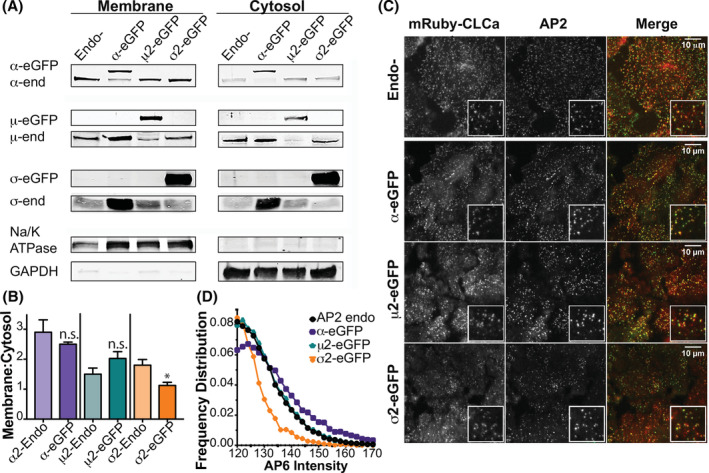
α‐eGFP, μ2‐eGFP and σ2‐eGFP are targeted to CCPs to membranes and colocalize with clathrin coated pits. A, Representative western blot of fractionation into membrane and cytosolic pools for each ARPE cell line overexpressing eGFP tagged subunits (α‐eGFP, μ2‐eGFP σ2‐eGP) compared to parental cell line (Endo‐). Na/K ATPase was used as a membrane fraction control, and GAPDH as a cytosolic fraction control. Subunit‐specific antibodies were used to visualize subunits and for measurements. B, Quantification of membrane to cytosol ratios for each eGFP‐tagged subunit (‐eGFP) compared to endogenous protein made in the parental cell line (‐Endo). Graphed are results from averaging results for three experiments ± SE. *P < .05, C, Upper panel: single plane confocal image of mRuby‐CLCa and anti‐α AP6 immunostaining. Lower panels, single frames from TIRFM movies of mRuby‐CLCa;AP2‐eGFP labeled cell lines, showing colocalization of clathrin and AP2 at CCPs. D, Distribution of total AP2 complexes in each cell line by immunostaining and subsequent quantification of AP6 antibody‐positive CCPs
Next, we measured the colocalization of AP2‐eGFP complexes with clathrin at CCPs using TIRFM (Figure 3C). For this purpose, a parental mRuby‐CLCa ARPE cell line was transduced with retroviruses encoding one of the three eGFP‐tagged subunits and sorted by FACS to obtain cells uniformly expressing mRuby and eGFP constructs. We examined colocalization of endogenous AP2 with CLCa‐mRuby by immunostaining with mAb AP6 (Figure 3C, top panel). TIRFM movies of each double‐labeled cell line were obtained and primary/secondary analysis was used to determine the degree of colocalization in bona fide CCPs. 44 Each of the AP2‐eGFP species strongly colocalized (~90%) with mRuby‐CLCa labeled CCPs (Figure 3C, bottom three panels, quantified in Figure S2A), indicating that all eGFP‐tagged AP2 subunits can support efficient targeting to and assembly of CCPs. However, when the distribution of total AP2 complexes in CLC‐positive CCPs was measured by immunofluorescence using anti‐α mAb, AP6 (Figure 3D) in the double‐labeled cell lines, we found that the majority of σ2‐eGFP CCPs have lower AP6 intensities than observed in endogenous control (Figure 3D endo‐). Consistent with the data in Figure 3A,B, this suggests that σ2‐eGFP‐containing AP2 complexes are less efficiently incorporated into CCPs. In contrast, the intensity distribution for AP6 staining at CCPs shifted rightward in cells expressing α‐eGFP, indicative of a higher stoichiometry of AP2/CCP and consistent with the slight upregulation of AP2 complexes in these cells.
5. α‐eGFP, UNLIKE μ2‐eGFP AND σ2‐eGFP, DOES NOT PERTURB CCP DYNAMICS
As the main rationale for developing eGFP‐tagged AP2 complexes is their use as fiduciary markers to study CCP dynamics, we next performed quantitative live cell TIRFM to compare stable cell lines co‐expressing the eGFP‐AP2 constructs together with mRuby‐CLCa.
We first tested whether the expression of the tagged‐AP2 complexes affected mRuby‐CLCa dynamics, known to be a robust fiduciary marker of CCPs. 9 These experiments were performed with dual channel imaging of both mRuby‐CLCa and AP2‐eGFP constructs, so that AP2 and clathrin dynamics could be studied in the same cells. Initially, using mRuby‐CLCa as the primary channel, we examined the earliest AP2‐dependent stages of CME, CCP nucleation and stabilization, 45 which are captured, respectively, by measuring the initiation densities of subthreshold clathrin‐labeled structures (sCLSs) and of bona fide CCPs that grow beyond a user‐defined intensity threshold (see Section 8). Neither α‐eGFP nor σ2‐eGFP expressing cells altered the rates of CCP or sCLS initiation; however, cells expressing μ2‐eGFP exhibited significantly lower rates of initiation of both CCPs and sCLSs (Figure 4A,B). In all cell lines, the lifetime distributions of mRuby‐CLCa‐tracked CCPs, expressed as relative frequencies of CCPs for each lifetime, showed the typical Rayleigh‐like distribution, reflective of a regulated maturation process. Thus, overexpression of μ2‐EGFP appears to specifically affect the rates of CCP initiation, whereas later stages of CCP maturation are unaffected. The curves for α‐eGFP and σ2‐eGFP expressing cells were slightly shifted to the left (Figure 4C), which resulted in small, but significant differences in the median CCPs lifetimes (Figure 4D).
FIGURE 4.
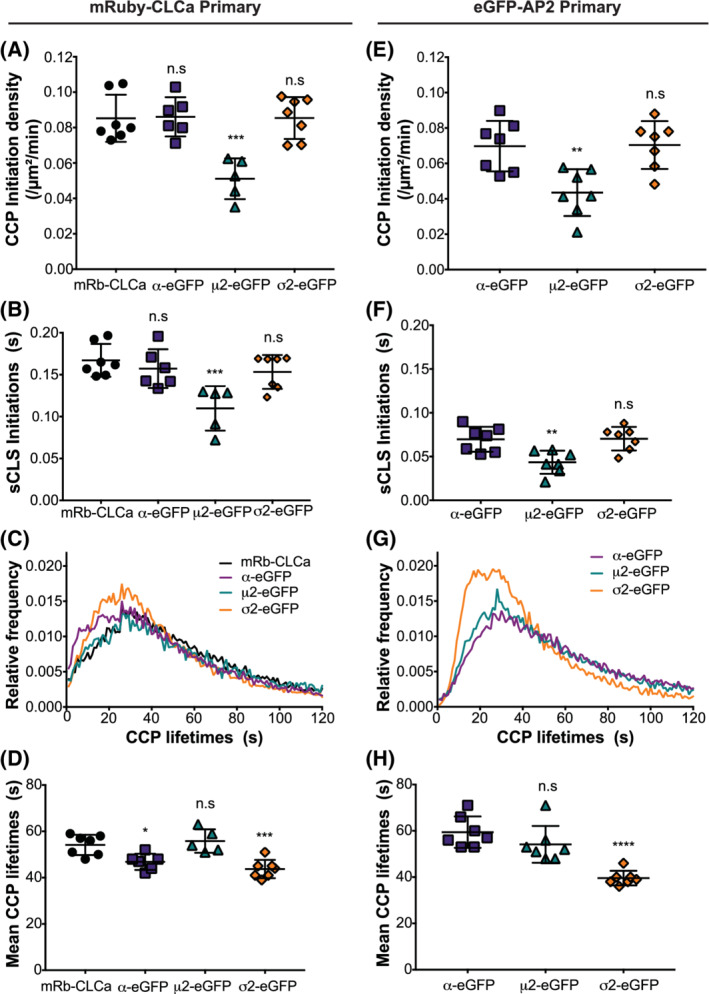
α‐eGFP is better suited for TIRFM analyses. A‐H, Analysis of double‐labeled ARPE cells using dual channel TIRFM live‐imaging. Cells were seeded at similar density prior to imaging. Each data point is a 7.5‐minute movie taken at a 1‐second interval per frame. Using cmeAnalysis, we determined CCP dynamics with A‐D, mRuby‐CLCa and, E‐H, eGFP‐tagged AP2 subunits as the primary channel, see Movies S1‐S3, for representative movies from α‐EGFP;mRb‐CLCa, μ2‐eGFP;mRb‐CLCa and σ2‐EGFP;mRb‐CLCa cells, respectively. Measurements include: A,E, bona fide clathrin coated pit (CCP) initiation densities, B,F, subthreshold clathrin‐labeled structures (sCLS) initiation densities, C,G, CCP lifetime distribution, and D,H, mean lifetime of CCPs analyzed per group. In A‐D, mRuby‐CLCa experiments, threshold was defined by control mRuby‐CLCa cells and applied to other cell lines. eGFP‐tagged AP2 subunits were compared by setting the same 40 CCP% as threshold (see Section 8.7). Error bars represent SD with *P < .05, **P < .01, ***P < .001 and ***P < .0001
We next examined CCP dynamics in the same cells using the eGFP‐tagged AP2 marker as the primary channel. Similar to that observed in mRuby‐CLCa experiments, μ2‐eGFP exhibited significantly lower initiation densities of both bona fide CCPs (Figure 4E) and sCLSs (Figure 4F). Interestingly, in comparing the two CCP markers, we also observed that the initiation densities of both CCPs (~0.07 vs ~0.085/μm2/min for AP2‐eGFP vs mRuby‐CLCa, respectively) and, especially of sCLSs (~0.07 vs ~0.16/μm2/min for AP2‐eGFP vs mRuby‐CLCa, respectively) were lower when tracking eGFP‐tagged AP2 compared to mRuby‐CLCa. The ~2:1 ratio of sCLCs vs CCPs seen when tracking mRuby‐CLCa, likely reflects the detection of single or only a few triskelia that sporadically appear within the TIRF field, as a single triskelion can carry up to 3 mRuby‐CLCa and therefore are readily detected given the higher sensitivity of cmeAnalysis. 44 In contrast, the ratio of sCLCs:CCPs when AP2‐eGFP is used as a marker was ~1:1. This suggests, as expected, that CCP nucleation events bearing AP2 complexes are much more likely to grow and become stabilized and that AP2 complexes more accurately reflect CCP nucleation than clathrin alone. When we analyzed mRuby‐CLCa dynamics using DASC (disassembly asymmetry score classification), a new threshold‐independent algorithm to distinguish CCPs from abortive coats, 11 none of the AP2‐eGFP constructs altered the ratio of CCPs:ACs (measured as CCP%) (Figure S2B). Thus, while μ2‐eGFP expressing cells showed a defect in nucleation, subsequent stabilization of nascent CCPs was unaffected.
The benefit of tracking AP2 complexes over CLCa can clearly be seen when comparing the lifetime distributions of CCPs tracked by the two markers, even though dual channel movies show that ~90% of mRuby‐CLCa CCPs are also positive for AP2‐eGFP (Figure S2A). Whereas, even above‐threshold, bona fide CCPs labeled with mRuby‐CLCa exhibit a high frequency of very short‐lived (<10 seconds) CCPs (Figure 4C), virtually none are detected with AP2‐eGFP markers (Figure 4G). Instead, the lifetime distribution curves of the AP2‐eGFP markers drop to zero at the shortest lifetimes. Thus, it is likely that a significant fraction of CLSs identified as bona fide CCPs based on their intensities are AP2‐deficient structures. We note that the lifetime distribution of σ2‐eGFP labeled CCPs is significantly shifted to the left with a larger population of CCPs with lifetimes <20 seconds compared to α2‐ and μ2‐labeled CCPs (Figure 4G). Correspondingly the median lifetime of σ2‐eGFP labeled CCPs is significantly shorter than for α2‐ and μ2‐labeled CCPs (Figure 4G and H). This suggests that σ2‐eGFP labeled CCPs are more likely to abort than α2‐ and μ2‐labeled CCPs. We also observed a slight downward shift in the σ2‐eGFP lifetime curve for CCPs between 50 and 120 seconds, suggesting minor perturbations in, or faster CCP maturation. These lifetime defects in σ2‐eGFP are consistent with our observations made in fixed cell experiments (Figure 3D) that the σ2‐eGFP‐expressing cells have fewer AP2 complexes/CCP than those in the other cell lines.
Finally, we compared the average intensity profiles of AP2‐eGFPs across lifetime cohorts and observed the characteristic increase in intensity for longer lived CCPs, a plateau phase of AP2 recruitment and a detachment phase (Figure S2C). However, consistent with higher cytosolic pools of both μ2‐ and σ2‐eGFP (Figure 3B), the base of their intensity curves (ie, the background) is ~threefold higher than for α2‐eGFP.
Together these live cell studies demonstrate that both μ2‐eGFP and σ2‐eGFP perturb different aspects of CCP dynamics. They also establish that α‐eGFP is a more robust and accurate fiduciary marker of CCP dynamics than mRuby‐CLCa.
6. μ2‐eGFP AND σ2‐eGFP PERTURB TRANSFERRIN RECEPTOR UPTAKE
Finally, we tested the effects of overexpression of each of these tagged AP2 subunits on CME using bulk biochemical assays for internalization. mAb D65 was used as a ligand for transferrin receptors (TfnRs) and biotinylated‐epidermal growth factor (B‐EGF) as a ligand for the EGF receptor (EGFR) (Figure 5A,B), and endocytosis efficiencies were measured using a previously published In‐Cell ELISA (enzyme‐linked immunosorbent assay). 46 Endocytic efficiency was measured as the percent of total surface‐bound ligand internalized over time.
FIGURE 5.
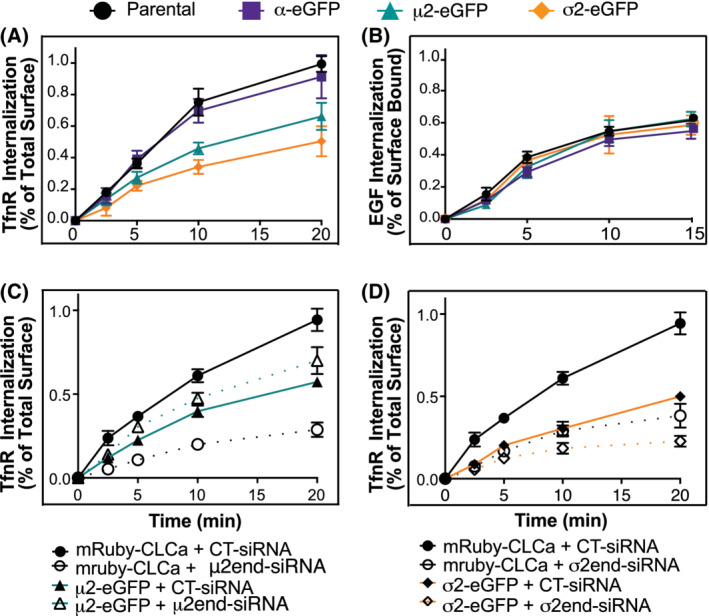
Overexpression of μ2‐eGFP and σ2‐eGFP results in inefficient Transferrin uptake. Quantification of internalization efficiency in parental (black), α‐eGFP (purple), μ2‐eGFP (teal) and σ2‐eGFP (orange) overexpression cell lines. A, Kinetics of transferrin receptor uptake in ARPE cells, measured using α‐TfnR mAb (HTR‐D65) as ligand and expressed as a percent of total antibody found at the surface, B, Internalization kinetics of biotin‐labeled EGF expressed as a percent of surface‐bound. C,Transferrin receptor internalization in mRuby‐CLCa; μ2‐eGFP (teal) cells compared to mRuby‐CLCa (black) in the presence of siRNA control (solid lines), or siRNA targeting endogenous μ2 (dotted lines). D, Transferrin receptor uptake in mRuby‐CLCa;σ2‐eGFP (orange lines) cells compared to mRuby‐CLCa (black) in the presence of siRNA control (solid lines), or siRNA targeting endogenous σ2 (dotted lines). Experiments B and C were done together and share the same mRuby‐CLCa scrambled control, but were separated for clarity. For all experiments, each data point is the average of three independent experiments. Error bars represent SD
The rate of TfnR uptake in ARPE cells expressing α‐eGFP was identical to that of the parent, untransduced ARPE cells. However, TfnR internalization was significantly inhibited in both μ2‐eGFP and σ2‐eGFP ARPE cells (Figure 5A). The decrease in the rate of TfnR internalization was accompanied by a corresponding increase in the levels of TfnR on the cell surface (data not shown). Interestingly, the rates of EGF uptake were identical in all of the cell lines tested (Figure 5B). Thus, the effects of μ2‐eGFP and σ2‐eGFP on rates of CME appear to be cargo selective.
Our biochemical analyses showed that while the efficiency of incorporation of α‐eGFP into AP2 complexes was ~90%, μ2‐eGFP and σ2‐eGFP were incorporated less efficiently such that ~20% of AP2 complexes still contain endogenous, untagged subunits. Therefore, we tested the extent to which these endogenous subunits might be supporting CME and CCP dynamics in the μ2‐eGFP‐ and σ2‐eGFP‐expressing cell lines. As expected, using siRNA to selectively target the 5′UTR of endogenous subunits (see Section 8, Figure S3A), knockdown of either μ2 or σ2 severely inhibited TfnR uptake in mRuby‐CLCa cells that do not express exogenous AP2 subunits (Figure 5C). siRNA knockdown of endogenous μ2 did not further decrease the rates of TfnR uptake in μ2‐eGFP; however, siRNA knockdown of endogenous σ2 further inhibited TfnR uptake in σ2‐eGFP‐expressing cell lines, suggesting that the remaining endogenous subunit was, in part, contributing to CME efficiency in these cells (Figure 5C,D). In contrast, knockdown of endogenous α2 in α‐eGFP overexpressing cells did not affect TfnR uptake (Figure S3B). Neither siRNA KD of endogenous μ2 or σ2 affected the rates of CCP initiation (Figure S3C,E) or the mean CCP lifetimes in (Figure S3 D,F) in the μ2‐eGFP‐ and σ2‐eGFP‐expressing cells. Together these results re‐enforce concerns regarding the functionality of both μ2‐ and σ2‐eGFP fusion proteins.
7. DISCUSSION
TIRFM has become a powerful tool to study CME and the dynamic behavior of CCPs. First introduced over 20 years ago, 12 most studies have tracked CCPs by overexpressing fluorescently‐tagged CLCa, which are incorporated into clathrin triskelia without affecting their concentration or function. 6 , 8 , 44 , 47 However, the high sensitivity afforded by the incorporation of up to three copies of eGPF‐CLCa/triskelion made it difficult to distinguish small and transient clathrin assemblies from bona fide CCPs. 44 Moreover, because clathrin also functions on intracellular membranes (eg, endosomes and TGN), these clathrin‐labeled structures could complicate analyses. For these reasons, several groups have begun to use fluorescently‐tagged subunits of the heterotrimeric AP2 complex, the second most abundant component of CCPs and one that specifically targets CCP assembly at the PM. However, few studies have fully characterized the functionality of these tagged subunits. Here we have compared two commonly used constructs, μ2‐eGFP and σ2‐eGFP with a new construct in which the eGFP tag is incorporated into the unstructured hinge region of the α‐adaptin subunit. While all three fusion proteins are efficiently incorporated into AP2 complexes when stably overexpressed at ~2‐5‐fold over endogenous levels, we find that only α‐eGFP is fully functional. Indeed, α‐eGFP proved to be a more robust and accurate fiduciary marker of bona fide CCPs than eGFP‐CLCa.
In all cases, the overexpressed AP2 subunits displaced their endogenous counterparts and were efficiently incorporated into intact AP2 complexes. Interestingly, overexpression of α‐eGFP resulted in the upregulation of both μ2 and σ2 subunits, and correspondingly increased the concentration of AP2 at CCPs. Whether the increase in μ2 and σ2 expression occurred at the transcription level and/or at the level of protein stabilization remains to be determined.
The most commonly used fluorescently‐tagged AP2 subunit, first introduced by Kirchhausen and colleagues 8 is the C‐terminally tagged σ2‐eGFP. Indeed, this subunit has been endogenously tagged in SUM159 breast cancer cells. 33 , 34 , 35 However, and in agreement with previous studies, 34 we find that σ2‐eGFP expressing cells exhibit impaired rates of TfnR uptake, as well as altered CCP dynamics, including increased numbers of short‐lived, presumably late abortive CCPs, and altered maturation rates. While it is possible that the shift in lifetime distribution of σ2‐eGFP labeled coated pits represents more rapid maturation, we think this is unlikely given the defects in CME we observed. Furthermore, consistent with impaired CME, ARPE cells rapidly lose expression of σ‐eGFP over time in culture. Interestingly, we also found that ~50% of endogenous σ2 and ~60% of overexpressed σ2‐eGFP subunits are not incorporated into AP2 complexes, nor targeted to membranes. Whether this residual σ2 exists as free monomers or is incorporated into other complexes remains to be determined. Finally, the σ2‐eGFP construct we used encodes an internal Kozak sequence and we detect free eGFP that likely accounts for the nuclear‐localized fluorescent signal that we and others 8 detect in cells overexpressing σ2‐eGFP. This issue has now been corrected in genome‐edited cells carrying an eGFP tag in the same region of σ2. 34 Based on our data, we conclude that σ2‐eGFP is not a robust fiduciary marker of CCP dynamics, and hence results stemming from its use should be interpreted with caution.
The μ2‐eGFP fusion generated by incorporating eGFP into the flexible loop in μ2C is also not fully functional. Previous studies had shown that μ2 bearing an HA or Myc epitope at this location was able to support efficient Tfn uptake 40 , 41 , 45 ; thus, it seemed reasonable to place an eGFP tag at the same location. However, cells expressing μ2‐eGFP exhibited reduced TfnR uptake, and reduced initiation densities of both sCLSs and CCPs. This is not entirely surprising as internally tagging other μ subunits can perturb their function. 48 As for σ2‐eGFP, with time in culture, the μ2‐eGFP cells also lost expression more rapidly when compared to cells expressing α‐eGFP. Interestingly, eGFP has been inserted into the same site in endogenous μ2 by genome‐editing a subset of alleles in the polyploid MDA‐MB‐231 cell line and used to distinguish “authentic” from “false” CCPs. 32 However, despite ~50% knock‐in efficiency as assessed by PCR, the levels of expression of μ2‐eGFP in most of the cell lines generated and studied corresponded to a fraction of untagged endogenous protein (see fig. S5E in Reference 32), consistent with perturbed function of the tagged subunit. The efficiency of incorporation into AP2 complexes was not assessed. Based on our data, it is unlikely that this construct is fully functional. Nevertheless, we cannot rule out differences between cell types, the linkers used (although not specified), nor the possibility that compensatory mechanisms arose during clonal selection to restore efficient CME.
The endocytosis defect seen for both σ2‐eGFP and μ2‐eGFP cells was cargo selective, in that EGF uptake, which has been shown to be less AP2‐dependent, 49 , 50 and can be mediated by alternative nonclathrin pathways, was unaffected. This was expected, as other FP‐tagged versions of μ2 also did not exhibit EGFR traffic defects. 31 , 51 Moreover, there is evidence in the literature of endogenously eGFP tagged σ2 exhibiting mild defects in endocytosis of chimeras bearing YAAL or EAAALL but not FANPAY, further reinforcing the idea that defects arising from the introduction of these tags may be a cargo‐selective issue. 34 As both σ2 and μ2 are directly involved in cargo recognition, the bulky eGFP tags on the core AP2 subunits may impair this function.
Our findings establish α‐eGFP as a robust and accurate fiduciary marker of CCPs. The unstructured hinge region of α adaptin has no known binding partners. Its unstructured length (~80 aa) is thought to enable the attached α‐appendage domain to flexibly interact with numerous endocytic accessory proteins during CCP stabilization and maturation. 20 This flexibility perhaps accounts for our findings that insertion of an eGFP moiety does not interfere with AP2 function. Indeed, the rates of assembly and maturation of α‐eGFP labeled CCPs are indistinguishable from mRuby‐CLCa labeled CCPs. The exception being that >twofold fewer short‐lived, dim (ie, subthreshold) structures are detected and lifetime distribution curves are no longer populated by very short‐lived (<10 seconds) CCPs. These data suggest that AP2‐labeled structures more accurately track bona fide CCPs.
Using genome‐edited fluorescent tags in imaging studies has clear advantages because of the lack of excess signal resulting from overexpression, although this problem is mitigated when subunits of obligate heteroligomers are tagged. However, in this work we intentionally used retroviral vectors to generate overexpressing stable cell lines as a more versatile tool to study CCP dynamics. Stable cell lines were generated because overexpression studies using transient transfection does not allow sufficient time to replace endogenous AP2 subunits. 39 More importantly, the ability to sort for cells mildly overexpressing fluorescently‐tagged AP2 subunits increases the likelihood of their efficient incorporation into intact AP2 complexes. Use of retroviral‐driven overexpression of eGFP‐tagged markers rather than editing the endogenous locus allows for more rapid generation of labeled cells and greater versatility as the viral constructs are readily applicable to multiple cell lines. This approach also enables analysis of cell lines that are difficult to genome edit and/or that cannot be grown from single cell clones, including the ARPE cells used herein. Moreover, when amplifying cells during clonal selection after genome editing, compensatory mechanisms can emerge and be selected for, allowing cells adapt to the possibly perturbed function of tagged proteins. Having identified α‐eGFP as a robust and functional marker of CCPs, genome‐edited cells or organisms in which eGFP is inserted into this site in the endogenous locus are likely to be excellent tools for analysis of CME. However, as AP2 has two isoforms, identifying which isoform, AP2A1 or AP2A2, is predominantly expressed in the cell of choice will be important. Again, mildly overexpressing a single, nonfunction‐perturbing α isoform is an easier proposition.
Altogether, our findings point to the importance of careful biochemical and functional characterization of fluorescently‐tagged CCP markers. They also establish that mild and stable overexpression of our α‐eGFP construct can serve as a robust and accurate fiduciary marker for CCP dynamics.
8. METHODS
8.1. Generation of constructs
All eGFP‐tagged AP2 constructs were generated by seamless cloning techniques and subcloned into a modified pMIB6 retroviral vector. To avoid background, the BFP and the IRES sequences were removed from the original PMIB6 backbone using primers:
5′‐AGCGGCCGCTCGAGATCCTCCGGACTCAGATCC‐3′
5′‐ GGATCTGAGTCCGGAGGATCTCGAGCGGCCGCT‐3′.
α‐eGFP was designed as a chimeric protein based on a mouse cDNA construct gifted, and previously described, by the Robinson lab. 40 Briefly, the 3′ section of AP2A2 cDNA was removed using a ClaI site, and replaced by the corresponding AP2A1 region (aa640), which includes a brain‐specific insert (bsi; aa953). eGFP was inserted by seamless cloning into aa689, which corresponds to the hinge region of α. 5′ sequences were also modified to confer siRNA resistance. 40
To generate μ2‐eGFP, eGFP was inserted into the loop region (aa248) of rat AP2M1 cDNA preceded by an HA‐tag as described in previous work. 41 There are two short linkers (LE) at each end of eGFP (aa 246, 447).
σ2‐eGFP was generated from a construct gifted to us by the Kirchausen lab. 8 This construct carries eGFP at the C‐terminus of AP2S1 following a linker (DPPVAT), and a secondary Kozak sequence.
To subclone α, μ2 and σ2 sequences into the modified PMIB6 vector, the following primers were used:
α insert specific primers
FWD 5′‐CCGTAGGCATGGTGAGCAAGGGC‐3′
REV 5′‐AGGTTCCCGGACTTGTACAGCTCG‐3′
α vector specific primers
FWD 5′‐ACAAGTCCGGGAACCTCCTGGTG‐3′
REV 5′‐CTCACCATGCCTACGGGAGCCGG‐3′
μ2 insert specific primers.
FWD 5′‐TCGCCACCATGATCGGAGGCTTATTCATCTATAATCAC‐3′
REV 5′‐TCTGAGTCCGGACTAGCAGCGGGTTTCGTAAATG‐3′
μ2 vector specific primers
FWD 5′‐GCTGCTAGTCCGGACTCAGATCCGTCGAC‐3′
REV 5′‐TCCGATCATGGTGGCGAATTCCCGGATCC‐3′
σ insert specific primers
FWD 5′‐TCGCCACCATGATCCGATTCATTCTCATCCAGAAC‐3′
REV 5′‐TCTGAGTCCGGATTACTTGTACAGCTCGTCCATGCC‐3′
σ vector specific primers
FWD 5′‐CTGTACAAGTAATCCGGACTCAGATCCGTCGAC‐3′
REV 5′‐AATCGGATCATGGTGGCGAATTCCCGGATCC‐3′
Each construct was then transfected into HEK293FT to collect generated retrovirus 48 hours later.
8.2. Cell culture, viral infection and siRNA knockdown
Parental human retinal pigmented epithelium (ARPE‐19) cells obtained from ATCC were used to generate stable cell lines. All cells were cultured in DMEM/F12 supplemented with 10% FBS at 37°C in a 5% CO2 atmosphere.
Stable ARPE cell lines carrying fluorescently‐tagged CLCa were generated as previously described. 44 eGFP‐labeled AP2 stable cells lines were generated by transducing ARPE cells with the corresponding retrovirus. After 72 hours, cells were isolated in populations with different eGFP expression levels by fluorescence‐activated cell sorting (FACS Moody Foundation Flow Cytometry, UTSW). Cells exhibiting equivalent overexpression of eGFP‐tagged AP2 subunits at ~5 times that of endogenous were then allowed to grow for 3 weeks, frozen and used as stocks.
siRNA transfection was conducted in DMEM/F12 by supplementing Opti‐MEM with Lipofectamine RNAi‐MAX (Invitrogen 13778150). Cells were added to a 6‐well plate (200 ,000 cells/well), and a mix of siRNA and RNAi‐MAX was added dropwise while shaking the plate. Two rounds of siRNA were carried out through 5 days to achieve over 90% target protein knockdown. Sequences used for knockdown of endogenous α, μ2 and σ2 are below. For knockdown of μ2, both target sequences were used. μ2 and σ2 target sequences are found at the 5′UTR. α2 has been previously reported. 46 Knockdown levels were then checked by western blot.
Endogenous α 5′‐GAGCAUGUGCACGCUGGCCA‐3′
Endogenous σ2 5′‐CTTCGTGGAGGTCTTAAACGA‐3′
Endogenous μ2‐1 5′‐GTGTGACTTCGTCCAGTTACA‐3′
Endogenous μ2‐2 5′‐GGGATAGTGTGAGCTTCATTT‐3′
8.3. Endocytosis (uptake) assay
Uptake of TfnR and EGF was measured by already established in‐cell ELISA protocols. 46 In brief, 16 ,000 cells per well were seeded in 96‐well plates (Costar #9102) and left to attach for 16 hours at 37°C. Prior to each assay the cells were washed and media replaced with PBS4+ (1 mM CaCl2, 1 mM MgCl2, 0.2% BSA, 5 mM D‐glucose in 1×PBS) for starvation at 37°C for 30 minutes. A subset of cells was then placed at 4°C, and media was replaced with cold PBS4+ for surface‐bound measurements and blank controls, while timepoints were incubated in a 37°C water bath. PBS4+ containing: 5 mg/mL of HTR‐D65 (anti‐TfnR mAb) or 20 ng/mL Biotin‐EGF (Sigma) was then added for the indicated times. A subset of cells was kept at 4°C for surface‐bound measurements and blank controls while timepoints were incubated in a 37°C water bath for the indicated time. Cells at 37°C and blanks were then washed with cold acidic media (0.2 M acetic acid, 0.2 M NaCl, pH 2.3) to remove surface‐bound antibodies, followed by washing with cold PBS. All cells were then fixed in 4% formaldehyde (Electron Microscopy Sciences) for 5 minutes at 4°C, and followed by 25 minutes at 37°C. All wells were then washed 2× in PBS, followed by a 0.1% Triton‐X in PBS wash for permeabilization. We then proceeded to block the wells with Q‐PBS (2% BSA, 0.1% lysine, 0.01% saponin in PBS, pH 7.4) for 15 minutes, followed by a second round of blocking with 5%BSA/2%casein, or 2% casein only for EGF uptake, in PBS for 1 hour. After blocking, the cells were washed 1× with PBS and the corresponding HRP‐conjugated antibody was added and incubated overnight (anti‐mouse secondary for HTR‐D65 or Streptavidin‐POD for Biotin‐EGF, Sigma). Secondary antibodies were then removed by 6 PBS washes. OPD developing solution was used to obtain colorimetric read out by measuring absorbance at 490 nm (Biotek Synergy H1 Hybrid Reader). Well‐to‐well variability in cell number was normalized by a BCA assay (Thermo Fisher Scientific). Internalized ligand was expressed as the percentage of the total surface‐bound ligand at 4°C (ie, without acid wash step), measured in parallel.
8.4. Immunoprecipitations and subcellular fractionation
cDNA encoding the GST‐tagged C1‐Autosomal Recessive Hypercholesteremia (GST‐C1‐ARH) was a generous gift of Linton Traub. GST‐C1‐ARH protein expression and purification were performed as previously described. 42 GST only control was included in every experiment.
For GST‐pulldowns, 1 × 10⁶ ARPE cells were lysed in HEPES buffer (100 mM HEPES, 0.2 mM EGTA, 0.5 mM MgCl, 1% NP‐40, 50 mM NaCl, 1× protease inhibitor, 1× phosphatase inhibitor or sodium orthovanadate, pH = 7.4), spun at 500 g for 5 minutes to remove nuclei, and checked for concentration by standard BCA methods. Equivalent amounts of protein for each sample were added to Glutathione beads saturated with GST‐C1‐ARH, and rotated overnight at 4°C. Samples were then washed with HEPES buffer to remove excess unbound protein, resuspended and eluted at 90°C for 5 minutes with SDS sample loading buffer.
Pulldown of eGFP was performed using GFP‐nAb agarose beads (Allele Biotech) following the instructions provided by the manufacturer, with lysate prepared and analyzed as described above.
For fractionation experiments 1.2 × 10⁶ ARPE cells per genotype were detached with 10 mM EDTA at 37°C, neutralized with 100 mM MgCl, washed in 1xPBS, and resuspended in 500 μL of cold fractionation lysis buffer (25 mM HEPES, 250 mM sucrose, 1 mM MgCl2, 2 mM EGTA, pH = 7.4). Cells were lysed by 6 rounds of rapid freeze‐thaw cycles followed by 3 × 10 seconds water‐sonication pulses. Cells were then spun at 500 g for 3 minutes to remove nuclei, and supernatant was transferred to tubes for ultracentrifugation. One hundred micro liter were kept as input samples. Samples were then spun at 110 000 g for 30 minutes. Resulting supernatant was collected and TCA‐precipitated by standard methods. Both pellet and supernatant were resuspended in sample buffer. Samples were heat denatured in sample buffer and analyzed by SDS‐PAGE and western blotting.
Following standard semi‐dry western blot methods, the following antibodies were used to visualize proteins: MA3‐061 for α2 (Thermo Fisher), in‐house and Abcam ab106542 for μ2, Abcam, ab128950 for σ2, Sigma A4450 for β1/β2, Abcam ab76020 for Na/K ATPase, Santa Cruz SC‐25778 for GAPHD, Santa Cruz SC138 for GST, in‐house 4879 for CLCa. General loading controls were β‐actin, β1/2, trihalo‐UV gels (Stainfree BioRad), and Coomassie blue staining.
8.5. Immunofluorescence
Cells were seeded on 0.1 mg/mL gelatin‐coated 22 × 22 mm glass (Corning, #2850‐22) overnight, rinsed three times in 1×PBS and fixed for 2 minutes at 37°C with a mix of 0.5% Triton‐X100 and 2% formaldehyde (in PBS), followed by a fixation in 4% formaldehyde for 30 minutes at 37°C. Subsequently, cells were blocked with Q‐PBS without saponin for 30 minutes. Primary and secondary antibodies were diluted in Q‐PBS. Primary antibodies used were: HTR‐D65 (Tfn 1:500), CLCa (1:1000 4879 in‐house), AP6 (α‐adaptin mAb 1:500). Corresponding secondary labeled antibodies were used at 1:1000. Cells were mounted on slides with Fluoromount‐G.
8.6. Microscopy and imaging
TIRFM was performed as previously described. 14 Briefly, 22x22mm coverslips were acid‐washed and coated with 0.2 mg/mL gelatin (Corning, #2850‐22). For all imaging, a 60x Nikon 1.49 NA TIRFM DIC objective (Nikon) was used combined with an additional 1.8× tube lens (yielding a final magnification of 108×), mounted on a Ti‐Eclipse inverted microscope with Perfect Focus System (Nikon). TIRFM illumination was achieved using an Andor “Diskovery Platform/borealis widefield illuminator.” Time‐lapse series were acquired at a penetration depth of 80 nm and a frame rate of 1 Hz using a PCO‐Edge 5.5 sCMOS camera. During imaging, cells were maintained at 37°C in DMEM/F12 supplemented with 10% fetal bovine serum.
Confocal images were acquired with a similar setup as described above, using a 50 μm pinhole disk and an Andor Zyla 4.2 sCMOS camera.
Both microscopes have a custom‐built full body environmental chamber with temperature control and CO2 stage incubator operated by Bold Line controller and OKO‐Touch with SmartBox for data logging, and Molecular Devices MetaMorph software.
8.7. Quantification and statistical analysis
Experiments were performed with biological replicates and the data presented are average values ± standard deviations. The intensity of protein blots was analyzed with the Syngene (chemoluminescence) and ImageStudio (LICOR Odyssey) softwares. Results are described as average values ± standard deviations or error of the mean, where indicated. The statistical significance was analyzed by two‐tailed Student's t‐test or One‐way ANOVA in Prism 7. Significance is described as follows, P < .05; P < .01; P < .001; P < .0001.
When cmeAnalysis was used to quantify CCP dynamics using mRuby‐CLCa as the primary channel, intensity threshold was set to remove the large population of transient structures 44 and applied to all conditions imaged on the same day. When AP2‐eGFP was tracked as the primary channel, we were unable to use the same threshold because of intensity and behavioral differences between the independent cell lines. Instead, we assessed the dynamic properties of CCPs (tracked in the same cells using mRuby‐CLCa as the primary channel) using DASC (Disassembly Asymmetry Score Classification), a recently developed computational pipeline that distinguishes abortive coats from bona fide CCPs in an unbiased and intensity threshold‐independent manner, 11 and determined the appropriate % of CCPs (40 ± 3%), which was used to set the thresholding for cmeAnalysis for all cells. For TIRFM data, statistical significance was analyzed by two‐tailed Student's t‐test. *, P < .05; **, P < .005; ***, P < .005.
9. CODE
The cmeAnalysis code package used for data analyses in this work is well‐established from previous work by our lab. 7 , 10 , 44 , 52 A detail description and validation of the DASC analysis methods can be found in Wang et al. 11
CONFLICT OF INTEREST
The authors declare no conflict of interest.
AUTHOR CONTRIBUTIONS
Rosa E. Mino, Marcel Mettlen and Sandra L. Schmid designed the experiments, interpreted the results. Rosa E. Mino, Zhiming Chen and Marcel Mettlen performed TIRFM imaging and data analysis. Rosa E. Mino performed all other experiments.
Supporting information
Video S1 Time‐lapse TIRFM imaging of ARPE cells stably expressing α‐eGFP (left) and eGFP‐CLCa (right). Images were obtained at 1 frame/sec and collected for 7.5 minutes. Video is accelerated to 50fps.
Video S2 Time‐lapse TIRFM imaging of ARPE cells stably expressing μ2‐eGFP (left) and eGFP‐CLCa (right). Images were obtained at 1 frame/sec and collected for 7.5 minutes. Video is accelerated to 50fps.
Video S3 Time‐lapse TIRFM imaging of ARPE cells stably expressing σ2‐eGFP (left) and eGFP‐CLCa (right). Images were obtained at 1 frame/sec and collected for 7.5 minutes. Video is accelerated to 50fps.
Figure S1 Cell lined differentially lose expression of μ2‐eGFP and σ2‐eGFP over time in culture. Western blot of α‐eGFP, μ2‐eGFP, and σ2‐eGFP cell lines at 3 and 6 weeks in culture after thawing. Blotted for eGFP and β‐Actin control. B, western blot highlighting the presence of free eGFP at 25 kD specifically detected in the σ2‐eGFP expressing cells. C, Representative western blot showing specificity controls for GST‐ARH‐C1 pulldown experiments. To the left are the antibodies used to visualized each tag. Stain is a trihalo‐UV reaction gel staining showing loading for GST and GST‐C1 on each lane.
Figure S2. Details of CME TIRFM analysis results. A, Percent of eGFP‐positive clathrin‐coated pits, that are also mRuby‐CLCa positive measured in double‐labeled cell lines. Quantification was performed using primary/secondary analysis feature of cmeAnalysis software applied to TIRFM live imaging of samples. Error bars represent standard deviations. B, Measurement of CCP % by DASC using mRuby‐CLCa as a marker. C, Intensity cohorts of α‐eGFP, μ2‐eGFP, and σ2‐eGFP using eGFP as the primary channel and using CCP% as thresholding. Area underneath the base of cohorts represents background.
Figure S3. Knockdown of endogenous AP2 subunits does not affect CME or CCP dynamics in cells overexpressing eGFP‐tagged α, μ2 or σ2 subunits. A, Western blot showing efficiency of siRNA knockdown (kd) of α, μ2 and σ2 in α‐eGFP, μ2‐eGFP and σ2‐eGFP cells, respectively. CT (Control) lane is parental cell line, and siRNA lane is the corresponding knockdown. Lower band is loading control detected using trihalo‐UV gel stain, B, siRNA kd of α does not affect transferrin receptor internalization in α‐eGFP expressing cells. Comparison of, C, CCP Initiation and, D, mean lifetimes analyses in μ2‐eGFP cells treated with scrambled or endogenous μ2 siRNA. E, CCP Initiation and F, mean lifetimes analyses comparing σ2‐eGFP cells treated with scrambled or endogenous σ2‐eGFP plus endogenous σ2 siRNA. Experiments were replicated thrice. For all graphs above, error bars represent SD.
ACKNOWLEDGMENTS
We thank Dr. Zuzana Kadlekova for reagents, Dr. Emanuele Cocucci for manuscript comments, and Dr. Ashley Lakoduk for reagents and help with manuscript preparation. We also thank the FACS core facility at the UTSW Children's Research Center, Heather Grossman for help with sample generation, retrovirus production, and analysis, and Aparna Mohanakrishnan for technical support in PCR. We thank Dr. Ashley Lakoduk and Dr. Madhura Bhave for helpful discussion. This work is supported by NIH R01 GM73165 to Sandra L. Schmid and Marcel Mettlen.
Mino RE, Chen Z, Mettlen M, Schmid SL. An internally eGFP‐tagged α‐adaptin is a fully functional and improved fiduciary marker for clathrin‐coated pit dynamics. Traffic. 2020;21:603–616. 10.1111/tra.12755
Peer Review The peer review history for this article is available at https://publons.com/publon/10.1111/tra.12755.
Funding information NIH, Grant/Award Number: R01 GM73165
REFERENCES
- 1. Kaksonen M, Roux A. Mechanisms of clathrin‐mediated endocytosis. Nat Rev Mol Cell Biol. 2018;19(5):313‐326. [DOI] [PubMed] [Google Scholar]
- 2. McMahon HT, Boucrot E. Molecular mechanism and physiological functions of clathrin‐mediated endocytosis. Nat Rev Mol Cell Biol. 2011;12(8):517‐533. [DOI] [PubMed] [Google Scholar]
- 3. Mettlen M, Chen P‐H, Srinivasan S, Danuser G, Schmid SL. Regulation of Clathrin‐mediated endocytosis. Annu Rev Biochem. 2018;87:871‐896. [DOI] [PMC free article] [PubMed] [Google Scholar]
- 4. Owen DJ, Collins BM, Evans PR. Adaptors for clathrin coats: structure and function. Annu Rev Cell Dev Biol. 2004;20:153‐191. [DOI] [PubMed] [Google Scholar]
- 5. Traub LM, Bonifacino JS. Cargo recognition in clathrin‐mediated endocytosis. Cold Spring Harb Perspect Biol. 2013;5(11):a016790. [DOI] [PMC free article] [PubMed] [Google Scholar]
- 6. Merrifield CJ, Feldman ME, Wan L, Almers W. Imaging Actin and dynamin recruitment during invagination of single clathrin‐coated pits. Nat Cell Biol. 2002;4(9):691‐698. [DOI] [PubMed] [Google Scholar]
- 7. Loerke D, Mettlen M, Yarar D, et al. Cargo and Dynamin regulate Clathrin‐coated pit maturation. PLoS Biol. 2009;7(3):e1000057. [DOI] [PMC free article] [PubMed] [Google Scholar]
- 8. Ehrlich M, Boll W, van Oijen A, et al. Endocytosis by random initiation and stabilization of Clathrin‐coated pits. Cell. 2004;118(5):591‐605. [DOI] [PubMed] [Google Scholar]
- 9. Mettlen M, Danuser G. Imaging and modeling the dynamics of clathrin‐mediated endocytosis. Cold Spring Harb Perspect Biol. 2014;6(12):a017038. [DOI] [PMC free article] [PubMed] [Google Scholar]
- 10. Jaqaman K, Loerke D, Mettlen M, et al. Robust single‐particle tracking in live‐cell time‐lapse sequences. Nat Methods. 2008;5(8):695‐702. [DOI] [PMC free article] [PubMed] [Google Scholar]
- 11. Wang X, Chen Z, Mettlen M, Noh J, Schmid SL, Danuser G. DASC, a sensitive classifier for measuring discrete early stages in clathrin‐mediated endocytosis. elife. 2020;9:e53686. [DOI] [PMC free article] [PubMed] [Google Scholar]
- 12. Gaidarov I, Santini F, Warren RA, Keen JH. Spatial control of coated‐pit dynamics in living cells. Nat Cell Biol. 1999;1(1):1‐7. [DOI] [PubMed] [Google Scholar]
- 13. Acton SL, Brodsky FM. Predominance of clathrin light chain LCb correlates with the presence of a regulated secretory pathway. J Cell Biol. 1990;111(4):1419‐1426. [DOI] [PMC free article] [PubMed] [Google Scholar]
- 14. Chen PH, Bendris N, Hsiao YJ, et al. Crosstalk between CLCb/dyn1‐mediated adaptive Clathrin‐mediated endocytosis and epidermal growth factor receptor signaling increases metastasis. Dev Cell. 2017;40(3):278‐288. [DOI] [PMC free article] [PubMed] [Google Scholar]
- 15. Brodsky FM, Chen CY, Knuehl C, Towler MC, Wakeham DE. Biological basket weaving: formation and function of clathrin‐coated vesicles. Annu Rev Cell Dev Biol. 2001;17:517‐568. [DOI] [PubMed] [Google Scholar]
- 16. Norris A, Grant BD. Endosomal microdomains: formation and function. Curr Opin Cell Biol. 2020;65:86‐95. [DOI] [PMC free article] [PubMed] [Google Scholar]
- 17. Pearse BMF, Robinson MS. Clathrin, adaptors, and sorting. Annu Rev Cell Biol. 1990;6(1):151‐171. [DOI] [PubMed] [Google Scholar]
- 18. Robinson MS. Assembly and targeting of adaptin chimeras in transfected cells. J Cell Biol. 1993;123(1):67‐77. [DOI] [PMC free article] [PubMed] [Google Scholar]
- 19. Kirchhausen T, Owen D, Harrison SC. Molecular structure, function, and dynamics of clathrin‐mediated membrane traffic. Cold Spring Harb Perspect Biol. 2014;6(5):a016725. [DOI] [PMC free article] [PubMed] [Google Scholar]
- 20. Praefcke GJK, Ford MGJ, Schmid EM, et al. Evolving nature of the AP2 alpha‐appendage hub during clathrin‐coated vesicle endocytosis. EMBO J. 2004;23(22):4371‐4383. [DOI] [PMC free article] [PubMed] [Google Scholar]
- 21. Shih W, Gallusser A, Kirchhausen T. A clathrin‐binding site in the hinge of the beta 2 chain of mammalian AP‐2 complexes. J Biol Chem. 1995;270(52):31083‐31090. [DOI] [PubMed] [Google Scholar]
- 22. ter Haar E, Harrison SC, Kirchhausen T. Peptide‐in‐groove interactions link target proteins to the beta‐propeller of clathrin. Proc Natl Acad Sci U S A. 2000;97(3):1096‐1100. [DOI] [PMC free article] [PubMed] [Google Scholar]
- 23. Jackson LP, Kelly BT, McCoy AJ, et al. A large‐scale conformational change couples membrane recruitment to cargo binding in the AP2 clathrin adaptor complex. Cell. 2010;141(7):1220‐1229. [DOI] [PMC free article] [PubMed] [Google Scholar]
- 24. Kelly BT, Owen DJ. Endocytic sorting of transmembrane protein cargo. Curr Opin Cell Biol. 2011;23(4):404‐412. [DOI] [PubMed] [Google Scholar]
- 25. Kirchhausen T. Adaptors for clathrin‐mediated traffic. Annu Rev Cell Dev Biol. 1999;15:705‐732. [DOI] [PubMed] [Google Scholar]
- 26. Robinson MS, Bonifacino JS. Adaptor‐related proteins. Curr Opin Cell Biol. 2001;13(4):444‐453. [DOI] [PubMed] [Google Scholar]
- 27. Bucher D, Frey F, Sochacki KA, et al. Clathrin‐adaptor ratio and membrane tension regulate the flat‐to‐curved transition of the clathrin coat during endocytosis. Nat Commun. 2018;9(1):1109. [DOI] [PMC free article] [PubMed] [Google Scholar]
- 28. Rappoport JZ, Simon SM. A functional GFP fusion for imaging clathrin‐mediated endocytosis. Traffic. 2008;9(8):1250‐1255. [DOI] [PMC free article] [PubMed] [Google Scholar]
- 29. Keyel PA, Watkins SC, Traub LM. Endocytic adaptor molecules reveal an endosomal population of clathrin by total internal reflection fluorescence microscopy. J Biol Chem. 2004;279(13):13190‐13204. [DOI] [PubMed] [Google Scholar]
- 30. Fan L, Hao H, Xue Y, et al. Dynamic analysis of Arabidopsis AP2 σ subunit reveals a key role in clathrin‐mediated endocytosis and plant development. Development. 2013;140(18):3826‐3837. [DOI] [PubMed] [Google Scholar]
- 31. Huang F, Jiang X, Sorkin A. Tyrosine phosphorylation of the beta2 subunit of clathrin adaptor complex AP‐2 reveals the role of a di‐leucine motif in the epidermal growth factor receptor trafficking. J Biol Chem. 2003;278(44):43411‐43417. [DOI] [PubMed] [Google Scholar]
- 32. Hong SH, Cortesio CL, Drubin DG. Machine‐learning‐based analysis in genome‐edited cells reveals the efficiency of Clathrin‐mediated endocytosis. Cell Rep. 2015;12(12):2121‐2130. [DOI] [PMC free article] [PubMed] [Google Scholar]
- 33. Kural C, Akatay AA, Gaudin R, et al. Asymmetric formation of coated pits on dorsal and ventral surfaces at the leading edges of motile cells and on protrusions of immobile cells. Mol Biol Cell. 2015;26(11):2044‐2053. [DOI] [PMC free article] [PubMed] [Google Scholar]
- 34. Aguet F, Upadhyayula S, Gaudin R, et al. Membrane dynamics of dividing cells imaged by lattice light‐sheet microscopy. Mol Biol Cell. 2016;27(22):3418‐3435. [DOI] [PMC free article] [PubMed] [Google Scholar]
- 35. Pascolutti R, Algisi V, Conte A, et al. Molecularly distinct Clathrin‐coated pits differentially impact EGFR fate and signaling. Cell Rep. 2019;27(10):3049‐3061 e3046. [DOI] [PMC free article] [PubMed] [Google Scholar]
- 36. Cocucci E, Aguet F, Boulant S, Kirchhausen T. The first five seconds in the life of a clathrin‐coated pit. Cell. 2012;150(3):495‐507. [DOI] [PMC free article] [PubMed] [Google Scholar]
- 37. Page LJ, Robinson MS. Targeting signals and subunit interactions in coated vesicle adaptor complexes. J Cell Biol. 1995;131(3):619‐630. [DOI] [PMC free article] [PubMed] [Google Scholar]
- 38. Sorkina THF, Beguinot L, Sorkin A. Effect of tyrosine kinase inhibitors on clathrin‐coated pit recruitment and internalization of epidermal growth factor receptor. J Biol Chem. 2002;277(30):27433‐27441. [DOI] [PubMed] [Google Scholar]
- 39. Edeling MA, Mishra SK, Keyel PA, et al. Molecular switches involving the AP‐2 β2 appendage regulate Endocytic cargo selection and Clathrin coat assembly. Dev Cell. 2006;10(3):329‐342. [DOI] [PubMed] [Google Scholar]
- 40. Motley AM, Berg N, Taylor MJ, et al. Functional analysis of AP‐2 alpha and mu2 subunits. Mol Biol Cell. 2006;17(12):5298‐5308. [DOI] [PMC free article] [PubMed] [Google Scholar]
- 41. Nesterov A, Carter RE, Sorkina T, Gill GN, Sorkin A. Inhibition of the receptor‐binding function of clathrin adaptor protein AP‐2 by dominant‐negative mutant μ2 subunit and its effects on endocytosis. EMBO J. 1999;18(9):2489‐2499. [DOI] [PMC free article] [PubMed] [Google Scholar]
- 42. Mishra SK, Keyel PA, Edeling MA, Dupin AL, Owen DJ, Traub LM. Functional dissection of an AP‐2 β2 appendage‐binding sequence within the autosomal recessive hypercholesterolemia protein. J Biol Chem. 2005;280(19):19270‐19280. [DOI] [PubMed] [Google Scholar]
- 43. Kelly BT, Graham SC, Liska N, et al. AP2 controls clathrin polymerization with a membrane‐activated switch. Science. 2014;345(6195):459‐463. [DOI] [PMC free article] [PubMed] [Google Scholar]
- 44. Aguet F, Antonescu Costin N, Mettlen M, Schmid Sandra L, Danuser G. Advances in analysis of low signal‐to‐noise images link dynamin and AP2 to the functions of an endocytic checkpoint. Dev Cell. 2013;26(3):279‐291. [DOI] [PMC free article] [PubMed] [Google Scholar]
- 45. Kadlecova Z, Spielman SJ, Loerke D, Mohanakrishnan A, Reed DK, Schmid SL. Regulation of clathrin‐mediated endocytosis by hierarchical allosteric activation of AP2. J Cell Biol. 2016;216(1):167‐179. [DOI] [PMC free article] [PubMed] [Google Scholar]
- 46. Reis CR, Chen PH, Srinivasan S, Aguet F, Mettlen M, Schmid SL. Crosstalk between Akt/GSK3β signaling and dynamin‐1 regulates clathrin‐mediated endocytosis. EMBO J. 2015;34(16):2132‐2146. [DOI] [PMC free article] [PubMed] [Google Scholar]
- 47. Puthenveedu MA, von Zastrow M. Cargo regulates clathrin‐coated pit dynamics. Cell. 2006;127(1):113‐124. [DOI] [PubMed] [Google Scholar]
- 48. Guo X, Mattera R, Ren X, et al. The adaptor protein‐1 μ1B subunit expands the repertoire of basolateral sorting signal recognition in epithelial cells. Dev Cell. 2013;27(3):353‐366. [DOI] [PMC free article] [PubMed] [Google Scholar]
- 49. Hinrichsen L, Harborth J, Andrees L, Weber K, Ungewickell EJ. Effect of clathrin heavy chain‐ and alpha‐adaptin‐specific small inhibitory RNAs on endocytic accessory proteins and receptor trafficking in HeLa cells. J Biol Chem. 2003;278(46):45160‐45170. [DOI] [PubMed] [Google Scholar]
- 50. Motley A, Bright NA, Seaman MN, Robinson MS. Clathrin‐mediated endocytosis in AP‐2‐depleted cells. J Cell Biol. 2003;162(5):909‐918. [DOI] [PMC free article] [PubMed] [Google Scholar]
- 51. Fortian A, Dionne LK, Hong SH, et al. Endocytosis of ubiquitylation‐deficient EGFR mutants via clathrin‐coated pits is mediated by ubiquitylation. Traffic (Copenhagen, Denmark). 2015;16(11):1137‐1154. [DOI] [PMC free article] [PubMed] [Google Scholar]
- 52. Mettlen M, Loerke D, Yarar D, Danuser G, Schmid SL. Cargo‐ and adaptor‐specific mechanisms regulate clathrin‐mediated endocytosis. J Cell Biol. 2010;188(6):919‐933. [DOI] [PMC free article] [PubMed] [Google Scholar]
Associated Data
This section collects any data citations, data availability statements, or supplementary materials included in this article.
Supplementary Materials
Video S1 Time‐lapse TIRFM imaging of ARPE cells stably expressing α‐eGFP (left) and eGFP‐CLCa (right). Images were obtained at 1 frame/sec and collected for 7.5 minutes. Video is accelerated to 50fps.
Video S2 Time‐lapse TIRFM imaging of ARPE cells stably expressing μ2‐eGFP (left) and eGFP‐CLCa (right). Images were obtained at 1 frame/sec and collected for 7.5 minutes. Video is accelerated to 50fps.
Video S3 Time‐lapse TIRFM imaging of ARPE cells stably expressing σ2‐eGFP (left) and eGFP‐CLCa (right). Images were obtained at 1 frame/sec and collected for 7.5 minutes. Video is accelerated to 50fps.
Figure S1 Cell lined differentially lose expression of μ2‐eGFP and σ2‐eGFP over time in culture. Western blot of α‐eGFP, μ2‐eGFP, and σ2‐eGFP cell lines at 3 and 6 weeks in culture after thawing. Blotted for eGFP and β‐Actin control. B, western blot highlighting the presence of free eGFP at 25 kD specifically detected in the σ2‐eGFP expressing cells. C, Representative western blot showing specificity controls for GST‐ARH‐C1 pulldown experiments. To the left are the antibodies used to visualized each tag. Stain is a trihalo‐UV reaction gel staining showing loading for GST and GST‐C1 on each lane.
Figure S2. Details of CME TIRFM analysis results. A, Percent of eGFP‐positive clathrin‐coated pits, that are also mRuby‐CLCa positive measured in double‐labeled cell lines. Quantification was performed using primary/secondary analysis feature of cmeAnalysis software applied to TIRFM live imaging of samples. Error bars represent standard deviations. B, Measurement of CCP % by DASC using mRuby‐CLCa as a marker. C, Intensity cohorts of α‐eGFP, μ2‐eGFP, and σ2‐eGFP using eGFP as the primary channel and using CCP% as thresholding. Area underneath the base of cohorts represents background.
Figure S3. Knockdown of endogenous AP2 subunits does not affect CME or CCP dynamics in cells overexpressing eGFP‐tagged α, μ2 or σ2 subunits. A, Western blot showing efficiency of siRNA knockdown (kd) of α, μ2 and σ2 in α‐eGFP, μ2‐eGFP and σ2‐eGFP cells, respectively. CT (Control) lane is parental cell line, and siRNA lane is the corresponding knockdown. Lower band is loading control detected using trihalo‐UV gel stain, B, siRNA kd of α does not affect transferrin receptor internalization in α‐eGFP expressing cells. Comparison of, C, CCP Initiation and, D, mean lifetimes analyses in μ2‐eGFP cells treated with scrambled or endogenous μ2 siRNA. E, CCP Initiation and F, mean lifetimes analyses comparing σ2‐eGFP cells treated with scrambled or endogenous σ2‐eGFP plus endogenous σ2 siRNA. Experiments were replicated thrice. For all graphs above, error bars represent SD.