Abstract
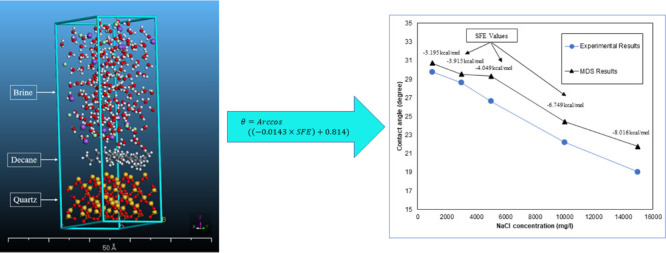
One of the techniques to increase oil recovery from hydrocarbon reservoirs is the injection of low salinity water. It is shown that the injection of low salinity water changes the wettability of the rock. However, there are argumentative debates concerning low salinity water effect on changing the wettability of the oil/brine/rock system in the oil reservoirs. In this regard, molecular dynamics simulation (MDS) as a tool to simulate the phenomena at the molecular level has been used for more than a decade. In this study, the Zisman plot (presented by KRUSS Company) was simulated through MDS, and then, contact angle experiments for n-decane interactions on the Bentheimer substrate in the presence of different concentrations of sodium ions were conducted. MDS was then used to simulate experiments and understand the wettability trend based on free-energy calculations. Hereafter, a new model was developed in this study to correlate free energies with contact angles. The developed model predicted the experimental results with high accuracy (R2 ∼ 0.98). A direct relation was observed between free energy and water contact angle. In contrast, an inverse relation was noticed between the ion concentration and the contact angle such that an increase in the ion concentration resulted in a decrease in the contact angle and vice versa. In other terms, increasing brine ionic concentrations in the presence of n-decane is linked to a decrease in free energies and an increase in the wetting state of a sandstone. The comparison between the developed model’s predicted contact angles and experimental observations showed a maximum deviation of 14.32%, which is in satisfactory agreement to conclude that MDS can be used as a valuable and economical tool to understand the wettability alteration process.
1. Introduction
Molecular dynamics simulation (MDS) is a pragmatic approach in the theoretical studies at different branches of science, such as medicine and engineering. It is also a computational method to analyze the time-dependent behavior of particle physical movements in an atomistic system. MDS is widely used to investigate the structure, dynamics, and thermodynamics of surface physiochemistry studies such as surface chemistry, different levels of energy, and contact angle.1,2 In this regard, research on the study of the MDS application in the petroleum upstream and downstream industry has been highlighted in the last decade.3−5 At upstream petroleum applications, most of the research was conducted to study wettability alteration caused by several methods, such as low salinity water flooding, and also to evaluate the rock wettability through contact angle. Such studies can significantly improve the efficiency of enhanced oil recovery processes and contribute to utilizing the maximum reservoir potential for producing initial oil-in-place.6,7
The surface preparation methods, including the degree of polishing and cleaning solvent, may affect the results of contact angle measurements.8 Generally, imbibition and evaporation would take place during the experiments; thus, the instantaneous and stabilized contact angles may vary significantly. Furthermore, most of the rocks are inherently heterogeneous formations that affect the measured wettability by the contact angle method. The measured contact angles are not uniform at various points.8 Controversial results have been obtained when measuring the contact angle of a water drop on oil-saturated rock samples (sessile method) with respect to the contact angle of an oil drop on water-saturated rock samples (captive method). In addition, both methods are influenced by the volume of the drop. Overall, measured wettability may not be consistent with the pore’s wettability.8
By using MDS based on contact angles, Mabudi et al. (2019) showed that the glass surface that was coated by graphene nanolayers reduced surface tension (σ) between water molecules and the surface. In the following, the effect of the glass surface on the water molecules was removed by increasing the nanoparticle layers to four layers. It must be considered that the unrelaxed surface would lead to unbalanced surface energy, thus it will show broad hydrophilicity. The results were in good agreement with previous laboratory studies.9 Xin et al. (2019) did a combination of MDS and laboratory study for low salinity water flooding on the calcite surface in the presence of dodecane oil. They showed that by increasing sulfate ions, the contact angle was decreased, and wettability was altered from the oil-wet to water-wet state. Regarding sulfate ions, the electrostatic interaction between brine and the surface, as well as the H-bonding interaction between the surface and oleic phase for the water film, has to be contemplated.10 Furthermore, Jia et al. (2019) used MDS and showed that originally oil-wet quartz surfaces became more water-wet upon removing adsorbed crude oil composition by using mixed surfactant systems. It has been shown that mixed surfactants reduce surface/interfacial tension.11 Xu et al. (2018) stated that the MDS of an ideal water/decane/silicon dioxide system showed that there was a linear relationship between surface charge and the oil nanodroplets’ contact angle. As a result, increasing surface charge from negative values to positive values resulted in increasing oil nanodroplets’ contact angles. Not only decreasing oil molecules density but also increasing oil droplet’s height results in higher contact angles between oil droplets and the surface at higher surface charge densities. However, increasing the surface charge density resulted in the enigmatic layered distribution of negative charges on account of the weak interaction in the oil/silicon dioxide system.12 Moncayo-Riascos et al. (2017) showed that 100 ppm of a commercial surfactant (polysorbate 80 or P80) could make the highest degree of n-decane contact angle and the smallest contact angle by a water droplet on the sandstone surface. In this matter, the interaction energy calculations by MDS were used, and obtained contact angles displayed less than 5% deviation with laboratory measurements.13
Various scenarios have been studied to explain interactions and to evaluate wettability through contact angle experiments and molecular dynamics calculations on various surfaces. Most MDS research studies had employed a couple of contributions of MDS and visualize molecular dynamic9,11,13,14 to be able to calculate contact angles that are not convenient to measure. Furthermore, they had predominantly utilized combined scenarios like mixed systems11 or simulating water molecules on coated surfaces.9 In this study, NaCl solution, n-decane, and Bentheimer substrate were chosen to study the interaction among the oil/brine/rock system and the effect of ionic concentration on changing the wettability of the system. In this matter, the one-factor-at-a-time method was conducted by contact angle experiments. A new model was developed to predict the contact angle using computed solvation free energy (SFE) by MDS. The approach of this study can be beneficial for those who are fundamentally studying the oil/brine/rock system to understand its wettability behavior and explore the phenomena among existence phases.
2. Methodology and Materials
The most common theory for defining surface energy is Zisman’s theory.15 According to this theory, if the contact angle data for a surface is plotted in the form of liquid surface tension (σ) versus cosine of contact angle (cos θ) and extrapolated to cos θ = 1 (θ = 0°, meaning completely wetting), the surface tension value at that point will be the surface energy. Any liquid having a surface tension lower than this will completely wet the surface. In total, 66 liquids (including alkanes) of widely varying properties were used on polytetrafluoroethylene16 to postulate this theory. Such plots are commonly called Zisman plots.17
The surface tension is an interfacial property, whereas the SFE describes the solute/solvent interaction, that is, a bulk fluid property; some authors15,18 have shown that the surface tension of a liquid droplet directly corresponds to its surface energy or free energy. While it is easy to measure the surface tension in the laboratory, directly measuring the surface energy of a solid is quite difficult. Therefore, validating SFE results obtained from MDS with laboratory-measured contact angles is practically not possible. This study uses Zisman’s observation that the graph of cos θ versus surface tension for any low-energy surface is almost a straight line.15 Following this logic, it was surmised that a cos θ versus SFE plot would be linear, assuming that the surface tension corresponds to the SFE.
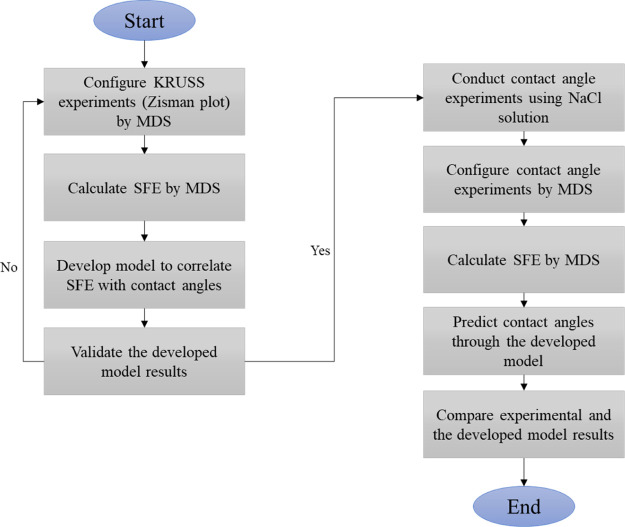
Therefore, the Zisman plot presented by KRUSS Company was simulated by MDS to calculate SFE and its corresponding contact angles. In this regard, according to the KRUSS findings, fluids that were in contact with untreated low-density polyethylene film (LDPE) were considered. In this matter, a model was developed to relate the calculated free energies with contact angle and then validated by KRUSS experimental results. In the second step, the contact angles of NaCl solutions on sandstone slabs in the presence of n-decane were measured by the goniometer in the laboratory. Then, they were simulated by MDS to present the application of the developed model. The chosen scenarios were 1k, 3k, 5k, 10k, and 15k (mg/L) NaCl solution in the presence of n-decane for a given quartz surface, according to the experimental process. Ultimately, the experimental and the developed model results were compared. Figure 1 illustrates the relevant flow diagram.
Figure 1.
Methodology flowchart.
2.1. Computational Details
There are various computational methods to compute molecular interaction calculations and study at a molecule level of phenomena. The Materials Studio software supports a wide range of molecular structures and calculations; thus, it was chosen as a molecular dynamic’s simulator. Among its’ modules, the Forcite module was used to calculate SFE in all scenarios. In this module, the thermodynamic integration algorithm was chosen for both electrostatic and van der Waals forces.
To simulate contact angles presented by KRUSS, the surface (polyethylene) interaction with the mentioned fluid molecules was simulated. For this, molecular structures were built to mimic the physiochemistry of the surface and fluids. To do so, through the polymerize tab of the homopolymer function, polyethylene was drawn. For the fluids, the “Sketch Atom” tool was used to draw them. Then, the angles between bindings in a molecular structure were required to be aligned. Therefore, the “Cleaning” tool was employed to do this.
At the outset, it must be deemed that the same condition and considerations should be employed for all scenarios to achieve logical and reliable results during the simulation. For doing this, energy values must be minimized to prepare molecules for upcoming interactions. Interaction is classified into bonded and nonbonded interactions. Bonded interactions include bond, angle, dihedral, and improper structures, and nonbonded interactions include van der Waals (short-range) and electrostatic (long-range) forces. Therefore, the relaxation process was accomplished by the “Geometrical Optimization” tool in the Forcite energy module. For this matter, the chosen forcefield was condensed phase optimized molecular potentials for atomistic simulation studies (COMPASS). COMPASS is the first forcefield that was parameterized and validated using condensed phase properties in addition to various initial and empirical data for molecules in isolation. It enables the system to predict structural, conformational, vibrational, and thermophysical molecule properties accurately and at the same time for wide array of molecules in isolation and condensed phases for a broad spectrum of temperature and pressure.19
Interactions for both electrostatic and van der Waals summation methods were contemplated group-based, and the medium quality by cut-off distance (12.5 Å) was selected for energy optimization. An amorphous cell was configured to let the software achieve an appropriate structure for initiating molecular dynamics’ computations of every scenario. The polyethylene and fluid molecules were loaded as the composition of amorphous cells individually. Thus, a 3D atomistic trajectory document for the respective design was created. The trajectory document contains frames, including configuration information such as positions, velocities, forces, dimensions of the simulation box, and so forth. The number of fluids and surface atoms was prepared in the range of 10–44 and 630–664, respectively. Also, the volume of amorphous cells was in the range of 4319–7686 Å3.
Because there is a possibility of existing stress points and diversity in the molecular structure density, applying a thermostat tool is beneficial to remove extra heat of the system. Simulations require to be performed at ambient temperature (298 K); thus, the Nosé–Hoover thermostat (NVT) canonical ensemble was used for constant number–volume–temperature in MDS. It is widely used as it is one of the most stringent and competent approaches for constant temperature.20 It is used to perform both production and equilibration run concurrently. To reduce the time of equilibrium calculations, 10 ps for total simulation time with 1 fs was identified. Based on dynamics energy calculation, changes in energies were not considerable, and it reached the plateau state after 5 ps. Thus, the equilibrium state was obtained.
To calculate SFE, the number equilibration and production runs were determined as 1000 and 5000 runs along with 1 fs time step. The polyethylene was defined as a solvent, and the other fluids were added as solute atoms to the system for achieving their free-energy values. The solute and solvent atom selection method is based on the calculation strategy, which makes fluids as the solute and polyethylene as the solvent. Otherwise, results would be incorrect because the design would not be in line with the experimental conditions. Last, the summation of three free energies contribution named as ideal, van der Waals, and electrostatic was calculated to compute SFE for every scenario. Unlike the ideal contribution, van der Waals and electrostatic took a longer time to compute. The time for van der Waals’s calculation was two times longer than the electrostatic calculation.
2.2. Contact Angle Measurements in the Laboratory
Contact angle experiments were accomplished to exhibit the application of the developed model and MDS capability as a tool in predicting the angles, according to the petroleum engineering studies. In this instance, experiment materials are prepared and characterized as per below:
2.2.1. Experiment Materials
2.2.1.1. Brine and Oil Preparation
Further to screening the literature and the requirement for more research on brine ionic concentration, sodium chloride salt was selected to make the brine. The designated concentration of NaCl was mixed with distilled water and stirred by the magnetic stirrer for 5 min in a cleaned beaker. Eventually, the concentration of brine was tested by the total dissolved solid meter. Moreover, n-decane was utilized as the oleic phase.
2.2.1.2. Core Characterization
Bentheimer was chosen as the substrate. To increase the accuracy of the experiments, two fresh core plugs were used. Furthermore, their diameter and length were measured by the digital caliper, and the measurement was 1.5 in. in diameter and 2.7 in. in length. The X-ray powder diffraction (XRD) technique was utilized by Kocurek Company, and the core mineralogy are categorized in Table 1.
Table 1. Mineralogy of Bentheimer Core by XRD Analysis Provided by Kocurek Company.
| type | mineral | weight (%) |
|---|---|---|
| silica | quartz | 88 |
| carbonate | dolomite | 1.4 |
| feldspars | K-feldspar | 4.7 |
| albite | 1.2 | |
| clay | kaolinite | 2 |
| illite | 1.8 | |
| chlorite | 0.7 | |
| montmorillonite | 0.2 |
The POROPERM apparatus was utilized to characterize porosity, permeability, pore-volume, grain volume, and bulk density using helium gas (as inert gas). Cores were mounted in a pressurized vertical confined core holder one by one under 400 psi confined pressure. Table 2 shows the measurements.
Table 2. Core Plug Characterization.
| core name | permeability (mD) | pore volume (cc) | grain volume (cc) | porosity (%) | bulk density (g/cm3) |
|---|---|---|---|---|---|
| Bentheimer core plug 1 | 3238.24 | 18.52 | 66.96 | 21.66 | 1.96 |
| Bentheimer core plug 2 | 3256.07 | 18.78 | 65.20 | 22.37 | 1.96 |
The prepared cores were trimmed to the slabs with dimension 1 × 3 cm2, and each slab was washed with the prepared brine. Finally, slabs were aged for one week at ambient temperature into the smaller beaker, which was already filled with the same brine concentration. This aging process was met to prepare the appropriate condition for contact angle experiments on the slabs.
2.2.2. Laboratory Measurements
The goniometer was used for performing contact angle experiments at ambient temperature and pressure, which is commonly being used. It has a chamber to hold both solid and liquid phases. It is equipped by a micrometer pipette for repelling liquid droplets, a lamp as a light source, and an integrated camera to take photographs of the drop profile. The tangent angle of the oil phase is measured at the contact point of the sessile drop to the surface. It must be considered that making horizontal alignment of the camera is crucial in measuring correct contact angles.
To start the experiment, the chamber was filled with the first brine concentration which was 1000 (mg/L) NaCl. Then, an aged slab in the same brine concentration was placed into the slab holder and mounted by two screws, and then, it was immersed into the chamber filled with brine. The chamber was aligned using basis screws in x, y, and z directions to fit the best horizontal axis in front of the camera using the visual display of the software. The camera was fixed in front of the horizontal axis in the middle of the chamber. Because the denser liquid phase is the water, an oil droplet is required to be injected underneath the slab surface whereby its contact angle could be measured by the software, and the camera was mounted. For this, oil was sucked into a specialized syringe with an inverted needle, and then, oil droplet was injected downward underneath the core slab. This method was called an “Inverse Pendant Drop.”
For every concentration, contact angles for three oil droplets on the related substrate for every minute (20 min for each droplet) were measured, and the average value was recorded. Along with this, every 5 min, the picture of the oil droplet shape was captured to visually monitor the changes of the droplet size, radius, and volume.
2.3. Simulation Configuration and Details
The basis of the simulation method and considerations was mentioned in Section 2.1. In this section, changes are toward making the proper layer/system for attaining logical results. At first, it must be highlighted that every component energy requires to be minimized before the combine and makes the final layer for the main calculations. Otherwise, calculations would encounter an error as the molecules would have predefined energies.
Materials were chosen as NaCl for a brine phase, quartz alpha as a substrate, and n-decane as an oil phase. It must be mentioned that the brine molecular structure is not predefined for the software, and it requires to be constructed. Therefore, the water molecule was combined into the NaCl periodic cell to make the brine.
2.3.1. MDS Component Preparation
2.3.1.1. Brine
Brine comprises water and salt to simulate the experiment. Therefore, water molecules and NaCl periodic cells were utilized to fabricate the NaCl solution. “Clean” tool was utilized on the water molecule to align the angles in the water structure between oxygen and hydrogen bindings. Then, the structural energy was minimized using the “Geometry Optimization” task in the Forcite module. Because the NaCl cell is periodic, there is no requirement to align it. In the next step, the optimized water molecule was combined into the NaCl periodic cell, and brine was prepared. Then, periodic condition was removed for making amorphous cells. Otherwise, an error would have occurred during the building layer, and it is hard to build it correctly. In this regard, an amorphous cell was built comprising NaCl solution, and lattice parameters were adjusted similar to the other amorphous cells using the “Confined Layer” task of amorphous cell calculation. It was chosen as it would be used in the layer construction process.
2.3.1.2. Oil
In this step, the n-decane molecular structure was drawn using the “Sketch” tool, and angles between carbon and hydrogen bindings were aligned by the “Clean” tool. The “Geometry Optimization” task was utilized to minimize the oil molecule energy and prepare it for interaction. Then, an amorphous cell with the same brine lattice parameters was configured using the “Confined Layer” task.
2.3.1.3. Substrate
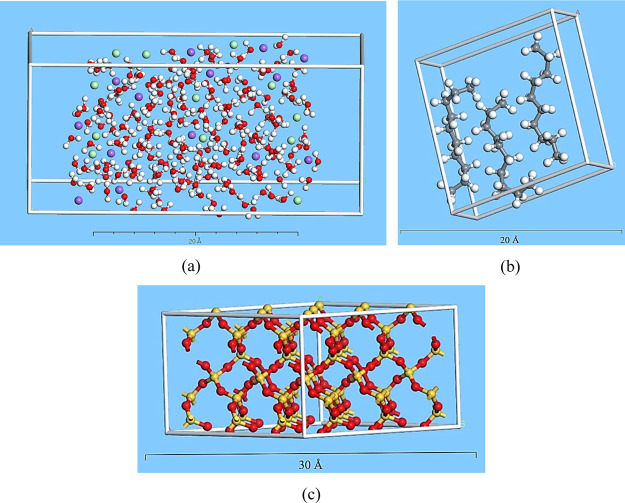
Because the majority percentage of common rock-forming minerals are silicates (88%), a quartz alpha periodic cell was used as a substrate, which is the most stable form of silica at ambient conditions.21 Preparing a substrate for the interaction requires the cell to be cleaved. “Cleaving” is a process to increase the surface area and change the periodicity (2D) for acquiring the designated crystal for calculations. Thus, a surface on a crystal structure was built to relax the structure. The thickness should not be less than the cut-off distance in forcefield adjustments. Thus, the cell was cleaved by the “Cleave Surface” task with thickness equals to 2 (fractional) and 20.818 Å for the position of the crystal. A supercell, three times bigger than the basic structure, was built through symmetry tasks to increase the surface area for simulation. Then, 2D periodicity was transformed into the 3D crystal by building a vacuum slab. The 3D slab lattice parameters were matched with prepared materials. As the surface is ionic, using the COMPASS forcefield for bonding between silica and oxygen is efficient in achieving accurate calculations. Ultimately, to minimize the energy and surface relaxation, the “Geometry Optimization” was exerted through the Forcite module. Figure 2 shows the final prepared oil, NaCl brine, and quartz substrate molecular structure for making the layer.
Figure 2.
Prepared optimized materials. (a) Optimized NaCl solution cell, (b) optimized n-decane periodic cell, (c) optimized quartz alpha 3D crystal. Colors: red is oxygen, white is hydrogen, purple is sodium, green is chloride, gray is carbon, and yellow is silica.
2.3.2. SFE Calculations
After preparing materials, layers were built for five varying NaCl brine concentrations. The macroscopic NaCl solution was reproduced based on the simulation box volume and NaCl molarity for each concentration. For doing this, the molarity of every NaCl concentration was determined. Then, according to the simulation box volume, the number of NaCl solution molecules (NaCl dissolved into water) was determined.
To build a layer structure as a crystal, three crystal layers for a defined scenario require to be chosen in the related tool called the “Build Layer.” The quartz alpha was chosen as the substrate for the first layer, the second and third layers were filled with n-decane and NaCl solution. The selection method was based on the experimental procedure as the oil droplet spread out on the substrate surface in the presence of water. The built layer is shown in Figure 3.
Figure 3.
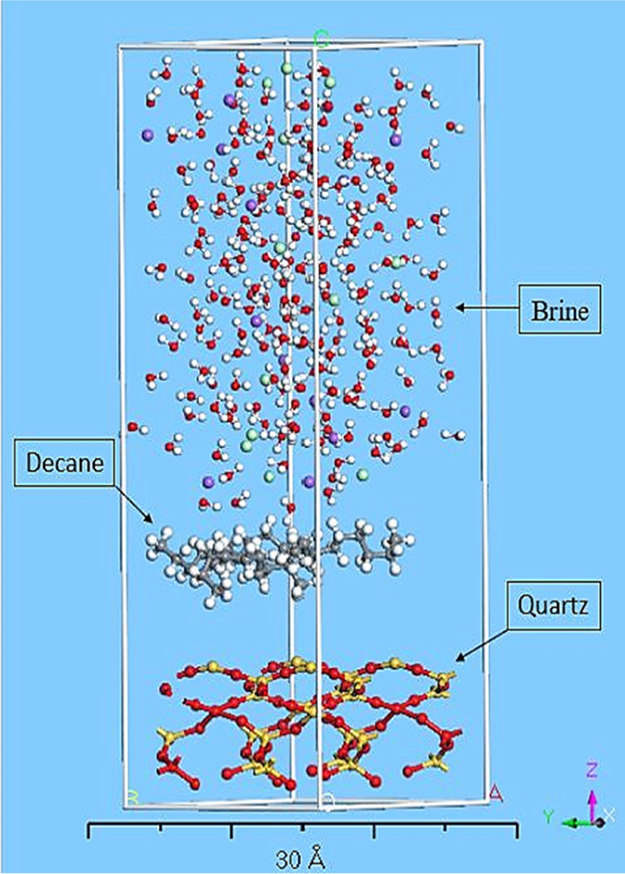
Constructed oil/brine/quartz system.
In the first step, the energy of the prepared system must be minimized. Thus, geometry optimization was carried out for the systems with success. Then, the system requires to be balanced. For this, the “Dynamics” task was used considering the NHL algorithm and NVT canonical ensemble at 1 fs time step and 0.5 ps simulation time. Along with this, a group-based interaction was selected based on defined charges for charge groups. The cut-off distance was 12.5 A, according to the medium quality of energy.
After dynamics calculation for the system which calculated potential and kinetic energies, the mentioned layer in Figure 3 was used to compute SFE for the respective scenario. Then, SFE was correlated to contact angle using a provided model that was explained in Section 2. SFE was calculated with the same assumptions for all scenarios to calculate free energies for interaction among the oil/brine/rock system. The considered algorithm for the calculations was “Thermodynamic Integration.” Contribution to the total free energy originates from ideal, van der Waals, and electrostatic forces. In this stage, n-decane molecules were selected as solute atoms and quartz alpha as the solution in the presence of NaCl brine.
3. Results and Discussion
3.1. Model Description
KRUSS presented a plot of liquid surface tension versus contact angle by utilizing the Zisman plot concept. The obtained contact angle data in the relevant liquid surface tensions were drawn for the 10 various fluids on untreated LDPE film. KRUSS data were in excellent agreement (R2 = 0.999) with Zisman.17 KRUSS measured the contact angle of n-pentane, n-hexane, n-heptane, n-octane, n-decane, cyclohexane, n-tetradecane, toluene, benzyl alcohol, and ethylene glycol.
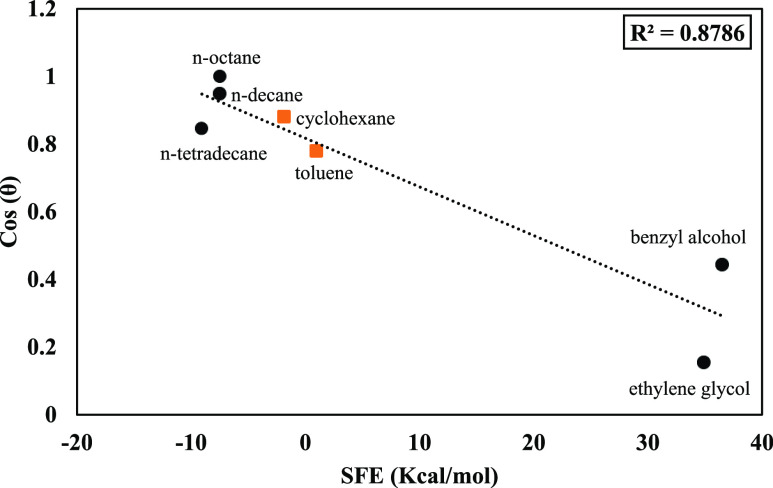
As mentioned above, surface tension and SFE are conceptually equal for a liquid droplet. Therefore, to correlate SFE and contact angle, SFEs for the same liquids and surface quoted from KRUSS were calculated by MDS and plotted versus cosine contact angle used by KRUSS, as presented in Figure 4. A linear trend was observed among data, where the contact angle could be predicted by using eq 1.
| 1 |
where θ is contact angle (degree), and SFE is solvation free energy (kcal/mol).
Figure 4.
Laboratory-measured contact angles by KRUSS vs MDS-computed SFE data.
The goodness of fit is presented by an R2 value in Figure 4, which shows that MDS can be an appropriate tool to simulate contact angle experiments for continuing research in petroleum engineering studies.
It should be recalled that in this study, the contact angle is calculated indirectly from the MDS results, where the SFE, as an output of the MDS, is used in line with eq 1 to calculate the contact angle. In addition to this, the contact angle is measured experimentally in the laboratory. In the final step, both calculated and measured contact angles were compared to verify the developed model (eq 1).
It must be mentioned that in KRUSS data, 4 out of 10 scenarios were reported as zero contact angle (n-pentane, n-hexane, n-heptane, and n-octane). Except for n-octane, the others were not considered because they represented repetitive results and were not contributing to developing this study’s model. Thus, 7 scenarios out of 10 are graphed in Figure 4. In this matter, 70% (circular black points) of data were used to train the model and 30% (square orange points) of them were employed to validate the developed correlation.
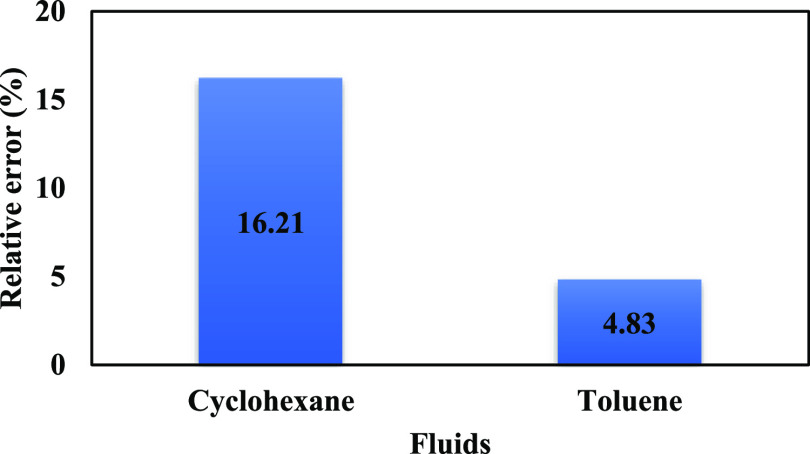
Figure 5 shows the relative error of cyclohexane and toluene that was a maximum of 16.21%. It implies that the model is validated because contact angles are predicted with high accuracy. Equation 2 represents the relative error formula.
| 2 |
where RE is the relative error (%), AD is the actual data (degree), and DM is the calculated data by the developed model (degree).
Figure 5.
Percentage of relative error for the calculated contact angles by the developed model.
3.2. Experimental Results
The criteria for executing modern technology in the petroleum industry is linked with fundamental factors like wettability preference of the system. One of the most prevalent experiments to determine the wettability of the system is the contact angle experiment. In this study, the contact angle experiment was utilized and known as a standard method to measure the quality of a solid surface and its interaction with other phases.
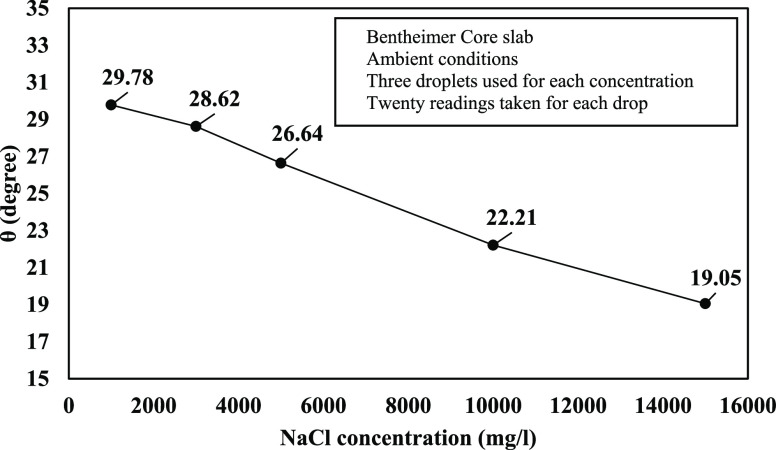
The contact angles measured through the goniometer in the laboratory are shown in Figure 6. It illustrates that the obtained degree was between 29.78 and 19.05 with a declining trend while ionic concentrations were increasing from 1k to 15k (mg/L) for monovalent (Na+) ions. Fjelde et al. (2012) observed the same trend of wettability changes during core flooding experiments on sandstone reservoir core plugs from the North Sea. The ion exchange on the clay surface was mentioned as the reason behind.22 In addition, Mahani et al. (2015) pointed out decreasing contact angle through injecting high salinity water after low salinity water injection. In this instance, the role of oil detachment kinetics in contact with low salinity brine was highlighted.23
Figure 6.
Experimental contact angle (θ°) results for 1k, 3k, 5k, 10k, and 15k (mg/L) NaCl concentrations.
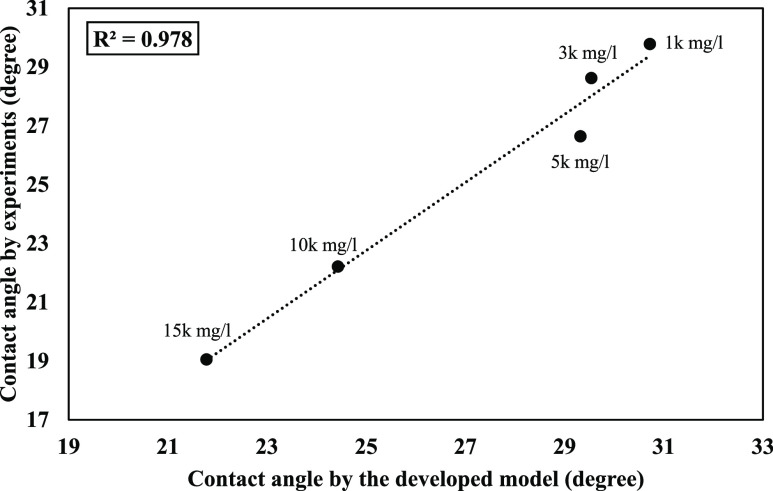
Figure 7 shows the calculated contact angles using eq 1 versus measured contact angles in the laboratory. In this figure, the developed model can predict the experimental results with a high level of confidence (R2 ∼ 0.98). Thus, MDS could be profitable to minimize the number of experiments, particularly wherein users are encountering experimental challenges.
Figure 7.
Contact angles obtained by experiments and the developed model for 1k, 3k, 5k, 10k, and 15k (mg/L) NaCl concentration.
Table 3 represents the SFE values for the mentioned NaCl concentrations and their corresponding contact angle in Figure 7.
Table 3. SFE Values and Its Corresponding Contact Angle.
The sign of free-energy (ΔG) value is representative of the interaction state. A negative value (ΔG < 0) represents spontaneous interaction, which is called exergonic interaction resulting in energy release. On the contrary, a positive value (ΔG > 0) demonstrates nonspontaneous interaction, which is called endergonic interaction that requires energy to be driven.24
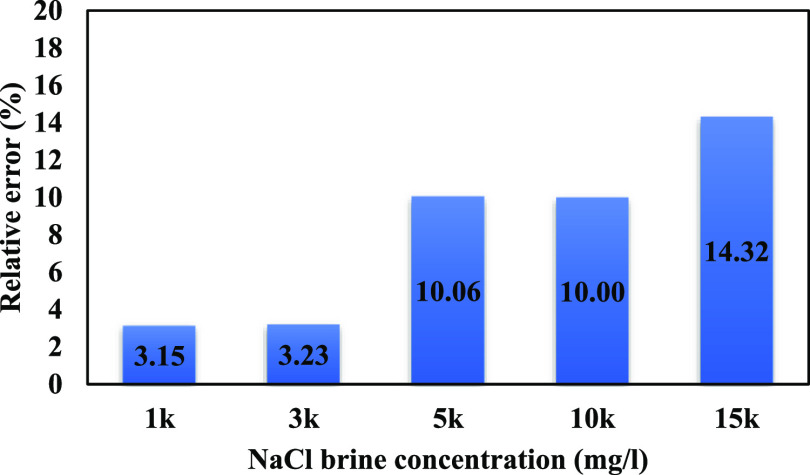
The relative error for the mentioned sodium concentrations is illustrated in Figure 8. The maximum error obtained is 14.32%.
Figure 8.
Relative errors for the computed contact angles.
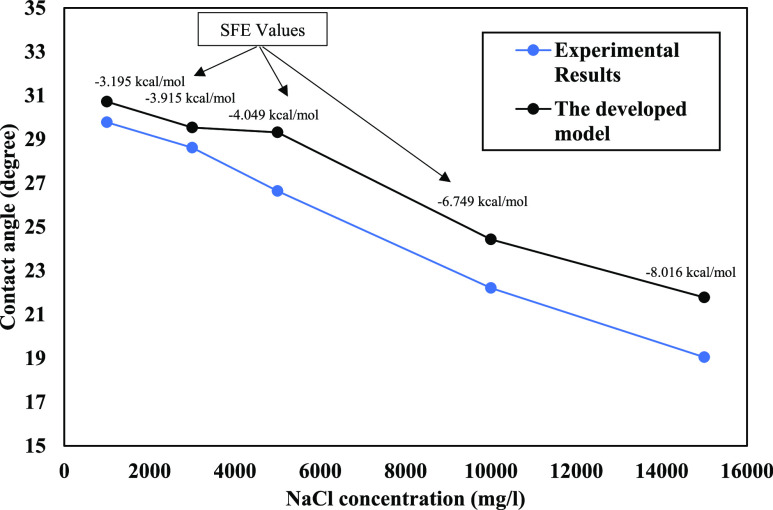
Figure 9 shows a comparison between experimental and the developed model results, where both are showing a decreasing trend. Free-energy values are illustrated by the upper side of the developed model results line (black line), indicating the direct relation between acquired free energies and water contact angles. Increasing free energy results in a higher water contact angle which means increasing the contact area between the oil droplet and substrate. These changes presented usage of low salinity brine, resulting in the less water-wet state for the system. The brine molecule’s movement direction was toward the substrate to make a water nanolayer at the interface because of spontaneous interactions between phases through increasing monovalent ions in the presence of different fluids on the given quartz surface.
Figure 9.
Developed model and experimental-measured contact angle trends.
Based on the present study experimental results, increasing the brine ionic concentration making the trend of contact angles toward more water-wet by disturbing thermodynamic equilibrium was initially established, resulting in a fresh equilibrium condition. According to Donaldson and Alem (2008), it is happening because free energy decreases and influences on making the more spherical shape of the oil droplet and less spreading on the surface because of the decreasing droplet radius.25
The oil component and the clay content of the chosen rock were the other two issues that require to be considered.26 The clay content of the chosen sand core plugs was less than 5%, which means the rock was clean sand.27 Additionally, in terms of the oil polarity property, the negatively charged carboxylic material (R–COOH) in the oil structure plays a crucial role in changing the wettability toward more water wetness using low salinity water injections.28,29 It must be noted that the structure of used n-decane comprised 10 carbon atoms bonded to hydrogens in the absence of the carboxylic group (Figure 3b). It is worth mentioning that the polarity of oil leaves a significant impact wherein polar brine and substrate are presented to alter the system equilibrium. The polar bindings between the surface and brine are mostly responsible for wettability alteration, whereas nonpolar oil has only a minor contribution. It is worth noting that in the presence of dirty sand (5% to more than 20% clay content27) and complex composition of crude oil including carboxylic acid at the reservoir temperature, the interaction can be varied, and results could drastically be changed for alike ionic concentrations.
Furthermore, free energy (ΔG) contributes to retaining the molecular interactions concerning surface chemistry. Likewise, activation energy (Ea) which is defined as the minimum energy that is required to initiate the geochemical interactions requires to be evaluated.28 It plays a crucial role because the rate of chemical interactions between the mineral surface and injected water can be controlled by Ea. The rate depends on bonding strength between oil components and surface minerals in the presence of water ions reactivity.28 However, acquired free energies showed that possessing a lesser amount of negative free energies resulted in making more water-wet status by increasing NaCl brine concentrations. Along with this, the role of temperature is significant. Temperature acts like a catalyst agent to increase the chemical interaction rate and triggers a strong relation with activation energy.28,30 Increasing temperature results in further molecular kinetic energy because of faster molecular movement.
4. Conclusions
In this study, an experimental as well as simulation study was conducted regarding the wettability alteration of sandstone. The system comprised n-decane oil, NaCl solution, and Bentheimer core plugs as substrates. To summarize, the conclusion can be drawn as below:
Zisman theory can be used to compute contact angles using calculate SFE by MDS.
MDS potential as a tool is shown to simulate laboratory results for improving confidence because it can predict an appropriate system.
A new model with high accuracy (R2 ∼ 0.98) is developed to predict experimental contact angles based on the SFE of the system.
The deviation between the developed model and laboratory result was a maximum of 14.32%.
The trend of wettability reversal is verified by the developed model. The laboratory angle trend was consistent with a few works of the literature, and it can be said conclusively that trend showed the more water-wet state by increasing salinity.
A direct relation between free energy and water contact angle is observed; nevertheless, an inverse relation by an ionic concentration changes.
MDS approach after calibration can be used to shorten the number of experiments in the laboratory.
Acknowledgments
The authors would like to acknowledge Universiti Teknologi PETRONAS for providing laboratory facilities to perform the experiments. Furthermore, financial support from the sponsoring PETRONAS company through Yayasan UTP (YUTP-015LC0/233) grant is gratefully appreciated.
Supporting Information Available
The Supporting Information is available free of charge at https://pubs.acs.org/doi/10.1021/acsomega.0c02133.
Dynamic energy of system and molarity amounts of each concentration (PDF)
The authors declare no competing financial interest.
Supplementary Material
References
- Akaishi A.; Yonemaru T.; Nakamura J. Formation of Water Layers on Graphene Surfaces. ACS Omega 2017, 2, 2184–2190. 10.1021/acsomega.7b00365. [DOI] [PMC free article] [PubMed] [Google Scholar]
- Zhang W.; Zou G.; Choi J.-H. Adsorption Behavior of the Hydroxyl Radical and Its Effects on Monolayer MoS2. ACS Omega 2020, 5, 1982–1986. 10.1021/acsomega.9b03837. [DOI] [PMC free article] [PubMed] [Google Scholar]
- Santos D.; Souza W.; Santana C.; Lourenço E.; Santos A.; Nele M. Influence of Asphaltenes in the Properties of Liquid–Liquid Interface between Water and Linear Saturated Hydrocarbons. ACS Omega 2018, 3, 3851–3856. 10.1021/acsomega.8b00102. [DOI] [PMC free article] [PubMed] [Google Scholar]
- Huang B.; Zhao R.; Xu H.; Deng J.; Li W.; Wang J.; Yang H.; Zhang L. Adsorption of Methylene Blue on Bituminous Coal: Adsorption Mechanism and Molecular Simulation. ACS Omega 2019, 4, 14032–14039. 10.1021/acsomega.9b01812. [DOI] [PMC free article] [PubMed] [Google Scholar]
- Leary T.; Yeganeh M.; Maldarelli C. Microfluidic Study of the Electrocoalescence of Aqueous Droplets in Crude Oil. ACS Omega 2020, 5, 7348–7360. 10.1021/acsomega.9b04259. [DOI] [PMC free article] [PubMed] [Google Scholar]
- Shabani A.; Zivar D. Detailed analysis of the brine-rock interactions during low salinity water injection by a coupled geochemical-transport model. Chem. Geol. 2020, 537, 119484. 10.1016/j.chemgeo.2020.119484. [DOI] [Google Scholar]
- Khosravi V.Developing Surfactant to Increase the Production in Heavy Oil Reservoirs. Trinidad and Tobago Energy Resources Conference; Society of Petroleum Engineers: Port of Spain, Trinidad, 2010; p 8.
- Sharifigaliuk H.; Mahmood S. M.; Padmanabhan E.. Evaluation of the Wettability Variation of Shales by Drop Shape Analysis Approach. SPE/AAPG/SEG Asia Pacific Unconventional Resources Technology Conference; Unconventional Resources Technology Conference: Brisbane, Australia, 2019; p 15.
- Mabudi A.; Noaparast M.; Gharabaghi M.; Vasquez V. R. A molecular dynamics study on the wettability of graphene-based silicon dioxide (glass) surface. Colloids Surf., A 2019, 569, 43–51. 10.1016/j.colsurfa.2019.02.028. [DOI] [Google Scholar]
- Xin J.; Li C.; Chai R. Effect of sulfate ions on oil detachment from calcite surface: experiments and molecular dynamics simulations. Arabian J. Geosci. 2019, 12, 305. 10.1007/s12517-019-4427-8. [DOI] [Google Scholar]
- Jia H.; Lian P.; Leng X.; Han Y.; Wang Q.; Jia K.; Niu X.; Guo M.; Yan H.; Lv K. Mechanism studies on the application of the mixed cationic/anionic surfactant systems to enhance oil recovery. Fuel 2019, 258, 116156. 10.1016/j.fuel.2019.116156. [DOI] [Google Scholar]
- Xu S.; Wang J.; Wu J.; Liu Q.; Sun C.; Bai B. Oil Contact Angles in a Water-Decane-Silicon Dioxide System: Effects of Surface Charge. Nanoscale Res. Lett. 2018, 13, 108. 10.1186/s11671-018-2521-6. [DOI] [PMC free article] [PubMed] [Google Scholar]
- Moncayo-Riascos I.; Cortés F. B.; Hoyos B. A. Chemical Alteration of Wettability of Sandstones with Polysorbate 80. Experimental and Molecular Dynamics Study. Energy Fuels 2017, 31, 11918–11924. 10.1021/acs.energyfuels.7b02263. [DOI] [Google Scholar]
- Moncayo-Riascos I.; Hoyos B. A. Comparison of Linear and Branched Molecular Structures of Two Fluorocarbon Organosilane Surfactants for the Alteration of Sandstone Wettability. Energy Fuels 2018, 32, 5701–5710. 10.1021/acs.energyfuels.7b02870. [DOI] [Google Scholar]
- Models for Surface Free Energy Calculation. 1999, kruss-scientific.com/fileadmin/user_upload/website/literature/kruss-tn306-en.pdf.
- David R.; Neumann A. W. Contact Angle Patterns on Low-Energy Surfaces. Adv. Colloid Interface Sci. 2014, 206, 46–56. 10.1016/j.cis.2013.03.005. [DOI] [PubMed] [Google Scholar]
- Zisman W. A.Relation of the Equilibrium Contact Angle to Liquid and Solid Constitution. Contact Angle, Wettability, and Adhesion; Advances in Chemistry 43; American Chemical Society, 1964; Vol. 43; pp 1–51. [Google Scholar]
- Orowan E. Surface energy and surface tension in solids and liquids. Proc. R. Soc. London, Ser. A 1970, 316, 473–491. 10.1098/rspa.1970.0091. [DOI] [Google Scholar]
- Sun H. COMPASS: An ab Initio Force-Field Optimized for Condensed-Phase ApplicationsOverview with Details on Alkane and Benzene Compounds. J. Phys. Chem. B 1998, 102, 7338–7364. 10.1021/jp980939v. [DOI] [Google Scholar]
- Posch H. A.; Hoover W. G.; Vesely F. J. Canonical dynamics of the Nosé oscillator: Stability, order, and chaos. Phys. Rev. A 1986, 33, 4253–4265. 10.1103/physreva.33.4253. [DOI] [PubMed] [Google Scholar]
- Sepehrinia K.; Mohammadi A. Wettability alteration properties of fluorinated silica nanoparticles in liquid-loaded pores: An atomistic simulation. Appl. Surf. Sci. 2016, 371, 349–359. 10.1016/j.apsusc.2016.02.218. [DOI] [Google Scholar]
- Fjelde I.; Asen S. M.; Omekeh A. V.. Low Salinity Water Flooding Experiments and Interpretation by Simulations. SPE Improved Oil Recovery Symposium; Society of Petroleum Engineers: Tulsa, Oklahoma, USA, 2012; p 12.
- Mahani H.; Berg S.; Ilic D.; Bartels W.-B.; Joekar-Niasar V. Kinetics of Low-Salinity-Flooding Effect. SPE J. 2015, 20, 008–020. 10.2118/165255-pa. [DOI] [Google Scholar]
- Nalwa H. S.Handbook of Surfaces and Interfaces of Materials, Five-Volume Set; Elsevier, 2001. [Google Scholar]
- Donaldson E. C.; Alam W.. Wettability; Elsevier, 2008. [Google Scholar]
- Austad T.Water-Based EOR in Carbonates and Sandstones: New Chemical Understanding of the EOR Potential Using “Smart Water”. Enhanced Oil Recovery Field Case Studies; Elsevier, 2013; pp 301–335. [Google Scholar]
- Walid Al Shalabi E.; Sepehrnoori K.. Chapter Eight—Comparison of LSWI/EWI Effect on Sandstone and Carbonate Rocks. In Low Salinity and Engineered Water Injection for Sandstone and Carbonate Reservoirs; Walid Al Shalabi E., Sepehrnoori K., Eds.; Gulf Professional Publishing, 2017; pp 133–141. [Google Scholar]
- Al-Shalabi P. E. E.; Sepehrnoori K.. Low Salinity and Engineered Water Injection for Sandstone and Carbonate Reservoirs; Elsevier Science, 2017. [Google Scholar]
- Lager A.; Webb K. J.; Black C. J. J.; Singleton M.; Sorbie K. S.. Low Salinity Oil Recovery—An Experimental Investigation1. Petrophysics SPWLA-2008-v49n1a2; Society of Petrophysicists and Well-Log Analysts, 2008; Vol. 49, p 8. [Google Scholar]
- Puntervold T.; Strand S.; Austad T. Water Flooding of Carbonate Reservoirs: Effects of a Model Base and Natural Crude Oil Bases on Chalk Wettability. Energy Fuels 2007, 21, 1606–1616. 10.1021/ef060624b. [DOI] [Google Scholar]
Associated Data
This section collects any data citations, data availability statements, or supplementary materials included in this article.


