

Abstract
Non-small cell lung cancers (NSCLC) have unique mutation patterns, and some of these mutations may be used to predict prognosis or guide patient treatment. Mutation profiling before and during treatment often requires repeated tumor biopsies, which is not always possible. Recently, cell-free, circulating tumor DNA (ctDNA) isolated from blood plasma has been shown to contain genetic mutations representative of those found in the primary tumor tissue DNA (tDNA), and these samples can readily be obtained using non-invasive techniques. However, there are still no standardized methods to identify mutations in ctDNA. In the current study, we used a targeted sequencing approach with a semi-conductor based next-generation sequencing (NGS) platform to identify gene mutations in matched tDNA and ctDNA samples from 42 advanced-stage NSCLC patients from China. We identified driver mutations in matched tDNA and ctDNA in EGFR, KRAS, PIK3CA, and TP53, with an overall concordance of 76%. In conclusion, targeted sequencing of plasma ctDNA may be a feasible option for clinical monitoring of NSCLC in the near future.
Keywords: NSCLC, Circulating tumor DNA, Next generation sequencing, Ion PGM/AmpliSeq cancer panel, Targeted sequencing
Introduction
Non-small cell lung cancers (NSCLC) are characterized by a unique pattern of genetic driver mutations, some of which are used to predict prognosis or guide patient treatment [1–3]. The mutation profile may change throughout the course of treatment, and many patients develop acquired drug resistance through secondary mutations [4,5]. Therefore, identifying mutations prior to and during treatment is essential to optimize patient outcome; however, repeated invasive tumor biopsies can be difficult to obtain and are not always feasible. Additionally, because lung tumors consist of heterogeneous sub-clonal cellular populations that constantly evolve [6–8], repeat biopsies may only provide limited spatial and temporal information i.e. a snapshot of only a fraction of the tumor at a single moment. Apoptotic or necrotic tumor cells, lysis of circulating tumor cells, or micro metastases shed by the primary tumor are thought to release DNA into the bloodstream, and this circulating tumor DNA (ctDNA), which can be isolated from blood plasma, can be used to identify genetic mutations associated with the primary tumor [9–13]. These non-invasive “liquid biopsies” are easier to obtain than tumor biopsies and repeat samples can readily be taken at different time points to monitor disease progression and treatment response [14,15].
Before plasma ctDNA can become a standard sample type in lieu of tumor biopsies for the identification of lung cancer mutations, it is important to determine if ctDNA mutations are concordant and representative of the mutations found in DNA from primary tumor tissues. A variety of methods, including the BEAMing (beads, emulsion, amplification, and magnetics) approach, the Scorpion ARMS-based EGFR mutation detection method, and the peptide nucleic acid (PNA)-mediated polymerase chain reaction (PCR) clamping method have successfully been used to detect mutations in ctDNA from lung cancer patients [16–18]. Additionally, recent research using next generation sequencing (NGS) of ctDNA from lung cancer patients has identified concordant mutations between ctDNA and primary tumor DNA (tDNA). However, the primary focus of this prior research was on KRAS and EGFR [19–21], and only a few other mutations with clinical relevance to NSCLC have been investigated [22]. These studies and others that have analyzed ctDNA from different cancer types have used a variety of NGS detection methods [23–25], and hence the standardization of a reliable, affordable, and highly sensitive mutation detection method would greatly benefit the use of ctDNA for disease monitoring in a clinical setting. Additionally, as previous studies have analyzed only a small subset of genes, efforts to evaluate concordance between tDNA and plasma ctDNA mutations in a large number of genes would be valuable. Therefore, in the present study, we used a relatively inexpensive semiconductor-based targeted sequencing method to analyze and compare mutations at known hot-spot loci from 50 cancer-related genes in tumor cells and plasma ctDNA from 42 advanced-stage NSCLC patients from China.
Materials and methods
Ethics statement and patients
The study was approved by Tianjin Medical University General Hospital and Tianjin Chest Hospital. All patients provided appropriate written informed consent for the use of blood and lung tumor tissues under the approval of the Ethics Committees of Tianjin Medical University General Hospital and Tianjin Chest Hospital. All samples and medical data used in this study have been irreversibly anonymized. Lung tumor and plasma samples from 42 lung cancer patients were analyzed (Table 1). All patients, including 21 males, 19 females, and 2 of unknown sex, were diagnosed with stage IIIa, IIIb, or IV NSCLC, where 29 (69.0%) were adenocarcinoma, 7 (16.7%) squamous cell carcinoma (SCC), 1 (2.4%) large cell lung cancer, and 5 (11.9%) did not have validated information about classification. Smoking history was not assessed.
Table 1.
Clinical features of 42 lung cancer patients.
| Characteristic | n (%) |
|---|---|
| Age (years) | |
| Mean (SD) | 62.13 (8.87) |
| Median (range) | 62 (37–75) |
| Unknown | 4 (9.5%) |
| Sex | |
| Male | 21 (50.0%) |
| Female | 19 (45.2%) |
| Unknown | 2 (4.76%) |
| Pathological diagnosis | |
| Non-small cell lung cancer | 42 (100.0%) |
| Adenocarcinoma | 29 (69.0%) |
| Squamous cell carcinoma | 7 (1.67%) |
| Large cell lung cancer | 1 (2.38%) |
| Undetermined | 5 (11.9%) |
| Tumor stage | |
| IIIa | 21 (50.0%) |
| IIIb | 6 (14.3%) |
| IV | 15 (35.7%) |
Sample DNA preparation
Three types of samples were collected from each patient: fresh or formalinfixed paraffin embedded (FFPE) tumor tissue, peripheral blood lymphocytes (PBLs), and plasma. DNA was extracted from fresh tissue using the E.Z.N.A. Tissue DNA kit (Omega Bio-Tek, Norcross, GA), and from FFPE tissue using the QIAamp DNA FFPE Tissue kit (QIAGEN, Valencia, CA) as per the manufacturer’s instructions. EDTA tubes containing blood samples were centrifuged for 10 min at 1000 g. The cell pellets containing PBLs were stored at −20 °C until further use. The supernatants were further centrifuged at 10,000 g for 10 min, and plasma was harvested and stored at −80 °C until further use. DNA from PBLs was extracted using the E.Z.N.A. Blood DNA kit (Omega Bio-Tek), and ctDNA was extracted from at least 1 mL plasma using the QIAamp Circulating Nucleic Acid kit (QIAGEN) following the manufacturers’ instructions, respectively. DNA was quantified with the Qubit 2.0 Fluorometer and the Qubit dsDNA HS Assay kit (Life Technologies, Carlsbad, CA) as per the recommended protocol.
Ion PGM library preparation and sequencing
For each sample type, an Ion Torrent adapter-ligated library was made for the Ion AmpliSeq Library Kit 2.0 following manufacturer instructions (Life Technologies). Briefly, 50 ng pooled amplicons were end-repaired, and DNA ligase was used to ligate Ion Torrent adapters P1 and A. After purification with AMPure beads (Beckman Coulter, Brea, CA), adapter-ligated products were nick-translated and PCR-amplified for a total of 5 cycles. AMPure beads were used to purify the resulting library, and the concentration and size of the library were determined with the Agilent 2100 Bioanalyzer and Agilent Bioanalyzer DNA High-Sensitivity LabChip (Agilent Technologies), respectively.
Sample emulsion PCR and emulsion breaking were performed on the Ion OneTouch system using the Ion PI Template OT2 200 Kit v3 (Life Technologies) according to the manufacturer’s instructions. Next, Ion Sphere Particles (ISPs) were recovered and template-positive ISPs were enriched using Dynabeads MyOne Streptavidin C1 beads (Life Technologies) on the Ion One Touch ES (enrichment system) (Life Technologies). ISP enrichment was confirmed using the Qubit 2.0 Fluorometer. Ion PI v2 Chips (Life Technologies) were used for sequencing on the Ion Proton for 100 cycles and the samples were barcoded. Finally, the Ion PI Sequencing 200 Kit v3 (Life Technologies) was used for sequencing reactions, as per the recommended protocol.
The AmpliSeq Cancer Panel covers 739 mutational hotspot loci in 50 oncogenes and tumor suppressor genes and includes many well-known driver mutations. This panel is standardized and has been previously been used in a variety of cancers, including lung cancer [26–28].
Variant calling
Initial data from the PGM runs were processed with the Ion Torrent platform-specific pipeline software Torrent Suite to generate sequence reads, trim adapter sequences, and filter and remove poor signal-profile reads. Variant calling from the Ion AmpliSeq sequencing data was initially generated using Torrent Suite Software v3.0 with a plug-in “variant caller v3.0” program, then the following three filtering steps were used to eliminate erroneous base calling and generate final variant calling: (1) the average total coverage depth was defined as >100, each variant coverage as >20, variant frequency of each sample >0.5%, and P value <0.01; (2) visual examination of the mutations was performed using Integrative Genomics Viewer (IGV) software (http://www.broadinstitute.org/igv) or Samtools software (http://samtools.sourceforge.net) and possible errors specific to one DNA strand were filtered out; and (3) variants were set within the 737 mutational hotspots, following the manufacturer’s instructions.
Statistical analysis
For statistical analysis, tumor DNA was considered the reference for comparisons to ctDNA. Matched tumor and ctDNA samples that carried the same mutations were classified as true positives; true negatives were classified as those where both samples had no mutations; mutations identified in ctDNA that were not found in tDNA were classified as false positives; and mutations identified in tDNA but not in ctDNA were classified as false negatives. Three samples with both false positive and false negative mutations were counted as 0.5 in each category to maintain a total sample number of 42. The sensitivity, specificity, and concordance rate ([true positive þ true negative]/n) were calculated along with their corresponding confidence intervals (CIs) where applicable. Analyses were performed using the SPSS Statistics version 20 (IBM Corp).
Results
Sequence coverage with the ion PGM
Of the 42 NSCLC tumor DNA and matched plasma ctDNA samples analyzed herein, the distribution of sequence lengths was essentially normally distributed, and most of the lengths were between 60 and 160 bp; therefore, the sequences within this length range were selected to carry out further analysis (Fig. 1A). The GC content across all bases was roughly 50%; however, as the GC content from 1 to 20 bp fluctuated widely, this region of reads was removed during quality control (Fig. 1B). The quality scores across all bases shown in Fig. 1C illustrate the accuracy of the sequencing. The depth of each amplicon of all plasma samples is shown in Fig. 1D, where most amplicons were over 10,000×.
Fig. 1.
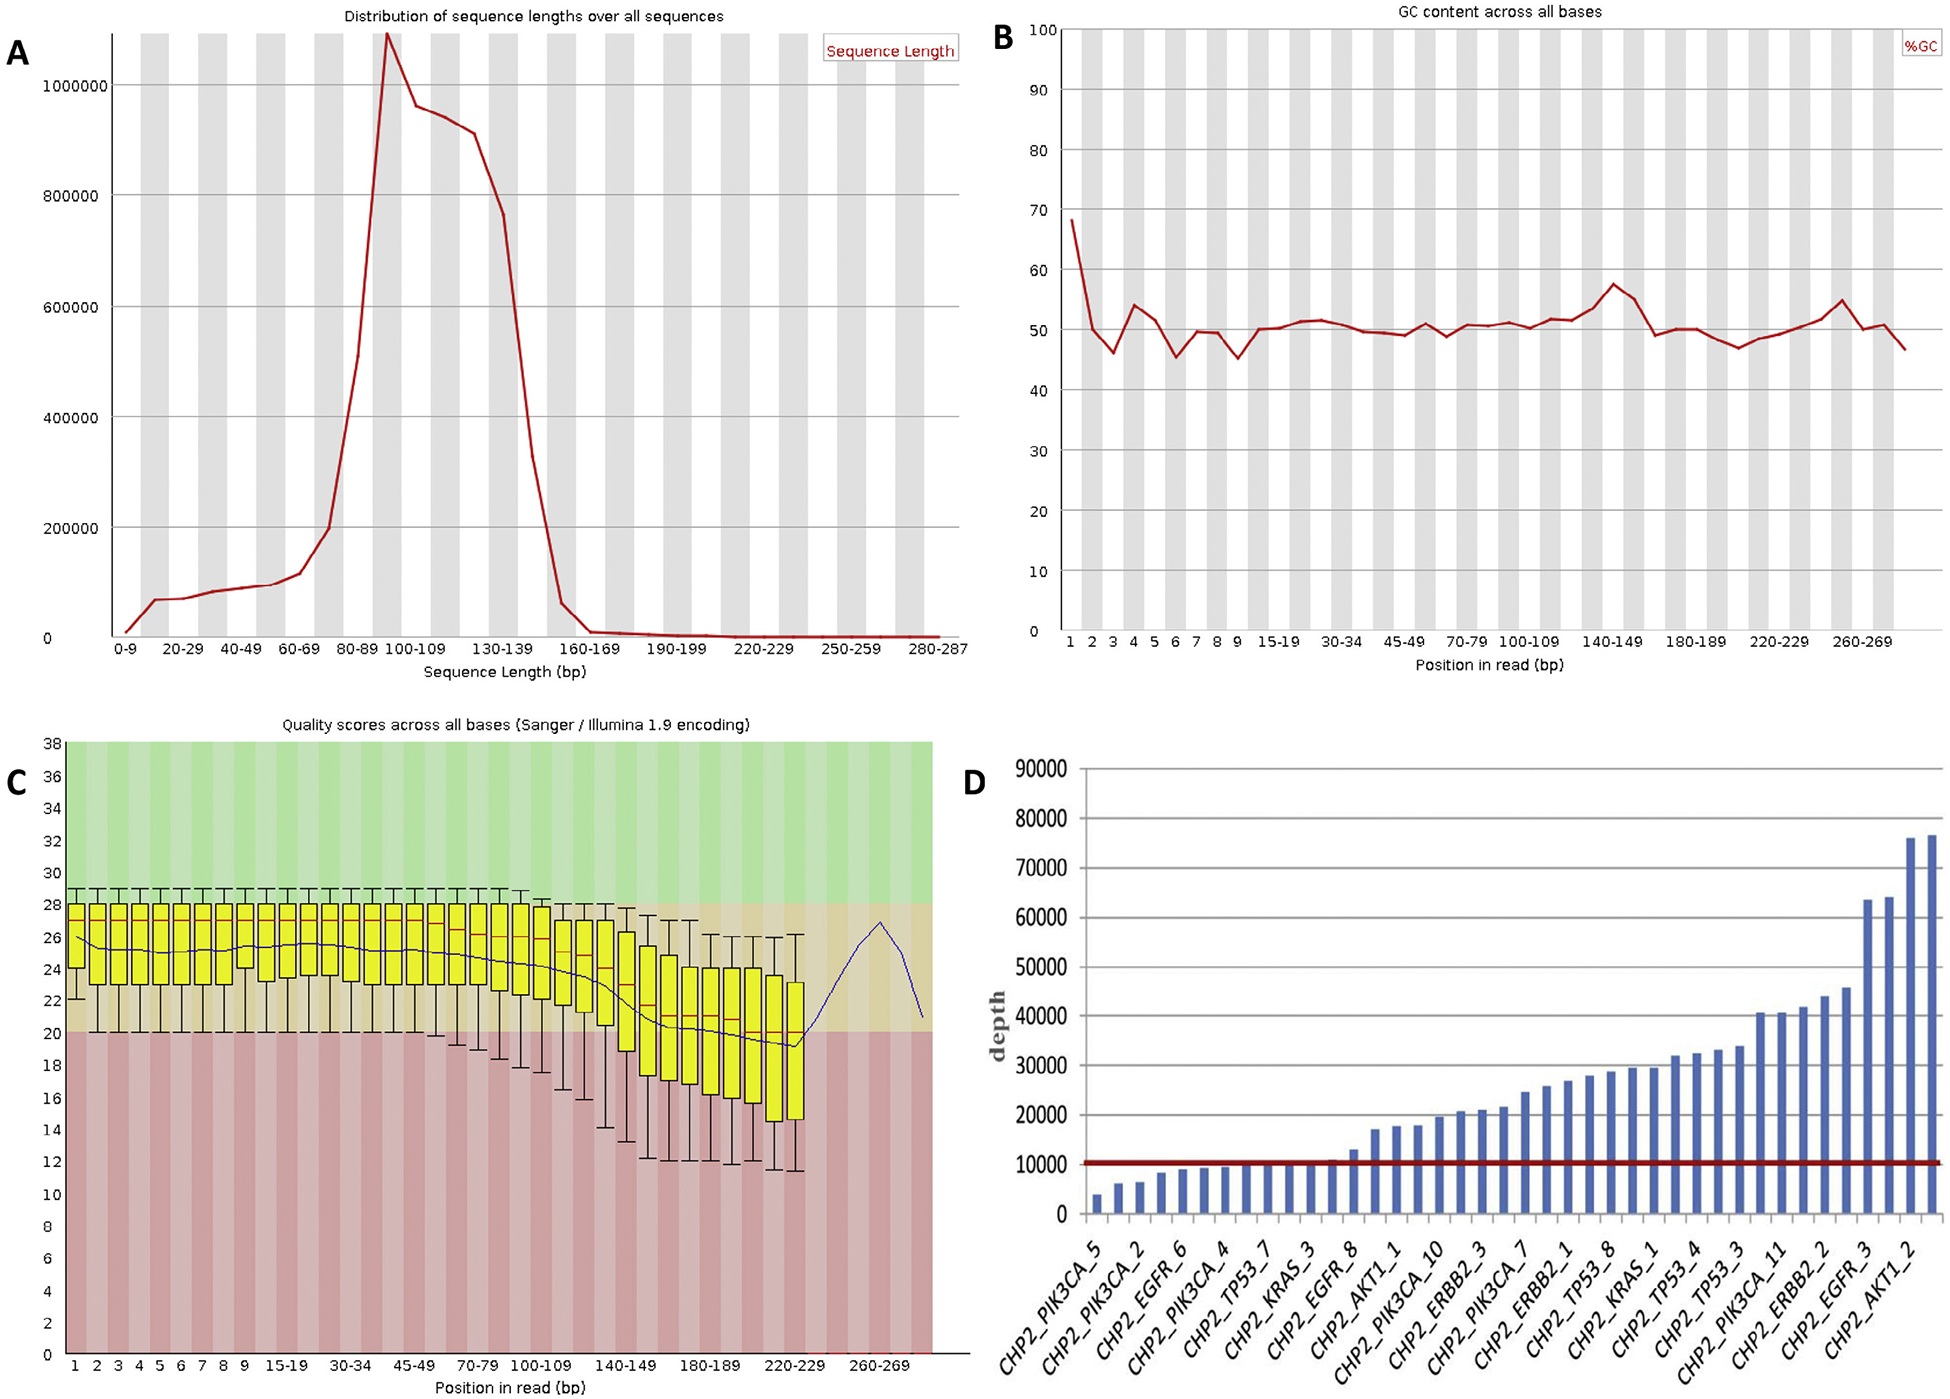
Sequence coverage with the Ion PGM. (A) Distribution of sequence lengths over all sequences of ctDNA-NSCLC-0110 (plasma) is shown. According to the figure, the distribution of sequence lengths was approximately normally distributed, and most of the lengths were in the range between 60 and 160bp. Therefore, the sequences in this range of lengths were selected to carry out further analysis. (B) GC content across all bases of ctDNANSCLC-0110 (plasma). Based on the figure, the GC content in the position from 1 to 20 bp fluctuates widely. Thus, this region of reads was removed during quality control. (C) Quality scores across all bases of ctDNA-NSCLC-0110 (plasma). Every base called from NGS has a quality score which illustrates the accuracy of sequencing. (D) The depth of each amplicon of all plasma samples. According to the figure, the depth of most amplicons is over 10,000×.
tDNA and matched plasma ctDNA sample concordance
Concordant mutations were identified in both tDNA and plasma ctDNA in 20 of the 42 samples (47.6%) (Fig. 2A), and 3 of these sample pairs contained mutations in two genes. 12 samples (28.6%) did not contain mutations in any of the 50 genes screened in our cancer gene panel, with concordance for all 12 between tDNA and plasma ctDNA. Thus, the overall concordance rate of tDNA to matched plasma ctDNA was 76.2% (32/42 samples) (Fig. 2B). For 17 of the concordant sample pairs, the mutation percentages found in tDNA was greater than those found in plasma ctDNA (39.8% average with a range of 13.5–100% compared to 7.4% average with a range of 0.1–53.2%, respectively), whereas 3 concordant sample pairs had higher mutation percentages in plasma ctDNA than those in tDNA (21.8% average with a range 2.0–34.2% compared to 17.9% average with a range of 1.0–26.4%, respectively).
Fig. 2.
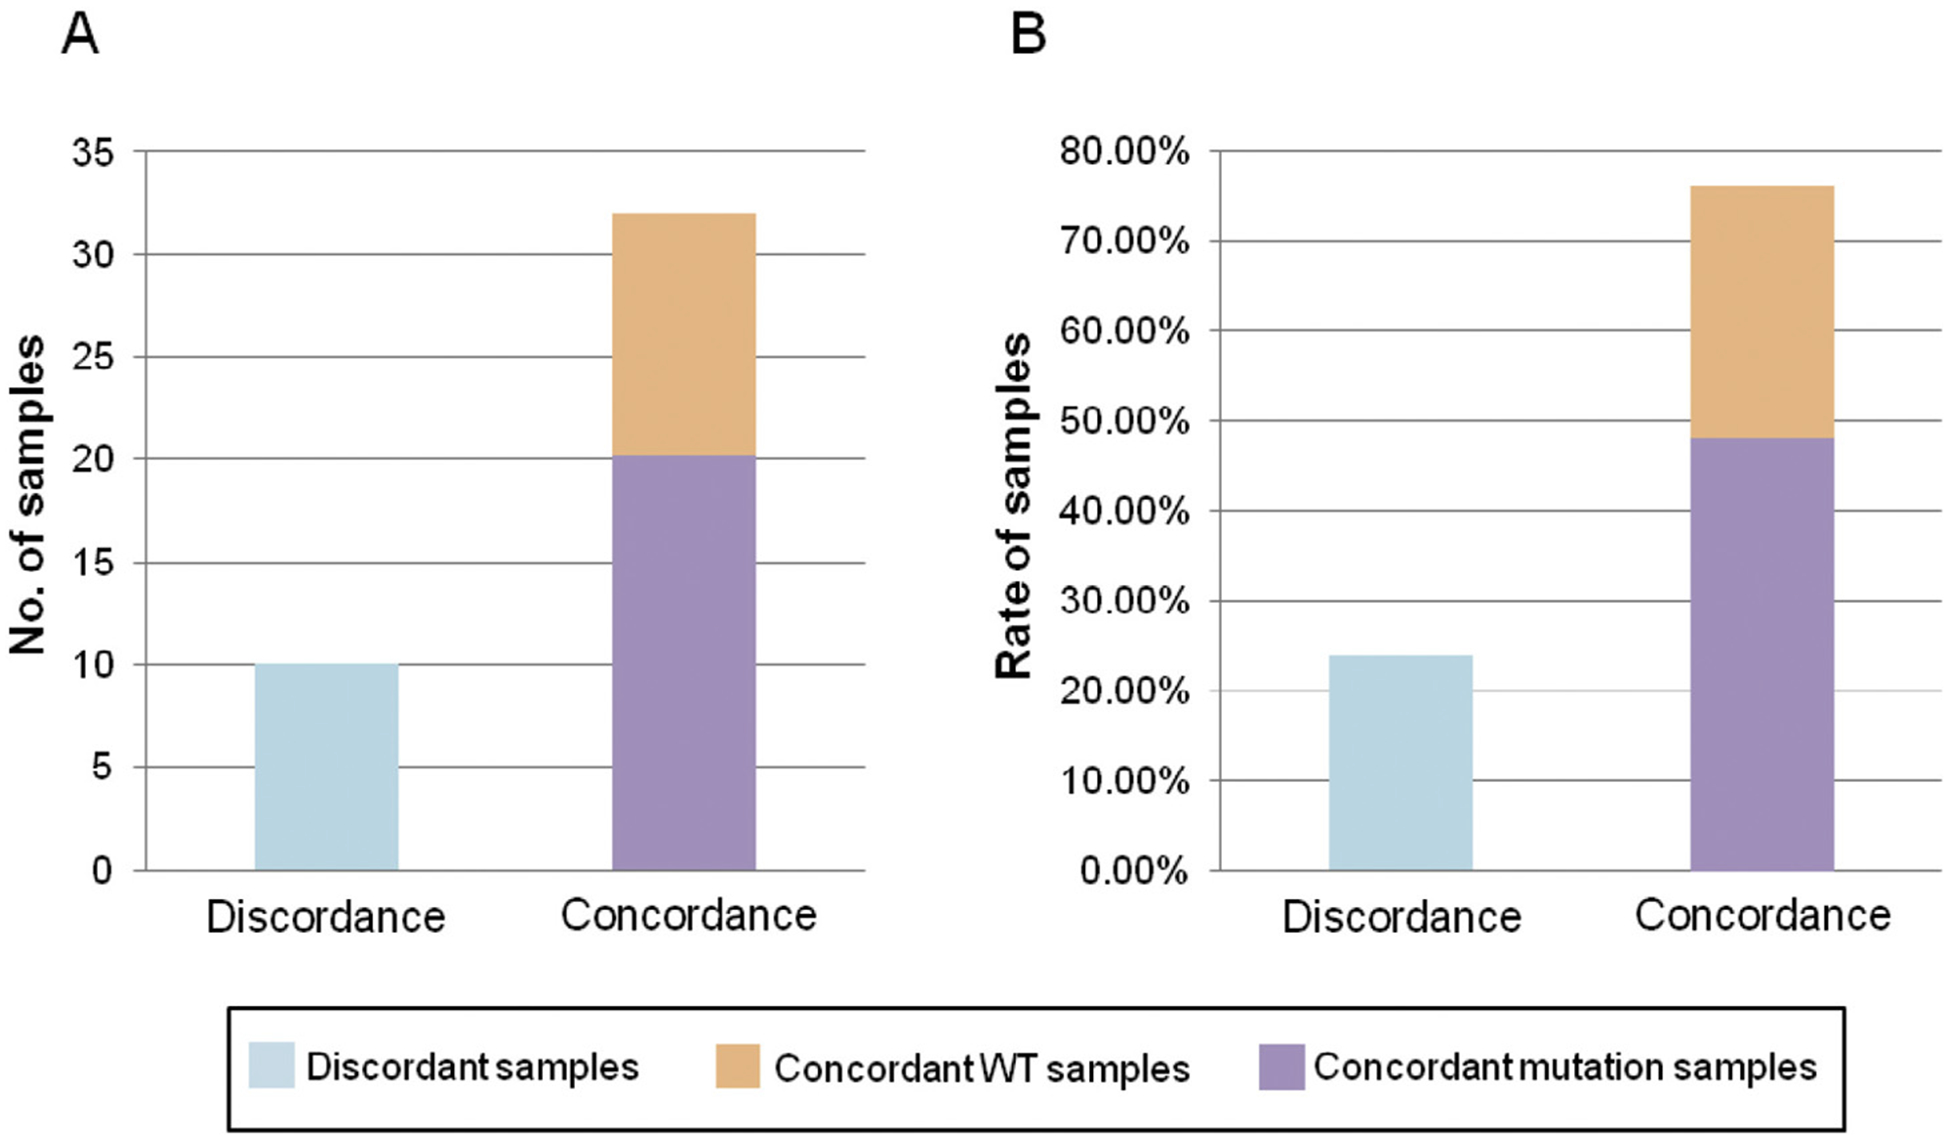
tDNA and matched plasma ctDNA sample concordance. (A) The number of patients with concordant (including WT and mutations) and discordant mutations in matched tDNA and plasma ctDNA samples. (B) The rate of patients with concordant (including WT and mutations) and discordant mutations in matched tDNA and plasma ctDNA samples.
The remaining 10 matched sample pairs (23.8%) had discordant mutations between tDNA and plasma ctDNA, and 8 of these contained discordant mutations in two to four genes. Of the 10 discordant sample pairs, 2 contained mutations in tDNA but not in plasma ctDNA, 5 had plasma ctDNA mutations not found in the tDNA, and 3 contained mutations in both tDNA and plasma ctDNA though these mutations were not the same. The average mutation frequency for the discordant tDNA samples was 33.2% (range: 5.9–82.4%), whereas the average mutation frequency for discordant plasma ctDNA samples was 20.7% (range: 1.0–66.6%).
Driver mutation detection in matched tDNA and plasma ctDNA samples
Of the 20 matched samples with concordant mutations in tDNA and plasma ctDNA, mutations were found in the following known driver genes: EGFR (20.0%), KRAS (30.0%), PIK3CA (20.0%), and TP53 (45.0%) (Table 2). Of the 10 discordant sample pairs, 8 had unmatched mutations identified in plasma ctDNA but not in tDNA in the following genes: EGFR (70%), KRAS (40%), PIK3CA (20%), TP53 (10%), and BRAF (10%) (Table 3). Additionally, 3 of these plasma ctDNA samples contained two or more discordant EGFR mutations per sample, and 2 samples contained two KRAS mutations. Additionally, 5 of the 10 discordant sample pairs had mutations in tDNA but not in ctDNA in EGFR (30%), TP53 (30%), and ERBB2 (10%), and one of these samples contained two mutations in TP53 (Table 4). White blood cells (WBC) from each patient were also analyzed and none of the samples contained mutations greater than 0.1%, indicating a low level of background in the sequencing reads. Mutation patterns of matched primary lung cancer tDNA, plasma ctDNA, and WBC are illustrated in Fig. 3.
Table 2.
Concordant mutations detected in matched primary tumor tissue and plasma DNA.
| Patient no. | Cancer type | Tumor stage | Position | Gene | Mutation (amino acid change) | Mutation type | % Mutation: tumor (reads) | % Mutation: plasma (reads) | % Mutation: WBC (reads) |
|---|---|---|---|---|---|---|---|---|---|
| 1 | UKN | IV | chr12:25398285 | KRAS | p.G12S | SNP | 20.8 (1457) | 2.0 (38182) | 0.0 (1758) |
| chr17:7577094 | TP53 | p.R243W | SNP | 22.4 (3673) | 2.9 (16441) | 0.0 (7293) | |||
| 2 | UKN | IV | chr12:25398284 | KRAS | p.E542K | SNP | 38.5 (4557) | 2.6 (18433) | 0.0 (1259) |
| chr3:178936082 | PIK3CA | p.G12V | SNP | 36.6 (2299) | 6.0 (22197) | 0.0 (544) | |||
| 9 | AC | IV | chr7:55259515 | EGFR | p.L858R | SNP | 94.1 (21309) | 3.5 (22058) | 0.1 (2373) |
| 13 | AC | IV | chr17:7578221 | TP53 | p.170_170del | DEL | 68.0 (688) | 53.2 (9707) | 0.0 (773) |
| 14 | UKN | IV | chr12:25398285 | KRAS | p.G12C | SNP | 36.9 (2793) | 3.1 (17862) | 0.0 (1944) |
| 15 | AC | IV | chr7:55249159 | EGFR | p.V819V | SNP | 18.5 (519) | 0.1 (30426) | 0.0 (563) |
| 38 | AC | IV | chr17:7577538 | TP53 | p.R209Q | SNP | 72.2 (562) | 1.8 (23518) | 0.0 (811) |
| 39 | AC | IV | chr17:7578461 | TP53 | p.V118F | SNP | 22.9 (484) | 2.6 (7964) | 0.0 (643) |
| 54 | AC | IIIb | chr3:178936091 | PIK3CA | p.G115V | SNP | 33.2 (511) | 1.0 (18467) | 0.0 (1059) |
| chr17:7578469 | TP53 | p.E545K | SNP | 25.6 (769) | 0.7 (35173) | 0.0 (2136) | |||
| 93 | AC | IV | chr7:55242464 | EGFR | p.745_750del | DEL | 16.3 (1022) | 2.7 (50034) | 0.0 (843) |
| 94 | AC | IIIa | chr3:178917005 | PIK3CA | Intronic | SNP | 26.2 (728) | 29.2 (571) | 0.0 (252) |
| 95 | AC | IIIa | chr3:178917005 | PIK3CA | Intronic | SNP | 24.0 (542) | 20.0 (730) | 0.0 (313) |
| 98 | SCC | IIIb | chr17:7578478 | TP53 | p.P112R | SNP | 30.7 (1559) | 4.5 (9977) | 0.1 (1585) |
| 100 | AC | IIIb | chr12:25398284 | KRAS | p.G12D | SNP | 18.3 (9992) | 0.7 (53005) | 0.0 (16039) |
| 104 | AC | IIIa | chr17:7577580 | TP53 | p.Y195C | SNP | 13.5 (9995) | 0.2 (108944) | 0.0 (11422) |
| 108 | AC | IIIa | chr12:25398284 | KRAS | p.G12V | SNP | 1.0 (11929) | 2.0 (42432) | 0.0 (18570) |
| 110 | AC | IIIa | chr12:25398285 | KRAS | p.G12C | SNP | 26.4 (5905) | 34.2 (33282) | 0.0 (16680) |
| 122 | AC | IIIa | chr17:7579472 | TP53 | p.P33R | SNP | 100.0 (5283) | 37.2 (24925) | 0.0 (10701) |
| 129 | LCLC | IIIa | chr17:7579472 | TP53 | p.P33R | SNP | 85.0 (5618) | 0.8 (30074) | 0.0 (6335) |
| 136 | UKN | IIIa | chr7:55249063 | EGFR | p.Q787Q | SNP | 18.7 (1412) | 3.1 (9998) | 0.1 (3909) |
(SCC: squamous cell carcinoma; AC: adenocarcinoma; LCLC: large cell lung cancer; UKN: unknown; SNP: single nucleotide polymorphism; DEL: deletion).
Table 3.
Mutations detected in plasma ctDNA only of discordant sample pairs.
| Patient no. | Cancer type | Tumor stage | Position | Gene | Mutation (amino acid change) | Mutation type | % Mutation: tumor (reads) | % Mutation: plasma (reads) | % Mutation: WBC (reads) |
|---|---|---|---|---|---|---|---|---|---|
| 48 | UKN | IV | chr7:55241708 | EGFR | p.G719A | SNP | 0.0 (3528) | 3.4 (22307) | 0.0 (190) |
| chr7:55242511 | EGFR | p.D761Y | SNP | 0.0 (1000) | 3.5 (21853) | 0.0 (310) | |||
| chr12:25398285 | KRAS | p.G12C | SNP | 0.0 (2529) | 4.8 (17379) | 0.0 (312) | |||
| chr12:25398281 | KRAS | p.G13D | SNP | 0.0 (2536) | 3.6 (17465) | 0.0 (313) | |||
| 75 | AC | IIIA | chr7:55249071 | EGFR | p.T790M | SNP | 0.0 (2845) | 2.8 (9887) | 0.0 (1106) |
| chr12:25398284 | KRAS | p.G12V | SNP | 0.0 (19015) | 1.1 (14689) | 0.0 (7065) | |||
| 78 | AC | IIIA | chr7:55249071 | EGFR | p.T790M | SNP | 0.0 (130) | 21.5 (10975) | 0.0 (244) |
| 90 | AC | IIIA | chr17:7577538 | TP53 | Intronic | SNP | 0.0 (7432) | 9.5 (86317) | 0.0 (7353) |
| 114 | SCC | IIIA | chr7:140453136 | BRAF | p.V600E | SNP | 0.0 (7669) | 43.1 (17175) | 0.0 (3180) |
| chr7:55241708 | EGFR | p.G719A | SNP | 0.0 (10692) | 59.6 (91440) | 0.0 (4044) | |||
| chr7:55242464 | EGFR | p.745_749del | DEL | 0.0 (11397) | 60.4 (77443) | 0.0 (4330) | |||
| chr7:55242511 | EGFR | p.D761Y | SNP | 0.0 (11386) | 61.6 (76946) | 0.0 (4321) | |||
| chr7:55249005 | EGFR | p.S768I | SNP | 0.0 (4691) | 4.3 (10185) | 0.0 (2257) | |||
| chr7:55249012 | EGFR | p.D770delinsDG | INS | 0.1 (4688) | 3.9 (9952) | 0.1 (2257) | |||
| chr12:25398285 | KRAS | p.G12C | SNP | 0.0 (14166) | 66.6 (58977) | 0.0 (5117) | |||
| chr12:25398281 | KRAS | p.G13D | SNP | 0.0 (14211) | 65.0 (59150) | 0.0 (5138) | |||
| chr3:178936091 | PIK3CA | p.E545K | SNP | 0.0 (13901) | 51.4 (42929) | 0.0 (5936) | |||
| 118 | AC | IV | chr7:55242511 | EGFR | p.D761N | SNP | 0.0 (10264) | 1.1 (9481) | 0.0 (8745) |
| chr3:178936091 | PIK3CA | p.E545K | SNP | 0.0 (8801) | 1.2 (19609) | 0.0 (5406) | |||
| 123 | AC | IIIA | chr7:55241708 | EGFR | p.G719D | SNP | 0.0 (9315) | 1.1 (26694) | 0.0 (13761) |
| chr7:55242511 | EGFR | p.D761N | SNP | 0.0 (13069) | 1.0 (21772) | 0.0 (19806) | |||
| chr12:25398281 | KRAS | p.G13V | SNP | 0.0 (16150) | 1.0 (17697) | 0.0 (17816) | |||
| 139 | AC | IIIB | chr7:55249063 | EGFR | p.Q787Q | SNP | 0.3 (5833) | 4.1 (5984) | 0.0 (4334) |
SCC: squamous cell carcinoma; AC: adenocarcinoma; UKN: unknown; SNP: single nucleotide polymorphism; DEL: deletion; INS: insert.
Table 4.
Mutations detected in tumor tissue DNA only of discordant samples.
| Patient no. | Cancer type | Tumor stage | Position | Gene | Mutation (amino acid change) | Mutation type | % Mutation: tumor (reads) | % Mutation: plasma (reads) | % Mutation: WBC (reads) |
|---|---|---|---|---|---|---|---|---|---|
| 35 | AC | IV | chr17:37880981 | ERBB2 | p.E770delinsEAYVM | INS | 12.0 (1908) | 0.0 (9552) | 0.0 (258) |
| 53 | AC | IV | chr17:7578440 | TP53 | p.K125X | SNP | 53.5 (2110) | 0.0 (21288) | 0.0 (1298) |
| chr7:55259524 | EGFR | p.L861Q | SNP | 32.2 (14941) | 0.0 (10934) | 0.0 (879) | |||
| 75 | AC | IIIA | chr17:7577141 | TP53 | p.G227E | SNP | 11.7 (1683) | 0.0 (9551) | 0.0 (890) |
| chr7:55242469 | EGFR | p.747_753del | DEL | 49.5 (9795) | 0.0 (46146) | 0.0 (6804) | |||
| 78 | AC | IIIA | chr17:7577610 | TP53 | Intronic | SNP | 18.2 (1994) | 0.0 (76927) | 0.0 (13409) |
| chr17:7578457 | TP53 | p.R119L | SNP | 5.9 (11563) | 0.0 (43503) | 0.0 (13732) | |||
| 90 | AC | IIIA | chr7:55241708 | EGFR | p.G719A | SNP | 82.4 (17241) | 0.0 (66562) | 0.0 (2049) |
AC: adenocarcinoma; SNP: single nucleotide polymorphism; DEL: deletion; INS: insert.
Fig. 3.
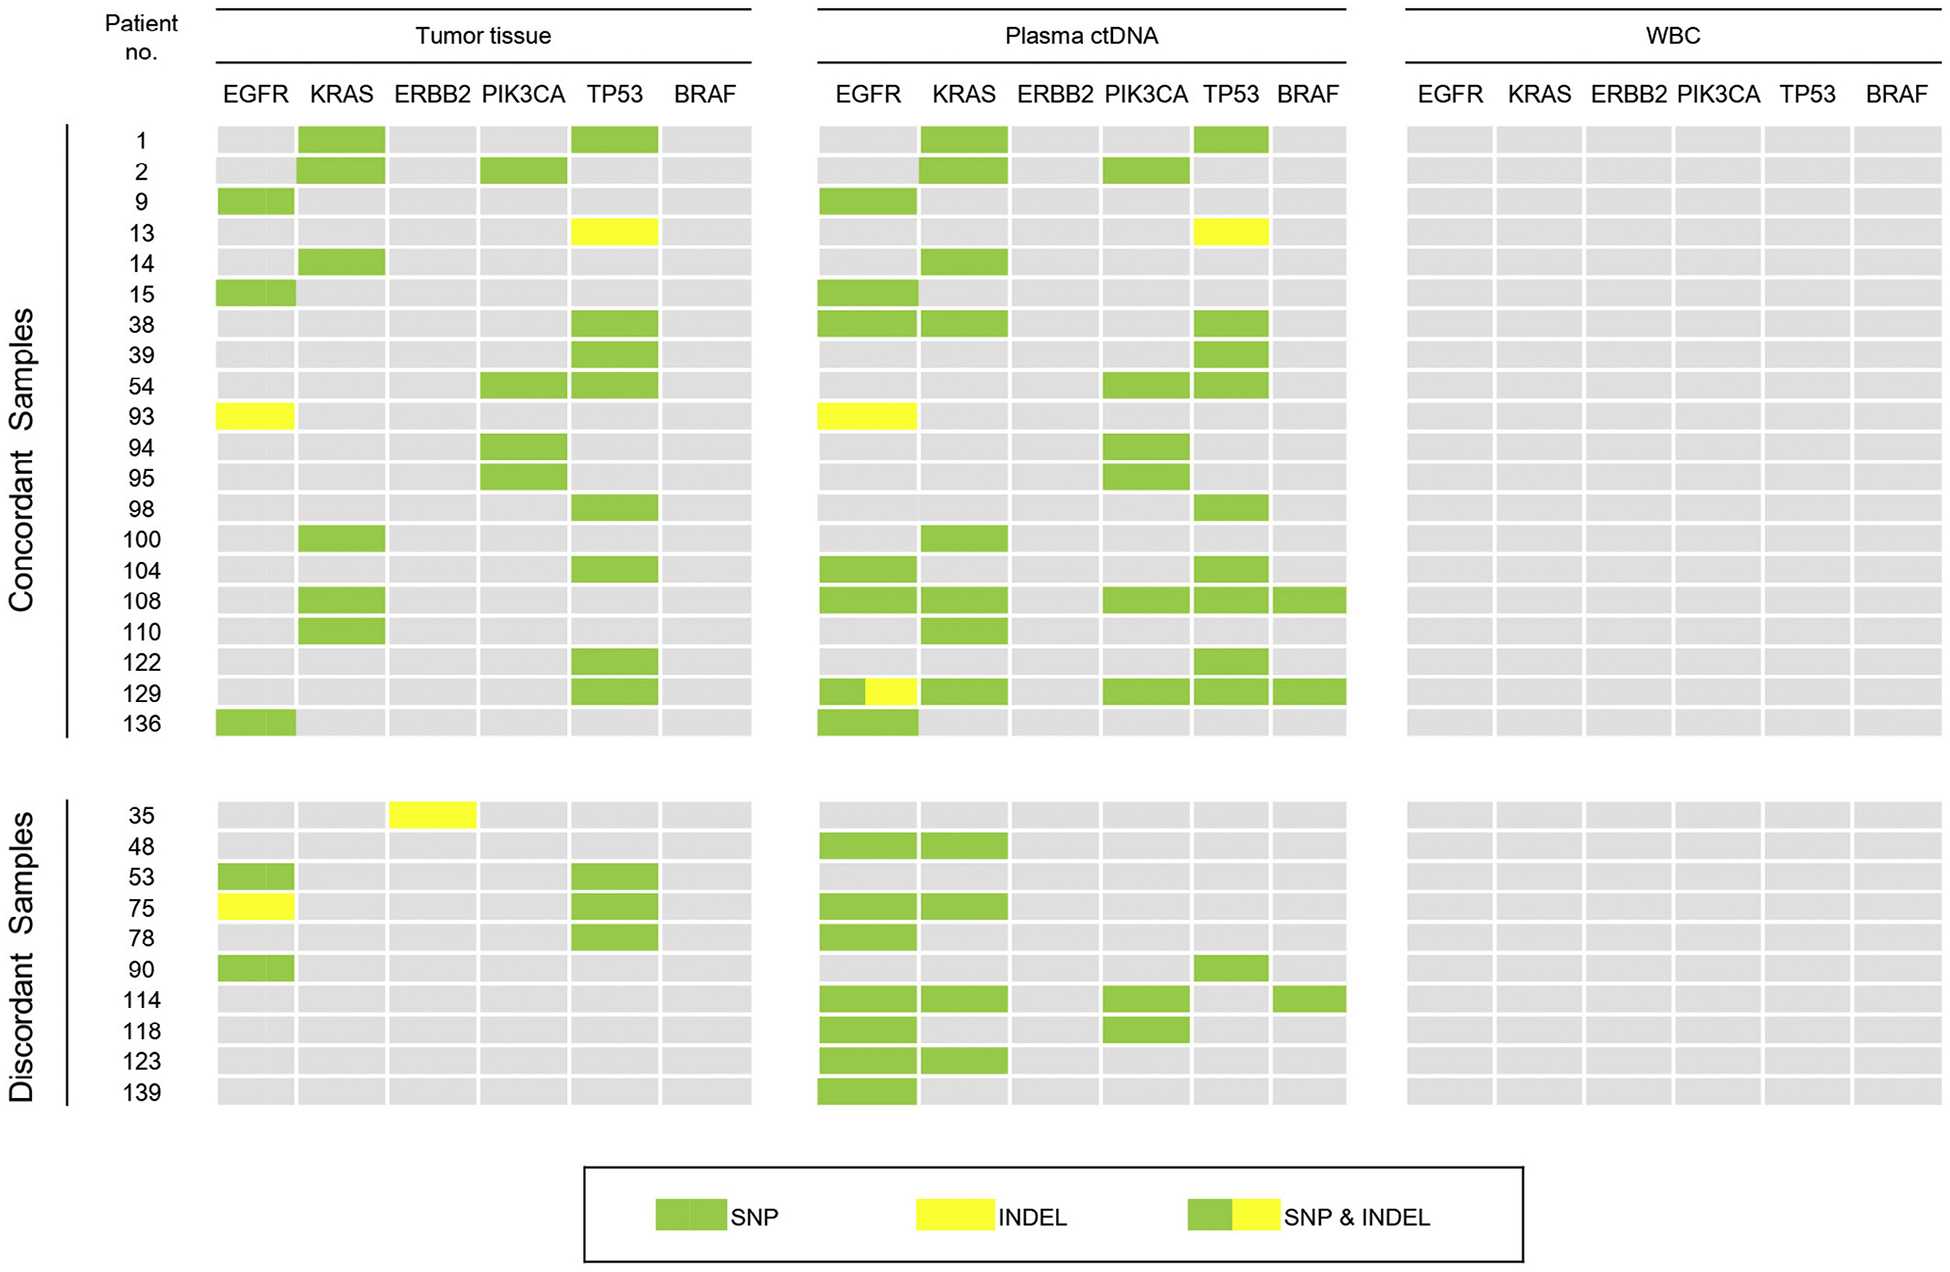
Mutation patterns of matched NSCLC cancer tDNA, plasma ctDNA, and white blood cell (WBC) DNA samples.
Including concordant and discordant mutations, a total of 31 mutations were identified in all tDNA and 46 mutations were identified in all plasma ctDNA samples. Collectively, EGFR mutations were the most common accounting for 31.2% (24/77) of all mutations. However, 16 of the EGFR mutations were found in sample pairs with discordant mutations, and 11 of these were in plasma ctDNA but not in tDNA. Of the remaining mutations, 32.5% (25/77) were in TP53, 23.4% (18/77) were in KRAS, and 13.0% (10/77) were in PIK3CA. Interestingly, while the TP53 mutation rate was similar between tDNA and plasma ctDNA, mutation rates in EGFR and KRAS were twice as high in plasma ctDNA compared to those in tDNA. Fig. 4A illustrates the different mutation rates in BRAF, EGFR, ERBB2, KRAS, PIK3CA, and TP53 in tDNA and plasma ctDNA.
Fig. 4.
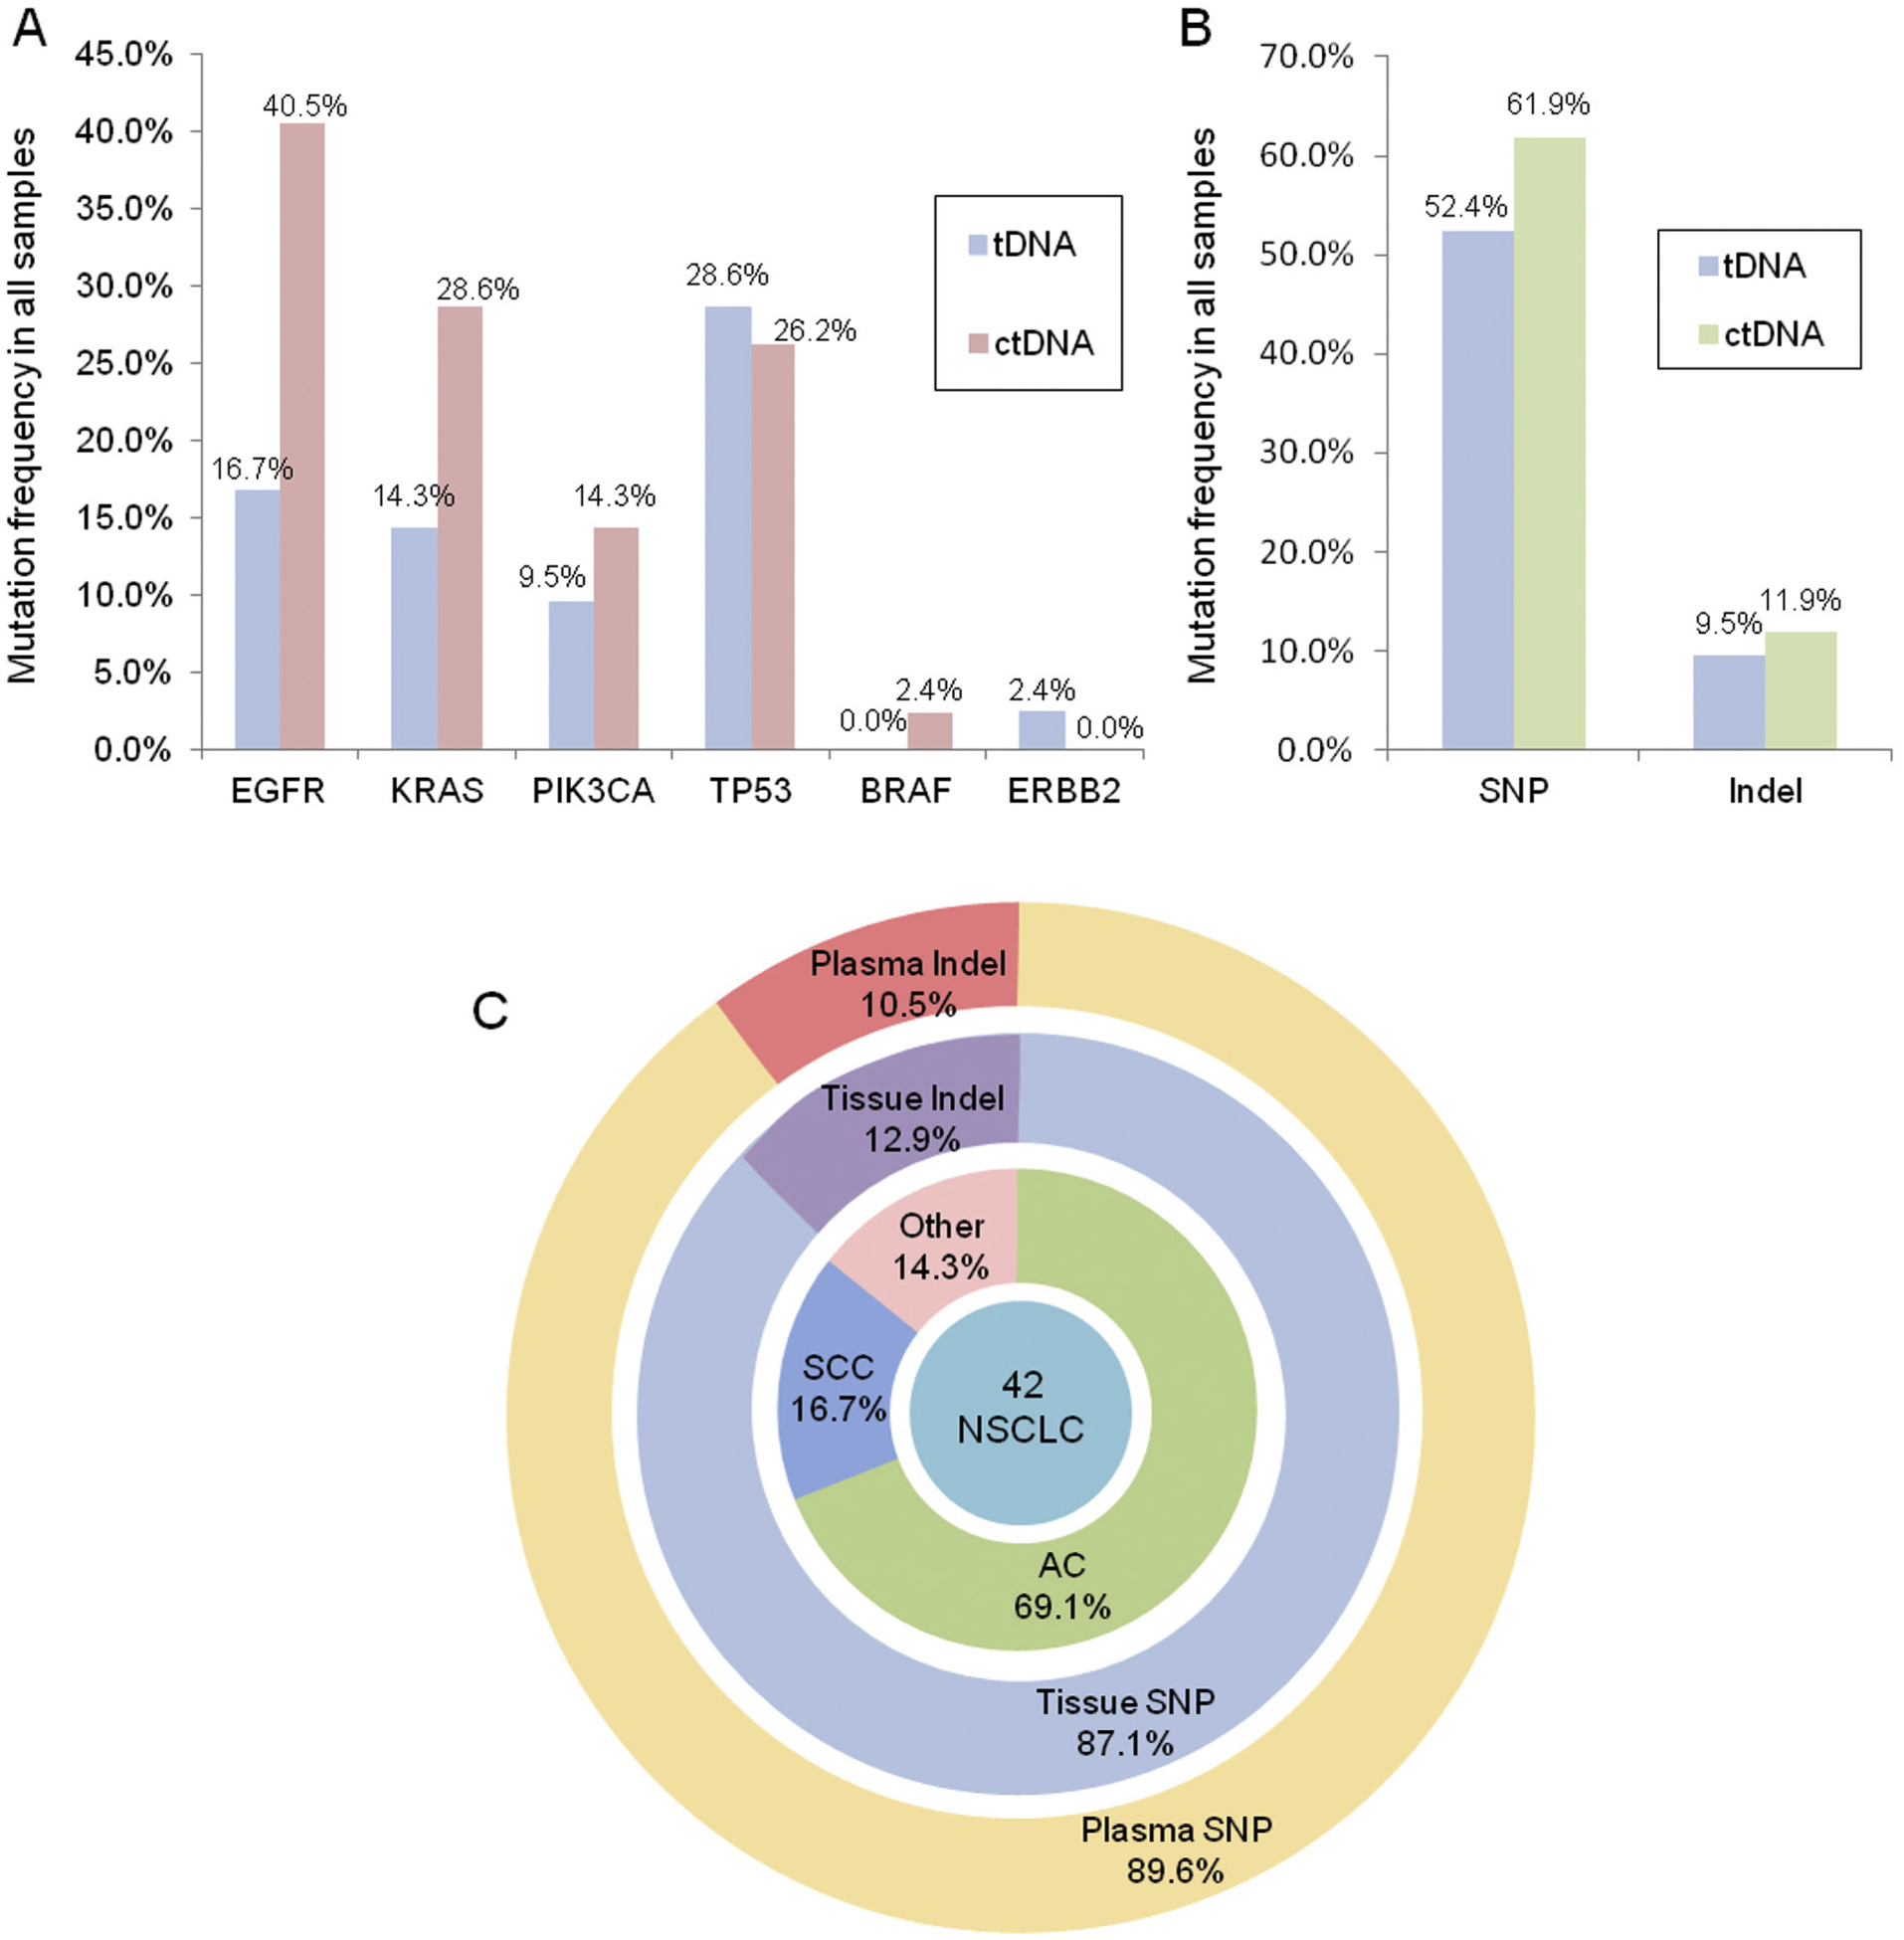
Comparison of the distribution of driver mutations identified in NSCLC tDNA and plasma ctDNA samples. (A) Mutation rates of EGFR, KRAS, PIK3CA, TP53, BRAF, and ERBB2 in the 42 sample pairs; (B) Rates of mutation types (SNPs vs. indels; n = 42 samples). (C) Pie chart showing the distribution of driver mutations identified in matched primary NSCLC tDNA and plasma ctDNA.
In total, 52.4% of tDNA samples contained single nucleotide polymorphisms (SNPs) and 9.5% had insertions or deletions (indels), whereas 61.9% of plasma ctDNA contained SNPs and 11.9% had indels (Fig. 4B). Overall, the majority of mutations identified in both primary tDNA and plasma ctDNA were SNPs (87.1% and 89.6%, respectively), and the remaining mutations were indels accounting for 12.9% of mutations in tDNA and 10.5% in plasma ctDNA (Fig. 4C). The indels in tDNA were found in EGFR, TP53, and ERBB2, whereas they were found in EGFR and TP53 in plasma ctDNA. Additionally, the indels were identified almost exclusively in the “unknown” types of NSCLC samples.
Discussion
To examine the utility of targeted sequencing in a clinical setting, the Ion PGM and AmpliSeq Cancer Panel were used to identify mutations at more than 739 mutational hotspots in 50 oncogenes and tumor suppressor genes in 42 matched tumor and plasma samples from Chinese advanced NSCLC patients. We found mutation concordance between tDNA and plasma ctDNA in 32 of 42 (76%) matched samples, of which 20 contained mutations in both tDNA and ctDNA, and 12 had no mutations in the 50 analyzed genes. Of the 20 concordant matched samples in which mutations were identified, three harbored combination mutations in two genes. In addition to tumor and plasma ctDNA mutations, we found that three patients also had concordant mutations in white blood cells WBC, but the mutation percentage was less than 0.1%. Overall, the sensitivity of detecting mutations in ctDNA that were also present in primary tumors was 85% (95% CI = 71–99%), and the specificity was 65% (95% CI = 43–87%).
Ten of the sample pairs contained discordant mutations, of which two contained mutations in tDNA only, five had mutations in plasma ctDNA only, and three contained mutations in both tDNA and plasma ctDNA, but these mutations were not the same between the sample types. Because lung cancer tumors are heterogeneous with clonal sub-populations, it is possible that for mutations found in plasma ctDNA and not in tDNA, the individual tumor biopsy did not represent the entire tumor, which can be particularly problematic when biopsy samples are small [29–31]. This factor may also account for the discrepancies found between the three matched sample pairs containing different mutations. Since biopsied samples may not include all mutations found within the tumor, ctDNA may offer more prognostic information than tDNA alone. Additionally, as tumor biopsies may not be feasible in certain cases, plasma ctDNA may provide a way to characterize mutational profiles of the tumor.
Others have reported that genomic DNA is released into the blood from necrotic white blood cells, which may dilute ctDNA in the plasma and hinder its detection [32]. This may have contributed to mutations detected in tDNA but not in plasma ctDNA, such as the ERBB2 mutation found in the tumor from one patient, but not in the plasma. One discordant sample had nine mutations in plasma ctDNA but none in corresponding tDNA, which may be an indication of highly metastatic disease. Previous research has shown that the amount of ctDNA in the plasma correlates to advanced disease and number of metastatic sites [22,33]. As these metastases are comprised of subclonal populations derived from the primary tumor, they often differ in their mutation profile [34]. Therefore, it is possible that plasma ctDNA mutations detected in this discordant sample originated from metastatic sites. An interesting follow-up study would be to compare the mutations found in plasma ctDNA to those found in tDNA and metastatic locations.
Previous studies have reported that roughly 25% of plasma samples from NSCLC patients contain EGFR mutations [35,36]. Here, we report similar rates of EGFR mutations found in plasma DNA, where 4/20(20.0%) matched tumor and plasma samples contained the same EGFR mutations, and overall 11/42 (26.2%) of the plasma samples contained EGFR mutations. Mutations in EGFR are useful targets for tyrosine kinase inhibitors (TKIs) such as gefitinib and erlotinib, but roughly half of patients acquire drug resistance due to a secondary mutation at p.T790M [37]. Therefore, it is clinically beneficial to be able to detect both primary and secondary mutations via noninvasive sampling such as plasma ctDNA to monitor disease progress and treatment responses over time as the detection of acquired resistance would alter the course of treatment. Additionally, monitoring ctDNA over time as diseases progress or with treatment would provide useful prognostic information to improve patient outcomes. Prior studies have already shown this in practice [14,16,38], but the methods used to detect mutations has not been standardized, and hence additional research is warranted.
In conclusion, we demonstrate that the use of target sequencing with the Ion PGM and AmpliSeq cancer panel can detect ctDNA mutations in plasma from lung cancer patients with high concordance to mutations found in the primary tumor. While our comprehensive cancer panel did not find novel gene mutations in this particular cohort of Chinese NSCLC patients, we were able to identify clinically relevant driver mutations in plasma ctDNA from late-stage NSCLC patients. Future studies will be performed to determine if plasma ctDNA can be detected in early-stage cancer patients, and if differences can be detected in plasma ctDNA before, during, and after treatment. Additionally, future studies will be performed using larger gene panel to increase sensitivity. As the AmpliSeq panel has broad coverage of known driver mutations in many human cancers, our sequencing approach could easily be implemented and standardized for clinical use in the monitoring of a wide variety of advanced cancers.
Acknowledgements
We would like to thank Rong Shi at the Wu Jieping Foundation, and Dr. Feng Lou, Hua Ye, and other members of San Valley Biotechnology Inc., Beijing for their assistance in sample and data collection. We would also like to thank the staff at the Beijing Military Hospital for their generous support for DNA sequencing and data collection. This research was supported by grants from the Na tional Natural Science Foundation of China (81172233 to JC, 81301812 to SX), Specialized Research Fund for the Doctoral Program of Higher Education (20131202110004 to JC, 20131202120004 to SX), Scientific Research Foundation for the Returned Overseas Chinese Scholars of State Education Ministry (to SX), Tianjin Science and Technology Support Program (12ZCDZSY16100 to JC), Tianjin Educational Committee Foundation (20120117 to SX), and the National Institutes of Health (R01 CA90427 & R01 AI084811 to SYC).
Footnotes
Conflict of interest
Authors FL, HY, JBZ, WC, MYZ, WJW, and XXS are employees of San Valley Biotechnology Inc. in Beijing, China. All other authors declare no competing financial interests.
References
- [1].Eberhard DA, Johnson BE, Amler LC, Goddard AD, Heldens SL, Herbst RS, et al. , Mutations in the epidermal growth factor receptor and in KRAS are predictive and prognostic indicators in patients with non-small-cell lung cancer treated with chemotherapy alone and in combination with erlotinib, J. Clin. Oncol 23 (2005) 5900–5909. [DOI] [PubMed] [Google Scholar]
- [2].Ludovini V, Bianconi F, Pistola L, Chiari R, Minotti V, Colella R, et al. , Phosphoinositide-3-kinase catalytic alpha and KRAS mutations are important predictors of resistance to therapy with epidermal growth factor receptor tyrosine kinase inhibitors in patients with advanced non-small cell lung cancer,J. Thorac. Oncol 6 (2011) 707–715. [DOI] [PubMed] [Google Scholar]
- [3].Tsao MS, Aviel-Ronen S, Ding K, Lau D, Liu N, Sakurada A, et al. , Prognostic and predictive importance of p53 and RAS for adjuvant chemotherapy in non small-cell lung cancer, J. Clin. Oncol 25 (2007) 5240–5247. [DOI] [PubMed] [Google Scholar]
- [4].Kobayashi S, Boggon TJ, Dayaram T, Janne PA, Kocher O, Meyerson M, et al. , EGFR mutation and resistance of non-small-cell lung cancer to gefitinib, N. Engl.J. Med 352 (2005) 786–792. [DOI] [PubMed] [Google Scholar]
- [5].Engelman JA, Zejnullahu K, Mitsudomi T, Song Y, Hyland C, Park JO, et al. , MET amplification leads to gefitinib resistance in lung cancer by activating ERBB3 signaling, Science 316 (2007) 1039–1043. [DOI] [PubMed] [Google Scholar]
- [6].Tan DS, Camilleri-Broet S, Tan EH, Alifano M, Lim WT, Bobbio A, et al. , Intertumor heterogeneity of non-small-cell lung carcinomas revealed by multiplexed mutation profiling and integrative genomics, Int. J. Cancer 135 (2014) 1092–1100. [DOI] [PubMed] [Google Scholar]
- [7].Kuiper JL, Heideman DA, Thunnissen E, Paul MA, van Wijk AW, Postmus PE, et al. , Incidence of T790M mutation in (sequential) rebiopsies in EGFR-mutated NSCLC-patients, Lung Cancer 85 (2014) 19–24. [DOI] [PubMed] [Google Scholar]
- [8].Majem M, Remon J, Tumor heterogeneity: evolution through space and time in EGFR mutant non small cell lung cancer patients, Transl. Lung Cancer Res 2 (2013) 226–237. [DOI] [PMC free article] [PubMed] [Google Scholar]
- [9].Bettegowda C, Sausen M, Leary RJ, Kinde I, Wang Y, Agrawal N, et al. , Detection of circulating tumor DNA in early- and late-stage human malignancies, Sci. Transl. Med 6 (2014) 224ra224. [DOI] [PMC free article] [PubMed] [Google Scholar]
- [10].Jahr S, Hentze H, Englisch S, Hardt D, Fackelmayer FO, Hesch R-D, et al. , DNA Fragments in the blood plasma of cancer patients: quantitations and evidence for their origin from apoptotic and necrotic cells, Cancer Res. 61 (2001) 1659–1665. [PubMed] [Google Scholar]
- [11].Sozzi G, Conte D, Leon M, Cirincione R, Roz L, Ratcliffe C, et al. , Quantification of free circulating DNA as a diagnostic marker in lung cancer, J. Clin. Oncol 21 (2003) 3902–3908. [DOI] [PubMed] [Google Scholar]
- [12].Kimura H, Suminoe M, Kasahara K, Sone T, Araya T, Tamori S, et al. , Evaluation of epidermal growth factor receptor mutation status in serum DNA as a predictor of response to gefitinib (IRESSA), Br. J. Cancer 97 (2007) 778–784. [DOI] [PMC free article] [PubMed] [Google Scholar]
- [13].Stroun M, Maurice P, Vasioukhin V, Lyautey J, Lederrey C, Lefort F, et al. , The origin and mechanism of circulating DNA, Ann. N. Y. Acad. Sci 906 (2000) 161–168. [DOI] [PubMed] [Google Scholar]
- [14].Murtaza M, Dawson SJ, Tsui DW, Gale D, Forshew T, Piskorz AM, et al. , Non-invasive analysis of acquired resistance to cancer therapy by sequencing of plasma DNA, Nature 497 (2013) 108–112. [DOI] [PubMed] [Google Scholar]
- [15].Spindler K-LG, Pallisgaard N, Andersen RF, Jakobsen A, Changes in mutational status during third-line treatment for metastatic colorectal cancer – results of consecutive measurement of cell free DNA, KRAS and BRAF in the plasma, Int.J. Cancer 135 (2014) 2215–2222. [DOI] [PubMed] [Google Scholar]
- [16].Douillard J-Y, Ostoros G, Cobo M, Ciuleanu T, Cole R, McWalter G, et al. , Gefitinib treatment in EGFR mutated Caucasian NSCLC: circulating-free tumor DNA as a surrogate for determination of EGFR status, J. Thorac. Oncol 9 (2014) 1345–1353. [DOI] [PMC free article] [PubMed] [Google Scholar]
- [17].Taniguchi K, Uchida J, Nishino K, Kumagai T, Okuyama T, Okami J, et al. , Quantitative detection of EGFR mutations in circulating tumor DNA derived from lung adenocarcinomas, Clin. Cancer Res 17 (2011) 7808–7815. [DOI] [PubMed] [Google Scholar]
- [18].Kim H-R, Lee SY, Hyun D-S, Lee MK, Lee H-K, Choi C-M, et al. , Detection of EGFR mutations in circulating free DNA by PNA-mediated PCR clamping, J. Exp. Clin. Cancer Res 32 (2013) 50. [DOI] [PMC free article] [PubMed] [Google Scholar]
- [19].Kukita Y, Uchida J, Oba S, Nishino K, Kumagai T, Taniguchi K, et al. , Quantitative identification of mutant alleles derived from lung cancer in plasma cell-free DNA via anomaly detection using deep sequencing data, PLoS ONE 8 (2013) e81468. [DOI] [PMC free article] [PubMed] [Google Scholar]
- [20].Narayan A, Carriero NJ, Gettinger SN, Kluytenaar J, Kozak KR, Yock TI, et al. , Ultrasensitive measurement of hotspot mutations in tumor DNA in blood using error-suppressed multiplexed deep sequencing, Cancer Res. 72 (2012) 3492–3498. [DOI] [PMC free article] [PubMed] [Google Scholar]
- [21].Newman AM, Bratman SV, To J, Wynne JF, Eclov NCW, Modlin LA, et al. , An ultrasensitive method for quantitating circulating tumor DNA with broad patient coverage, Nat. Med 20 (2014) 548–554. [DOI] [PMC free article] [PubMed] [Google Scholar]
- [22].Couraud S, Vaca-Paniagua F, Villar S, Oliver J, Schuster T, Blanché H, et al. , Noninvasive diagnosis of actionable mutations by deep sequencing of circulating free DNA in lung cancer from never-smokers: a proof-of-concept study from BioCAST/IFCT-1002, Clin. Cancer Res 20 (2014) 4613–4624. [DOI] [PubMed] [Google Scholar]
- [23].Forshew T, Murtaza M, Parkinson C, Gale D, Tsui DW, Kaper F, et al. , Noninvasive identification and monitoring of cancer mutations by targeted deep sequencing of plasma DNA, Sci. Transl. Med 4 (2012) 136ra168. [DOI] [PubMed] [Google Scholar]
- [24].Chan KCA, Jiang P, Zheng YWL, Liao GJW, Sun H, Wong J, et al. , Cancer genome scanning in plasma: detection of tumor-associated copy number aberrations, single-nucleotide variants, and tumoral heterogeneity by massively parallel sequencing, Clin. Chem 59 (2013) 211–224. [DOI] [PubMed] [Google Scholar]
- [25].Madic J, Kiialainen A, Bidard F-C, Birzele F, Ramey G, Leroy Q, et al. , Circulating tumor DNA and circulating tumor cells in metastatic triple negative breast cancer patients, Int. J. Cancer 136 (2015) 2158–2165. [DOI] [PubMed] [Google Scholar]
- [26].Bai X, Zhang E, Ye H, Nandakumar V, Wang Z, Chen L, et al. , PIK3CA and TP53 gene mutations in human breast cancer tumors frequently detected by ion torrent DNA sequencing, PLoS ONE 9 (2014) e99306. [DOI] [PMC free article] [PubMed] [Google Scholar]
- [27].Xu Z, Huo X, Tang C, Ye H, Nandakumar V, Lou F, et al. , Frequent KIT mutations in human gastrointestinal stromal tumors, Sci. Rep.-UK 4 (2014) 5907. [DOI] [PMC free article] [PubMed] [Google Scholar]
- [28].Cai X, Sheng J, Tang C, Nandakumar V, Ye H, Ji H, et al. , Frequent mutations in EGFR, KRAS and TP53 genes in human lung cancer tumors detected by ion torrent DNA sequencing, PLoS ONE 9 (2014) e95228. [DOI] [PMC free article] [PubMed] [Google Scholar]
- [29].Fisher R, Pusztai L, Swanton C, Cancer heterogeneity: implications for targeted therapeutics, Br. J. Cancer 108 (2013) 479–485. [DOI] [PMC free article] [PubMed] [Google Scholar]
- [30].Gerlinger M, Rowan AJ, Horswell S, Larkin J, Endesfelder D, Gronroos E, et al. , Intratumor heterogeneity and branched evolution revealed by multiregion sequencing, N. Engl. J. Med 366 (2012) 883–892. [DOI] [PMC free article] [PubMed] [Google Scholar]
- [31].Yap TA, Gerlinger M, Futreal PA, Pusztai L, Swanton C, Intratumor heterogeneity: seeing the wood for the trees, Sci. Transl. Med 4 (2012) 127ps110. [DOI] [PubMed] [Google Scholar]
- [32].Schwarzenbach H, Hoon DS, Pantel K, Cell-free nucleic acids as biomarkers in cancer patients, Nat. Rev. Cancer 11 (2011) 426–437. [DOI] [PubMed] [Google Scholar]
- [33].Kumar S, Guleria R, Singh V, Bharti AC, Mohan A, Das BC, Plasma DNA level in predicting therapeutic efficacy in advanced nonsmall cell lung cancer, Eur. Respir. J 36 (2010) 885–892. [DOI] [PubMed] [Google Scholar]
- [34].Schmid K, Oehl N, Wrba F, Pirker R, Pirker C, Filipits M, EGFR/KRAS/BRAF mutations in primary lung adenocarcinomas and corresponding locoregional lymph node metastases, Clin. Cancer Res 15 (2009) 4554–4560. [DOI] [PubMed] [Google Scholar]
- [35].Goto K, Ichinose Y, Ohe Y, Yamamoto N, Negoro S, Nishio K, et al. , Epidermal growth factor receptor mutation status in circulating free DNA in serum: from IPASS, a phase III study of gefitinib or carboplatin/paclitaxel in non-small cell lung cancer, J. Thorac. Oncol 7 (2012) 115–121. [DOI] [PubMed] [Google Scholar]
- [36].Isobe K, Hata Y, Kobayashi K, Hirota NAO, Sato K, Sano GO, et al. , Clinical significance of circulating tumor cells and free DNA in non-small cell lung cancer, Anticancer Res. 32 (2012) 3339–3344. [PubMed] [Google Scholar]
- [37].Oxnard GR, Arcila ME, Sima CS, Riely GJ, Chmielecki J, Kris MG, et al. , Acquired resistance to EGFR tyrosine kinase inhibitors in EGFR-mutant lung cancer: distinct natural history of patients with tumors harboring the T790M mutation, Clin. Cancer Res 17 (2011) 1616–1622. [DOI] [PMC free article] [PubMed] [Google Scholar]
- [38].Kimura T, Holland WS, Kawaguchi T, Williamson SK, Chansky K, Crowley JJ, et al. , Mutant DNA in plasma of lung cancer patients: potential for monitoring response to therapy, Ann. N. Y. Acad. Sci 1022 (2004) 55–60. [DOI] [PubMed] [Google Scholar]