Abstract
Background and Purpose: obesity is defined as excessive accumulation of adipose tissues and is becoming one of the main global severe public health issues. The present study aims to investigate the anti-adipogenesis of laquinimod and the underlying mechanism. Methods: a differentiation cocktail was used to differentiate 3T3-L1 cells, and mice were fed with high fat food to establish the obesity animal model. Oil red O staining, glycerol production assay, and the release of triglyceride were used to evaluate the differentiation degree of 3T3-L1 cells. The expression level of sterol regulatory element binding transcription factor 1 (Srebp1), fatty acid binding protein-4 (FABP4), glucose transporter 4 (GLUT4), peroxisome proliferator-activated receptor-γ (PPAR-γ), CCAAT enhancer-binding proteins (C/EBPα), and phosphorylation of adenosine 5′-monophosphate (AMP)-activated protein kinase α (p-AMPKα) was determined by quantitative real time PCRqRT-PCR and western blot analysis. The pathological state of adipose tissues was evaluated by hematoxylin–eosin staining. Results: the amount and UV absorption of oil red O, glycerol production, release of triglyceride, and the expression of SREBP1, FABP4, and Glut4 in differentiated 3T3-L1 cells were decreased by the administration of laquinimod. PPAR-γ and C/EBPα were down-regulated, and p-AMPKα was up-regulated by laquinimod. The down-regulated PPAR-γ and C/EBPα, as well as the inhibited lipid accumulation functioned by laquinimod, were reversed by the coincubation with the AMPK inhibitor compound C. Decreased body weight, visceral adipocyte tissue weight, and size of adipocytes were observed in in vivo obesity mice after administration with laquinimod. Conclusion: laquinimod might prevent adipogenesis by down-regulating PPAR-γ and C/EBPα through activating AMPK.
1. Introduction
Obesity is mainly defined as excessive accumulation of adipose tissues in our body, which is mainly resulted from increased size and amounts of adipocytes. Currently, body mass index (BMI) is used to identify obesity. BMI = body weights (kg)/height2 (m) is utilized to calculate the value of BMI. In Asia, the body with BMI larger than 23 is regarded as overweight and larger than 25 is regarded as obesity.1−3 As the living standards improve, excessive uptake of food with high energy, such as deep fried food and puffed food, contributes to the sharp increase of obese people, which makes obesity one of the global severe public health issues. Not only chronic diseases, such as type II diabetes, cardiovascular-related diseases, and steatohepatitis, but also malignant tumor can be derived from obesity.4,5 Therefore, it is of great significance to investigate the pathological mechanism of obesity and explore the potential therapeutic food or drugs.
Adipose tissues are composed of multiple types of cells, such as endothelial cells, blood cells, fibroblasts, pre-adipocytes, macrophages, and other lymphocytes, among which mature adipocytes are mostly involved.6 The transformation from pre-adipocytes to mature adipocytes is mediated by plenty of transcription factors with both inhibitory and activation effects. CCAAT enhancer binding proteins (C/EBPs), peroxisome hyperplasia activated receptors (PPARs), and sterol response element-binding protein-1 (SRENP-1) are reported to be main transcription factors that regulate the transformation. C/EBPs belong to an alkaline leucine zipper transcription factor family, which is named because of their activation on the CCAAT sequence of enhancer for a specific target gene. McKnight first reported the effects of C/EBPs on lipolysis.7 By binding with the ligands, PPARγ can interact with retinoid X receptor to form a heterodimer, which subsequently binds with the peroxisome proliferator response elements to activate PPARγ. In this way, the transcription of targets genes that are involved in the metabolism of energy and lipids, inflammation, and insulin sensitivity will be regulated.8,9 In addition, the activation of the AMPK signal pathway is also reported to be involved in the progress of adipogenesis. Wang reported that the osteogenesis was promoted and the adipogenesis was inhibited by the activation of AMPK through the AMPK-Gfi1-OPN axis.10 To suppress obesity, effective improvement might be achieved by targeting these transcription factors or AMPK signal pathway.
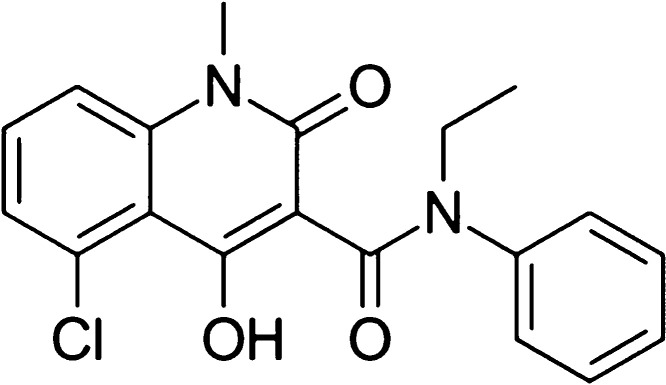
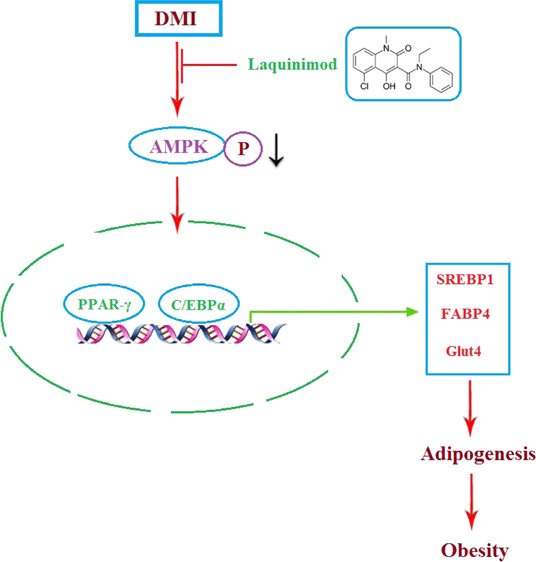
Laquinimod, the structure of which is shown in Figure 1, is an oral effective immune regulator verified by III phase clinical trials,11 which is reported to up-regulate the population of type 1 T helper lymphocytes (Th1) and down-regulate the population of type 2 T helper lymphocytes (Th2) to mediate the immune system.12 In the present study, the inhibitory effects of laquinimod against adipogenesis, as well as the underlying mechanism, will be investigated to claim the potential therapeutic effects of laquinimod on obesity.
Figure 1.
Molecular structure of laquinimod.
2. Results
2.1. Effects of Laquinimod during 3T3-L1 Adipogenesis
Two concentrations (5, 10 μM) of laquinimod were incubated with differentiated 3T3-L1 cells. Treated cells were stained with Oil Red O on the Day 8. As shown in Figure 2A, compared with 3T3-L1 cells, more Oil Red O staining was observed in the mature adipocytes. The amount of Oil Red O staining was attenuated significantly as the dosage of laquinimod increased from 0 to 10 μM. Figure 2B shows that by differentiating 3T3-L1 cells, the absorbance at 540 nm of Oil Red O of mature adipocytes was increased greatly, which was inhibited by the treatment with laquinimod in a dose-dependent manner.
Figure 2.
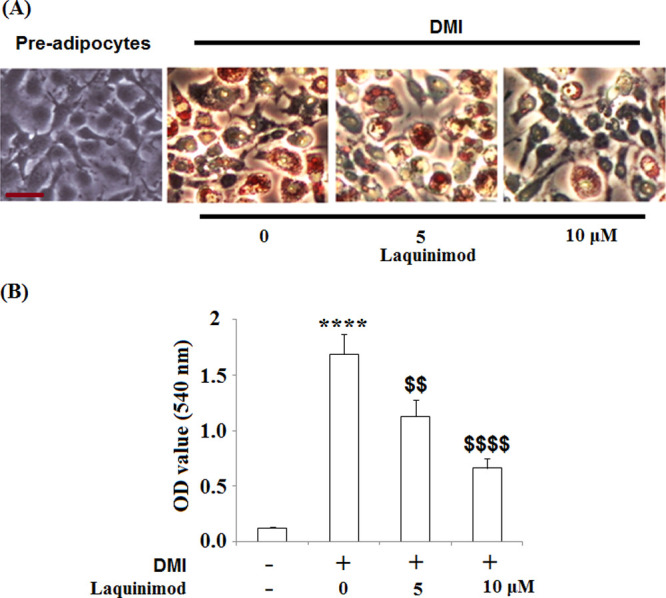
Effects of laquinimod during 3T3-L1 adipogenesis. 3T3-L1 cells were differentiated by incubation in cell culture medium by adding a differentiation cocktail (DMI) with laquinimod (5, 10 μM) and stained with Oil Red O on day 8. (A) Representative images of Oil Red O staining; Scale bar, 100 μm; (B) lipid accumulation was assessed by measuring absorbance at 540 nm of Oil Red O (****, p < 0.0001 vs vehicle group; $$, $$$$, P < 0.01, 0.0001 vs DMI treated group).
2.2. Triglyceride Content was Inhibited, and Lipolysis was Induced by Laquinimod during 3T3-L1 Adipogenesis
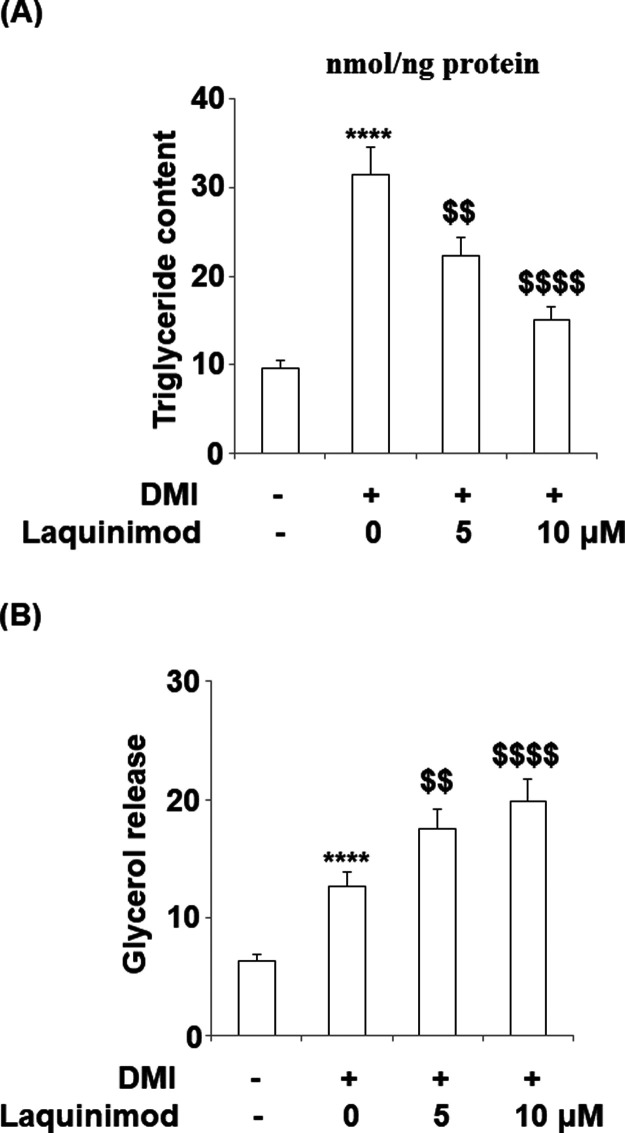
To explore the effects of laquinimod on triglyceride release and lipolysis, 5 and 10 μM laquinimod was used to incubate with differentiated 3T3-L1 cells, and the concentrations of triglyceride and glycerol were detected. As shown in Figure 3A, the total contents of triglyceride in 3T3-L1 cells, differentiated 3T3-L1 cells, 5 μM Laquinimod-treated differentiated 3T3-L1 cells, and 10 μM Laquinimod-treated differentiated 3T3-L1 cells were 9.6, 31.5, 22.3, and 15.1 nmol/ng protein, respectively. Significant increased release of triglyceride was observed in differentiated 3T3-L1 cells, compared with 3T3-L1 cells (**P < 0.01, vs control), which was suppressed by laquinimod at a dose-dependent manner. The release of glycerol was recorded in Figure 3B. The release speeds of glycerol in 3T3-L1 cells, differentiated 3T3-L1 cells, 5 μM laquinimod-treated differentiated 3T3-L1 cells, and 10 μM laquinimod-treated differentiated 3T3-L1 cells were 6.3, 12.6, 17.5, and 19.8 nmol/mg protein/h, respectively. These data indicate that the lipolysis was promoted during the progress of differentiation of 3T3-L1 cells, which was suppressed by laquinimod at a dose-dependent manner.
Figure 3.
Effects of laquinimod on triglyceride content and lipolysis during 3T3-L1 adipogenesis. 3T3-L1 cells were diferentiated by incubation in cell culture medium by adding a differentiation cocktail (DMI) with laquinimod (5, 10 μM) for 8 days. (A) Total content of triglyceride; (B) lipolysis is shown as glycerol release (****, p < 0.0001 vs vehicle group; $$, $$$$, P < 0.01, 0.0001 vs DMI treated group).
2.3. Effects of Laquinimod on the Expression of Adipogenic and Lipogenic Genes
Two concentrations (5, 10 μM) of laquinimod were incubated with differentiated 3T3-L1 cells for 3, 6, and 8 days. The expression of sterol regulatory element binding transcription factor 1 (SREBP1), fatty acid binding protein-4 (FABP4), and glucose transporter 4 (Glut4) detected by quantitative real time PCR (qRT-PCR) is shown in Figure 4A–C. SREBP1 was significantly down-regulated on Day 3 by the introduction of laquinimod and remained the same level as control on Day 6 and 8. However, FABP4 and Glut4 were greatly down-regulated on Day 3, 6, and 8 by the introduction of laquinimod. These data indicated that laquinimod has an inhibitory effect on the expression of adipogenic and lipogenic genes.
Figure 4.
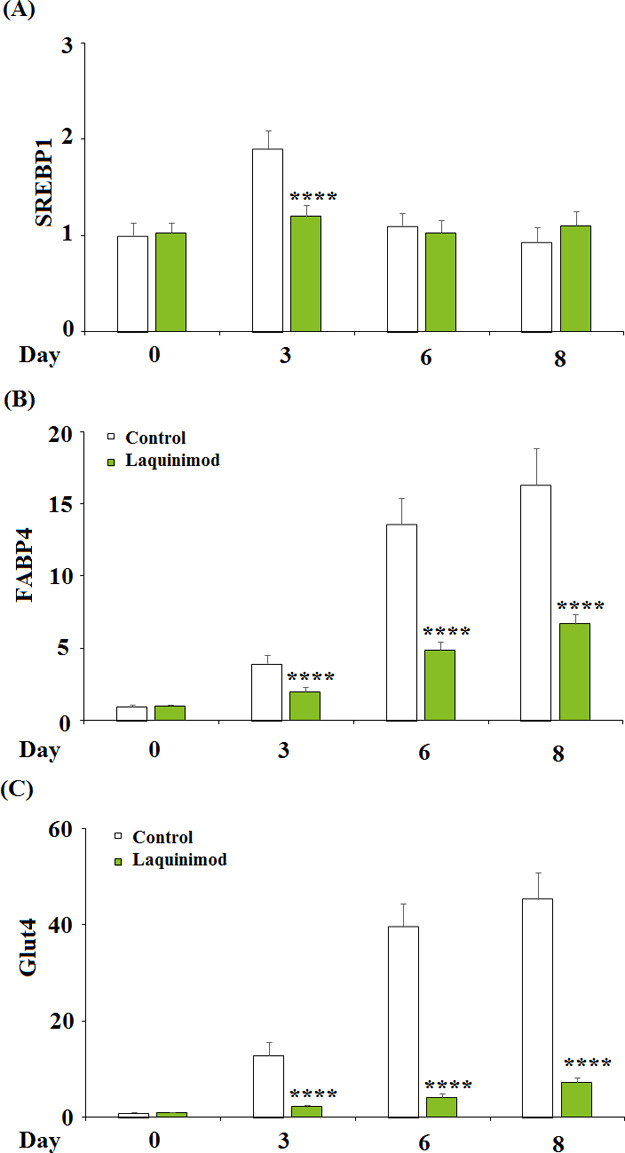
Effects of laquinimod on the expression of adipogenic and lipogenic genes. 3T3-L1 cells were diferentiated by incubation in cell culture medium by adding a differentiation cocktail (DMI) with laquinimod (5, 10 μM) for 3, 6, 8 days. (A) mRNA of SREBP1 as measured by real time PCR; (B) mRNA of FABP4 as measured by real time PCR; (C) mRNA of Glut4 as measured by real time PCR (****, p < 0.0001 vs vehicle group; $$, $$$$, P < 0.01, 0.0001 vs DMI treated group).
2.4. Expression of Adipogenic and Lipogenic Transcriptional Factors was Inhibited by Laquinimod
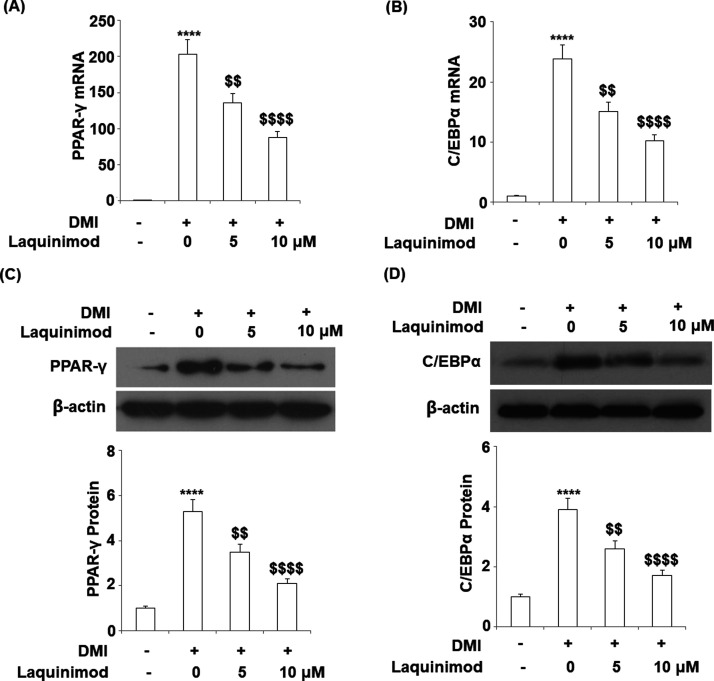
To explore the effects of laquinimod on the expression of adipogenic and lipogenic transcriptional factors, 5 and 10 μM laquinimod were used to incubate with differentiated 3T3-L1 cells. The gene and protein expression of peroxisome proliferator-activated receptor-γ (PPAR-γ) and CCAAT enhancer-binding proteins (C/EBPα) were evaluated by qRT-PCR and western blot analysis. As shown in Figure 5A–D, PPAR-γ and C/EBPα were significantly up-regulated during the differentiation of 3T3-L1 cells, which were inhibited by the interference of laquinimod at a dose-dependent manner.
Figure 5.
Effects of laquinimod on the expression of adipogenic and lipogenic transcriptional factor. 3T3-L1 cells were differentiated by incubation in cell culture medium by adding a differentiation cocktail (DMI) with laquinimod (5, 10 μM) for 8 days. (A) mRNA of PPAR-γ as measured by real time PCR; (B) mRNA of C/EBPα as measured by real time PCR; (C) protein of PPAR-γ as measured by western blot analysis; (D) protein of C/EBPα as measured by western blot analysis (****, p < 0.0001 vs vehicle group; $$, $$$$, P < 0.01, 0.0001 vs DMI treated group).
2.5. Laquinimod Suppressed Autophagy in 3T3-L1 Cells
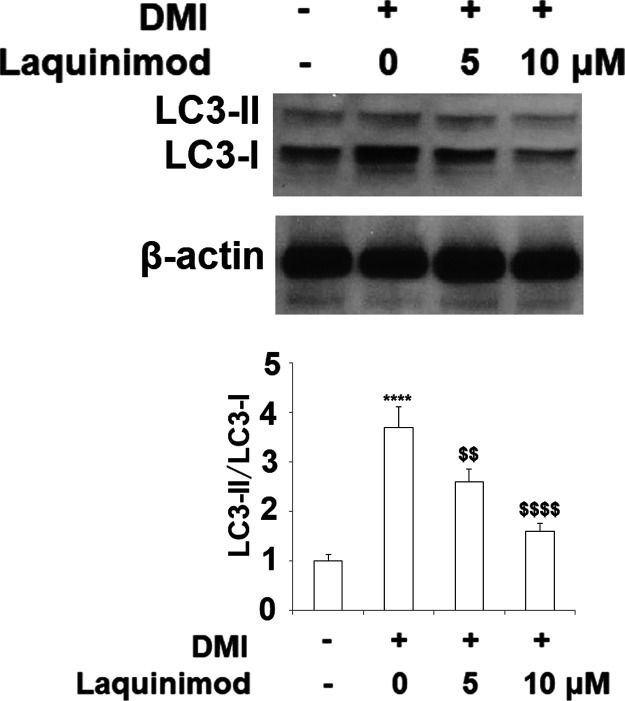
Autophagy plays an important role in adipocyte differentiation. The ratio of LC3-II to LC3-I has been considered as a marker of autophagy. It has been shown that the LC3-II:LC3-I ratio increased significantly by approximately 4-fold in 3T3-L1 cells cultured in DMI, whereas co-treatment with laquinimod (5, 10 μM) significantly prevented the increase in LC3-II:LC3-I ratio in a dose dependent manner (Figure 6).
Figure 6.
Laquinimod suppressed autophagy in 3T3-L1 cells. 3T3-L1 preadipocytes were incubated in adipocyte DM in the presence or absence of laquinimod (5, 10 μM). The expression of the autophagy markers LC3-I and LC3-II was measured by western blot and the LC3-II/LC3-I ratio was quantified by densitometric scanning and graphed (****, p < 0.0001 vs vehicle group; $$, $$$$, P < 0.01, 0.0001 vs DMI treated group).
2.6. Inhibitory Effects of Laquinimod on 3T3-L1 Adipogenesis is Mediated by AMPK
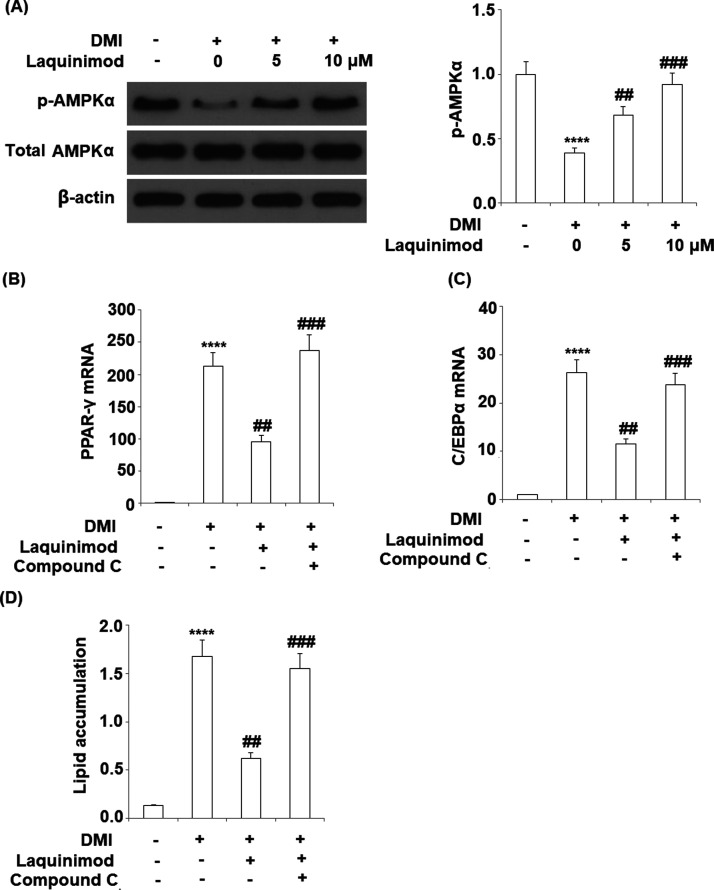
To investigate the potential mechanism on the inhibitory effects of laquinimod on 3T3-L1 adipogenesis, the expression level of p-AMPKα was evaluated following the introduction of laquinimod and the AMPK inhibitor compound C was used. As shown in Figure 7A, the expression level of p-AMPKα was inhibited during the differentiation of 3T3-L1 cells, which was restored by the incubation of laquinimod at a dose-dependent manner. The effects of AMPK inhibitor compound C on the inhibitory function of laquinimod on 3T3-L1 adipogenesis are recorded in Figure 7B–D. The down-regulated PPAR-γ and C/EBPα by laquinimod were significantly up-regulated by the co-incubation of the AMPK inhibitor. The absorbance at 540 nm of oil red O was decreased from 1.68 to 0.62 by the administration of laquinimod, which was promoted to 1.55 after the co-incubation of AMPK inhibitor compound C. These findings suggest that blockage of AMPK with its inhibitor compound C abolished the protective effects of laquinimod against adipogenesis. Further in vivo study with a AMPK deficiency rodent model will further verify this mechanism.
Figure 7.
Inhibitory effects of laquinimod in 3T3-L1 adipogenesis is mediated by AMPK. (A) 3T3-L1 cells were differentiated by incubation in cell culture medium by adding a differentiation cocktail (DMI) with laquinimod (5, 10 μM) for 24 h. Phosphorylation of AMPKα (1, 0.39, 0.68, 0.92) was measured by western blot analysis. (B–D) 3T3-L1 cells were differentiated by incubation in cell culture medium by adding a differentiation cocktail (DMI) with laquinimod (10 μM) in the presence or absence of AMPKα inhibitor compound C (10 μM) for 8 days. mRNA of PPAR-γ; mRNA of C/EBPα; lipid accumulation was assessed by measuring absorbance at 540 nm of Oil Red O (****, p < 0.0001 vs vehicle group; $$, $$$$, P < 0.01, 0.0001 vs DMI treated group).
2.7. Laquinimod Decreased the Weight of Visceral Adipocyte Tissues and the Body Weight of HFD-Induced Obese Mice
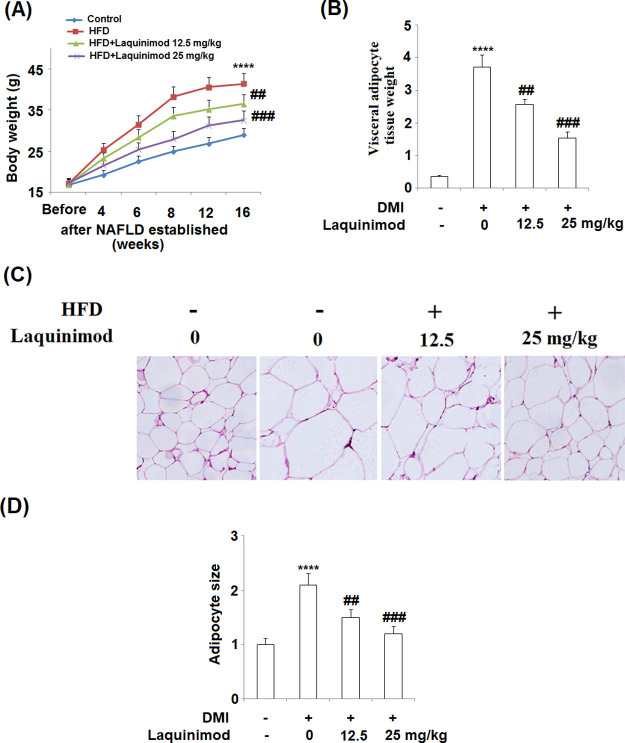
To evaluate the inhibitory effects of laquinimod on adipogenesis in vivo, obese mice model was established by feeding the animals with high fat diet (HFD). As shown in Figure 8A, the average body weight of mice was significantly increased by feeding the animals with HFD, which was decreased by administration with 12.5 and 25.0 mg/kg laquinimod in a dose-dependent manner. The average visceral adipose tissue weight (Figure 8B) was promoted from 0.36 to 3.72 g by feeding the animals with HFD, which was suppressed to 2.57 and 1.53 g by administrating with 12.5 and 25.0 mg/kg laquinimod, respectively. The hematoxylin–eosin stainings on the adipose tissues are shown in Figure 8C. Obvious larger size and amounts of adipocytes were observed in HFD fed mice, compared with control. The size of adipocytes shrunk and the amounts of adipocytes decreased by the administration of 12.5 and 25.0 mg/kg laquinimod. The adipocyte size is quantified and recorded in Figure 7D. The adipocyte size increased from 1 to 2.1 by feeding the animals with HFD, which was decreased to 1.5 and 1.2 by administrating with 12.5 and 25.0 mg/kg laquinimod, respectively.
Figure 8.
Laquinimod decreased the weight of visceral adipocyte tissues and the body weight of HFD-induced obese mice. (A) Growth curve; (B) visceral adipocyte tissue weight; (C) histological sections of visceral adipocyte tissue in mice; and (D) quantification of adipocyte size (****, p < 0.0001 vs vehicle group; $$, $$$$, P < 0.01, 0.0001 vs DMI treated group).
3. Discussion
Obesity is becoming more and more popular because of over-uptake of high-energy food and lacking of durable exercise as the growth in the living standard. Although obesity is not defined as a threatening disease, it is one of the main factors that resulted in type II diabetes, cardiovascular diseases, hypertension and other chronic metabolism related diseases.13 Excess energy will be transformed to fat when energy expenditure is exceeded by nutrient uptake, which finally contributes to obesity.14 The differentiation from pre-adipocytes to mature adipocytes is reported to play an important role in the progress of obesity.15 In the present study, a differentiation cocktail was used to induce the differentiation from 3T3-L1 cells to mature adipocytes, which was verified by the increased number and absorption of Oil Red O staining, promoted triglyceride and glycerol release, and up-regulated adipogenic and lipogenic genes. In addition, high fat food was used to feed mice to establish the obesity model in mice, which was verified by increased body weight and visceral adipocyte tissue weight, promoted amount, and size of adipocytes. The in vitro and in vivo obesity models were used in the present study to evaluate the effects of laquinimod on adipogenesis. By the introduction of laquinimod, the decreased number and absorption of Oil Red O staining, inhibited triglyceride and glycerol release, and down-regulated adipogenic and lipogenic genes were observed in the differentiated 3T3-L1 cells, and the decreased body weight, visceral adipocyte tissue weight, and amount and size of adipocytes were observed in in vivo obesity mice. These data indicated that laquinimod exerts promising anti-adipogenesis effects both in vitro and in vivo.
PPAR-γ is mainly expressed in adipose tissues and a transcription factor that regulates the specific differentiation of adipocytes.16 Multiple types of biological reactions will be initiated by the activation of PPAR-γ, such as morphology changes, adipose accumulation, and the allergy to insulins.17,18 It is verified in the recent adipogenesis deficient reports that PPAR-γ is essential and sufficient on inducing the differentiation of adipocytes. PPAR-γ-deficient mice achieved by traditional homozygous deletion of related genes died in 10 days because of placental developmental defect, and the adipocytes were undetectable in the 10 days.19,20 Rosen21 reported that chimeric mice were achieved by inserting the wild type ES cells and PPAR-γ deficient ES cells. The PPAR-γ deficient ES cells were found to be differentiated into multiple types of tissues except for adipose tissues in mice, which indicated that PPAR-γ was essential for the differentiation of adipose tissues. In the present study, PPAR-γ was found to be highly expressed in differentiated 3T3-L1 cells and adipose tissues from high fat food fed mice. By administering laquinimod, PPAR-γ was found to be down-regulated in both differentiated 3T3-L1 cells and adipose tissues from high fat food fed mice. These data indicated that PPAR-γ might exert an important role in the anti-adipogenesis effects of laquinimod.
C/EBPα is reported to play important roles in the advanced stage of adipocytes differentiation.22 Plenty adipocytes differentiation-related genes are found to be up-regulated as soon as the expression level of C/EBPα is promoted. The differentiation of 3T3-L1 cells could be induced by the over-expression of C/EBPα under the situation of lacking of hormones,23 which could be reversed by the introduction of C/EBPα siRNA.24 In the present study, we also found that C/EBPα was highly expressed in differentiated 3T3-L1 cells and adipose tissues from high fat food fed mice. By the treatment of laquinimod, C/EBPα was found to be down-regulated in both differentiated 3T3-L1 cells and adipose tissues from high fat food fed mice. These data indicated that C/EBPα was significantly involved in the anti-adipogenesis effects of laquinimod. Adenosine 5′-monophosphate (AMP)-activated protein kinase (AMPK) is an AMP-dependent protein kinase, which was found to be inactivated in the process of adipogenesis and regulate the expression of PPAR-γ and C/EBPα.25,26 In the present study, we found that p-AMPKα was down-regulated in the differentiated 3T3-L1 cells, the expression level of which was elevated greatly by the introduction of laquinimod. However, the expression level of PPAR-γ and C/EBPα was promoted by co-incubation of the differentiated 3T3-L1 cells with both laquinimod and AMPK inhibitor, as well as the increased lipid accumulations. These data indicated that the biological effects of laquinimod on the expression level of PPAR-γ and C/EBPα and the adipogenesis might be related to the activation of AMPK. However, the deep molecular relationship should be investigated between laquinimod and AMPK, as well as the interaction between laquinimod and AMPK in obesity animal models.
Taken together, our data indicated that laquinimod might prevent adipogenesis by down-regulating PPAR-γ and C/EBPα through activating AMPK.
4. Materials and Methods
4.1. Cell Culture and Adipocyte Differentiation
3T3-L1 adipocytes were purchased from Wuhan Punosai Life Science and Technology co. LTD and were incubated in the DEME medium containing 5% fetal calf serum. Two days after the cells were completely fused, the cultural medium was changed to complete differentiation cocktail (DMI) medium and dexamethasone were removed 48 h later and the cells were incubated with medium only containing 5 μg/mL insulin. 3T3-L1 cells were differentiated by incubation in cell culture medium by adding a differentiation cocktail (DMI) with laquinimod (5, 10 μM) [TEVA Pharmaceuticals Industries, Ltd (Israel)] for 8 days. The mature adipocytes were used in the subsequent studies.27
4.2. Oil Red O Staining
The differentiated adipocytes were stained with oil red O according to the instructions of the manufacturer (Abcam, USA). Briefly, the mature adipocytes were washed with phosphate buffer saline (PBS) and fixed with formalin solution for 20 min, which was then stained with oil red O solution for 30–40 min at room temperature. The red oil droplets staining in the differentiated adipocytes were pictured by a microscope (Olympus).
4.3. Glycerol Production Assay
A Glycerol Assay Kit (Thermo Fisher Scientific) was used to detect the release of glycerol according to the protocol of the manufacture. Briefly, the supernatants of the differentiated adipocytes were collected to be mixed with the reagents and added into the a 96-well plate. The absorption at 570 nm was determined by a microplate reader (Thermo Fisher Scientific, USA).28
4.4. Measurement of Total Content of Triglyceride in Cells
The differentiated adipocytes were incubated with the test articles for 72 h and collected to be lysed with lysis buffer (1% Triton X-100 in PBS) for 45 min. A commercial kit (Zenbio) was used to evaluate the triglyceride content. Reagent A, reagent B, glycerol standard (10 mM), and diluent were involved in the commercial kit and were added step by step according to the protocol. A microtiter plate reader was used to read the absorption values, which was recorded as glycerol reading and used to calculate the triglyceride level from the standard curve.
4.5. qRT-PCR
Total RNA was isolated from cells and tissue samples using TRIzol reagent (Thermo Fisher Scientific, USA). Then, 2 μg of the isolated total RNA was used to synthesize cDNA with the PrimeScript kit (Thermo Fisher Scientific, USA). PCR was performed with the TransStart Tip Green qPCR SuperMix kit (GenScript). The 2–ΔΔCt method was used to compare the relative expression levels of target genes.29
4.6. Western Blotting
Cells were collected and lysed in RIPA buffer (Thermo Fisher Scientific) to generate crude extracts, and the proteins in the extracts were separated by 15% SDS–PAGE. Subsequently, the separated proteins were transferred to PVDF membranes (Bio-Rad). The membranes were blocked by incubation with 5–10% BSA solution for 1–2 h. Then, the membranes were incubated with primary antibodies against PPAR-γ, C/EBPα, AMPKα, and β-actin (Abcam, USA) at 25 °C for 2 h. After washing, the blot was incubated with a horseradish peroxidase (HRP)-conjugated secondary antibody (1:3000, Abcam) at 25 °C for 1–2 h Finally, the blots were incubated with enhanced chemiluminescence reagents (Amersham Pharmacia Biotech) and visualized with an Amersham Imager 600 (GE).
4.7. High-Fat Diet Mice Model and Administration of Laquinimod
Male C57BL/6 4-week-old mice were acclimatized on a normal diet (ND) for 1 week. Mice were randomly subdivided into 4 groups of 8 mice which were treated as follows for 16 weeks: Normal group mice were fed a ND (composed of 12%-fat, 23%-protein, 65%-carbohydrates based on caloric content); the HFD group mice were fed an HFD (composed of 40%-fat, 20%-protein, 40%-carbohydrates based on caloric content);30 The HFD + laquinimod group mice were fed an HFD diet and administered orally every day by oral gavage in a volume of 100 μL (12.5, 25 mg/kg laquinimod). The normal and HFD group mice were orally gavaged with water. Mice were maintained on 12:12 h light–dark cycles (lights on at 06:00).
4.8. Hematoxylin–Eosin Staining
Adipocyte tissues of each animal were collected and washed over by sterile water for a couple of hours. The tissue was dehydrated by 70, 80, and 90% ethanol solution successively and mixed with equal quality of ethanol and xylene. After 15 min incubation, the tissue was mixed with equal quality of xylene for 15 min. Subsequently, the tissue was embedded in paraffin, sectioned, and stained with hematoxylin and eosin. Pictures were taken using an inverted microscope (Olympus).
4.9. Statistical Analysis
Data are shown as the mean ± standard deviation (SD). GraphPad prism 7 was used to analyze the data. Analysis of variance followed by the Bonferroni’s post-hoc test was used to compare experimental data in different groups. A difference with a P value less than 0.05 was considered as statistically significant.
Acknowledgments
This work was supported by the Jilin Provincial Department of education, “13th Five Year Plan” science and technology project (no. 3D5196777428)
Glossary
Abbreviations
- Srebp1
sterol regulatory element binding transcription factor 1
- FABP4
fatty acid binding protein-4
- GLUT4
glucose transporter 4
- PPAR-γ
peroxisome proliferator-aetivated receptor-γ
- C/EBPαC
CAAT enhancer-binding proteins
- AMP
phosphorylation of adenosine 5′-monophosphate
- p-AMPKα
activated protein kinase α
- qRT-PCR
quantitative real time PCR
- PBS
phosphate buffer saline
- HRP
horseradish peroxidase
- ECL
enhanced chemiluminescence
- SD
standard deviation
- ANOVA
analysis of variance
- HE
hematoxylin–eosin
- RXR
retinoid X receptor
Author Contributions
¶ G.W. and B.W. are contributed equally to this work.
The authors declare no competing financial interest.
References
- Stommel M.; Schoenborn C. A. Variations in BMI and prevalence of health risks in diverse racial and ethnic populations. Obesity 2010, 18, 1821. 10.1038/oby.2009.472. [DOI] [PubMed] [Google Scholar]
- Gong S.; Wang K.; Li Y.; Alamian A. The influence of immigrant generation on obesity among Asian Americans in California from 2013 to 2014. PLoS One 2019, 14, e0212740 10.1371/journal.pone.0212740. [DOI] [PMC free article] [PubMed] [Google Scholar]
- Goda A.; Masuyama T. Obesity and Overweight in Asian People. Circ. J. 2016, 80, 2425. 10.1253/circj.cj-16-1087. [DOI] [PubMed] [Google Scholar]
- Flier J. S. Obesity wars: molecular progress confronts an expanding epidemic. Cell 2004, 116, 337. 10.1016/s0092-8674(03)01081-x. [DOI] [PubMed] [Google Scholar]
- Barness L. A.; Opitz J. M.; Gilbert-Barness E. Obesity: genetic, molecular, and environmental aspects. Am. J. Med. Genet. 2007, 143A, 3016. 10.1002/ajmg.a.32035. [DOI] [PubMed] [Google Scholar]
- Geloen A.; Roy P. E.; Bukowiecki L. J. Regression of white adipose tissue in diabetic rats. Am. J. Physiol. 1989, 257, E547 10.1152/ajpendo.1989.257.4.e547. [DOI] [PubMed] [Google Scholar]
- Mischoulon D.; Rana B.; Bucher N. L.; Farmer S. R. Growth-dependent inhibition of CCAAT enhancer-binding protein (C/EBP alpha) gene expression during hepatocyte proliferation in the regenerating liver and in culture. Mol. Cell. Biol. 1992, 12, 2553. 10.1128/mcb.12.6.2553. [DOI] [PMC free article] [PubMed] [Google Scholar]
- Yu X.-H.; Fu Y.-C.; Zhang D.-W.; Yin K.; Tang C.-K. Foam cells in atherosclerosis. Clin. Chim. Acta 2013, 424, 245. 10.1016/j.cca.2013.06.006. [DOI] [PubMed] [Google Scholar]
- Wójtowicz S.; Strosznajder A. K.; Jeżyna M.; Strosznajder J. B. The Novel Role of PPAR Alpha in the Brain: Promising Target in Therapy of Alzheimer’s Disease and Other Neurodegenerative Disorders. Neurochem. Res. 2020, 45, 972. 10.1007/s11064-020-02993-5. [DOI] [PMC free article] [PubMed] [Google Scholar]
- Wang Y.-g.; Qu X.-h.; Yang Y.; Han X.-g.; Wang L.; Qiao H.; Fan Q.-m.; Tang T.-t.; Dai K.-r. AMPK promotes osteogenesis and inhibits adipogenesis through AMPK-Gfi1-OPN axis. Cell. Signal. 2016, 28, 1270. 10.1016/j.cellsig.2016.06.004. [DOI] [PubMed] [Google Scholar]
- Stasiolek M.; Linker R. A.; Hayardeny L.; Bar Ilan O.; Gold R. Immune parameters of patients treated with laquinimod, a novel oral therapy for the treatment of multiple sclerosis: results from a double-blind placebo-controlled study. Immun., Inflammation Dis. 2015, 3, 45. 10.1002/iid3.42. [DOI] [PMC free article] [PubMed] [Google Scholar]
- Yang J.-S.; Xu L.-Y.; Xiao B.-G.; Hedlund G.; Link H. Laquinimod (ABR-215062) suppresses the development of experimental autoimmune encephalomyelitis, modulates the Th1/Th2 balance and induces the Th3 cytokine TGF-beta in Lewis rats. J. Neuroimmunol. 2004, 156, 3. 10.1016/j.jneuroim.2004.02.016. [DOI] [PubMed] [Google Scholar]
- Kopelman P. G. Obesity as a medical problem. Nature 2000, 404, 635. 10.1038/35007508. [DOI] [PubMed] [Google Scholar]
- Rosen E. D.; MacDougald O. A. Adipocyte differentiation from the inside out. Nat. Rev. Mol. Cell Biol. 2006, 7, 885. 10.1038/nrm2066. [DOI] [PubMed] [Google Scholar]
- Oh J. H.; Karadeniz F.; Lee J. I.; Seo Y.; Kong C.-S. Artemisia princeps Inhibits Adipogenic Differentiation of 3T3-L1 Pre-Adipocytes via Downregulation of PPARgamma and MAPK Pathways. Prev. Nutr. Food Sci. 2019, 24, 299. 10.3746/pnf.2019.24.3.299. [DOI] [PMC free article] [PubMed] [Google Scholar]
- Braissant O.; Foufelle F.; Scotto C.; Dauça M.; Wahli W. Differential expression of peroxisome proliferator-activated receptors (PPARs): tissue distribution of PPAR-alpha, -beta, and -gamma in the adult rat. Endocrinology 1996, 137, 354. 10.1210/endo.137.1.8536636. [DOI] [PubMed] [Google Scholar]
- Tsuchida A.; Yamauchi T.; Kadowaki T. Nuclear receptors as targets for drug development: molecular mechanisms for regulation of obesity and insulin resistance by peroxisome proliferator-activated receptor gamma, CREB-binding protein, and adiponectin. J. Pharmacol. Sci. 2005, 97, 164. 10.1254/jphs.fmj04008x2. [DOI] [PubMed] [Google Scholar]
- Kast-Woelbern H. R.; Dana S. L.; Cesario R. M.; Sun L.; de Grandpre L. Y.; Brooks M. E.; Osburn D. L.; Reifel-Miller A.; Klausing K.; Leibowitz M. D. Rosiglitazone induction of Insig-1 in white adipose tissue reveals a novel interplay of peroxisome proliferator-activated receptor gamma and sterol regulatory element-binding protein in the regulation of adipogenesis. J. Biol. Chem. 2004, 279, 23908. 10.1074/jbc.m403145200. [DOI] [PubMed] [Google Scholar]
- Barak Y.; Nelson M. C.; Ong E. S.; Jones Y. Z.; Ruiz-Lozano P.; Chien K. R.; Koder A.; Evans R. M. PPAR gamma is required for placental, cardiac, and adipose tissue development. Mol. Cell 1999, 4, 585. 10.1016/s1097-2765(00)80209-9. [DOI] [PubMed] [Google Scholar]
- Kubota N.; Terauchi Y.; Miki H.; Tamemoto H.; Yamauchi T.; Komeda K.; Satoh S.; Nakano R.; Ishii C.; Sugiyama T.; et al. PPAR gamma mediates high-fat diet-induced adipocyte hypertrophy and insulin resistance. Mol. Cell 1999, 4, 597. 10.1016/s1097-2765(00)80210-5. [DOI] [PubMed] [Google Scholar]
- Rosen E. D.; Sarraf P.; Troy A. E.; Bradwin G.; Moore K.; Milstone D. S.; Spiegelman B. M.; Mortensen R. M. PPAR gamma is required for the differentiation of adipose tissue in vivo and in vitro. Mol. Cell 1999, 4, 611. 10.1016/s1097-2765(00)80211-7. [DOI] [PubMed] [Google Scholar]
- Lane M. D.; Lin F. T.; MacDougald O. A.; Vasseur-Cognet M. Control of adipocyte differentiation by CCAAT/enhancer binding protein alpha (C/EBP alpha). Int. J. Obes. Relat. Metab. Disord. 1996, 20, S91. [PubMed] [Google Scholar]
- Lin F. T.; Lane M. D. CCAAT/enhancer binding protein alpha is sufficient to initiate the 3T3-L1 adipocyte differentiation program. Proc. Natl. Acad. Sci. U. S. A. 1994, 91, 8757. 10.1073/pnas.91.19.8757. [DOI] [PMC free article] [PubMed] [Google Scholar]
- Lin F. T.; Lane M. D. Antisense CCAAT/enhancer-binding protein RNA suppresses coordinate gene expression and triglyceride accumulation during differentiation of 3T3-L1 preadipocytes. Genes Dev. 1992, 6, 533. 10.1101/gad.6.4.533. [DOI] [PubMed] [Google Scholar]
- Chen D.; Wang Y.; Wu K.; Wang X. Dual Effects of Metformin on Adipogenic Differentiation of 3T3-L1 Preadipocyte in AMPK-Dependent and Independent Manners. Int. J. Mol. Sci. 2018, 19, 1547. 10.3390/ijms19061547. [DOI] [PMC free article] [PubMed] [Google Scholar]
- Jung Y.; Park J.; Kim H. L.; Sim J. E.; Youn D. H.; Kang J.; Lim S.; Jeong M. Y.; Yang W. M.; Lee S. G.; Ahn K. S.; Um J. Y. Vanillic acid attenuates obesity via activation of the AMPK pathway and thermogenic factors in vivo and in vitro. FASEB J. 2018, 32, 1388. 10.1096/fj.201700231rr. [DOI] [PubMed] [Google Scholar]
- Diep D. T. V.; Hong K.; Khun T.; Zheng M.; Ul-Haq A.; Jun H. S.; Kim Y. B.; Chun K. H. Anti-adipogenic effects of KD025 (SLx-2119), a ROCK2-specific inhibitor, in 3T3-L1 cells. Sci. Rep. 2018, 8, 2477. 10.1038/s41598-018-20821-3. [DOI] [PMC free article] [PubMed] [Google Scholar]
- Park Y.-K.; Obiang-Obounou B. W.; Lee K.-B.; Choi J.-S.; Jang B.-C. AZD1208, a pan-Pim kinase inhibitor, inhibits adipogenesis and induces lipolysis in 3T3-L1 adipocytes. J. Cell Mol. Med. 2018, 22, 2488–2497. 10.1111/jcmm.13559. [DOI] [PMC free article] [PubMed] [Google Scholar]
- Chayaratanasin P.; Caobi A.; Suparpprom C.; Saenset S.; Pasukamonset P.; Suanpairintr N.; Barbieri M. A.; Adisakwattana S. Clitoria ternatea Flower Petal Extract Inhibits Adipogenesis and Lipid Accumulation in 3T3-L1 Preadipocytes by Downregulating Adipogenic Gene Expression. Molecules 2019, 24, 1894. 10.3390/molecules24101894. [DOI] [PMC free article] [PubMed] [Google Scholar]
- Sheng D. D.; Zhao S. M.; Gao L.; Zheng H. F.; Liu W. T.; Jin Y. X.; Ye F.; Zhao Q. D.; Li R.; Zhao N. P.; Zhang L.; Han Z. P.; Wei L. X. BabaoDan attenuates high-fat diet-induced non-alcoholic fatty liver disease via activation of AMPK signaling. Cell Biosci. 2019, 9, 77. 10.1186/s13578-019-0339-2. [DOI] [PMC free article] [PubMed] [Google Scholar]


