

Abstract

The aim of this study is to establish a new method with high sensitivity, accuracy, and stability for the determination of human IgG and then expand it to analyze severe acute respiratory syndrome corona virus 2 (SARS-CoV-2)-specific IgM and IgG, which is of great significance for the screening and diagnosis of COVID-19. In this study, the magnetic Fe3O4 nanospheres coupled with mouse antihuman IgG (Ab1IgG) were used as an immune capture probe (Fe3O4@Ab1IgG) to capture and separate the target, and rabbit antihuman IgG (Ab2IgG) coupled with highly luminescent quantum dot nanobeads (QBs) as a fluorescence detection probe (QBs@Ab2IgG) was used to realize high sensitivity detection. After the formation of a sandwich immunocomplex, the fluorescence intensity of the precipitate after magnetic separation was measured at the excitation wavelength of 370 nm. Under optimal conditions, a wide linear range varying from 0.005 to 40 ng·mL–1 was obtained for the detection of human IgG with a lower limit of detection at 4 pg·mL–1 (S/N = 3). The recoveries of intra- and interassays were 90.0–101.9 and 96.0–106.6%, respectively, and the relative standard deviations were 6.3–10.2 and 2.6–10.5%, respectively. Furthermore, the proposed method was successfully demonstrated to detect human IgG in serum samples, and the detection results were not statistically different (P > 0.05) from commercial enzyme-linked immunosorbent assay kits. This method is sensitive, fast, and accurate, which could be expanded to detect the specific IgM and IgG antibodies against SARS-CoV-2.
1. Introduction
In December 2019, a kind of pneumonia infected by a novel coronavirus broke out in Wuhan, Hubei, China, which rapidly spread and seriously threatened the health and life safety of the people. On 11 February 2020, the World Health Organization (WHO) officially named the new coronavirus pneumonia as coronavirus disease 2019 (COVID-19).1 On the same day, the Coronavirus Study Group of the International Committee on Taxonomy of Viruses named the virus as severe acute respiratory syndrome coronavirus 2 (SARS-CoV-2).2 As of 19 June 2020, the total number of confirmed cases worldwide has reached 8,385,440, and the death toll has exceeded 450,686.3 More worryingly, specific drugs and vaccines will not be available soon.4−6 Therefore, rapid screening of patients and asymptomatic cases is still the key to the prevention and control of COVID-19.
Although the positive result of SARS-CoV-2 nucleic acid test is the “gold standard” for the diagnosis of COVID-19, there is a certain proportion of false negative because of many factors, such as sample type, quality, delivery time, and so on.7,8 Serological testing is another major screening technique for the asymptomatic cases, previous infections, and their close contacts.9,10 In addition to the role of alternative or complementary methods to confirm suspected cases, this detection method will also provide important information about the human immune response process and be used to evaluate the effectiveness of the vaccine.11 At present, enzyme-linked immunosorbent assay (ELISA)12,13 and flow immunoassay14−16 are the two main methods to detect specific antibodies against SARS-CoV-2. Although these methods are simple and convenient, the sensitivity and accuracy need to be further improved, especially in some special cases such as proofreading and verification. In view of their defects, chemiluminescent immunoassay (CLIA),17,18 single molecule array assay,19 indirect immunofluorescence assay,20 and other techniques have been gradually developed, so it is necessary to constantly improve and innovate the existing methods. Theoretically, IgM appeared earlier in serum than IgG but because of its lower content, shorter duration, lower sensitivity, and specificity, some studies21,22 have shown that serum IgG amounts can increase at the same time or earlier than those of IgM against SARS-CoV-2. Therefore, it is of great significance to establish a highly sensitive, accurate, and stable method for the detection of human IgG and then expand it for the detection of SARS-CoV-2-specific IgM and IgG.
Magnetic Fe3O4 nanospheres have the advantages of uniform particle size distribution, large specific surface area, easy modification, good water solubility, strong dispersion, and excellent magnetism, so it is an ideal carrier material with good separation effect.23−26 Quantum dot is an excellent fluorescent material, which has the characteristics of broad excitation range, narrow emission spectra, high fluorescent quantum yield, large molar extinction coefficient, and superior brightness and durability to photobleaching.27−31 Furthermore, because of the doping of a large number of quantum dots, the stability and fluorescence intensity of quantum dot nanobeads (QBs) are significantly higher than those of quantum dots, which can effectively improve the sensitivity of the detection method.32−34 Thus, it would be a good choice to establish a fluorescence-linked immunosorbent assay (FLISA) based on magnetic Fe3O4 nanospheres and QBs to detect human IgG in serum.
In this design, an immune capture probe was prepared by using 1-(3-dimethylaminopropyl) -3-ethylcarbodiimide hydrochloride/N-hydroxysulfosuccinimide (EDC/Sulfo-NHS) as a coupling agent to conjugate mouse antihuman IgG (Ab1IgG) on the surface of carboxylated magnetic Fe3O4 nanospheres. The IgG fluorescence detection probe was prepared by coupling rabbit antihuman IgG (Ab2IgG) to the surface of QBs by the same method. When human IgG is present, Fe3O4@Ab1IgG, human IgG, and QBs@Ab2IgG would form a sandwich immunocomplex, and the precipitation has a strong fluorescence signal after magnetic separation. When human IgG is absent, the fluorescence detection probe was discarded after magnetic separation, and the precipitate does not show fluorescence signals. Moreover, the practicability and accuracy of the sensor have been successfully confirmed in the detection of human IgG in serum. Therefore, the assay established in this study has a potential application prospect in the IgG detection of complex biological samples and can provide some inspiration and theoretical basis for the establishment and application of SARS-CoV-2 serum antibody detection technology.
2. Results and Discussion
2.1. Principle of FLISA
In this work, Ab1IgG and Ab2IgG were successfully coupled to magnetic Fe3O4 nanospheres and QBs under the action of EDC/Sulfo-NHS, respectively. As depicted in Scheme 1, after the prepared Fe3O4@Ab1IgG reacted with the human IgG standards or samples for a period of time, the targets were captured and enriched by the specific binding of antibody and antigen, and then the unbound standards or samples were removed by magnetic separation. When QBs@Ab2IgG was added, the QBs@Ab2IgG would bind to human IgG specifically by antigen–antibody reaction so that the Fe3O4@Ab1IgG–human IgG–QBs@Ab2IgG formed a sandwich structure, and the excess QBs@Ab2IgG was washed away by magnetic separation. The fluorescence intensity of the reaction product was measured under the excitation wavelength of 370 nm, and the fluorescence intensity was positively correlated with the target concentration.
Scheme 1. Schematic Presentation of the Determination of Human IgG Based on FLISA.

2.2. Characterization of Fe3O4@Ab1IgG and QBs@Ab2IgG
The magnetic Fe3O4 nanosphere, Fe3O4@Ab1IgG, and QBs were characterized by transmission electron microscopy (TEM). As shown in Figure 1, compared with magnetic Fe3O4 nanospheres (a), the surface of Fe3O4@Ab1IgG (b) has changed, which can preliminarily judge the coupling success of Fe3O4 and Ab1IgG. The particle size distribution of QBs was relatively uniform, and the surface of the nanospheres was coated with quantum dots (Figure 1c).
Figure 1.

TEM of the magnetic Fe3O4 nanosphere (a), Fe3O4@Ab1IgG (b), and QBs (c). Immune activity of Fe3O4@Ab1IgG (d) (the concentrations of IgG were 20, 40, 80, 160, 320 ng/mL) and QBs@Ab2IgG (e) (the concentrations of IgG were 0.5, 1.0, 2.0, 4.0, 8.0 μg/mL) were evaluated by ELISA.
The combination of carboxylated Fe3O4 with Ab1IgG was confirmed by hydrodynamic diameter and zeta potential. The hydrodynamic diameter of Ab1IgG-modified Fe3O4 increased (Figure S1a) and the zeta potential decreased (Figure S1b), suggesting that Fe3O4@Ab1IgG has been successfully prepared. Moreover, the infrared spectrum of Fe3O4@Ab1IgG (Figure S2a) has one more characteristic absorption peak than that of Fe3O4 (Figure S2b). In addition, the biological activity of Fe3O4@Ab1IgG was determined by ELISA. First, Fe3O4@Ab1IgG was used to react with human IgG and Ab2IgG-HRP. After adding 3,3′,5,5′-tetramethylbenzidine (TMB) substrate solution and incubating for 20 min, H2SO4 solution was put in to stop the reaction. Finally, the optical density (OD) value was measured at 450 nm. It can be seen from Figure 1d that OD value increased with the increase of human IgG concentration and declined with the capture probe dilution ratio, indicating that Fe3O4@Ab1IgG still possessed immunoreactivity to human IgG.
Similarly, we also examined the properties of QBs@Ab2IgG. Compared with QB, the hydrodynamic diameter of Ab2IgG-modified QBs increased (Figure S1c) and the zeta potential decreased (Figure S1d), indicating that the conjugate QBs@Ab2IgG was successfully prepared. At the same time, the addition of a new characteristic absorption peak in the infrared spectrum also confirmed the formation of QBs@Ab2IgG (Figure S2cc). In order to obtain more accurate and reliable fluorescence signals, the excitation wavelength was optimized to 370 nm (Figure S3). Next, we also evaluated the biological activity of QBs@Ab2IgG by ELISA. As can be seen from Figure 1e, the changing trend of OD value was closely related to the concentration of human IgG and the dilution ratio of QBs@Ab2IgG, which indicated that Ab2IgG bound with QBs still retained immunoreactivity.
2.3. Optimization of Experimental Conditions
Immune capture probe and fluorescence detection probe, as the intermediate materials of the experimental process, played an important role in the whole experiment. Therefore, in order to improve the quality of the capture probe and save the cost and reaction time (Figure 2a), the amount of antibody (Figure 2b), the amount of coupling agent (Figure S4a), buffer solution (Figure S4b), and reaction temperature (Figure S4c) were optimized with the coupling efficiency (the calculation method is shown in the Supporting Information) as the index. The results showed that the optimal immune capture probe was obtained by adding 1.0 mg of EDC, 2.0 mg of Sulfo-NHS, 10 μg of Ab1IgG and reacting in phosphate buffer saline (PBS) solution at 25 °C for 2 h. Similarly, in order to synthesize the high-quality fluorescence detection probe, the amounts of Ab2IgG, Sulfo-NHS and EDC were optimized to 30 μg, 20 mg, and 5 mg, respectively (Table S1).
Figure 2.

Optimization of crucial parameters for Fe3O4@Ab1IgG preparation and FLISA. (a) Reaction time of Fe3O4 and Ab1IgG. (b) Amount of Ab2IgG. (c) Dilution ratio of Fe3O4@Ab1IgG. (d) Dilution ratio of QBs@Ab2IgG.
In addition, the sensitivity of the whole experiment mainly depended on the concentration of the immune capture probe and fluorescence detection probe, so the dilution ratio of Fe3O4@Ab1IgG and QBs@Ab2IgG was optimized. According to Figure 2c,d, the fluorescence intensity increased at first and then decreased with the decrease of probe concentration. Under the condition of high concentration, the fluorescence intensity weakened rapidly. The reason may be that the high concentration of Fe3O4@Ab1IgG caused the aggregation phenomenon35−37 or the color of Fe3O4@Ab1IgG (black) interfered with the fluorescence of the immunocomplex.38,39 Similarly, the phenomenon of fluorescence weakening caused by excessive concentration of signal detection probe is consistent with other reports.37,40−42 Therefore, the optimal dilution ratios of Fe3O4@Ab1IgG and QBs@Ab2IgG were 1:40 and 1:4, respectively.
2.4. Analytical Performance of the Proposed Assay
Under the optimal conditions, the analytical performance of the FLISA was explored for the determination of human IgG. The calibration plot of human IgG at different concentrations is shown in Figure 3a, from which we could see that the fluorescence intensity increased gradually with the increase of IgG concentration in a certain range. This method showed a good linear relationship between the relative fluorescence units (RFU) and human IgG in the concentration range of 0.005–40 ng·mL–1, the linear regression equation was Y = 757.498 + 141.33X (where X denotes lg CIgG, and Y denotes RFU), the correlation coefficient (r) was 0.9946, and the limit of detection (LOD) was 0.004 ng·mL–1 (S/N = 3). Then, human IgG, human IgM, and human IgA were detected at the same concentration (25 ng·mL–1). The results clearly showed that the fluorescence response of human IgG was much greater than that of the other two antigens (Figure 3b), indicating that this method has high selective recognition ability for human IgG. Finally, the accuracy and precision were verified by quantitative analysis of serum spiked samples with different concentrations (0.05, 1, 25 ng·mL–1) of IgG. The recoveries of intra- and interassays were 90.0–101.9 and 96.0–106.6%, respectively; and the relative standard deviations were 6.3–10.2 and 2.6–10.5%, respectively.
Figure 3.

(a) Calibration plot in the presence of different concentrations of human IgG; (b) investigation of the selectivity of different types of protein (human IgG, human IgA, human IgM).
Furthermore, the method established in this study was compared with the recently reported optical methods for the analysis of IgG. We can see from Table 1 that the proposed FLISA has a wider linear range and a lower LOD than others. In conclusion, this method is an accurate, sensitive, low-cost, time-saving, and high-throughput method for the detection of IgG, which has a great potential value in scientific research and clinical practice.
Table 1. Comparison of Analytical Performances of Different Optical Methods Used for the Determination of IgG.
| materials used | method applied | LOD (ng/mL) | refs |
|---|---|---|---|
| fluorescent copper nanoclusters | FLISA | 0.007 | (43) |
| silica nanospheres and quantum dots | FLISA | 0.100 | (44) |
| carbon dots | FLISA | 0.150 | (45) |
| protein-functionalized titania particle | CLIA | 0.100 | (46) |
| gold nanoparticles | CLIA | 0.032 | (47) |
| polydimethylsiloxane microfluidic | CLIA | 0.030 | (48) |
| magnetic beads and QBs | FLSA | 0.004 | this work |
2.5. Detection of Human Serum Samples
In order to further confirm the applicability of this method to complex biological samples, 20 serum samples diluted 50,000 times were detected by FLISA, and the results were compared with commercial ELISA kits. Paired sample t-test results showed that there was no statistically significant difference between the two methods (t = 0.315, P > 0.05), indicating that the FLISA method established in this study was reliable and could be applied to the detection of actual samples. The test results were converted into scatter diagrams (Figure 4), and the original data are shown in Table S2.
Figure 4.
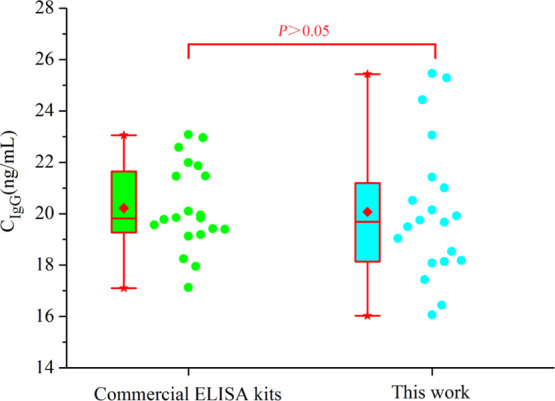
Comparison of the results of the commercial ELISA kit and FLISA in the detection of human IgG in serum samples diluted 50,000 times.
3. Conclusions
In summary, we designed a new fluorescence immunoassay method by combining nanotechnology, magnetic separation technology, and immunoassay technology and proved that it can be applied to detect human IgG in serum samples. Because of its large specific surface area, the immobilization of antibodies with magnetic Fe3O4 nanoparticles can overcome the shortcomings of conventional ELISA analysis, such as easy shedding of coated antigen (or antibody), small solid–liquid contact area, long analysis time, and so on. In addition, as a high fluorescence material, QBs significantly improved the sensitivity of the experiment. As a result, in this study, FLISA had a wide linear range, high sensitivity, high accuracy, good precision, and simple and quick operation and showed better performance than traditional analytical methods. Besides, the experiment was carried out in a 96-well plate, which provided a possibility for high-throughput and large-sample detection.
In addition, the detection of other antigens can be realized only by replacing the corresponding antibodies, and the simultaneous determination of multicomponents can also be achieved by adding a variety of fluorescent materials with different emission wavelengths. Therefore, this study can be conceivably expanded to detect SARS-CoV-2-specific IgM and IgG in serum and used for the rapid screening of infected patients and asymptomatic carriers. Although the flow immunoassay is simple, convenient, fast, and widely used in various fields,49−53 it is necessary to further improve the sensitivity in the detection of SARS-CoV-2-specific antibodies.54 The higher the sensitivity, the earlier the specific antibodies can be detected, that is, the earlier measures can be taken for prevention, diagnosis, and treatment. Therefore, the methods with high sensitivity, high accuracy, and good repeatability established in this study can complement each other with flow immunoassay, especially in the fields of proofreading or verifying data and scientific research.
4. Materials and Methods
4.1. Materials and Instruments
Human immunoglobulin G (human IgG), rabbit antihuman IgG (Ab2IgG), rabbit antihuman IgG-HRP (Ab2IgG-HRP), goat antirabbit IgG-HRP, bovine serum albumin (BSA), and TMB substrate solution were purchased from Solarbio Life Sciences (Beijing, China, http://www.solarbio.com/). QBs were obtained from Wuhan Jiayuan Quantum Dots Co., Ltd. (Wuhan, China, http://www.qds.net.cn/). Mouse antihuman IgG (Ab1IgG) was bought from Baiaotong Experimental Materials Center (Luoyang, China, http://www.ablab.com.cn/). Carboxylated magnetic Fe3O4 nanospheres were provided by BioMag Scientific Inc. (Wuxi, China, http://www.biomagbeads.com/). The human IgG ELISA kit was obtained from Arigo Biolaboratories Corp. (Shanghai, China, https://www.arigobio.cn/). 1-(3-Dimethylaminopropyl)-3-ethylcarbodiimide hydrochloride (EDC, 98.0%) and N-hydroxysulfosuccinimide (Sulfo-NHS, 98%) were supplied by Aladdin Industrial Corporation (Shanghai, China, https://www.aladdin-e.com/). All other chemicals were of analytical reagent grade, and all solutions were prepared with Milli-Q water (resistivity ≥ 18.2 MΩ·cm). Serum samples were taken from the Department of Respiratory and Critical Care of the First Affiliated Hospital of Zhengzhou University.
Fluorescence, UV–vis, and IR spectra were recorded with an F-4500 spectrofluorophotometer (HITACHI Co., Ltd., Japan), a UV-1601 UV–vis spectrometer (Shimadzu Co., Ltd., Japan), and a PE-1710 IR spectrometer (West PE Co., Ltd., Germany), respectively. RFU and OD were measured by a multimode microplate reader SpectraMax M2e (USA). TEM images were recorded using a JEM-2100 transmission electron microscope (Japan). Hydrodynamic diameter and zeta potential were analyzed using a Zetasizer Nano-zs 90(Malvern Co., Ltd., England). A magnetic panel was used for magnetic separation (Baiyun Nano Technology Co., Ltd., China).
4.2. Preparation of an Immune Capture Probe (Fe3O4@Ab1IgG) and a Fluorescence Detection Probe (QBs@Ab2IgG)
The Fe3O4@Ab1IgG conjugates were synthesized by an EDC/Sulfo-NHS chemical bonding method. At first, 100 μL of 50 mg·mL–1 carboxylated magnetic Fe3O4 nanospheres was washed three times with 300 μL of PBS (pH 7.4, containing 0.01 mol·L–1 PBS). Subsequently, 100 μL of 0.1 mg·mL–1 Ab1IgG was added and gently stirred to mix. After that, 100 μL of EDC/Sulfo-NHS (10 mg·mL–1 EDC and 20 mg·mL–1 Sulfo-NHS were prepared by PBS) was put together and the mixture was incubated at 25 °C for 2 h, followed by magnetic separation and washing twice with PBS. Afterward, in order to block the unreacted activated groups, 300 μL of blocking buffer (pH 7.4, containing 0.01 mol·L–1 PBS and 0.5% BSA) was injected into the tube with stirring for 30 min and then washed twice with 300 μL of PBS. After being mixed with 300 μL of PBS, the final tubes were stored at 4 °C. In a similar strategy, QBs were coupled with Ab2IgG to prepare fluorescence detection probes.
4.3. FLISA for Human IgG
The detection of human IgG by FLISA was as follows: (a) the 96-well polystyrene plate was blocked by 300 μL of blocking buffer at 37 °C for 90 min and then washed with 300 μL of PBST (pH 7.4, containing 0.01 mol·L–1 PBS and 0.05% Tween 20). (b) Fe3O4@Ab1IgG solution diluted with PBS (1:40) (100 μL) was added, followed by washing three times. (c) Human IgG (100 μL) with different concentrations (0.005, 0.01, 0.05, 0.1, 0.5, 1, 5, 10, 25, 40 ng·mL–1) diluted with PBS was taken and incubated at 37 °C for 90 min. After that, all of the supernatants were discarded by magnetic separation and washed three times with PBST. (d) QBs@Ab2IgG (100 μL) diluted into 1:4 with PBS was taken and incubated at 37 °C for 90 min to form Fe3O4@Ab1IgG–human IgG–QBs@Ab2IgG. Then, the redundant QBs@Ab2IgG was removed by magnetic separation and washing the precipitates 5 times. (e) After being mixed with 200 μL of PBST, RFU was recorded at the excitation wavelength of 370 nm.
4.4. Detection of the Serum Sample
Blood samples were taken from the First Affiliated Hospital of Zhengzhou University. About 3 mL of fasting venous blood was placed in a nonanticoagulant tube and then kept in a water bath at 37 °C for 30 min. After that, the serum was centrifuged at the speed of 3000 rpm for 5 min to separate the serum and then placed in a dry freezer and stored at −80 °C until use.
Supporting Information Available
The Supporting Information is available free of charge at https://pubs.acs.org/doi/10.1021/acsomega.0c02987.
Hydrodynamic diameter, zeta potential, and infrared spectrum characterization of Fe3O4@Ab1IgG and QBs@Ab2IgG; selection of the best excitation wavelength; calculation method of coupling efficiency; optimization of Fe3O4@Ab1IgG and QBs@Ab2IgG preparation; and detection results of human serum by using FLISA and a commercial ELISA kit (PDF)
This work was supported by the National Natural Science Foundation of China (no. 81973099), Science, Technology Department of Henan Province (no. 172102210006), and 2020 Henan Key Science and Technology R&D and Promotion Project (no. 202102310140).
The authors declare no competing financial interest.
Supplementary Material
References
- WHO . WHO Director-General’s Remarks at the Media Briefing on 2019-nCoV on Feb 11, 2020, https://www.who.int/dg/speeches/detail/who-director-general-s-remarks-at-the-media-briefing-on-2019-ncov-on-11-february-2020.
- Gorbalenya A. E.; Baker S. C.; Baric R. S.; Groot R. J. d.; Drosten C.; Gulyaeva A. A.; Haagmans B. L.; Lauber C.; Leontovich A. M.; Neuman B. W.; Penzar D.; Perlman S.; Poon L. L.; Samborskiy D. V.; Sidorov I. A.; Sola I.; Ziebuhr J. The species Severe acute respiratory syndrome-related coronavirus : classifying 2019-nCoV and naming it SARS-CoV-2. Nat. Microbiol. 2020, 5, 536–544. 10.1038/s41564-020-0695-z. [DOI] [PMC free article] [PubMed] [Google Scholar]
- WHO . Coronavirus Disease 2019 (COVID-19) Situation Report—151; World Health Organization, 2020, https://www.who.int/docs/default-source/coronaviruse/situation-reports/20200619-covid-19-sitrep-151.pdf?sfvrsn=8b23b56e_2.
- Li H.; Liu S.-M.; Yu X.-H.; Tang S.-L.; Tang C.-K.. Coronavirus disease 2019 (COVID-19): current status and future perspectives. Int. J. Antimicrob. Agents 2020, 55, doi: 10.1016/j.ijantimicag.2020.105951. [DOI] [PMC free article] [PubMed] [Google Scholar]
- Wang L.; Wang Y.; Ye D.; Liu Q.. Review of the 2019 novel coronavirus (SARS-CoV-2) based on current evidence. Int. J. Antimicrob. Agents 2020, 55, doi: 10.1016/j.ijantimicag.2020.105948. [DOI] [PMC free article] [PubMed] [Google Scholar]
- Yang Y.; Peng F.; Wang R.; Guan K.; Jiang T.; Xu G.; Sun J.; Chang C.. The deadly coronaviruses: The 2003 SARS pandemic and the 2020 novel coronavirus epidemic in China. J. Autoimmun.. 2020109, doi: 10.1016/j.jaut.2020.102434. [DOI] [PMC free article] [PubMed] [Google Scholar]
- Xie C.; Jiang L.; Huang G.; Pu H.; Gong B.; Lin H.; Ma S.; Chen X.; Long B.; Si G.; Yu H.; Jiang L.; Yang X.; Shi Y.; Yang Z. Comparison of different samples for 2019 novel coronavirus detection by nucleic acid amplification tests. Int. J. Infect. Dis. 2020, 93, 264–267. 10.1016/j.ijid.2020.02.050. [DOI] [PMC free article] [PubMed] [Google Scholar]
- Lv D.-f.; Ying Q.-m.; Weng Y.-s.; Shen C.-b.; Chu J.-g.; Kong J.-p.; Sun D.-h.; Gao X.; Weng X.-b.; Chen X.-q. Dynamic change process of target genes by RT-PCR testing of SARS-Cov-2 during the course of a Coronavirus Disease 2019 patient. Clin. Chim. Acta 2020, 506, 172–175. 10.1016/j.cca.2020.03.032. [DOI] [PMC free article] [PubMed] [Google Scholar]
- Pan Y.; Li X.; Yang G.; Fan J.; Tang Y.; Zhao J.; Long X.; Guo S.; Zhao Z.; Liu Y.; Hu H.; Xue H.; Li Y. Serological immunochromatographic approach in diagnosis with SARS-CoV-2 infected COVID-19 patients. J. Infect. 2020, 81, E28 10.1016/j.jinf.2020.03.051. [DOI] [PMC free article] [PubMed] [Google Scholar]
- Zhao J.; Yuan Q.; Wang H.; Liu W.; Liao X.; Su Y.; Wang X.; Yuan J.; Li T.; Li J.; Qian S.; Hong C.; Wang F.; Liu Y.; Wang Z.; He Q.; Li Z.; He B.; Zhang T.; Fu Y.; Ge S.; Liu L.; Zhang J.; Xia N.; Zhang Z. Antibody responses to SARS-CoV-2 in patients of novel coronavirus disease 2019. Clin. Infect. Dis. 2020, 10.1093/cid/ciaa344. [DOI] [PMC free article] [PubMed] [Google Scholar]
- Carter L. J.; Garner L. V.; Smoot J. W.; Li Y.; Zhou Q.; Saveson C. J.; Sasso J. M.; Gregg A. C.; Soares D. J.; Beskid T. R.; Jervey S. R.; Liu C. Assay Techniques and Test Development for COVID-19 Diagnosis. ACS Cent. Sci. 2020, 6, 591–605. 10.1021/acscentsci.0c00501. [DOI] [PMC free article] [PubMed] [Google Scholar]
- Liu L.; Liu W.; Zheng Y.; Jiang X.; Kou G.; Ding J.; Wang Q.; Huang Q.; Ding Y.; Ni W.; Wu W.; Tang S.; Tan L.; Hu Z.; Xu W.; Zhang Y.; Zhang B.; Tang Z.; Zhang X.; Li H.; Rao Z.; Jiang H.; Ren X.; Wang S.; Zheng S. A preliminary study on serological assay for severe acute respiratory syndrome coronavirus 2 (SARS-CoV-2) in 238 admitted hospital patients. Microbes Infect. 2020, 22, 206–211. 10.1016/j.micinf.2020.05.008. [DOI] [PMC free article] [PubMed] [Google Scholar]
- Zhang W.; Du R.-H.; Li B.; Zheng X.-S.; Yang X.-L.; Hu B.; Wang Y.-Y.; Xiao G.-F.; Yan B.; Shi Z.-L.; Zhou P. Molecular and serological investigation of 2019-nCoV infected patients: implication of multiple shedding routes. Emerging Microbes Infect. 2020, 9, 386–389. 10.1080/22221751.2020.1729071. [DOI] [PMC free article] [PubMed] [Google Scholar]
- Li Z.; Yi Y.; Luo X.; Xiong N.; Liu Y.; Li S.; Sun R.; Wang Y.; Hu B.; Chen W.; Zhang Y.; Wang J.; Huang B.; Lin Y.; Yang J.; Cai W.; Wang X.; Cheng J.; Chen Z.; Sun K.; Pan W.; Zhan Z.; Chen L.; Ye F. Development and Clinical Application of A Rapid IgM-IgG Combined Antibody Test for SARS-CoV-2 Infection Diagnosis. J. Med. Virol. 2020, 92, 1518. 10.1002/jmv.25727. [DOI] [PMC free article] [PubMed] [Google Scholar]
- Huang C.; Wen T.; Shi F.-J.; Zeng X.-Y.; Jiao Y.-J. Rapid Detection of IgM Antibodies against the SARS-CoV-2 Virus via Colloidal Gold Nanoparticle-Based Lateral-Flow Assay. ACS Omega 2020, 5, 12550–12556. 10.1021/acsomega.0c01554. [DOI] [PMC free article] [PubMed] [Google Scholar]
- Liu Y.; Liu Y.; Diao B.; Ren F.; Wang Y.; Ding J.; Huang Q.. Diagnostic Indexes of a Rapid IgG/IgM Combined Antibody Test for SARS-CoV-2. 2020, medRxiv:10.1101/2020.03.26.20044883. [Google Scholar]
- Infantino M.; Grossi V.; Lari B.; Bambi R.; Perri A.; Manneschi M.; Terenzi G.; Liotti I.; Ciotta G.; Taddei C.; Benucci M.; Casprini P.; Veneziani F.; Fabbri S.; Pompetti A.; Manfredi M. Diagnostic accuracy of an automated chemiluminescent immunoassay for anti-SARS-CoV-2 IgM and IgG antibodies: an Italian experience. J. Med. Virol. 2020, 92, 1671. 10.1002/jmv.25932. [DOI] [PMC free article] [PubMed] [Google Scholar]
- Xiao A. T.; Gao C.; Zhang S. Profile of specific antibodies to SARS-CoV-2: The first report. J. Infect. 2020, 81, 147–178. 10.1016/j.jinf.2020.03.012. [DOI] [PMC free article] [PubMed] [Google Scholar]
- Norman M.; Gilboa T.; Ogata A. F.; Maley A. M.; Cohen L.; Cai Y.; Zhang J.; Feldman J. E.; Hauser B. M.; Caradonna T. M.; Chen B.; Schmidt A. G.; Alter G.; Charles R. C.; Ryan E. T.; Walt D. R.. Ultra-Sensitive High-Resolution Profiling of Anti-SARS-CoV-2 Antibodies for Detecting Early Seroconversion in COVID-19 Patients. 2020, medRxiv:10.1101/2020.04.28.20083691. [Google Scholar]
- Edouard S.; Colson P.; Melenotte C.; De Pinto F.; Thomas L.; La Scola B.; Million M.; Tissot dupont H.; Gautret P.; Stein A.; Brouqui P.; Parola P.; Lagier J.-C.; Raoult D.; Drancourt M.. Evaluating the serological status of COVID-19 patients using an indirect immunofluorescent assay, France. 2020, medRxiv:10.1101/2020.05.05.20092064. [DOI] [PMC free article] [PubMed] [Google Scholar]
- To K. K.-W.; Tsang O. T.-Y.; Leung W.-S.; Tam A. R.; Wu T.-C.; Lung D. C.; Yip C. C.-Y.; Cai J.-P.; Chan J. M.-C.; Chik T. S.-H.; Lau D. P.-L.; Choi C. Y.-C.; Chen L.-L.; Chan W.-M.; Chan K.-H.; Ip J. D.; Ng A. C.-K.; Poon R. W.-S.; Luo C.-T.; Cheng V. C.-C.; Chan J. F.-W.; Hung I. F.-N.; Chen Z.; Chen H.; Yuen K.-Y. Temporal profiles of viral load in posterior oropharyngeal saliva samples and serum antibody responses during infection by SARS-CoV-2: an observational cohort study. Lancet Infect. Dis. 2020, 20, 565–574. 10.1016/s1473-3099(20)30196-1. [DOI] [PMC free article] [PubMed] [Google Scholar]
- Zhang W.; Du R.-H.; Li B.; Zheng X.-S.; Yang X.-L.; Hu B.; Wang Y.-Y.; Xiao G.-F.; Yan B.; Shi Z.-L.; Zhou P. Molecular and serological investigation of 2019-nCoV infected patients: implication of multiple shedding routes. Emerg. Microb. Infect. 2020, 9, 386–389. 10.1080/22221751.2020.1729071. [DOI] [PMC free article] [PubMed] [Google Scholar]
- Azzouz A.; Kailasa S. K.; Lee S. S.; J. Rascón A.; Ballesteros E.; Zhang M.; Kim K.-H. Review of nanomaterials as sorbents in solid-phase extraction for environmental samples. Trends Anal. Chem. 2018, 108, 347–369. 10.1016/j.trac.2018.08.009. [DOI] [Google Scholar]
- Laurent S.; Forge D.; Port M.; Roch A.; Robic C.; Vander Elst L.; Muller R. N. Magnetic Iron Oxide Nanoparticles: Synthesis, Stabilization, Vectorization, Physicochemical Characterizations, and Biological Applications. Chem. Rev. 2008, 108, 2064–2110. 10.1021/cr068445e. [DOI] [PubMed] [Google Scholar]
- Iranmanesh M.; Hulliger J. Magnetic separation: its application in mining, waste purification, medicine, biochemistry and chemistry. Chem. Soc. Rev. 2017, 46, 5925–5934. 10.1039/c7cs00230k. [DOI] [PubMed] [Google Scholar]
- Yu M.; Wang L.; Hu L.; Li Y.; Luo D.; Mei S. Recent applications of magnetic composites as extraction adsorbents for determination of environmental pollutants. Trends Anal. Chem. 2019, 119, 115611. 10.1016/j.trac.2019.07.022. [DOI] [Google Scholar]
- Resch-Genger U.; Grabolle M.; Cavaliere-Jaricot S.; Nitschke R.; Nann T. Quantum dots versus organic dyes as fluorescent labels. Nat. Methods 2008, 5, 763–775. 10.1038/nmeth.1248. [DOI] [PubMed] [Google Scholar]
- Xue J.; Wang X.; Jeong J. H.; Yan X. Fabrication, photoluminescence and applications of quantum dots embedded glass ceramics. Chem. Eng. J. 2020, 383, 123082. 10.1016/j.cej.2019.123082. [DOI] [Google Scholar]
- Kim C.; Hoffmann G.; Searson P. C. Integrated Magnetic Bead-Quantum Dot Immunoassay for Malaria Detection. ACS Sens. 2017, 2, 766–772. 10.1021/acssensors.7b00119. [DOI] [PubMed] [Google Scholar]
- Chu H.; Yao D.; Chen J.; Yu M.; Su L. Double-Emission Ratiometric Fluorescent Sensors Composed of Rare-Earth-Doped ZnS Quantum Dots for Hg 2+ Detection. ACS Omega 2020, 5, 9558–9565. 10.1021/acsomega.0c00861. [DOI] [PMC free article] [PubMed] [Google Scholar]
- Meng L.; Zeng T.; Jin Y.; Xu Q.; Wang X. Surface-Modified Substrates for Quantum Dot Inks in Printed Electronics. ACS Omega 2019, 4, 4161–4168. 10.1021/acsomega.9b00195. [DOI] [PMC free article] [PubMed] [Google Scholar]
- Shao Y.; Duan H.; Guo L.; Leng Y.; Lai W.; Xiong Y. Quantum dot nanobead-based multiplexed immunochromatographic assay for simultaneous detection of aflatoxin B1 and zearalenone. Anal. Chim. Acta 2018, 1025, 163–171. 10.1016/j.aca.2018.03.041. [DOI] [PubMed] [Google Scholar]
- Hu J.; Zhang Z.-L.; Wen C.-Y.; Tang M.; Wu L.-L.; Liu C.; Zhu L.; Pang D.-W. Sensitive and Quantitative Detection of C-Reaction Protein Based on Immunofluorescent Nanospheres Coupled with Lateral Flow Test Strip. Anal. Chem. 2016, 88, 6577–6584. 10.1021/acs.analchem.6b01427. [DOI] [PubMed] [Google Scholar]
- Hu J.; Jiang Y.-Z.; Wu L.-L.; Wu Z.; Bi Y.; Wong G.; Qiu X.; Chen J.; Pang D.-W.; Zhang Z.-L. Dual-signal readout nanospheres for rapid point-of-care detection of ebola virus glycoprotein. Anal. Chem. 2017, 89, 13105–13111. 10.1021/acs.analchem.7b02222. [DOI] [PubMed] [Google Scholar]
- Zhang Y.; Wu Q.; Sun M.; Zhang J.; Mo S.; Wang J.; Wei X.; Bai J. Magnetic-assisted aptamer-based fluorescent assay for allergen detection in food matrix. Sens. Actuators, B 2018, 263, 43–49. 10.1016/j.snb.2018.02.098. [DOI] [Google Scholar]
- Jiang M.; Chen C.; He J.; Zhang H.; Xu Z. Fluorescence assay for three organophosphorus pesticides in agricultural products based on Magnetic-Assisted fluorescence labeling aptamer probe. Food Chem. 2020, 307, 125534. 10.1016/j.foodchem.2019.125534. [DOI] [PubMed] [Google Scholar]
- Li L.; Yin D.; Xu K.; Liu Y.; Song D.; Wang J.; Zhao C.; Song X.; Li J. A sandwich immunoassay for brucellosis diagnosis based on immune magnetic beads and quantum dots. J. Pharm. Biomed. Anal. 2017, 141, 79–86. 10.1016/j.jpba.2017.03.002. [DOI] [PubMed] [Google Scholar]
- Xie H.; Dong J.; Duan J.; Hou J.; Ai S.; Li X. Magnetic nanoparticles-based immunoassay for aflatoxin B1 using porous g-C3N4 nanosheets as fluorescence probes. Sens. Actuators, B 2019, 278, 147–152. 10.1016/j.snb.2018.09.089. [DOI] [Google Scholar]
- Niazi S.; Wang X.; Pasha I.; Khan I. M.; Zhao S.; Shoaib M.; Wu S.; Wang Z. A novel bioassay based on aptamer-functionalized magnetic nanoparticle for the detection of zearalenone using time resolved-fluorescence NaYF4: Ce/Tb nanoparticles as signal probe. Talanta 2018, 186, 97–103. 10.1016/j.talanta.2018.04.013. [DOI] [PubMed] [Google Scholar]
- Zhang F.; Liu B.; Sheng W.; Zhang Y.; Liu Q.; Li S.; Wang S. Fluoroimmunoassays for the detection of zearalenone in maize using CdTe/CdS/ZnS quantum dots. Food Chem. 2018, 255, 421–428. 10.1016/j.foodchem.2018.02.060. [DOI] [PubMed] [Google Scholar]
- Sun Y.; Li Y.; Meng X.; Qiao B.; Hu P.; Meng X.; Lu S.; Ren H.; Liu Z.; Zhou Y. Fluorescence-linked immunosorbent assay for detection of phenanthrene and its homolog. Anal. Biochem. 2018, 547, 45–51. 10.1016/j.ab.2018.02.016. [DOI] [PubMed] [Google Scholar]
- Zhu L.; Cui X.; Wu J.; Wang Z.; Wang P.; Hou Y.; Yang M. Fluorescence immunoassay based on carbon dots as labels for the detection of human immunoglobulin G. Anal. Methods 2014, 6, 4430–4436. 10.1039/c4ay00717d. [DOI] [Google Scholar]
- Li R.; Liu Q.; Jin Y.; Li B. X. Fluorescent enzyme-linked immunoassay strategy based on enzyme-triggered in-situ synthesis of fluorescent copper nanoclusters. Sens. Actuators, B 2019, 281, 28–33. 10.1016/j.snb.2018.09.128. [DOI] [Google Scholar]
- Wu L.; Li X.; Shao K.; Ye S.; Liu C.; Zhang C.; Han H. Enhanced immunoassay for porcine circovirus type 2 antibody using enzyme-loaded and quantum dots-embedded shell-core silica nanospheres based on enzyme-linked immunosorbent assay. Anal. Chim. Acta 2015, 887, 192–200. 10.1016/j.aca.2015.06.024. [DOI] [PubMed] [Google Scholar]
- Song P.; Liu Q.; Zhang Y.; Liu W.; Meng M.; Yin Y.; Xi R. The chemical redox modulated switch-on fluorescence of carbon dots for probing alkaline phosphatase and its application in an immunoassay. RSC Adv. 2018, 8, 162–169. 10.1039/c7ra11784a. [DOI] [Google Scholar]
- Wang Z.; Han J.; Gao H.; Li C.; Fu Z. Protein functionalized titania particle as a nanocarrier in a multiple signal antibody amplification strategy for ultrasensitive chemiluminescent immunoassay. Talanta 2012, 88, 765–768. 10.1016/j.talanta.2011.12.003. [DOI] [PubMed] [Google Scholar]
- Qi Y.; Xiu F.-R.; Li B. One-step homogeneous non-stripping chemiluminescence metal immunoassay based on catalytic activity of gold nanoparticles. Anal. Biochem. 2014, 449, 1–8. 10.1016/j.ab.2013.12.007. [DOI] [PubMed] [Google Scholar]
- Li H.; Zhao M.; Liu W.; Chu W.; Guo Y. Polydimethylsiloxane microfluidic chemiluminescence immunodevice with the signal amplification strategy for sensitive detection of human immunoglobin G. Talanta 2016, 147, 430–436. 10.1016/j.talanta.2015.10.018. [DOI] [PubMed] [Google Scholar]
- Loynachan C. N.; Thomas M. R.; Gray E. R.; Richards D. A.; Kim J.; Miller B. S.; Brookes J. C.; Agarwal S.; Chudasama V.; McKendry R. A.; Stevens M. M. Platinum Nanocatalyst Amplification: Redefining the Gold Standard for Lateral Flow Immunoassays with Ultrabroad Dynamic Range. ACS Nano 2018, 12, 279–288. 10.1021/acsnano.7b06229. [DOI] [PMC free article] [PubMed] [Google Scholar]
- You M.; Lin M.; Gong Y.; Wang S.; Li A.; Ji L.; Zhao H.; Ling K.; Wen T.; Huang Y.; Gao D.; Ma Q.; Wang T.; Ma A.; Li X.; Xu F. Household Fluorescent Lateral Flow Strip Platform for Sensitive and Quantitative Prognosis of Heart Failure Using Dual-Color Upconversion Nanoparticles. ACS Nano 2017, 11, 6261–6270. 10.1021/acsnano.7b02466. [DOI] [PubMed] [Google Scholar]
- Wonderly B.; Jones S.; Gatton M. L.; Barber J.; Killip M.; Hudson C.; Carter L.; Brooks T.; Simpson A. J. H.; Semper A.; Urassa W.; Chua A.; Perkins M.; Boehme C. Comparative performance of four rapid Ebola antigen-detection lateral flow immunoassays during the 2014-2016 Ebola epidemic in West Africa. PLoS One 2019, 14, e0212113 10.1371/journal.pone.0212113. [DOI] [PMC free article] [PubMed] [Google Scholar]
- Li F.; You M.; Li S.; Hu J.; Liu C.; Gong Y.; Yang H.; Xu F.. Paper-based point-of-care immunoassays: Recent advances and emerging trends. Biotechnol. Adv. 2020, 39, dio: 10.1016/j.biotechadv.2019.107442. [DOI] [PubMed] [Google Scholar]
- Guo J.; Chen S. Q.; Guo J. H.; Ma X. Nanomaterial Labels in Lateral Flow Immunoassays for Point-of-Care-Testing. J. Mater. Sci. Technol. 2020, 60, 90–104. 10.1016/j.jmst.2020.06.003. [DOI] [Google Scholar]
- Kontou P. I.; Braliou G. G.; Dimou N. L.; Nikolopoulos G.; Bagos P. G.. Antibody Tests in Detecting SARS-CoV-2 Infection: A Meta-Analysis. Diagnostics 2020, 10, doi: 10.3390/diagnostics10050319. [DOI] [PMC free article] [PubMed] [Google Scholar]
Associated Data
This section collects any data citations, data availability statements, or supplementary materials included in this article.