Abstract
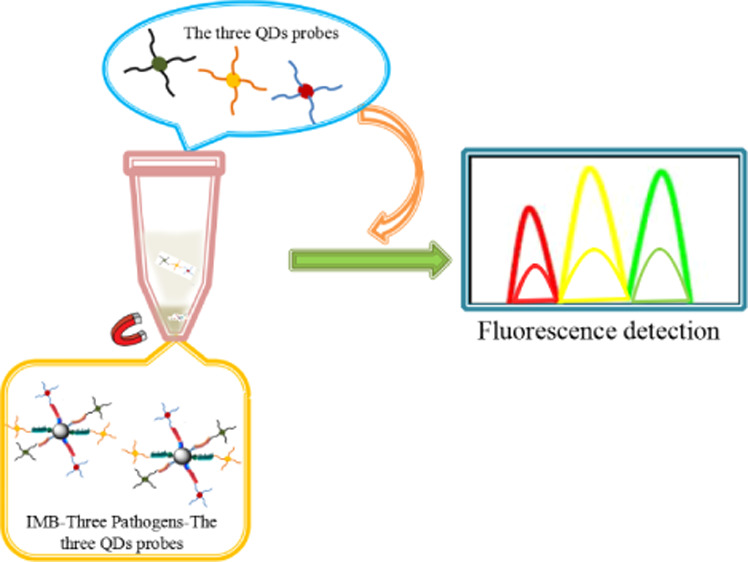
This paper presents a peptide-mediated immunomagnetic separation technique and an immunofluorescence quantum dot technique for simultaneous and rapid detection of Escherichia coliO157:H7, Staphylococcus aureus, and Vibrio parahaemolyticus. First, three peptides that can specifically recognize the three foodborne pathogens were combined with magnetic nanoparticles to form an immunomagnetic nanoparticle probe for capturing three kinds of target bacteria and then added three quantum dot probes (quantum dots-aptamer), which formed a sandwich composite structure. When the three quantum dot probes specifically combined with the three pathogenic bacteria, the remaining fluorescent signal in the supernatant will be reduced by magnetic separation. Therefore, the remaining fluorescent signal in the supernatant can be measured with a fluorescence spectrophotometer to indirectly determine the three pathogens in the sample. The linear range of the method was 10–107 cfu/mL, and in the buffer, the detection limits of E. coliO157:H7, S. aureus, and V. parahaemolyticus were 2.460, 5.407, and 3.770 cfu/mL, respectively. In the tap water simulation, the detection limits of E. coliO157:H7, S. aureus, and V. parahaemolyticus were 2.730, 1.990 × 101, and 4.480 cfu/mL, respectively. In the milk simulation sample, the detection limits of E. coliO157:H7, S. aureus, and V. parahaemolyticus were 6.660, 1.070 × 101, and 2.236 × 101 cfu/mL, respectively. The method we presented can detect three kinds of foodborne pathogens at the same time, and the entire experimental process did not exceed 4 h. It has high sensitivity and low detection limit and may be used in the sample detection of other pathogens.
1. Introduction
Escherichia coliO157:H7 is a major foodborne pathogen causing severe disease in humans worldwide, and it is one of the foodborne pathogens that primarily pollute food and water.1,2 The incubation period is 3–10 days, and the course of disease is 2–9 days. Some patients may develop hemolytic uremic syndrome,3 thrombotic thrombocytopenic purpura,4,5 and so forth and severe cases can lead to death.
Staphylococcus aureus is an opportunistic pathogen capable of causing a variety of diseases including osteomyelitis, endocarditis, infections of indwelling devices, and wound infections. Once it infected the food, it will grow rapidly and produce virulent proteases and other endotoxins, leading to severe food poisoning.6−8
Vibrio parahaemolyticusis a kind of foodborne pathogenic bacterium, which can seriously infect food, especially seafood causing gastroenteritis and other disease.9,10 It means that establishing rapid and sensitive detection methods for foodborne pathogens is imperative.11,12
Once food is contaminated by these three foodborne pathogens, it can easily lead to mass infections, acute symptoms of poisoning, and sometimes even difficult to control. At present, there are very few methods for the rapid and simultaneous detection of multiple foodborne pathogenic microorganisms. Therefore, it is necessary to study a highly efficient detection technique and method. The current research shows that the detection methods of foodborne pathogens include traditional separation and culture identification methods, molecular biological methods, and immunological detection methods. Traditional methods for the detection of bacterial pathogens from foods depend on culturing the organisms on agar plates; it is a time-consuming process, taking 2–3 days for initial results, and up to more than 1 week for confirming the specific pathogenic microorganisms.13,14 Molecular diagnostic methods include DNA analysis, for example, polymerase chain reaction (PCR),15,16 multiplex PCR,17,18 and multiplexed real-time PCR.19,20 However, these methods require sophisticated instrumentation, professional operation, and are relatively expensive. Enzyme-linked immunosorbent assay (ELISA)21−24 and lateral flow immunoassay are classified as immunological-based methods. In general, rapid detection methods are generally time-efficient, sensitive, specific, and labor-saving.25 However, the sensitivity of conventional ELISA is insufficient, and the single color generated by enzymatic reactions has difficulty to realize a simultaneous analysis of multiple pathogens.26 Therefore, rapid and sensitive detection of foodborne pathogenic bacteria has become more and more important to ensure food safety.27
Quantum dots (QDs) are nanoparticles which, because of their unique physical and chemical (first of all optical) properties, are promising in biology and medicine.28 More importantly, QDs can be excited efficiently at any wavelength shorter than the emission peak yet will emit the same narrow, symmetric characteristic spectrum regardless of the excitation wavelength. This unique property makes it possible to detect different emission peaks simultaneously when different sizes of QDs are excited with a single wavelength. QDs have been used as fluorescent labels for the multicolor imaging of tissues.29
Actually, water and food will be contaminated by one or more foodborne pathogens at the same time. Therefore, this paper proposed a method for simultaneous and rapid detection of three foodborne pathogens of E. coliO157:H7, S. aureus, and V. parahaemolyticus based on immunomagnetic nanoparticles and immunofluorescence QD probes. The advantage of this method is that it can detect three pathogens at the same time, and the detection time is shorter than the traditional culture method, so it may be used in practical applications.
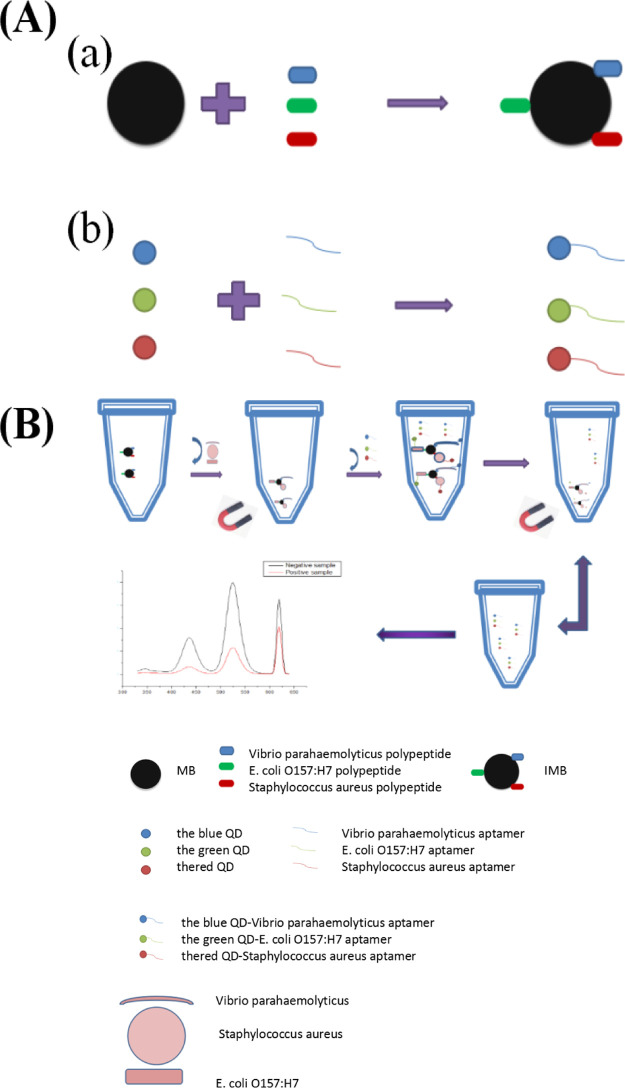
The detection principle of this method is shown in Figure 1. After the immunomagnetic nanoprobe captured three kinds of target bacteria, three immunofluorescence QD probes were added to form immunomagnetic beads [(IMBs), three foodborne pathogens; three kinds of fluorescent QD probes]. After magnetic separation, we used a fluorescence spectrophotometer to qualitatively and quantitatively detect three foodborne pathogens. After magnetic separation, we used a fluorescence spectrophotometer to detect the remaining fluorescence signal in the supernatant to qualitatively and quantitatively detect the three foodborne pathogens.
Figure 1.
Experimental principle [(A): (a): IMBs; (b): preparation of immunofluorescence QD probe; (B): the entire experimental detection step].
2. Results and Discussion
2.1. Characterization of MBs and Immunomagnetic Nanoparticles
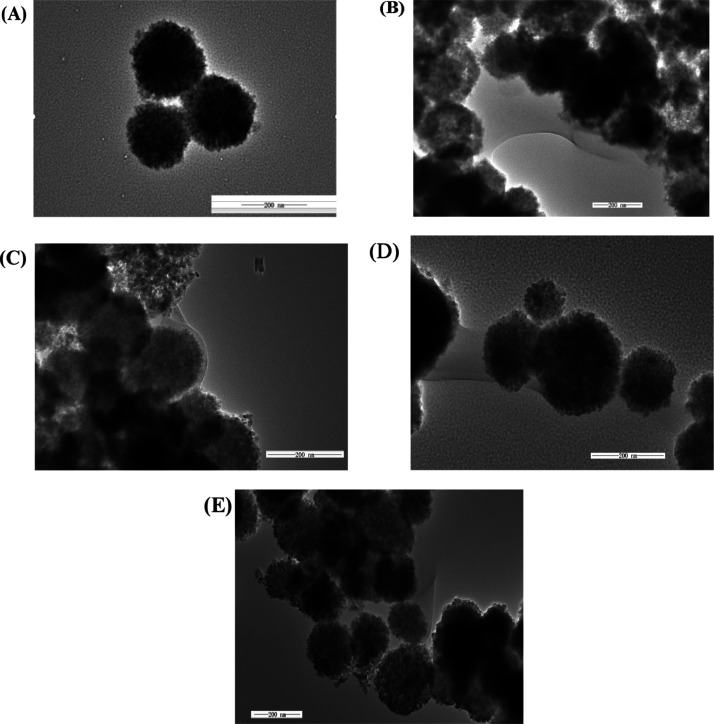
Magnetic nanoparticle (MB) and immunomagnetic nanoparticle probe were characterized by transmission electron microscopy (TEM), and Figure 2 shows a TEM image at the same magnification. Figure 2A shows a TEM image of MBs, and the average particle diameter was about 182 ± 31 nm, which indicated that the MBs have uniform particle size and great dispersibility. Figure 2B shows a TEM image of MBs linked to three polypeptides having an average particle diameter of about 241 ± 19 nm, which was larger than the MBs, indicating that the magnetic beads are successfully linked to the polypeptide. Figure 2C–E shows TEM images of MBs coated with E. coliO157:H7, S. aureus, and V.parahaemolyticus polypeptide, and the average particle diameters were 223 ± 10, 233.17 ± 17, and 236 ± 29 nm, respectively, and the particle diameters were slightly larger than the MBs, and the surface of the immunomagnetic nanoparticles had a cloud-like film. These results indicated that the biotin peptide has been successfully modified to the surface of the MBs.
Figure 2.
TEM images of MBs and IMBs [(A) MB; (B) MB-three polypeptides; (C) MB-E. coliO157:H7 polypeptide; (D) MB-S. aureus polypeptide; and (E) MB-V. parahaemolyticus polypeptide].
Figure 3 and Table 1 show the zeta potential of MBs and immunomagnetic nanoparticles. After the MBs were coated with the polypeptide, they showed a tendency to move toward a positive potential because of the interaction of streptavidin and biotin. The result was that the streptavidin-modified MBs are successfully linked to the biological polypeptide.
Figure 3.
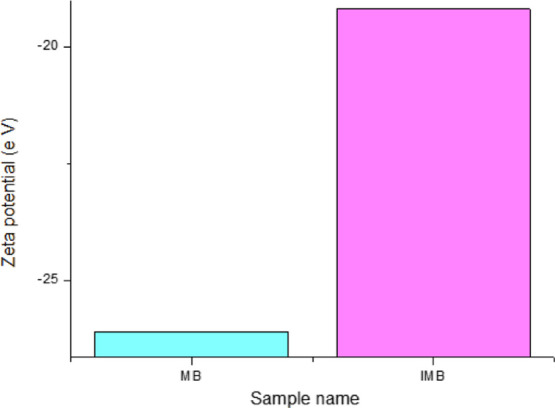
Zeta potential of MB and IMB.
Table 1. Zeta Potential of MB and IMB.
| sample name | zeta potential (eV) |
|---|---|
| MB | –26.1 |
| IMB | –19.2 |
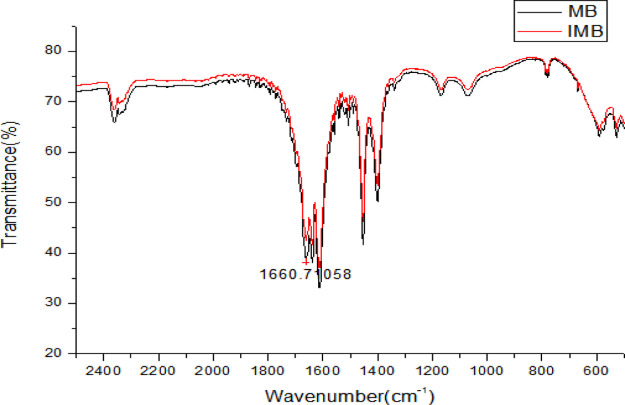
Figure 4 was an Fourier-transform infrared spectroscopy (FTIR) spectrum before and after the MB-linked polypeptide. As can be seen from the figure, when the MBs were attached to the polypeptide, there was a characteristic absorption peak at about 1660 cm–1. It was also caused by the interaction between biotin and streptavidin, and it was also confirmed that the polypeptide was successfully modified onto the MBs.
Figure 4.
FTIR spectra characterization of MNPs and MNP probes.
2.2. Characterization of Three QDs and Three Immunofluorescent QDs
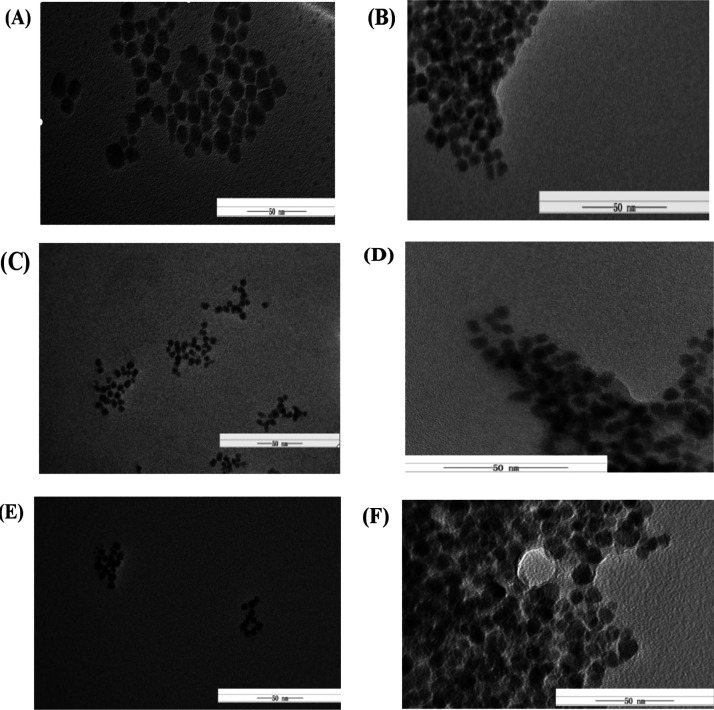
Figure 5A,C,E shows TEM images of QDs of green, red, and blue. It can be observed that the shape of the nanoparticles in the image is spherical, the particle size was uniform, the dispersion was excellent, and the average diameters were 10.05 ± 1.54, 8.64 ± 0.74, and 8.13 ± 0.64 nm. Figure 5B,D,F shows the TEM images of three QD probes formed by adding three kinds of fluorescent QDs to three kinds of target bacteria aptamers. Also, the average particle diameters were 17.12 ± 3.05, 14.24 ± 2.19, and 14.25 ± 0.63 nm. It is obvious that the average particle size was slightly larger than that of three kinds of QDs, and the three QD surfaces had a thin layer of lighter color film, so the inoculum aptamers were successfully linked to three QDs.
Figure 5.
TEM images of the three kinds of QDs and three kinds of QD fluorescence biological probes [(A) the green QD; (B) the green QD-E. coliO157:H7 apt; (C) the red QD; (D) the red QD-S. aureus apt; (E) the blue QD; and (F) the blue QD-V. parahaemolyticus apt].
Figure 6 and Table 2 show the zeta potentials of three QDs and three QD probes. It can be shown that the QDs move toward the positive potential after the aptamers are connected. The carboxyl group on the carboxy group reacts with the amino group on the aptamer, resulted in a large number of carboxyl groups on the QD being substituted to exhibit a tendency to change toward a positive potential, and it indicated that the surface of the QD was successfully attached to the aptamer.
Figure 6.
Zeta potential of three fluorescent QDs and three immunofluorescent QD probes [(A) the green QD and the green QD-apt; (B) the red QD and the red QD-apt; and (C) the blue QD and the blue QD-apt].
Table 2. Zeta Potential of the Three Kinds of QDs and Three Kinds of QD Fluorescence Biological Probes.
| sample name | zeta potential (eV) |
|---|---|
| the green QD | –26.7 |
| the green <keep-together>QD-E. coli</keep-together> O157:H7 aptamer | –11.4 |
| the red QD | –26.7 |
| the red <keep-together>QD-S. aureus</keep-together> aptamer | –16.4 |
| the blue QD | –21.6 |
| the blue <keep-together>QD-V. parahaemolyticus</keep-together> aptamer | –12.5 |
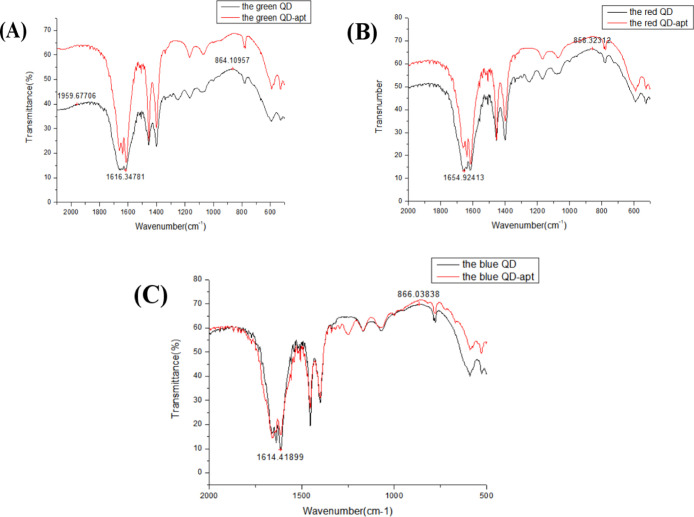
Figure 7A–C displays the FTIR spectrum of three QDs and three immunofluorescent QD probes. It can be presented that after adding the aptamers to the QDs, the characteristic absorption peaks were approximately 1616.35, 1654.92, and 1614.42 cm–1. The characteristic absorption band of (−NH–CO−) further demonstrated that the aptamer was successfully coupled to the QDs.
Figure 7.
FTIR spectra characterization of three kinds of QD fluorescence biological probes [(A) FTIR spectra of green fluorescent QD biological probes before and after coupling with E. coliO157:H7-aptamer; (B) FTIR spectra of red fluorescent QD biological probes before and after coupling with S. aureus-aptamer; and (C) FTIR spectra of blue fluorescent QD biological probes before and after coupling with V. parahaemolyticus-aptamer].
2.3. Sensitivity Experiment
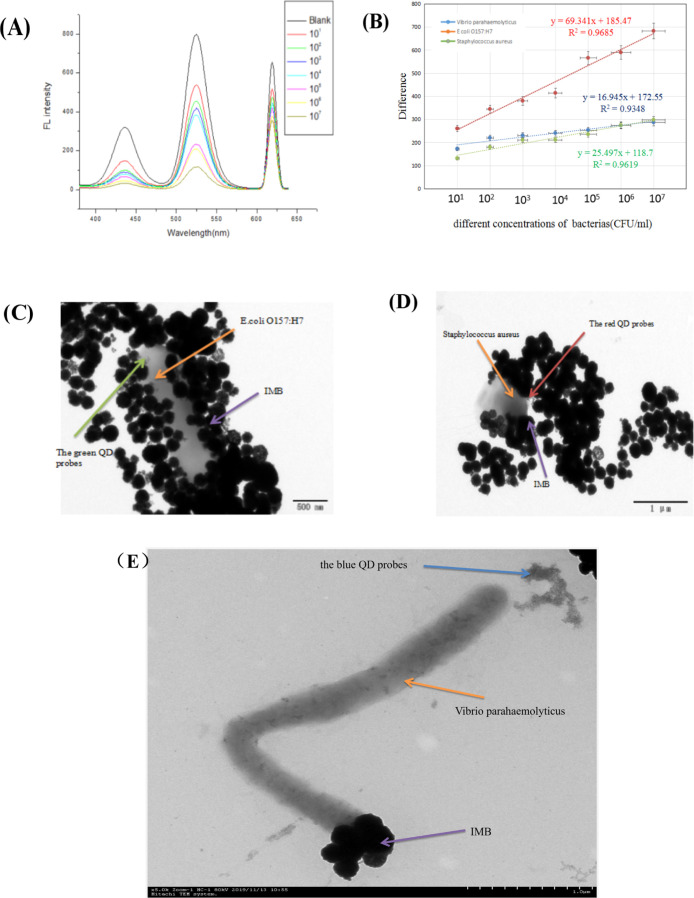
After optimizing the reaction conditions, the three kinds of target bacteria suspensions were sequentially diluted with buffer from 107 to 106, 105, 104, 103, 102, and 101 cfu/mL, and the fluorescent signal in the supernatant was measured. From Figure 8A,B, as the concentration of the three bacterial suspensions increases, the difference between the fluorescent signal of the negative sample and the positive sample also increases. The concentration of the three bacterial suspensions ranges from 101 to 107 cfu/mL. A better linear relationship and the regression equations of E. coliO157:H7, S. aureus, and V. parahaemolyticus were y = 69.341x + 185.47, y = 25.497x + 118.7, and y = 59.327x – 67.678 (I310nm/430,520 and 620nm), and R2 is 0.97, 0.96, and 0.93, respectively. According to the formula 3SF0/a (SF0: standard deviation of triple blank fluorescence value, a: slope of the standard curve), the detection limits of E. coliO157:H7, S. aureus, and V. parahaemolyticus were calculated to be 2.460, 5.410, and 3.770 cfu/mL, respectively. We then characterized the experimental composite structure with a transmission electron microscope. Because of the limitation of the field of view, Figure 10C–E shows TEM images under the enlarged lens of the composite structure of IMBs (the three kinds of bacteria; three kinds of QD probes). It can be observed that a composite structure of IMB–bacteria–the QD probes was formed, which further confirmed the principle feasibility.
Figure 8.
Sensitivity experiment [(A) fluorescence spectra of different concentrations of bacteria; (B) standard curve of the difference of negative fluorescence to positive fluorescence buffer solution; (C) TEM images of IMB-E. coliO157:H7-the green QD probes; (D) TEM images of IMB-S. aureus-the red QD probes; and (E) TEM images of IMB-V. parahaemolyticus-the blue QD probes].
Figure 10.
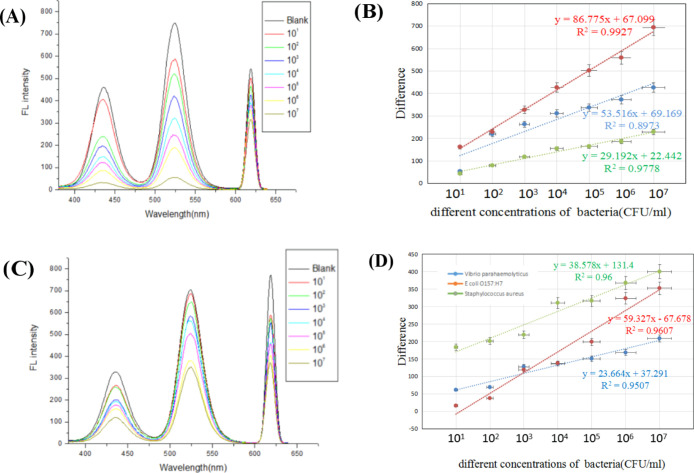
Simulated sample experiment [(A,C) fluorescence spectra of different concentrations of bacteria in the tap water sample and in the milk sample; (B,D) standard curve of the difference of negative fluorescence to positive fluorescence in the tap water sample and in the milk sample].
2.4. Specificity Experiment
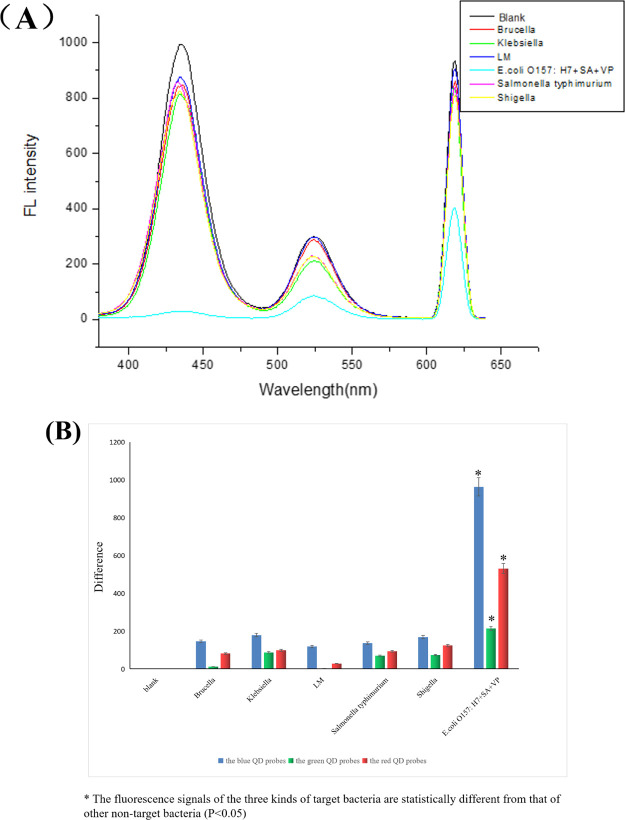
In order to verify the specificity of the experimental system, we selected Brucella, Klebsiella, Listeria monocytogenes, Salmonella, and Shigella Castellani as negative controls and buffers for the blank control, as shown in Figure 9A,B. In our detection process, the concentration of three kinds of target bacteria was 105 cfu/mL (the concentration of each kind of target bacteria in the detection system was 105 cfu/mL), and the concentration of five nontarget bacteria is 106 cfu/mL, which was 10 times higher than the three kinds of target bacteria. The fluorescence signal of the blank control and five other nontarget bacteria was significantly different from the three kinds of target bacteria, which indicated that the experimental system was highly specific.
Figure 9.
Specificity experiment [(A) fluorescence spectra of different concentrations of different bacteria; (B) line chart of the difference of negative fluorescence to positive fluorescence].
2.5. Simulated Sample Experiment
In order to investigate the potential application value of this method in actual samples, we used the tap water and milk to serially dilute the three target bacteria suspensions from 107 to 106, 105, 104, 103, 102, and 101 cfu/mL and then finished the experimental system for detection. In Figure 10A,B, it can be found that in the tap water simulation sample, the fluorescence signal of the positive sample gradually decreased as the concentration of the three kinds of suspension increased, and the difference between the fluorescent signal of the negative sample and the positive sample increased gradually. The regression equations for E. coliO157:H7, S. aureus, and V. parahaemolyticus were y = 86.775x + 67.099, y = 53.516x + 69.169, and y = 29.192x + 22.442 (I310nm/430,520 and 620nm), and R2 were approximately 0.99, 0.90, and 0.98, respectively. According to the formula 3SF0/a (SF0: standard deviation of triple blank fluorescence value, a: slope of the standard curve), the detection limits of E. coliO157:H7, S. aureus, and V. parahaemolyticus were calculated to be 2.730, 1.990 × 101, and 4.480 cfu/mL, respectively.
It can also be observed, as shown in Figure 10C,D, that in the milk-simulating sample, as the concentration of the three kinds of bacterial suspensions increased, the fluorescent signal of the positive sample was also gradually decreased, while the difference between the fluorescent signals of the negative sample and the positive sample was also gradually increased. The regression equations for E. coliO157:H7, S. aureus, and V. parahaemolyticus were y = 38.578x + 131.4, y = 59.327x – 67.678, and y = 23.664x + 37.291 (I310nm/430,520 and 620nm), and R2 were about 0.96, 0.96, and 0.95, respectively. According to the formula 3SF0/a (SF0: standard deviation of triple blank fluorescence value, a: slope of the standard curve), the detection limits of E. coliO157:H7, S. aureus, and V. parahaemolyticus were calculated to be 6.660, 1.070 × 101, and 2.236 × 101 cfu/mL, respectively. There may be some impurities in the tap water, which may affect the detection effect, so the detection limit was slightly higher than that in the buffer. Also, the milk-simulating sample was slightly higher than the detection limit in the buffer, which may be affected by a complex variety of matrices in the simulated sample. However, this method still had a lower detection limit and a wider linear range, indicating that the method can be used for the detection of three target bacteria in actual samples.
3. Conclusions
In summary, we have developed a method for simultaneous rapid detection of three foodborne pathogens using immunofluorescent QD probes and immunomagnetic nanoprobes. Most of the current research studies use antibodies to detect foodborne pathogens, but because the preparation process is more complicated and difficult to extract, this article can sensitively detect three foodborne pathogens at the same time without antibodies. The detection time of this research is shorter than that of traditional detection methods, and the method has high sensitivity, good specificity, and low detection limit. Therefore, the method provides a possibility for synchronous detection of other foodborne pathogens.
4. Materials and Methods
4.1. Material and Experimental Principle
Antichain avidin-modified magnetic beads were purchased from Sangon Biotechnology Co. Ltd. (Shanghai, China), and three kinds of CdSe/ZnS QDs (330/430, 520, and 620 nm in the excitation/emission wavelength measured) were purchased from purple Star New Material Technology Development Co. Ltd. (Shanghai, China). Three kinds of peptide (E. coliO157:H7 peptide sequence: biotin-SLLTPVP; S. aureus peptide sequence: biotin-RALLRTC; V. parahaemolyticus aptamer sequence: biotin-MPRLPPA) were purchased from Sangon Biotechnology Co. Ltd. (Shanghai, China). Three kinds of aptamers (E. coliO157:H7 aptamer sequence: 5′-NH2-tgagcccaagccctggtatgcggataacgaggtattcacgactggtcgtcaggtatggttggcaggtctactttgggatc; S. aureus aptamer sequence: 5′-NH2-tccctacggcgctaacccccccagtccgtcctcccagcctcacacagccaccgtgctacaac; V. parahaemolyticus aptamer sequence: 5′-NH2- ataggagtcacgacgaccagaatctaaaaatgggcaaagaaacagtgactcgttgagatacttatgtgctctacctcttgactaat) were purchased from Sangon Biotechnology Co. Ltd. (Shanghai, China). Skim milk powder was purchased from Yili Industrial Group Co., Ltd. (China Inner Mongolia). We prepared buffers for TBS (10 mM, pH = 7.2) and TBST (containing 150 mM NaCl and 0.05% Tween 20).
4.2. Synthesis of Immunomagnetic Nanoparticles (IMB)
First, 50 μL of MB (50 mg/mL) was added to a 1.5 mL centrifuge tube, and after washing three times with TBST buffer, 100 μL each of three kinds of bacterial polypeptides (0.35 mg/mL) was added (the capacity for adding three peptides is 1:1:1), and 1 mL was supplemented with 700 μL of TBST buffer, and incubated for 1 h. Then, washed three times with TBST, and then blocked the unbound site on the magnetic beads with 1 mL of 3% skim milk powder (according to the research, the nonspecific binding rate of skimmed milk powder was lower than that of biotin,30 so skim milk powder was chosen as the blocking agent here) and then magnetically separated, washed three times with TBST buffer, resuspended in 1 mL of TBST buffer, and placed IMB in 4 °C, which was reserved for use. The final concentration was 2.5 mg/mL.
4.3. Preparation of Three Immunofluorescent QD Probes (the Three QD-apts)
Mixed two coupling agents 500 μL of NHS (10 mg/mL) with 500 μL EDC (10 mg/mL) and three 1.5 mL centrifuge tubes and then added 20 μL of blue, green, and red QDs (10 mg/mL) to each of the three centrifuge tubes. Incubated for 30 min, then added 5 μL of V. parahaemolyticus aptamer (10 μM), E. coliO157:H7 aptamer (10 μM), and S. aureus aptamer (10 μM), incubated in the dark for 18 h, then centrifuged using ultra-low temperature centrifugation two times to remove the unbound complex, and finally resuspended in 1 mL of TBST buffer, and three immunoblot probes were obtained and stored at 4 °C until use. The final concentration was 0.02 mg/mL.
4.4. Simultaneous Detection of E. coliO157:H7, S. aureus, and V. parahaemolyticus
In the optimization process and specific detection in the entire experimental system, we selected three kinds of target bacteria with a concentration of 105 cfu/mL (the concentration of each kind of target bacteria is 105 cfu/mL). As shown in Figure 1, it was a flow chart for detecting three kinds of bacteria. The process of preparing IMBs and immunofluorescence QD probe has been described in detail above, and then, 100 μL of IMB is added to a centrifuge tube, followed by adding three target bacteria, and then spinning after incubating for 50 min, and the magnetic separation was washed three times with buffer, and 40 μL of three immunofluorescent QD probes was added, and after 45 min in the dark, the fluorescence signal in the supernatant was determined by magnetic separation. The negative control was replaced with three buffers to be tested. Because there may be Fe(3+) in the magnetic beads and Fe(3+) can tightly chelate to the surface of CQDs by the hydroxyl group to form Fe(3+)-functionalized CQDs while the fluorescence of CQDs can be effectively quenched by Fe(3+) via fluorescence resonance energy transfer,31 and we chose to detect the fluorescence signal in the supernatant in this study. In this experiment, the difference between the fluorescence signal in the supernatant in the negative control and the fluorescence signal in the supernatant in the positive sample was quantified, and a standard curve was drawn.
Acknowledgments
All the authors acknowledge the Jilin University for sharing instrumentation facility, and School of Public Health, Jilin University for providing bacteria. This work was financially supported by the Development of Science and Technology, Jilin Province, China (grant number: 2018010195JC), the Jilin Province Development and Reform Commission (the grant number: 2020C038-7), National Natural Science Foundation of China (grant number: 81401721), the Education Department of Jilin Province, China (grant number: JJKH20180239KJ), and the Health and Family Planning Commission of Jilin Province (grant number: 2017J074).
Supporting Information Available
The Supporting Information is available free of charge at https://pubs.acs.org/doi/10.1021/acsomega.0c02833.
Optimization of the concentration and incubation time of nanoprobes, optimization of the amount of immunomagnetic nanoprobe and the reaction time, and optimization of the amount and reaction time of the immunofluorescence QD probe (PDF)
Author Contributions
D.W., C.Z., and K.X. conceived and designed the study. D.W., F.N.L., Y.L., S.Y., L.R.G., and Y.W. performed the assay of experimental detection. Y.Y.Z. and J.P.W. analyzed the data. D.W. drafted the manuscript. C.Z. and X.L.S. provided constructive opinions and suggestions. K.X., C.Z., X.L.S., and J.P.W. reviewed and made improvements in the manuscript. All the authors read and approved the final version of the paper.
The authors declare no competing financial interest.
Supplementary Material
References
- Lim J. Y.; Yoon J.; Hovde C. J. A brief overview of Escherichia coli O157:H7 and its plasmid O157. J. Microbiol. Biotechnol. 2010, 20, 5–14. 10.4014/jmb.0908.08007. [DOI] [PMC free article] [PubMed] [Google Scholar]
- Saad S. M.; Abdullah J.; Rashid S. A.; Fen Y. W.; Salam F.; Yih L. H. A fluorescence quenching based gene assay for Escherichia coli O157:H7 using graphene quantum dots and gold nanoparticles. Microchim. Acta 2019, 186, 804. 10.1007/s00604-019-3913-8. [DOI] [PubMed] [Google Scholar]
- Jokiranta T. S. HUS and atypical HUS. Blood 2017, 129, 2847–2856. 10.1182/blood-2016-11-709865. [DOI] [PMC free article] [PubMed] [Google Scholar]
- Conlon B. P. Staphylococcus aureus chronic and relapsing infections: Evidence of a role for persister cells: An investigation of persister cells, their formation and their role in S.aureus disease. Bioessays 2014, 36, 991–996. 10.1002/bies.201400080. [DOI] [PubMed] [Google Scholar]
- Krogh A. S. v.; Waage A.; Quist-Paulsen P. Congenital thrombotic thrombocytopenic purpura. Kongenital trombotisk trombocytopenisk purpura. Tidsskr. Nor. Laegeforen. 2016, 136, 1452–1457. 10.4045/tidsskr.15.1272. [DOI] [PubMed] [Google Scholar]
- Qing T.; Long C.; Wang X.; Zhang K.; Zhang P.; Feng B. Detection of micrococcal nuclease for identifying Staphylococcus aureus based on DNA templated fluorescent copper nanoclusters. Microchim. Acta 2019, 186, 248. 10.1007/s00604-019-3363-3. [DOI] [PubMed] [Google Scholar]
- Becker K.; Keller B.; von Eiff C.; Brück M.; Lubritz G.; Etienne J.; Peters G. Enterotoxigenic potential of Staphylococcus intermedius. Appl. Environ. Microbiol. 2001, 67, 5551–5557. 10.1128/aem.67.12.5551-5557.2001. [DOI] [PMC free article] [PubMed] [Google Scholar]
- Nemati M.; Hermans K.; Lipinska U.; Denis O.; Deplano A.; Struelens M.; Devriese L. A.; Pasmans F.; Haesebrouck F. Antimicrobial resistance of old and recent Staphylococcus aureus isolates from poultry: first detection of livestock-associated methicillin-resistant strain ST398. Antimicrob. Agents Chemother. 2008, 52, 3817–3819. 10.1128/AAC.00613-08. [DOI] [PMC free article] [PubMed] [Google Scholar]
- Tang J.; Jia J.; Chen Y.; Huang X.; Zhang X.; Zhao L.; Hu W.; Wang C.; Lin C.; Wu Z. Proteomic Analysis of Vibrio parahaemolyticus Under Cold Stress. Curr. Microbiol. 2018, 75, 20–26. 10.1007/s00284-017-1345-4. [DOI] [PubMed] [Google Scholar]
- Elmahdi S.; DaSilva L. V.; Parveen S. Antibiotic resistance of Vibrio parahaemolyticus and Vibrio vulnificus in various countries: A review. Food Microbiol. 2016, 57, 128–134. 10.1016/j.fm.2016.02.008. [DOI] [PubMed] [Google Scholar]
- Allard M. W.; Bell R.; Ferreira C. M.; Gonzalez-Escalona N.; Hoffmann M.; Muruvanda T.; Ottesen A.; Ramachandran P.; Reed E.; Stevens S. E.; et al. Genomics of foodborne pathogens for microbial food safety. Curr. Opin. Biotechnol. 2018, 49, 224–229. 10.1016/j.copbio.2017.11.002. [DOI] [PubMed] [Google Scholar]
- Wu S.; Duan N.; Shen M.; Wang J.; Wang Z. Surface-enhanced Raman spectroscopic single step detection of Vibrio parahaemolyticus using gold coated polydimethylsiloxane as the active substrate and aptamer modified gold nanoparticles. Microchim. Acta 2019, 186, 401. 10.1007/s00604-019-3499-1. [DOI] [PubMed] [Google Scholar]
- Zhao X.; Lin C.-W.; Wang J.; Oh D. H. Advances in rapid detection methods for foodborne pathogens. J. Microbiol. Biotechnol. 2014, 24, 297–312. 10.4014/jmb.1310.10013. [DOI] [PubMed] [Google Scholar]
- Traore S. I.; Khelaifia S.; Armstrong N.; Lagier J. C.; Raoult D. Isolation and culture of Methanobrevibacter smithii by co-culture with hydrogen-producing bacteria on agar plates. Clin. Microbiol. Infect. 2019, 25, 1561.e1–1561.e5. 10.1016/j.cmi.2019.04.008. [DOI] [PubMed] [Google Scholar]
- Xu D.; Ji L.; Wu X.; Yan W.; Chen L. Detection and differentiation of Vibrio parahaemolyticus by multiplexed real-time PCR. Can. J. Microbiol. 2018, 64, 809–815. 10.1139/cjm-2018-0083. [DOI] [PubMed] [Google Scholar]
- Takabatake R.; Masubuchi T.; Futo S.; Minegishi Y.; Noguchi A.; Kondo K.; Teshima R.; Kurashima T.; Mano J.; Kitta K. Development and validation of an event-specific quantitative PCR method for genetically modified maize MIR162. Shokuhin Eiseigaku Zasshi 2014, 55, 205–209. 10.3358/shokueishi.55.205. [DOI] [PubMed] [Google Scholar]
- Zhong L.-L.; Zhou Q.; Tan C.-Y.; Roberts A. P.; El-Sayed Ahmed M. A. E.-G.; Chen G.; Dai M.; Fan Y.; Xia Y.; et al. Multiplex loop-mediated isothermal amplification (multi-LAMP) assay for rapid detection of mcr-1 to mcr-5 in colistin-resistant bacteria. Infect. Drug Resist. 2019, 12, 1877–1887. 10.2147/IDR.S210226. [DOI] [PMC free article] [PubMed] [Google Scholar]
- Albuquerque R. C.; Moreno A. C. R.; Dos Santos S. R.; Ragazzi S. L. B.; Martinez M. B. Multiplex-PCR for diagnosis of bacterial meningitis. Braz. J. Microbiol. 2019, 50, 435–443. 10.1007/s42770-019-00055-9. [DOI] [PMC free article] [PubMed] [Google Scholar]
- Chiang Y.-C.; Tsen H.-Y.; Tsen H.-Y.; Chen H.-Y.; Chang Y.-H.; Lin C.-K.; Chen C.-Y. Multiplex PCR and a chromogenic DNA macroarray for the detection of Listeria monocytogens, Staphylococcus aureus, Streptococcus agalactiae, Enterobacter sakazakii, Escherichia coli O157:H7, Vibrio parahaemolyticus, Salmonella spp. and Pseudomonas fluorescens in milk and meat samples. J. Microbiol. Methods 2012, 88, 110–116. 10.1016/j.mimet.2011.10.021. [DOI] [PubMed] [Google Scholar]
- Loy J. D.; Leger L.; Workman A. M.; Clawson M. L.; Bulut E.; Wang B. Development of a multiplex real-time PCR assay using two thermocycling platforms for detection of major bacterial pathogens associated with bovine respiratory disease complex from clinical samples. J. Vet. Diagn. Invest. 2018, 30, 837–847. 10.1177/1040638718800170. [DOI] [PMC free article] [PubMed] [Google Scholar]
- Ma Z.; Yang X.; Fang Y.; Tong Z.; Lin H.; Fan H. Detection of Salmonella Infection in Chickens by an Indirect Enzyme-Linked Immunosorbent Assay Based on Presence of PagC Antibodies in Sera. Foodborne Pathog. Dis. 2018, 15, 109–113. 10.1089/fpd.2017.2322. [DOI] [PubMed] [Google Scholar]
- Mirhosseini S. A.; Fooladi A. A. I.; Amani J.; Sedighian H. Production of recombinant flagellin to develop ELISA-based detection of Salmonella Enteritidis. Braz. J. Microbiol. 2017, 48, 774–781. 10.1016/j.bjm.2016.04.033. [DOI] [PMC free article] [PubMed] [Google Scholar]
- van Zijderveld F. G.; van Zijderveld-van Bemmel A. M.; Anakotta J. Comparison of four different enzyme-linked immunosorbent assays for serological diagnosis of Salmonella enteritidis infections in experimentally infected chickens. J. Clin. Microbiol. 1992, 30, 2560–2566. 10.1128/JCM.30.10.2560-2566.1992. [DOI] [PMC free article] [PubMed] [Google Scholar]
- Parma Y. R.; Chacana P. A.; Lucchesi P. M. A.; Rogé A.; Granobles Velandia C. V.; Krüger A.; Parma A. E.; Fernández-Miyakawa M. E. Detection of Shiga toxin-producing Escherichia coli by sandwich enzyme-linked immunosorbent assay using chicken egg yolk IgY antibodies. Front. Cell. Infect. Microbiol. 2012, 2, 84. 10.3389/fcimb.2012.00084. [DOI] [PMC free article] [PubMed] [Google Scholar]
- Srinoulprasert Y.; Kantaviro W.; Nokdhes Y.-N.; et al. Development of inhibition ELISA to detect antibody-induced failure of botulinum toxin a therapy in cosmetic indications. J. Immunol. Methods 2019, 473, 112635. 10.1016/j.jim.2019.112635. [DOI] [PubMed] [Google Scholar]
- Lv X.; Huang Y.; Liu D.; et al. Multicolor and Ultrasensitive Enzyme-Linked Immunosorbent Assay Based on the Fluorescence Hybrid Chain Reaction for Simultaneous Detection of Pathogens. J. Agric. Food Chem. 2019, 67, 9390–9398. 10.1021/acs.jafc.9b03414. [DOI] [PubMed] [Google Scholar]
- Cai G.; Zheng L.; Liao M.; Li Y.; Wang M.; Liu N.; Lin J. A microfluidic immunosensor for visual detection of foodborne bacteria using immunomagnetic separation, enzymatic catalysis and distance indication. Microchim. Acta 2019, 186, 757. 10.1007/s00604-019-3883-x. [DOI] [PubMed] [Google Scholar]
- Pleskova S.; Mikheeva E.; Gornostaeva E. Using of Quantum Dots in Biology and Medicine. Adv. Exp. Med. Biol. 2018, 1048, 323–334. 10.1007/978-3-319-72041-8_19. [DOI] [PubMed] [Google Scholar]
- Zhao Y.; Ye M.; Chao Q.; Jia N.; Ge Y.; Shen H. Simultaneous detection of multifood-borne pathogenic bacteria based on functionalized quantum dots coupled with immunomagnetic separation in food samples. J. Agric. Food Chem. 2009, 57, 517–524. 10.1021/jf802817y. [DOI] [PubMed] [Google Scholar]
- Li X.; Zhao C.; Liu Y.; Li Y.; Lian F.; Wang D.; Zhang Y.; Wang J.; Song X.; Li J.; et al. Fluorescence signal amplification assay for the detection of B. melitensis 16M, based on peptide-mediated magnetic separation technology and a AuNP-mediated bio-barcode assembled by quantum dot technology. Analyst 2019, 144, 2704–2715. 10.1039/c9an00028c. [DOI] [PubMed] [Google Scholar]
- Li L.; Wang C.; Luo J.; Guo Q.; Liu K.; Liu K.; Zhao W.; Lin Y. Fe(3+)-functionalized carbon quantum dots: A facile preparation strategy and detection for ascorbic acid in rat brain microdialysates. Talanta 2015, 144, 1301–1307. 10.1016/j.talanta.2015.08.003. [DOI] [PubMed] [Google Scholar]
Associated Data
This section collects any data citations, data availability statements, or supplementary materials included in this article.


