

Summary
A feared adverse effect of dyslipidaemia therapy by fibrates is myopathy. We examined the effect of fenofibrate (FF) on protein and amino acid metabolism. Rats received a low (50 mg/kg, LFFD) or high (300 mg/kg, HFFD) dose of FF or vehicle daily by oral gavage. Blood plasma, liver, and soleus and extensor digitorum longus muscles were analysed after 10 days. The FF‐treated rats developed hepatomegaly associated with increased hepatic carnitine and ATP and AMP concentrations, decreased protein breakdown, and decreased concentrations of DNA and triglycerides. HFFD increased plasma ALT and AST activities. The weight and protein content of muscles in the HFFD group were lower compared with controls. In muscles of the LFFD group there were increased ATP and decreased AMP concentrations; in the HFFD group AMP was increased. In both FF‐treated groups there were increased glycine, phenylalanine, and citrulline and decreased arginine and branched‐chain keto acids (BCKA) in blood plasma. After HFFD there were decreased levels of branched‐chain amino acids (BCAA; valine, leucine and isoleucine), methionine, and lysine and increased homocysteine. Decreased arginine and increased glycine concentrations were found in both muscles in FF‐treated animals; in HFFD‐treated animals lysine, methionine, and BCAA were decreased. We conclude that FF exerts protein‐anabolic effects on the liver and catabolic effects on muscles. HFFD causes signs of hepatotoxicity, impairs energy and protein balance in muscles, and decreases BCAA, methionine, and lysine. It is suggested that increased glycine and decreased lysine and methionine levels are due to activated carnitine synthesis; decreased BCAA and BCKA levels are due to increased BCAA oxidation.
Keywords: branched‐chain amino acids, carnitine, fibrates, hepatomegaly, methionine
1. INTRODUCTION
Fenofibrate (FF) is a drug of the fibrate class used widely to treat dyslipidaemia. Fibrates reduce cholesterol and triglyceride levels and thus decrease risk for cardiovascular diseases. The mechanism of fibrate action is known to be mediated by activation of peroxisome proliferator–activated receptor alpha (PPARα), a transcriptional factor that is abundantly expressed in the liver. Upon agonist binding, PPARα stimulates expression of various genes involved in fatty acid oxidation and metabolism of lipoproteins. The well‐known pharmacological effects are activated carnitine synthesis, peroxisome proliferation, and accelerated β‐oxidation. Fibrates exert pleiotropic effects, and beyond lowering blood lipids affect microcirculation, oxidative stress, and triglyceride content in the liver. 1 , 2 , 3 It is supposed that their use may have benefits in adults with inflammatory disorders, and in the elderly, and improve liver function tests in patients with hepatic steatosis, in addition to patients with clinical dyslipidaemia. 2 , 3
In general, fibrates are well tolerated, and side effects are rare. 4 The most feared adverse effect of the clinical use of fibrates is myopathy, evidenced by muscle weakness and/or pain and increased serum levels of creatine phosphokinase. Histological examinations show scattered muscle fibre necrosis. Withdrawal of the drug is usually followed by rapid improvement of the symptoms; therefore, severe cases of life‐threatening rhabdomyolysis are rare. 5 , 6 , 7
The pathogenesis of fibrate‐induced myopathy is unclear. The studies report perturbations in energy metabolism homeostasis, mitochondrial dysfunction, and lactic acidosis. 8 , 9 Impaired glutathione biosynthesis and enhanced generation of reactive oxygen species markers indicate the possibility of oxidative stress. 9 Several studies have shown that fibrates decrease the levels of branched‐chain amino acids (BCAA; valine, leucine and isoleucine), 10 , 11 essential amino acids with protein‐anabolic properties.
To better understand the effects of fibrates on skeletal muscle, a study has been performed using male rats. We have examined two different FF doses: the low dose (LFFD, 50 mg/kg body weight), which represents the usual situation in human therapy, and the high dose (HFFD, 300 mg/kg body weight), which induced adverse effects in some experimental studies. 9 , 12 , 13 The focus of our study was on alterations in protein and amino acid metabolism. By examining alterations in the level of adenine nucleotides, we tried to estimate the effects of fibrates on energy metabolism. Because there are different sensitivities of slow‐ and fast‐twitch muscles to various signals, 14 , 15 , 16 muscles of different metabolic properties were examined.
2. MATERIALS AND METHODS
2.1. Animals and material
Male Wistar rats (Charles River, Sulzfeld, Germany) weighing approximately 240 g were housed in standardized cages in quarters with controlled temperature and a 12‐hour light‐dark cycle. Rats were maintained on an ST‐1 (Velas, CR) standard laboratory diet containing (w/w) 24% nitrogenous compounds, 4% fat, 70% carbohydrates, and 2% minerals and vitamins, and were provided drinking water ad libitum.
Fenofibrate (Fenofix) was obtained from Ingest Industrial Solutions (Brno, Czech Republic). The chemicals were purchased from Sigma‐Aldrich, Lachema, Waters, Biomol and Merck.
2.2. Ethical approval
The Animal Care and Use Committee of Charles University, Faculty of Medicine in Hradec Kr.lov. (licence no. 144879/2011‐MZE‐17214), specifically approved this study on 1 November 2016 (identification code MSMT‐ 33747/2016‐3). All experimental procedures complied with the National Institutes of Health guidelines.
2.3. Experimental design and methods
The rats (n = 25) were randomly divided into three groups to receive daily oral gavage of FF dissolved in water for 10 days as follows: low dose of fenofibrate (LFFD group; 50 mg/kg body weight, n = 9), high dose of fenofibrate (HFFD group; 300 mg/kg body weight, n = 8), or the same volume of vehicle (control group, n = 8). The doses were selected according to those used to examine the therapeutic effects of fibrates in rats. 9 , 12 , 13
At the end of the study, the overnight fasted animals were euthanized in ether anaesthesia by exsanguination from the abdominal aorta. Blood was collected in heparinized tubes and immediately centrifuged for 15 minutes at 2200 g using a refrigerated centrifuge; blood plasma was transferred into polypropylene tubes using a Pasteur pipette. The liver and soleus (SOL, red, slow‐twitch muscle) and extensor digitorum longus (EDL, white, fast‐twitch muscle) muscles were quickly removed and weighed. Small pieces (~0.1 g) of the tissues were frozen in liquid nitrogen.
2.4. Biochemical markers in blood plasma, liver and muscles
Plasma levels of glucose, creatinine, alanine aminotransferase (ALT), aspartate aminotransferase (AST), triglycerides and cholesterol were measured using commercial tests (Boehringer, Mannheim, Germany; Elitech, Sées, France, Sigma Chemical, St. Louis, MO, USA, and Roche Diagnostics, Basel, Switzerland). The DNA content in the liver was determined using the diphenylamine reaction. 17 Protein contents in the liver and muscles were measured according to Lowry et al. 18 Concentration of triglycerides in the liver was determined by ethanolic potassium hydroxide saponification followed by an assay for glycerol (Sigma Chemical). Carnitine (β‐hydroxy‐γ‐N‐trimethylaminobutyric acid) concentration in blood plasma and liver was measured enzymatically as described by Alhomida et al. 19
2.5. Chymotrypsin‐like activity (CHTLA) of proteasome and cathepsin B and L activities in liver and muscles
The CHTLA of the proteasome and cathepsin B and L activities were determined using the fluorogenic substrates Suc‐LLVY‐MCA. 20 and Z‐FA‐MCA, 21 respectively, as previously described in detail. 22 The fluorescence of the samples was measured at the excitation wavelength of 340 nm and the emission wavelength of 440 nm (Tecan Infinite™ 200). A standard curve was established for 7‐amino‐4‐methylcoumarin (AMC), which allowed expression of the enzyme activities in nmol of AMC/mg protein/h.
2.6. Amino acid concentrations
Amino acid concentrations were determined in supernatants of deproteinized samples of blood plasma, liver and muscles by high‐performance liquid chromatography (HPLC; Alliance 2695, Waters) after derivatization with 6‐aminoquinolyl‐N‐hydroxysuccinimidyl carbamate (Waters) using norleucine as the internal standard. The level of total homocysteine in plasma was determined by enzymatic conversion of homocysteine to S‐adenosyl‐L‐homocysteine, followed by quantification of S‐adenosyl‐L‐homocysteine by an enzyme‐linked immunoassay (ELISA) using the IMMULITE® 2000 Immunoassay System (Siemens GmbH). The results are expressed as µmol/L of blood plasma or nmol/g of wet tissue.
2.7. Adenine nucleotides
The reversed‐phase HPLC (Alliance 2695, Waters) combined with ultraviolet detection was used for the determination of ATP, ADP and AMP in the liver and muscles as described in detail previously. 23 The results are expressed as µmol/g of wet tissue.
2.8. Branched‐chain keto acid (BCKA) concentrations
The reversed‐phase HPLC combined with o‐phenylenediamine derivatization was used for the determination of BCKA in samples of blood plasma as previously described in detail. 23 The quinoxalinol derivatives of BCKAs were detected using fluorescence with emission and excitation at 410 nm and 350 nm, respectively, and were quantified by the internal standard method. The results are expressed as µmol/L of blood plasma.
2.9. Statistical analysis
The results are expressed as mean ± standard error (SE). Analysis of variance (ANOVA) followed by Bonferroni multiple comparison post hoc analysis was used to detect differences between multiple independent groups. NCSS 2001 statistical software (Kaysville, UT, USA) was used for analyses. Differences were considered significant at P < .05.
3. RESULTS
3.1. Blood biochemical markers
Administration of LFFD increased concentrations of glucose and decreased concentrations of creatinine, triglycerides, and total and HDL cholesterol (Table 1). HFFD decreased concentrations of triglycerides, total cholesterol, and HDL and LDL cholesterol, and increased ALT and AST levels when compared with controls. Comparison of HFFD and LFFD groups showed lower concentrations of glucose and LDL cholesterol and higher levels of creatinine, ALT, and AST in the HFFD group. The effect of FF on carnitine concentration in blood plasma was insignificant.
Table 1.
Effect of fenofibrate on blood biochemistry
| Variable |
Control (n = 8) |
LFFD (n = 9) |
HFFD (n = 8) |
|---|---|---|---|
| Glucose (mmol/L) | 6.43 ± 0.39 | 9.29 ± 0.10* | 7.09 ± 0.15# |
| Creatinine (µmol/L) | 23.60 ± 1.18 | 16.44 ± 0.63* | 23.80 ± 0.49# |
| ALT (µkat/L) | 0.83 ± 0.06 | 0.74 ± 0.05 | 1.27 ± 0.12*,# |
| AST (µkat/L) | 1.46 ± 0.07 | 0.86 ± 0.11 | 4.23 ± 0.68*,# |
| Triglycerides (mmol/L) | 1.13 ± 0.06 | 0.86 ± 0.10* | 0.88 ± 0.04* |
| Total cholesterol (mmol/L) | 1.89 ± 0.08 | 1.37 ± 0.08* | 1.37 ± 0.06* |
| HDL cholesterol (mmol/L) | 1.13 ± 0.07 | 0.74 ± 0.05* | 0.65 ± 0.05* |
| LDL cholesterol (mmol/L) | 0.36 ± 0.02 | 0.40 ± 0.02 | 0.29 ± 0.01*,# |
| Non‐HDL cholesterol (mmol/L) | 0.76 ± 0.06 | 0.63 ± 0.03 | 0.72 ± 0.06 |
| Carnitine (µmol/L) | 21.2 ± 3.0 | 24.2 ± 2.9 | 25.5 ± 4.1 |
Means ± SE, P < .05. ANOVA and Bonferroni multiple comparisons.
Non‐HDL cholesterol was calculated as total cholesterol – HDL cholesterol.
Comparison vs control.
HFFD vs LFFD.
3.2. Body weight and weights of the liver and muscles
There were no significant differences among body weights of animals in specific experimental groups on the first and the last day of the experiment. At the time of euthanasia the liver mass was 100% greater in the LFFD group and 127% greater in the HFFD group when compared with controls. After subtraction of the liver weight from the body weight, the weights of animals in the HFFD group were significantly lower when compared with the control and LFFD groups. The weights of both muscles obtained from animals in the HFFD group were significantly lower when compared with controls. In the LFFD group, a decrease in muscle mass was observed in the EDL (Figure 1, Table 2).
Figure 1.
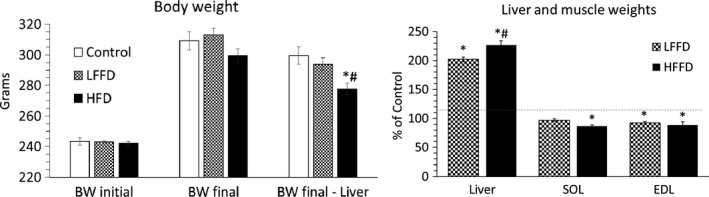
Effect of fenofibrate on body weight and weights of the liver and muscles. Means ± SE, P < .05. ANOVA and Bonferroni multiple comparisons. *Comparison vs control; #HFFD vs LFFD
Table 2.
Effects of fenofibrate in the liver and muscles
| Variable | Control (n = 8) | LFFD (n = 9) | HFFD (n = 8) |
|---|---|---|---|
| LIVER | |||
| Weight ‐g | 9.57 ± 0.18 | 19.31 ± 0.37* | 21.73 ± 0.72*,# |
| Protein ‐mg/g | 191 ± 6 | 205 ± 6 | 207 ± 5 |
| ‐g | 1.82 ± 0.05 | 3.96 ± 0.17* | 4.51 ± 0.18*,# |
| DNA ‐mg/g | 1.68 ± 0.04 | 1.17 ± 0.02* | 1.05 ± 0.02*,# |
| ‐mg | 16.04 ± 0.39 | 22.62 ± 0.33* | 22.78 ± 0.86* |
| Triglycerides ‐mg/g | 4.11 ± 0.46 | 3.04 ± 0.32 | 2.50 ± 0.13* |
| ‐g | 39.20 ± 4.06 | 58.76 ± 6.21* | 54.01 ± 2.78* |
| Cathepsins B and L | 542 ± 23 | 596 ± 17 | 564 ± 29 |
| CHTLA | 3.10 ± 0.12 | 2.60 ± 0.10* | 2.61 ± 0.14* |
| SOL | |||
| Weight ‐mg | 159 ± 4 | 154 ± 4 | 137 ± 5*,# |
| Protein ‐mg/g | 142 ± 4 | 130 ± 5 | 138 ± 4 |
| ‐mg | 22.5 ± 0.5 | 20.1 ± 1.2 | 18.9 ± 0.6* |
| Cathepsins B and L | 52 ± 5 | 51 ± 4 | 67 ± 12 |
| CHTLA | 1.35 ± 0.07 | 1.39 ± 0.05 | 2.26 ± 0.14*,# |
| EDL | |||
| Weight ‐mg | 142 ± 3 | 131 ± 3* | 129 ± 3* |
| Protein ‐mg/g | 140 ± 4 | 139 ± 4 | 139 ± 5 |
| ‐mg | 19.9 ± 0.6 | 18.2 ± 0.6 | 17.4 ± 0.5* |
| Cathepsins B and L | 45 ± 3 | 37 ± 5 | 38 ± 5 |
| CHTLA | 0.94 ± 0.09 | 1.07 ± 0.06 | 0.79 ± 0.04 |
Means ± SE, P < .05. ANOVA and Bonferroni multiple comparisons.
The activities of cathepsins B and L and CHTLA are presented in nmol AMC/mg protein/h.
Comparison vs control.
HFFD vs LFFD.
3.3. Alterations in the liver and muscles
FF had no effect on hepatic protein concentration, but it decreased DNA and triglyceride concentrations (Table 2). Due to a marked increase in the liver weight, the contents of proteins, DNA and triglycerides were higher in FF‐treated animals compared with controls.
There were no differences in muscle protein concentration among experimental groups. Due to reduced muscle mass, the protein content decreased in the muscles of HFFD‐treated animals.
A statistically significant decrease in hepatic CHTLA, indicating decreased protein breakdown, was observed in both groups of FF‐treated animals. Cathepsin B and L activities were not affected. The effect of FF on proteolysis in muscles was mostly insignificant; the exception was an increase in CHTLA in SOL of the HFFD‐treated group.
3.4. Hepatic carnitine concentration
In the liver of FF‐treated animals, carnitine concentration and carnitine content were markedly increased (23‐ and 27‐fold after LFFD and HFFD, respectively) (Figure 2).
Figure 2.
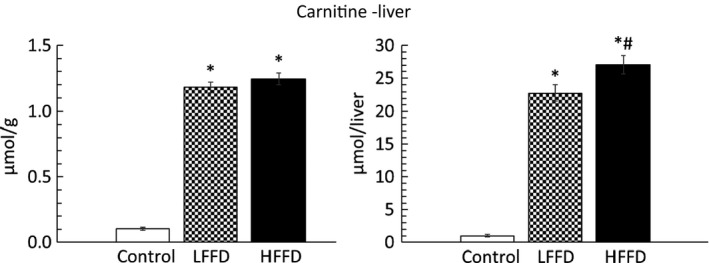
Effect of fenofibrate on carnitine content in the liver. Means ± SE, P < .05. ANOVA and Bonferroni multiple comparisons. *Comparison vs control; #HFFD vs LFFD
3.5. Adenine nucleotide concentrations
ATP and AMP concentrations in the liver were higher in FF‐treated rats when compared with controls (Figure 3). In muscles of the LFFD group, we found increased concentrations of ATP and decreased AMP‐to‐ATP ratio. The main effect of HFFD was an increase in AMP, resulting in increased AMP‐to‐ATP ratio when compared with the LFFD group.
Figure 3.
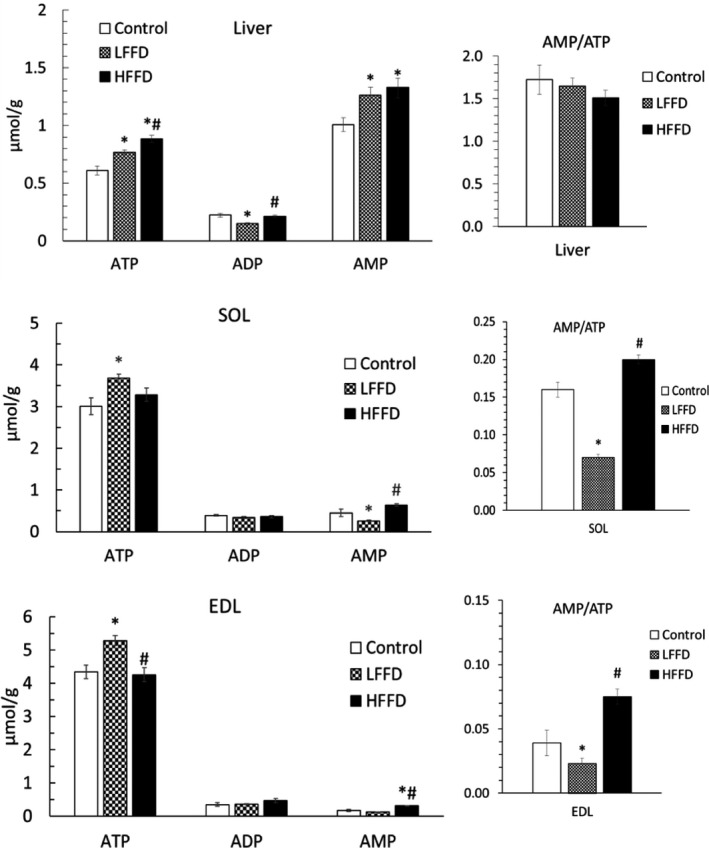
Effect of fenofibrate on adenine nucleotide concentrations and AMP‐to‐ATP ratios. Means ± SE, P < .05. ANOVA and Bonferroni multiple comparisons. *Comparison vs control; #HFFD vs LFFD
3.6. Alterations in amino acid and BCKA concentrations in blood plasma
In both groups of FF‐treated animals, increased plasma concentrations of histidine, phenylalanine, glycine, citrulline, and ornithine and decreased concentrations of arginine and proline were found (Table 3). In the HFFD group, but not in the LFFD group, decreased concentration of all three BCAAs (valine, leucine and isoleucine), lysine, methionine, alanine, aspartate, and glutamate and increased glutamine and homocysteine were found.
Table 3.
Effect of fenofibrate on amino acid and BCKA concentrations in blood plasma
| Plasma | Control (n = 8) | LFFD (n = 9) | HFFD (n = 8) |
|---|---|---|---|
| EAA | |||
| Histidine | 58 ± 2 | 69 ± 2* | 71 ± 2* |
| Isoleucine | 113 ± 7 | 114 ± 4 | 96 ± 3*,# |
| Leucine | 158 ± 8 | 177 ± 5 | 151 ± 7# |
| Lysine | 447 ± 13 | 401 ± 16 | 377 ± 27* |
| Methionine | 52 ± 2 | 52 ± 2 | 43 ± 2*,# |
| Phenylalanine | 69 ± 2 | 84 ± 2* | 79 ± 3* |
| Threonine | 259 ± 16 | 285 ± 17 | 260 ± 9 |
| Valine | 198 ± 11 | 211 ± 5 | 174 ± 6# |
| BCAA | 469 ± 25 | 501 ± 14 | 420 ± 16# |
| Σ EAA | 1356 ± 57 | 1393 ± 32 | 1251 ± 45 |
| NEAA | |||
| Alanine | 392 ± 19 | 328 ± 21 | 248 ± 17*,# |
| Arginine | 162 ± 6 | 70 ± 4* | 59 ± 3* |
| Asparagine | 63 ± 2 | 58 ± 2 | 54 ± 4 |
| Aspartate | 12 ± 1 | 14 ± 1 | 8 ± 1*,# |
| Citrulline | 95 ± 6 | 127 ± 8* | 123 ± 7* |
| Glutamate | 106 ± 5 | 142 ± 4* | 84 ± 5*,# |
| Glutamine | 527 ± 13 | 578 ± 22 | 627 ± 32* |
| Glycine | 390 ± 18 | 677 ± 22* | 712 ± 29* |
| Homocysteine | 9.86 ± 0.77 | 12.90 ± 0.74 | 13.69 ± 1.39* |
| Ornithine | 52 ± 3 | 77 ± 5* | 67 ± 4* |
| Proline | 154 ± 5 | 129 ± 5* | 117 ± 4* |
| Serine | 236 ± 7 | 277 ± 11* | 258 ± 15 |
| Taurine | 311 ± 20 | 290 ± 25 | 279 ± 18 |
| Tyrosine | 110 ± 6 | 108 ± 4 | 96 ± 4 |
| Σ NEAA | 2611 ± 73 | 2875 ± 55* | 2734 ± 89 |
| Σ Amino acids | 3967 ± 126 | 4268 ± 80* | 3984 ± 131 |
| KIV | 10.4 ± 0.5 | 8.9 ± 0.2* | 7.5 ± 0.4*,# |
| KIC | 27.4 ± 1.4 | 24.0 ± 0.9 | 18.3 ± 1.2*,# |
| KMV | 19.6 ± 0.9 | 16.1 ± 0.4* | 13.1 ± 0.6*,# |
| Ʃ BCKA | 57.4 ± 2.7 | 49.1 ± 1.5* | 38.9 ± 2.1*,# |
The values are in µmol/L of plasma. Means ± SE, P < .05. ANOVA and Bonferroni multiple comparisons.
Abbreviations: EAA, essential amino acids; NEAA, non‐essential amino acids; KIV, α‐ketoisovalerate; KIC, α‐ketoisocaproate; KMV; α‐keto‐β‐methylvalerate.
Comparison vs control.
HFFD vs LFFD.
Concentrations of the BCKA (α‐ketoisovalerate, α‐ketoisocaproate, α‐keto‐β‐methylvalerate) were decreased in both FF‐treated groups. The decrease was more pronounced in the HFFD group.
3.7. Amino acid concentrations in the liver
In the hepatic tissue of both FF‐treated groups, increased concentrations of histidine, alanine, asparagine, citrulline, ornithine, and serine and decreased aspartate were found (Table 4). Moreover, in the HFFD group, decreased leucine, methionine, proline, and valine and increased concentrations of glutamate, glutamine, and glycine were found.
Table 4.
Effects of fenofibrate on amino acid concentration in the liver
| Liver | Control (n = 8) | LFFD (n = 9) | HFFD (n = 8) |
|---|---|---|---|
| EAA | |||
| Histidine | 725 ± 27 | 857 ± 23* | 931 ± 25* |
| Isoleucine | 161 ± 7 | 187 ± 7* | 172 ± 6 |
| Leucine | 315 ± 15 | 328 ± 11 | 277 ± 12 # |
| Lysine | 790 ± 45 | 1002 ± 35 | 994 ± 145 |
| Methionine | 75 ± 4 | 67 ± 2 | 51 ± 2*,# |
| Phenylalanine | 123 ± 5 | 135 ± 3 | 120 ± 5 |
| Threonine | 1155 ± 134 | 1043 ± 23 | 1081 ± 18 |
| Valine | 337 ± 18 | 374 ± 12 | 317 ± 10# |
| BCAA | 813 ± 38 | 889 ± 27 | 766 ± 24# |
| Σ EAA | 3681 ± 201 | 3994 ± 49 | 3943 ± 177 |
| NEAA | |||
| Alanine | 1657 ± 181 | 2434 ± 101* | 2507 ± 168* |
| Arginine | 65 ± 14 | 100 ± 15 | 73 ± 14 |
| Asparagine | 124 ± 8 | 182 ± 6* | 162 ± 5* |
| Aspartate | 1401 ± 63 | 1034 ± 36* | 1069 ± 93* |
| Citrulline | 81 ± 6 | 356 ± 80* | 337 ± 68* |
| Glutamate | 1853 ± 95 | 1939 ± 83 | 2511 ± 258*,# |
| Glutamine | 4457 ± 124 | 5189 ± 269 | 6279 ± 252*,# |
| Glycine | 3582 ± 91 | 3501 ± 106 | 4105 ± 190*,# |
| Ornithine | 480 ± 53 | 1020 ± 112* | 794 ± 69* |
| Proline | 224 ± 13 | 247 ± 9 | 184 ± 11*,# |
| Serine | 821 ± 60 | 1411 ± 142* | 1434 ± 127* |
| Taurine | 1601 ± 79 | 1491 ± 171 | 2093 ± 528 |
| Tyrosine | 161 ± 7 | 187 ± 7* | 172 ± 6 |
| Σ NEAA | 16 390 ± 390 | 19 167 ± 456* | 21 783 ± 755*,# |
| Σ Amino acids | 20 242 ± 557 | 23 161 ± 477* | 25 726 ± 866*,# |
The values are in nmol/g of tissue. Means ± SE, P < .05. ANOVA and Bonferroni multiple comparisons.
Abbreviations: EAA, essential amino acids; NEAA, non‐essential amino acids.
Comparison vs control.
HFFD vs LFFD.
3.8. Amino acid concentrations in muscles
Decreased arginine and increased glycine were found in both muscles of both groups of FF‐treated animals (Tables 5 and 6). Moreover, in EDL of HFFD‐treated animals decreased lysine, methionine, proline, and the BCAA. These alterations were not observed in SOL.
Table 5.
Effect of fenofibrate on amino acid concentration in soleus muscle
| SOL | Control (n = 8) | LFFD (n = 9) | HFFD (n = 8) |
|---|---|---|---|
| EAA | |||
| Histidine | 348 ± 11 | 485 ± 24* | 331 ± 24# |
| Isoleucine | 140 ± 4 | 135 ± 5 | 135 ± 5 |
| Leucine | 135 ± 2 | 133 ± 6 | 160 ± 7*,# |
| Lysine | 926 ± 25 | 904 ± 59 | 767 ± 74 |
| Methionine | 58 ± 2 | 58 ± 2 | 52 ± 2 |
| Phenylalanine | 70 ± 1 | 80 ± 2* | 94 ± 2*,# |
| Threonine | 1089 ± 46 | 1303 ± 85 | 1135 ± 61 |
| Valine | 173 ± 4 | 177 ± 8 | 191 ± 8 |
| BCAA | 448 ± 9 | 445 ± 16 | 486 ± 15 |
| Σ EAA | 2939 ± 55 | 3275 ± 97 | 2865 ± 130 |
| NEAA | |||
| Alanine | 2097 ± 73 | 1966 ± 59 | 1682 ± 80* |
| Arginine | 380 ± 10 | 138 ± 12* | 159 ± 9* |
| Asparagine | 505 ± 17 | 501 ± 27 | 459 ± 25 |
| Aspartate | 3562 ± 140 | 3034 ± 157 | 1392 ± 142*,# |
| Citrulline | 459 ± 12 | 598 ± 36* | 518 ± 40 |
| Glutamate | 3686 ± 91 | 3267 ± 115 | 3567 ± 197 |
| Glutamine | 5246 ± 239 | 6231 ± 288* | 5548 ± 195 |
| Glycine | 2782 ± 101 | 4788 ± 246 * | 7039 ± 383*,# |
| Ornithine | 78 ± 3 | 95 ± 4 * | 72 ± 5# |
| Proline | 322 ± 12 | 306 ± 12 | 322 ± 11 |
| Serine | 1750 ± 82 | 2370 ± 203* | 2168 ± 121* |
| Taurine | 21 272 ± 529 | 19 045 ± 312* | 18 471 ± 382* |
| Tyrosine | 140 ± 4 | 135 ± 5 | 135 ± 5 |
| Σ NEAA | 42 069 ± 904 | 42 473 ± 840 | 41 439 ± 797 |
| Σ Amino acids | 45 009 ± 922 | 45 748 ± 907 | 44 304 ± 856 |
The values are in nmol/g of tissue. Means ± SE, P < .05. ANOVA and Bonferroni multiple comparisons.
Abbreviations: EAA, essential amino acids; NEAA, non‐essential amino acids.
Comparison vs control.
HFFD vs LFFD.
Table 6.
Effect of fenofibrate on amino acid concentration in extensor digitorum longus muscle
| EDL | Control (n = 8) | LFFD (n = 9) | HFFD (n = 8) |
|---|---|---|---|
| EAA | |||
| Histidine | 228 ± 9 | 271 ± 12* | 281 ± 9* |
| Isoleucine | 161 ± 7 | 160 ± 5 | 147 ± 6 |
| Leucine | 150 ± 5 | 156 ± 4 | 137 ± 6# |
| Lysine | 615 ± 35 | 562 ± 40 | 468 ± 30* |
| Methionine | 61 ± 2 | 62 ± 2 | 50 ± 2*,# |
| Phenylalanine | 79 ± 3 | 90 ± 2* | 85 ± 2 |
| Threonine | 1089 ± 52 | 1216 ± 53 | 1212 ± 20 |
| Valine | 214 ± 6 | 225 ± 6 | 187 ± 7*,# |
| BCAA | 526 ± 16 | 542 ± 13 | 470 ± 13*,# |
| Σ EAA | 2598 ± 107 | 2742 ± 66 | 2567 ± 43 |
| NEAA | |||
| Alanine | 2172 ± 120 | 1782 ± 79* | 1437 ± 118* |
| Arginine | 297 ± 15 | 161 ± 8 * | 129 ± 16* |
| Asparagine | 286 ± 16 | 275 ± 8 | 258 ± 15 |
| Aspartate | 525 ± 44 | 351 ± 19* | 361 ± 50* |
| Citrulline | 348 ± 15 | 434 ± 26 | 463 ± 41* |
| Glutamate | 1884 ± 162 | 2054 ± 123 | 1972 ± 171 |
| Glutamine | 5025 ± 241 | 5495 ± 146 | 6038 ± 215* |
| Glycine | 3435 ± 162 | 5953 ± 353* | 6430 ± 229* |
| Ornithine | 48 ± 2 | 60 ± 4* | 48 ± 3# |
| Proline | 338 ± 13 | 321 ± 7 | 288 ± 7* |
| Serine | 942 ± 42 | 1137 ± 50* | 1105 ± 55 |
| Taurine | 16 522 ± 257 | 16 440 ± 365 | 16 757 ± 694 |
| Tyrosine | 161 ± 7 | 160 ± 5 | 147 ± 6 |
| Σ NEAA | 31 984 ± 700 | 34 622 ± 569* | 35 433 ± 600* |
| Σ Amino acids | 34 582 ± 771 | 37 364 ± 606* | 38 000 ± 599* |
The values are in nmol/g of tissue. Means ± SE, P < .05. ANOVA and Bonferroni multiple comparisons.
Abbreviations: EAA, essential amino acids; NEAA, non‐essential amino acids.
Comparison vs control.
HFFD vs LFFD.
4. DISCUSSION
Our study demonstrates expected effects as well as many additional effects of FF therapy on protein, energy and amino acid metabolism in the liver and muscles. The data indicate that impaired muscle protein balance in HFFD‐treated animals is associated with hepatomegaly, increased hepatic carnitine content, alterations in the levels of adenine nucleotides, and increased glycine and decreased BCAA, methionine, and lysine concentrations.
4.1. Effects of FF on the liver
Hepatic enlargement in FF‐treated animals is mostly due to proliferation of peroxisomes and enhanced expression of genes encoding proteins involved in lipid metabolism, resulting in decreased triglyceride concentration in the blood and the liver. The finding of the decreased hepatic triglycerides was an incentive to use them to treat hepatic steatosis. 3 , 24 , 25 However, signs of hepatotoxicity in HFFD‐treated animals (increased ALT and AST) and increased triglyceride content due to hepatomegaly indicate that it remains to be established whether fibrates have beneficial or adverse effect in subjects with hepatic steatosis.
The hepatic content of proteins increased proportionally with the liver weight, but not with DNA content. Therefore, the cause of hepatomegaly is hypertrophy rather than hyperplasia. The observed decrease in CHTLA in FF‐treated animals and Paul and Adibi's report 12 of unchanged hepatic protein synthesis in clofibrate‐fed rats indicate that decreased proteolysis plays a significant role in increased hepatic protein content.
Recent studies convincingly demonstrated that PPARα is a key regulator of genes involved in carnitine homeostasis, 26 a compound essential for transport of long‐chain fatty acids into the mitochondria to be oxidized. A marked increase in liver carnitine content by LFFD and HFFD (by 23‐ and 27‐fold, respectively) is in line with earlier reports of effects of clofibrate. 12 , 27 We assume that upregulation of fatty acid oxidation is the main cause of a significant increase in ATP concentration if FF‐treated animals. The low hepatic AMP/ATP ratio is due to energy consumption linked to increased gluconeogenesis induced by the nocturnal starvation. 28
4.2. Alterations in lysine, methionine, glycine and homocysteine concentrations are related to an increase in carnitine synthesis
A starting point in carnitine synthesis is breakdown of muscle proteins containing N6‐trimethyllysine (TML) formed by post‐translational methylation of lysine residues by S‐adenosylmethionine (SAM) synthesized from methionine. TML released from proteins is converted to butyrobetaine and glycine, which are released to the blood. Hydroxylation of butyrobetaine to carnitine occurs only in the liver (Figure 4).
Figure 4.
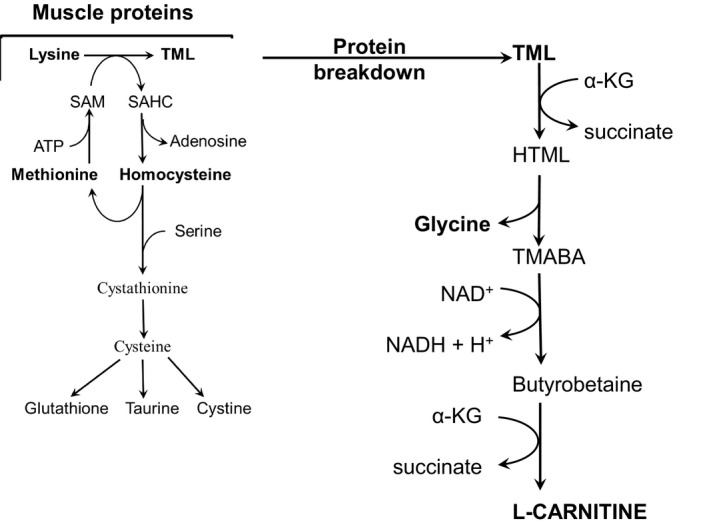
Role of amino acids in carnitine synthesis. Please note that lysine and methionine are the precursors for carnitine; glycine is generated in the pathway of carnitine synthesis. TML, N6‐trimethyllysine; HTML, 3‐hydroxy‐N6‐trimethyllysine; TMABA, 4‐N‐trimethylaminobutyraldehyde; SAM, S‐adenosylmethionine; SAHC, S‐adenosylhomocysteine
It may be suggested that enhanced catabolism of TML is the main cause of increased glycine concentration in FF‐treated animals and that increased requirements of TML enhance consumption of methionine and lysine and consequently decrease their concentrations in blood plasma and muscles, as observed in animals treated by HFFD.
Several articles reported an FF‐induced increase in blood plasma homocysteine that is recognized as an independent risk factor for atherosclerosis. 29 , 30 In our study, plasma homocysteine concentration increased in HFFD‐treated animals. We suppose that increased lysine methylation to TML by S‐adenosylmethionine followed by production of S‐adenosylhomocysteine, which is converted to homocysteine, has a role in the pathogenesis of increased homocysteine concentration in FF‐treated subjects (see Figure 4).
4.3. Alterations in BCAA and BCKA concentrations
The findings of decreased BCAA levels in blood plasma, liver, and EDL in HFFD‐treated animals are in line with the observation of decreased BCAA levels in blood 11 , 31 and gastrocnemius muscle of rats treated by high‐dose (300 mg/kg body weight) clofibrate. 12
The fibrates were found to inhibit the kinase responsible for phosphorylation and inactivation of branched‐chain alpha‐keto acid dehydrogenase, the rate‐limiting enzyme in the BCAA catabolism, in the liver and muscles. 32 , 33 Hence, the mechanism responsible for the decrease in BCAA is increased BCAA oxidation. A consequence and a marker of enhanced BCAA oxidation in muscles is the decrease in BCKA concentration in blood plasma, which was found in both LFFD‐ and HFFD‐treated animals.
4.4. Alterations in arginine
A decrease in arginine, often more than 50%, was a remarkable finding in the blood plasma and muscles of FF‐treated animals. The aetiology is not clear. A possible explanation is increased use of arginine by nitric oxide synthase (NOS). The speculation is supported by increased concentrations of citrulline, which is produced in the NOS reaction (arginine + O2 → citrulline + NO). Increased expression of the endothelial form of NOS by FF was reported in cultured rat endothelial cells and vascular endothelial cells of healthy humans after 7 days of FF therapy. 1 , 2
4.5. Effects of LFFD and HFFD on muscles
Our findings show that weight and protein content of muscles were only slightly affected by LFFD, but markedly decreased in animals treated by HFFD. The decreased muscle mass is undoubtedly the main cause of the lower gain of body weight, which was masked by hepatomegaly in HFFD‐treated animals.
The mechanism responsible for muscle wasting in FF‐treated animals is obscure. Of special importance might be increased ratio of AMP to ATP observed in animals treated by HFFD, which should activate AMP‐activated protein kinase (AMPK) resulting in inhibition of the energy‐consuming pathways like protein synthesis. In addition, AMPK activates autophagy, 34 which relates to protein degradation in lysosomes.
A role in the pathogenesis of impaired energy status and muscle protein balance during fibrate therapy might play alterations in BCAA metabolism discussed in the previous sections of the article. The studies have shown that BCAA deficiency impairs mRNA translation, and dietary inadequacies of BCAA result in impaired growth and protein wasting. 35 , 36
4.6. Effects of FF on different muscle types
The findings of more pronounced decrease in muscle mass and muscle protein contents in EDL when compared with SOL are in a line with other reports demonstrating higher susceptibility of white, fast‐twitch muscles to various catabolic stimuli than red, slow‐twitch muscles. 14 , 15 , 16 Furthermore, in HFFD‐treated animals, a marked decrease in the BCAA, lysine and methionine concentrations was found in EDL, but not in SOL. The difference might be explained by higher protein turnover in SOL, indicated by higher CHTLA when compared with EDL, which should restore the oxidized BCAA and lysine and methionine used for carnitine synthesis.
5. CONCLUSIONS
We conclude that FF exerts anabolic effects on hepatic protein metabolism and catabolic effects on muscles. Some effects such as hepatic enlargement and altered concentrations of carnitine, glycine and arginine appeared both in LFFD‐ and HFFD‐treated animals. Other effects appeared mostly in HFFD‐treated animals. Of special importance are signs of hepatotoxicity, increased plasma homocysteine concentration, impaired muscle protein balance, increased AMP‐to‐ATP ratio, and decreased BCAA, methionine and lysine concentrations in muscles. We suppose that alterations in homocysteine, lysine, methionine and glycine are related to activated carnitine synthesis, in which lysine and methionine act as substrates and glycine is synthesized. Decreased BCAA and BCKA levels are due to increased BCAA oxidation and might be an early indication of impaired muscle protein balance. Nevertheless, recent studies have demonstrated increased BCAA levels in subjects with diabetes and suggested that increased BCAA levels play a role in development of insulin resistance and complications associated with diabetes. 37 , 38 , 39 Therefore, the stimulatory effect of fibrates on BCAA oxidation might be of therapeutic importance.
CONFLICT OF INTEREST
The authors declare no conflict of interest.
AUTHORS CONTRIBUTIONS
MH outlined the experiments, performed the statistical analysis, interpreted the experimental results, and prepared the manuscript. MV was involved in the data acquisition and the data interpretation. Both authors read and approved the final manuscript.
ACKNOWLEDGEMENTS
This work was supported by PROGRES Q40/02 programme. The authors wish to thank to R. Fingrova, D. Jezkova and K. Sildbergerova for their technical assistance
Holeček M, Vodeničarovová M. Effects of low and high doses of fenofibrate on protein, amino acid and energy metabolism in rat. Int J Exp Path. 2020;101:171–182. 10.1111/iep.12368
Funding information
This work was supported by the programme PROGRES Q40/02.
REFERENCES
- 1. Goya K, Sumitani S, Xu X, et al. Peroxisome proliferator‐activated receptor alpha agonists increase nitric oxide synthase expression in vascular endothelial cells. Arterioscler Thromb Vasc Biol. 2004;24:658‐663. [DOI] [PubMed] [Google Scholar]
- 2. Walker AE, Kaplon RE, Lucking SMS, et al. Fenofibrate improves vascular endothelial function by reducing oxidative stress while increasing endothelial nitric oxide synthase in healthy normolipidemic older adults. Hypertension. 2012;60:1517‐1523. [DOI] [PMC free article] [PubMed] [Google Scholar]
- 3. Fernández‐Miranda C, Pérez‐Carreras M, Colina F, et al. A pilot trial of fenofibrate for the treatment of non‐alcoholic fatty liver disease. Dig Liver Dis. 2008;40:200‐205. [DOI] [PubMed] [Google Scholar]
- 4. Davidson MH, Armani A, McKenney JM, et al. Safety considerations with fibrate therapy. Am J Cardiol. 2007;99:3C‐18C. [DOI] [PubMed] [Google Scholar]
- 5. Hodel C. Myopathy and rhabdomyolysis with lipid‐lowering drugs. Toxicol Lett. 2002;128:159‐168. [DOI] [PubMed] [Google Scholar]
- 6. Tahmaz M, Kumbasar B, Ergen K, et al. Acute renal failure secondary to fenofibrate monotherapy‐induced rhabdomyolysis. Ren Fail. 2007;29:927‐930. [DOI] [PubMed] [Google Scholar]
- 7. Wang D, Wang Y. Fenofibrate monotherapy‐induced rhabdomyolysis in a patient with hypothyroidism: a rare case report and literature review. Medicine (Baltimore). 2018;97:e0318. [DOI] [PMC free article] [PubMed] [Google Scholar]
- 8. Scatena R, Bottoni P, Martorana GE, et al. Mitochondrial respiratory chain dysfunction, a non‐receptor‐mediated effect of synthetic PPAR‐ligands: biochemical and pharmacological implications. Biochem Biophys Res Commun. 2004;319:967‐973. [DOI] [PubMed] [Google Scholar]
- 9. Ohta T, Masutomi N, Tsutsui N, et al. Untargeted metabolomic profiling as an evaluative tool of fenofibrate‐induced toxicology in Fischer 344 male rats. Toxicol Pathol. 2009;37:521‐535. [DOI] [PubMed] [Google Scholar]
- 10. Paul HS, Adibi SA. Paradoxical effects of clofibrate on liver and muscle metabolism in rats. Induction of myotonia and alteration of fatty acid and glucose oxidation. J Clin Invest. 1979;64:405‐412. [DOI] [PMC free article] [PubMed] [Google Scholar]
- 11. Kadota Y, Kazama S, Bajotto G, et al. Clofibrate‐induced reduction of plasma branched‐chain amino acid concentrations impairs glucose tolerance in rats. JPEN J Parenter Enteral Nutr. 2012;36:337‐343. [DOI] [PubMed] [Google Scholar]
- 12. Paul HS, Adibi SA. Leucine oxidation and protein turnover in clofibrate‐induced muscle protein degradation in rats. J Clin Invest. 1980;65:1285‐1293. [DOI] [PMC free article] [PubMed] [Google Scholar]
- 13. Sun B, Xie Y, Jiang J, et al. Pleiotropic effects of fenofibrate therapy on rats with hypertriglycemia. Lipids Health Dis. 2015;14:27. [DOI] [PMC free article] [PubMed] [Google Scholar]
- 14. Holecek M, Siman P, Vodenicarovova M, et al. Alterations in protein and amino acid metabolism in rats fed a branched‐chain amino acid‐ or leucine‐enriched diet during postprandial and postabsorptive states. Nutr Metab (Lond). 2016;13:12. [DOI] [PMC free article] [PubMed] [Google Scholar]
- 15. Holecek M, Sispera L. Glutamine deficiency in extracellular fluid exerts adverse effects on protein and amino acid metabolism in skeletal muscle of healthy, laparotomized, and septic rats. Amino Acids. 2014;46:1377‐1384. [DOI] [PubMed] [Google Scholar]
- 16. Muthny T, Kovarik M, Sispera L, et al. Protein metabolism in slow‐ and fast‐twitch skeletal muscle during turpentine‐induced inflammation. Int J Exp Pathol. 2008;89:64‐71. [DOI] [PMC free article] [PubMed] [Google Scholar]
- 17. Burton K. A study of the conditions and mechanism of the diphenylamine reaction for the colorimetric estimation of deoxyribonucleic acid. Biochem J. 1956;62:315‐323. [DOI] [PMC free article] [PubMed] [Google Scholar]
- 18. Lowry OH, Rosebrough NJ, Farr AL, et al. Protein measurement with the Folin phenol reagent. J Biol Chem. 1951;193:265‐275. [PubMed] [Google Scholar]
- 19. Alhomida AS, Duhaiman AS, Al‐Jafari AA, et al. Determination of L‐carnitine, acylcarnitine and total carnitine levels in plasma and tissues of camel (Camelus dromedarius). Comp Biochem Physiol B Biochem Mol Biol. 1995;111:441‐445. [DOI] [PubMed] [Google Scholar]
- 20. Gomes‐Marcondes MC, Tisdale MJ. Induction of protein catabolism and the ubiquitin‐proteasome pathway by mild oxidative stress. Cancer Lett. 2002;180:69‐74. [DOI] [PubMed] [Google Scholar]
- 21. Koohmaraie M, Kretchmar DH. Comparisons of four methods for quantification of lysosomal cysteine proteinase activities. J Anim Sci. 1990;68:2362‐2370. [DOI] [PubMed] [Google Scholar]
- 22. Holecek M, Kovarik M. Alterations in protein metabolism and amino acid concentrations in rats fed by a high‐protein (casein‐enriched) diet ‐ effect of starvation. Food Chem Toxicol. 2011;49:3336‐3342. [DOI] [PubMed] [Google Scholar]
- 23. Holeček M, Vodeničarovová M. Muscle wasting and branched‐chain amino acid, alpha‐ketoglutarate, and ATP depletion in a rat model of liver cirrhosis. Int J Exp Pathol. 2018;99:274‐281. [DOI] [PMC free article] [PubMed] [Google Scholar]
- 24. Nseir W, Mograbi J, Ghali M. Lipid‐lowering agents in nonalcoholic fatty liver disease and steatohepatitis: human studies. Dig Dis Sci. 2012;57:1773‐1781. [DOI] [PubMed] [Google Scholar]
- 25. van Zutphen T, Ciapaite J, Bloks VW, et al. Malnutrition‐associated liver steatosis and ATP depletion is caused by peroxisomal and mitochondrial dysfunction. J Hepatol. 2016;65:1198‐1208. [DOI] [PubMed] [Google Scholar]
- 26. Ringseis R, Wen G, Eder K. Regulation of genes involved in carnitine homeostasis by PPARα across different species (rat, mouse, pig, cattle, chicken, and human). PPAR Res. 2012;2012: 868317. [DOI] [PMC free article] [PubMed] [Google Scholar]
- 27. Paul HS, Gleditsch CE, Adibi SA. Mechanism of increased hepatic concentration of carnitine by clofibrate. Am J Physiol. 1986;251:E311‐E315. [DOI] [PubMed] [Google Scholar]
- 28. Berglund ED, Lee‐Young RS, Lustig DG, et al. Hepatic energy state is regulated by glucagon receptor signaling in mice. J Clin Invest. 2009;119:2412‐2422. [DOI] [PMC free article] [PubMed] [Google Scholar]
- 29. Bissonnette R, Treacy E, Rozen R, et al. Fenofibrate raises plasma homocysteine levels in the fasted and fed states. Atherosclerosis. 2001;155:455‐462. [DOI] [PubMed] [Google Scholar]
- 30. Dierkes J, Westphal S, Luley C. The effect of fibrates and other lipid‐lowering drugs on plasma homocysteine levels. Expert Opin Drug Saf. 2004;3:101‐111. [DOI] [PubMed] [Google Scholar]
- 31. Ishiguro H, Katano Y, Nakano I, et al. Clofibrate treatment promotes branched‐chain amino acid catabolism and decreases the phosphorylation state of mTOR, eIF4E‐BP1, and S6K1 in rat liver. Life Sci. 2006;79:737‐743. [DOI] [PubMed] [Google Scholar]
- 32. Paul HS, Liu WQ, Adibi SA. Alteration in gene expression of branched‐chain keto acid dehydrogenase kinase but not in gene expression of its substrate in the liver of clofibrate‐treated rats. Biochem J. 1996;317:411‐417. [DOI] [PMC free article] [PubMed] [Google Scholar]
- 33. Kobayashi R, Murakami T, Obayashi M, et al. Clofibric acid stimulates branched‐chain amino acid catabolism by three mechanisms. Arch Biochem Biophys. 2002;407:231‐240. [DOI] [PubMed] [Google Scholar]
- 34. Kim J, Kundu M, Viollet B, et al. AMPK and mTOR regulate autophagy through direct phosphorylation of Ulk1. Nat Cell Biol. 2011;13:132‐241. [DOI] [PMC free article] [PubMed] [Google Scholar]
- 35. Watford M. Lowered concentrations of branched‐chain amino acids result in impaired growth and neurological problems: insights from a branched‐chain alpha‐keto acid dehydrogenase complex kinase‐deficient mouse model. Nutr Rev. 2007;65:167‐172. [DOI] [PubMed] [Google Scholar]
- 36. Anthony TG, Reiter AK, Anthony JC, et al. Deficiency of dietary EAA preferentially inhibits mRNA translation of ribosomal proteins in liver of meal‐fed rats. Am J Physiol Endocrinol Metab. 2001;281:E430‐E439. [DOI] [PubMed] [Google Scholar]
- 37. Iwasa M, Ishihara T, Mifuji‐Moroka R, et al. Elevation of branched‐chain amino acid levels in diabetes and NAFL and changes with antidiabetic drug treatment. Obes Res Clin Pract. 2015;9:293‐297. [DOI] [PubMed] [Google Scholar]
- 38. van den Berg E, Flores‐Guerrero J, Gruppen E, et al. Non‐alcoholic fatty liver disease and risk of incident type 2 diabetes: role of circulating branched‐chain amino acids. Nutrients. 2019;11(3):705. [DOI] [PMC free article] [PubMed] [Google Scholar]
- 39. Wang TJ, Larson MG, Vasan RS, et al. Metabolite profiles and the risk of developing diabetes. Nature Med. 2011;17:448‐453. [DOI] [PMC free article] [PubMed] [Google Scholar]