

Abstract

As an indispensable part of unconventional natural gas resources, the shale reservoir is huge and widely distributed. It is of great significance to study how to enhance the shale gas recovery for improving the energy structure. In order to solve the problem of low gas production rate and long recovery period in the process of shale gas production, in this paper, the influences of pressure, temperature, moisture, and gas type on isothermal adsorption and desorption of shale gas are analyzed based on shale adsorption and desorption experiments, and the adsorption and desorption abilities of CO2 and CH4 in shale are compared to verify the feasibility of CO2 enhancing shale gas recovery. Depletion production experiments and CO2 injection experiments with different injection pressures (6 and 7 MPa), different injection rates (5, 10 and 20 mL/min), and different injection amounts are carried out. The mechanism of CO2 enhancing shale gas recovery is proposed, and the parameters of CO2 injection are optimized. The results show that the adsorption capacity of CH4 increases with the increase in pressure and the decrease in temperature and moisture in a certain range. Under the same experimental conditions, the sorting of adsorption capacity is CO2 > CH4 > N2, while desorption capacity is CH4 > CO2 > N2. The desorption curves of the three gases lag behind the adsorption curves, in which the lag phenomenon of CO2 is most obvious. The ultimate recovery of depletion production ranges from 66 to 73%. CO2 injection can effectively increase the gas production rate of CH4, and it can also keep the cumulative gas production of CH4 growing steadily and rapidly. Within a certain range, CH4 recovery increases with the increase in CO2 injection pressure, the injection rate, and injection amount, but its increase range is related to the porosity and permeability of shale.
1. Introduction
Shale gas is a relatively friendly fuel compared with other fossil fuels, which has played an important role in natural gas exploration and development. Because of its extensive distribution and massive reserve in the world, shale gas has a great potential in energy supply.1 In recent years, the development of advanced horizontal well techniques and hydraulic fracturing technology has enabled some countries to economically exploit shale gas.2,3 The United States is the first country to commercially develop shale gas, and its annual shale gas production is about 1.0 Tcf from over 40,000 shale gas wells in five primary basins,4 which helps America improve its energy security and depresses the natural gas prices. In the recent few years, Canada and China have also made breakthroughs in the development of shale gas,5−8 and many other nations are also pursuing the opportunity to develop shale gas.
It is known that gas shale has ultralow permeability and porosity compared with the conventional sandstone formations, which makes the flow of gas very difficult and complex9,10,. The high production of shale gas wells heavily depends on stimulating technologies, such as horizontal wells and multistage hydraulic fracturing treatments. However, the production rate of a single shale gas well usually drops rapidly after a peak.11 After reaching a certain level, the production declines slowly, and the single well produces for a few decades.12 There is a lot of free gas stored in the fracture space after the shale hydraulically fractures, and it will form a gas flow stream with high velocity, causing a peak in the production curve. However, the gas amount in the hydraulic fracture is limited, and the production will decrease quickly when the free gas is produced. Then, the absorbed gas begins to desorb slowly and stably when the pressure declines. The practice has proved that the recovery of shale gas reservoirs is usually lower than that of the conventional natural gas reservoirs. For example, a recovery factor of 30% for Haynesville Shale in Louisiana is considered a relatively high level. There is still a great amount of shale stored in the reservoir after depletion production.13
As to the low recovery of shale gas reservoirs, CO2 injection has a high possibility to enhance gas recovery from the experience of enhancing oil recovery by injecting CO2.14 Busch and Gensterblum et al. have proved that it is feasible to enhance coal bed methane recovery by injecting CO2.15−18 The physical properties of shale and coal display similar characteristics (naturally occurring carbonaceous organic-rich porous materials), and the shale reservoir is akin to coalbed with a distinct gas trapping mechanism of physical adsorption.19,20 Therefore, enhanced shale gas recovery (ESGR) by injecting CO2 should be a possible way.
CO2 is the main greenhouse gas, and CO2 emission has continued to increase over the past few years. One way of solving the problem is the geologic storage of CO2 in gas shale.21,22 There are three advantages for ideal CO2 storage in gas shale: (1) CO2 can enhance the recovery of shale gas; (2) the storage capacity is huge; (3) there is no leak of CO2. Gas shale contains a lot of nanopores, and it can adsorb CO2 strongly, which is propitious to CO2 storage.
It has been proved that gas shale has a stronger affinity to CO2 than to CH4,23−25 which means the gas shale will absorb more CO2 when they exist at the same time. Many studies about CO2 injection to enhance shale gas recovery have been performed by numerical simulations and experimental studies. Khan et al.26 studied the feasibility and economic benefits of shale gas produced by CO2 based on numerical simulation. Moinfar et al.27 established a complex fracture model to simulate the improvement of shale gas recovery by injecting CO2. Kim et al.28 concluded that compared with the no-injection scenario, CO2 flooding, and CO2 huff and puff flooding increase CH4 production by 24 and 6%, respectively. Moreover, at the end of mining, the injected CO2 can be stored in the shale. Liu et al.29 presented a novel methodology based on nuclear magnetic resonance (NMR). It can be used to measure the enhanced gas recovery (EGR) efficiency caused by CO2 injection. Sun et al.30 have proved that CO2 sequestration with enhanced natural gas recovery can achieve CO2 sequestration and enhance CH4 recovery in shale gas reservoirs, and the injection pressure has a huge impact on CO2 storage and natural gas production rate. Li and Elsworth31 have proved that injecting CO2 into shale gas reservoirs is beneficial to increase the permeability of fracture. Bacon et al.32 developed simulations of methane production and supercritical carbon dioxide injection, and they found that CH4 desorption from clays is greater than that from organic matter after injecting CO2. Liu et al.33 have proved that CO2 storage in shale reservoirs is feasible; over 95% of the injected CO2 is effectively sequestered instantaneously, with gas adsorption being the dominant storage mechanism. Sang et al.34 have proved that pressure is an important factor affecting the ultimate recovery of shale gas, and a pressure depletion scheme can affect the process of gas production in shale deeply.
However, the optimal injection parameters and the underlying mechanisms of enhanced CH4 recovery by injecting CO2 are still not well-understood. Therefore, it is meaningful to perform an experimental investigation to analyze the behaviors and mechanisms of ESGR by CO2 injection. In this study, the influence of pressure, temperature, moisture, and gas type on isothermal adsorption and desorption of shale gas is analyzed based on shale adsorption and desorption experiments, and the adsorption and desorption abilities of CO2 and CH4 in shale are compared. The ultimate recovery of depletion production and CO2 injection production are compared, and the feasibility of CO2 enhancing shale gas recovery is proved. The mechanism of CO2 enhancing shale gas recovery is studied, and the optimal CO2 injection parameters are investigated. The research results lay a solid foundation for a better understanding of the CO2 displacement process and provide a guide for optimizing the designs of CO2 injection composition and injection strategy in field applications.
2. Results and Discussion
2.1. Isothermal Adsorption and Desorption
2.1.1. Effect of Temperature and Pressure
The CH4 amount adsorbed and desorption amount is measured with different temperatures and pressures. The results are shown in Figure 1.
Figure 1.

Adsorption and desorption of samples.
According to Figure 1, it is obvious that CH4 adsorption capacity on the samples is affected by temperature and pressure, and the adsorption amount increases with increasing pressure and decreases with increasing temperature. The adsorption amount of three core samples is different at the same temperature and pressure, and the adsorption capacity of SK1 is strongest and that of SK3 is weakest. The reason for this is that the total organic content (TOC) of SK1 is the highest, which indicates that the adsorption capacity has a positive relationship with the TOC. Furthermore, the adsorption isotherm and desorption isotherm are not coincident, and there is a misalignment hoop between the two curves. The hoop is caused by many factors, including the deformation of the micropores in the samples, the gas condensate, or phase transition. The hysteresis of desorption means that the recoverable reserves are lower than the theoretical reserves.
2.1.2. Effect of Moisture
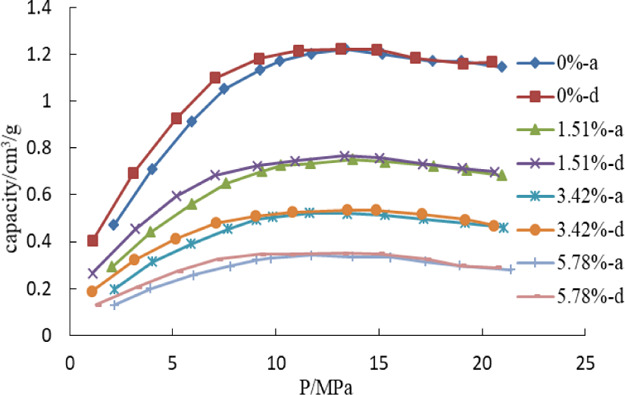
The powder of sample SK1 is used in the study of moisture. The content of water for the four powder samples is 0, 1.51, 3.42, and 5.78%, respectively. The adsorption and desorption isotherm are measured at 40 °C, and the gas type is CH4. The results are shown in Figure 2.
Figure 2.
Adsorption and desorption isotherms with different moisture.
Figure 2 shows that moisture has a strong effect on the adsorption capacity of the sample. The adsorption amount decreases when the content of water increases, and the difference rises with pressure increase. The effect of H2O on the adsorption of CH4 is very obvious. H2O is a polar molecule, and it is very easy to be adsorbed on the surface of minerals. Besides, the diameter of H2O is smaller than that of CH4, which means H2O is more accessible to micropores. Therefore, the adsorption amount of CH4 decreases when moisture increases.
2.1.3. Effect of Gas Type
CH4, CO2, and N2 are used to study the adsorption and desorption amount of different gas types. The isotherm is measured at 20 °C. The results are shown in Figure 3.
Figure 3.

Isothermal adsorption and desorption of CO2, CH4, and N2.
It can be seen that under the same conditions, the adsorption curves and analytical curves of the three gases have different trajectories. There is a lag between the analytical curves and the adsorption curves. The lag phenomenon of CO2 on shale is the most obvious, followed by CH4 and finally by N2. It can be inferred that the adsorption capacity of CO2 is greater than that of CH4 and N2. This is because adsorption is accompanied by a change in heat. On the one hand, it is manifested as a decrease in Gibbs free energy (ΔG). On the other hand, it shows the loss of degrees of freedom and entropy (ΔS) decreases. Therefore, the free enthalpy (ΔH) can be expressed as
| 1 |
The decrease in ΔH can explain the difference in shale adsorption capacity for different gases. The greater the heat of gas molecules, the stronger its adsorption capacity in shale. Therefore, it is feasible to improve shale gas recovery by injecting CO2. In the competitive adsorption process of CO2 and CH4, CO2 is easy to be absorbed, and it is not easy to desorb in the production process, which can promote the desorption of CH4 and enhance the recovery of CH4. At the same time, it is conducive to CO2 storage.
2.2. Depletion Production Experiments
It can be seen from Figure 4 that the process of shale depletion production can be roughly divided into three stages according to the shale gas production rate. The first stage is the early stage, in which the instantaneous gas recovery rate of CH4 increases rapidly and reaches a peak value, which is the expansion and desorption stage of free gas in shale-free space. In this stage, the major produced gas is from free CH4 gas. The second stage is the middle stage, in which the CH4 production rate drops sharply. With the further reduction of pressure, the proportion of free gas becomes smaller. In this stage, the major gas production is from desorption gas, but the total gas production rate of CH4 still decreases rapidly because of the sharp decline of free gas. The third stage is the late stage, in which the gas production rate of CH4 decreases slowly until it approaches zero when desorption of CH4 is totally completed. In this stage, the major produced gas is from CH4 dissolved in kerogen.
Figure 4.

Relationship between methane production rate and time.
On combining Figure 4 and Table1, we can see that the CH4 production rate of depletion production drops sharply in a short time and depletion production not only takes a long time but also has a low ultimate recovery, which ranges from 66 to 73%. There is still a lot of CH4 adsorbed on shale samples that have not been resolved. It is necessary to take effective measures to displace the residual adsorbed CH4 to improve the recovery of shale gas.
Table 1. CH4 Recovery of the Shale Samples.
| shale sample | gas production/mL/g | recovery/% |
|---|---|---|
| SK1 | 1.399 | 72.86 |
| SK2 | 1.082 | 69.81 |
| SK3 | 0.5287 | 66.09 |
2.3. CO2 Injection Experiments
2.3.1. Effect of CO2 Injection Pressure
As shown in Figure 5, after CO2 injection at different injection pressures, CH4 gas recovery rate increases rapidly with time, then remains stable, and finally decreases to zero. Compared with depletion production, the CH4 production rate does not decrease rapidly in the medium-term stage but remains stable for a period of time. The adsorption site of CH4 is mainly the center of the six-membered oxygen ring. The main adsorption site of CO2 is the position of the oxygen atom in the six-membered oxygen ring, and the adsorption site around the ion has a stronger adsorption capacity. Therefore, when CO2 is injected into shale reservoirs, CO2 molecules will compete with CH4. Compared with CH4 molecules, CO2 is easier to absorb and more difficult to desorb, so CO2 molecules can occupy the adsorption sites of CH4 molecules, which promotes desorption of CH4. Therefore, because of the preferential adsorption of CO2, CH4 adsorbed is gradually replaced and exploited. Although the contribution of CH4-free gas production to total production decreases gradually in the stable production stage, the desorbed CH4 gas compensates for the decrease of CH4-free gas production and keeps the gas production rate of shale gas stable. At the same time, the desorbed gas of shale gas accounts for an increasing proportion of total gas production. Therefore, we can see that CO2 injection at different pressures can effectively prolong the stable production time of CH4 and keep the cumulative gas production of CH4 growing steadily and rapidly.
Figure 5.

Relationship between methane production rate and time.
Table 2 shows that the recovery of SK1, SK2, and SK3 increases significantly after injecting CO2. Among them, the recovery increase of SK3 is much higher after injecting CO2 (7 MPa). The shale reservoir is a high stress-sensitive medium. With the exploitation of shale gas, the pore pressure of the shale reservoir decreases, and the shale fracture closes, which reduces the permeability of the shale. The injection of CO2 can alleviate the decrease of pore pressure, improve the permeability of shale, and improve the core with low permeability significantly. Therefore, CO2 injection can effectively improve the final recovery of CH4, and within a certain range, it is significant to improve the CH4 recovery by enhancing the injection pressure of CO2 for the low permeability formation.
Table 2. Recovery Comparison of Different Injection Pressures.
| recovery of different injection pressures |
growth margin |
||||
|---|---|---|---|---|---|
| number | recovery of depletion production (%) | 6 MPa (%) | 7 MPa (%) | 6 MPa (%) | 7 MPa (%) |
| SK1 | 72.86 | 93.66 | 98.09 | 28.55 | 34.63 |
| SK2 | 69.81 | 87.74 | 94.84 | 23.89 | 35.85 |
| SK3 | 66.09 | 81.88 | 94.13 | 35.85 | 42.43 |
2.3.2. Effect of the CO2 Injection Rate
Figure 6 shows that compared with depletion production, the CH4 gas production increases rapidly after CO2 injection in the early stage and middle stage. The enhancement of the CO2 injection rate can further improve the CH4 gas production rate. This is because injecting CO2 rapidly is beneficial for the maintenance of system pressure, which can increase the driving energy and accelerate the recovery of shale gas.
Figure 6.

Relationship between the methane production rate and time.
From Table 3 we can see that all the CH4 recoveries of shale samples SK1, SK2, and SK3 increase with the increase in the CO2 injection rate, but the increase range is slightly different. The increased range of SK2 and SK3 is significantly higher than that of SK1. Therefore, the effect of changing the CO2 injection rate on the recovery of low porosity cores is more significant. This is because the rapid injection of CO2 can make CO2 gas enter into some nanopores and micropores, which are not affected by depletion production, improving CH4 desorption in the pores and further improving shale gas recovery.
Table 3. Recovery Comparison of Different Injection Rates.
| recovery
of different injection rates |
growth
margin |
||||||
|---|---|---|---|---|---|---|---|
| number | recovery of depletion production (%) | 5 mL/min (%) | 10 mL/min (%) | 20 mL/min (%) | 5 mL/min (%) | 10 mL/min (%) | 20 mL/min (%) |
| SK1 | 72.86 | 84.96 | 92.05 | 97.80 | 16.61 | 26.34 | 34.23 |
| SK2 | 69.81 | 83.07 | 91.61 | 98.06 | 18.99 | 31.23 | 40.47 |
| SK3 | 66.09 | 78.11 | 85.86 | 95.39 | 18.19 | 29.91 | 44.33 |
2.3.3. Effect of the CO2 Injection Amount
It can be seen from Figure 7 that the ultimate recovery increases with increase in the amount of injection CO2. This is because shale reservoirs are strongly stressed by sensitive media. With the exploitation of shale gas, the pore pressure of the shale reservoir decreases, and the shale fracture closes, causing the shale permeability to decrease. Injecting CO2 can alleviate the reduction of shale pore pressure and help maintain the permeability of shale. However, the increasing rate at different ratios is different. There is a fast rate when the ratio is less than 2.5, and the increasing degree becomes flat when the ratio is higher than that. There is competitive adsorption and displacement when CO2 is injected into a shale formation, and the CH4 will be replaced and displaced more fully when CO2 is injected. However, when the amount of carbon dioxide is saturated, it is useless to inject more carbon dioxide. The rise of CH4 recovery obviously becomes slow after 2.5 ratios of CO2 injection. Therefore, the optimal CO2 injection ratio is 2.5.
Figure 7.

Recovery of different injection amounts of CO2.
3. Conclusions
In this study, laboratory experiments are conducted to investigate the effects of pressure, temperature, and moisture on adsorption and desorption in shale. By comparing CO2 injection with depletion production, the mechanism and optimal injection parameters are analyzed. Major conclusions of this study are as follows:
-
1
The pressure, temperature, and moisture have a relatively strong effect on the isothermal adsorption of shale gas.
-
2
Compared with CH4, CO2 is easier to be adsorbed and is more difficult to desorb. Injecting CO2 can promote desorption of CH4. Also, it is conducive to the geological burial of CO2, which can slow down the greenhouse effect.
-
3
All the desorption curves of CO2, CH4, and N2 lag behind their adsorption curves. The lag phenomenon of CO2 is the most obvious, followed by CH4 and N2. The delayed desorption of shale indicates that the recoverable reserves of shale are smaller than the theoretical reserves.
-
4
Increasing the CO2 injection pressure and rate can effectively increase the gas production rate and recovery efficiency of shale gas. The increase in CO2 injection pressure has a more obvious effect on the samples with lower permeability, and when the CO2 injection rate is greater than 5 mL/min, continuing to increase the injection rate has a more obvious effect on samples with lower porosity.
4. Experimental Section
4.1. Sample Collection and Characterization
Three shale core samples from the Cen Gong shale reservoir of China are used in the experiments, including SK1, SK2, and SK3. The permeability of samples is measured by helium, and the mineral compositions, TOC, and maturity of organic matter (Ro) are measured. The results are in Table 4.
Table 4. Basic Parameters of Shale Core Samples.
| clasolite/% | illite/% | kaolinite/% | chlorite/% | authigenicbrittle/% | solid volume (V2) cm3 | porosity (ϕ) % | permeability (K) md | TOC/% | Ro/% | |
|---|---|---|---|---|---|---|---|---|---|---|
| SK1 | 46.2 | 29.1 | 1.7 | 0.4 | 22.6 | 18.720 | 2.11 | 0.1773 | 6.14 | 2.71 |
| SK2 | 56.7 | 24.8 | 1.4 | 0.6 | 16.5 | 17.033 | 3.14 | 0.2560 | 5.61 | 2.58 |
| SK3 | 71.2 | 18.9 | 0.7 | 0.2 | 11.8 | 18.536 | 3.97 | 0.2819 | 4.98 | 2.61 |
Table 4 shows that the porosity range of shale core is 3.685–7.671%, and the permeability range of the shale sample is 0.0537 × 10⁻³–0.4872 × 10⁻³ μm2. The porosity and permeability of shale sample are low. The compositions of samples mainly include clasolite, clay mineral, and authigenic brittle minerals. Clasolite minerals are mainly composed of quartz and feldspar. For all samples, illite is the major clay mineral. However, the content of kaolinite and chlorite is relatively low. The TOC of samples is relatively high and Ro is all higher than 2.5%. According to the evaluation criteria of shale reservoirs, the shale formations have great potential for production.
4.2. Equipment
4.2.1. Adsorption and Desorption Experimental System
The experimental device for adsorption and desorption is designed to study the adsorption capacities of core samples, and the influence of pressure, temperature, moisture, and gas type on adsorption and desorption of gas is analyzed (shown in Figure 8).
Figure 8.

Diagram of the adsorption and desorption experimental system. 1—Sample room, 2—standard room, 3—calibration room, 4, 5—high-pressure gas cylinders, 6—vacuum pump, 7—pressure relief valve, 8–14—valve, 15—pressure transducer, 16—constant temperature water bath, 17—data acquisition system.
The adsorption capacities of gas are calculated based on the gas state equation and mass conservation equation. The isotherm adsorption curves are measured by raising the pressure value in the standard room and then making the system consisting of a sample room and standard room balanced. The isotherm desorption curves are measured by reducing the pressure value in the standard room. The system temperature is controlled by the constant temperature water bath.
4.2.2. Shale Gas Exploitation Experimental System
The experimental setup is shown in Figure 9. The experimental system consists of five parts: the power system, model system, data collection system, back pressure system, and vacuum pumping system. The standard room is connected to a high-pressure cylinder or booster pump in the left and a core holder in the right. A pump is used to provide confining pressure to the core holder. The core holder pressure is the formation pressure, and the confining pressure is overburden pressure. A backpressure regulator(BPR) is used to design different pressure decline rates. The volume of production gas is measured by the volume of discharged water. The device realizes automatic continuous measurement and control of temperature and pressure of the system and ensures the accuracy of data monitoring and measurement.
Figure 9.

Diagram of shale gas exploitation experimental system. 1—methane cylinder, 2—carbon dioxide cylinder, 3, 4, 7, 8, 10, 13, 15, 18, 22, 24—valve, 5—constant temperature system, 6—pressure gage, 9—pistons container, 11—constant-flux pump, 12—distilled water, 14—standard room, 16—vacuum pump, 17—pressure sensor, 19—sample room, 20—temperature sensor, 21—data collection system, 23—BPR, 25—NaOH, 26—distilled water, 27—measuring cylinder.
5. Experimental Methods and Procedures
5.1. Free Space Volume Calibration
As an inert gas, the adsorption of helium in rock samples can be neglected. Therefore, helium is chosen as the calibration gas, and the free space volume of rock samples is calibrated by the gas expansion method using the real gas equation of state. The calculation methods are shown in Formulas 2 and 3.
| 2 |
| 3 |
where Pa is the initial absolute pressure of standard chamber A, MPa; Pb is the initial absolute pressure of sample chamber B, MPa; P0 is the absolute pressure after equilibrium, MPa; Va is the volume of free space in sample chamber B, m3; V2 is the volume of standard chamber A, m3; Za is the gas compression coefficient when pressure is Pa; Zb is the gas compression coefficient when pressure is Pb; Z0 is the gas compression coefficient when pressure is P0.
5.2. Isothermal Adsorption and Adsorption Measurements
A part of the shale sample is pulverized to a powder, which is heated until the mass keeps constant. Then, 60 to 80 mesh powders are utilized to do the isothermal adsorption. The system is first vacuumed, airtightness is tested, and then, helium is used to calculate the void volume in the sample room.
First, the system is vacuumed by a vacuum pump again, and then the standard room is injected by some gas, and the pressure is recorded as P0. Second, the sample room is opened, some gas moves from the standard room to a sample room, and the equilibrium pressure is recorded as P1. Then, the sample room is closed, more gas is injected into the standard room to get higher equilibrium pressures. The adsorption capacity in every step is calculated by the state equation
| 4 |
Pi–1is the pressure in the standard room before balance; Pi–2 is the pressure in the sample room before balance; Pi is the balance pressure; Vref is the volume of standard room, and Vvoid is the volume of sample room.
The total adsorption capacity at Pi is
| 5 |
5.3. Depletion Production Experiment
The depletion production experiment is carried out on the basis of the shale adsorption experiment. First, shale samples are isothermally adsorbed and saturated with methane gas to simulate real shale reservoir conditions. When the adsorption process of shale sample reaches the equilibrium state (equilibrium pressure P2), the volume of methane adsorbed by shale sample is V0
| 6 |
P1 is the pressure of methane; P2 is the equilibrium pressure; Psc is the atmospheric pressure; Vh is the volume of standard room; Vφ is the volume of sample room; Z1 and Z2 are gas compressibility factors.
When the adsorption equilibrium pressure of SK1, SK2, and SK3 is about 4.5 MPa, the outlet pressure is adjusted by BPR, and the backpressure is controlled to drop uniformly at a speed of 0.05 MPa/min so that the sample can be desorbed freely. At the outlet, the amount and time of desorption of methane are recorded by the drainage method and stopwatch. The volume of desorption is recorded as V1, V2...Vn in turn, and time is T1, T2...Tn in turn. The final desorption volume is Vp
| 7 |
and the ultimate recovery of shale gas is R
| 8 |
5.4. CO2 Injection Experiments
In this part, three factors that may affect the ultimate recovery have been investigated: (1) the pressure of injection CO2, (2) the rate of injection CO2, and (3) the volume of injection of CO2. In order to separate the CH4 and CO2 in the outlet, the NaOH solution is used to absorb CO2. The discharged water is used to calculate the volume of production CH4. The experimental system is vacuumed by the vacuum pump at the beginning.
As to corresponding conditions (1), the displacement experiments of CO2 under different injection pressures are carried out on the basis of depletion production experiments. The displacement experiments of SK1, SK2, and SK3 are carried out at 30 °C. The adsorption equilibrium pressures of SK1, SK2, and SK3 are 4.5 MPa. During the experiment, CO2 gas is injected into the sample chamber by a high-pressure CO2 cylinder at constant pressure (6 and 7 MPa), and the decline rate of BPR is 0.1 MPa/min. The mixed gases of CO2 and CH4 are produced through NaOH solution and distilled water in turn, and the CH4 gas production at a certain time is recorded by the stopwatch.
As to corresponding conditions (2), the displacement experiments of shale samples SK1, SK2, and SK3 are carried out with an adsorption equilibrium pressure of 4.5 MPa and temperature of 30. During the experiment, CO2 gas is injected into the sample chamber at a constant rate (5, 10, and 20 mL/min) through the advection pump and a high-pressure piston container.
As for condition (3), in order to calculate the amount of injection CO2, the CO2 is stored in the standard room after the sample room is saturated by CH4. The injection amount is calculated by the pressure difference of the standard room. The ratio of the CO2 injection amount to the total amount of CH4 in the sample room is calculated. The pressure of the sample room is 4.5 MPa after saturating CH4.
Acknowledgments
The authors would like to acknowledge the financial support of the National Major Science and Technology Projects of China (2016ZX05025004-003), the National Natural Science Foundation of China (51234007), the Major Program of the National Natural Science Foundation of China (51991365, 51991360), the National Key R&D Program of China (2016YFC0304005), and the Innovation Funding Program of China University of Petroleum (East China) (YCX2019019).
The authors declare no competing financial interest.
References
- Dong Z.; Holditch S.; McVay D.; Ayers W. B. Global Unconventional Gas Resource Assessment. SPE Econ. Manag. 2012, 4, 222–234. 10.2118/148365-PA. [DOI] [Google Scholar]
- Qian B.; Zhang J.; Zhu J.; Fang Z.; Kou S.; Chen R. Application of Zipper-Fracturing of Horizontal Cluster Wells in the Changning Shale Gas Pilot Zone, Sichuan Basin. Nat. Gas Ind. 2015, 2, 181–184. 10.1016/j.ngib.2015.07.008. [DOI] [Google Scholar]
- Yuan J.; Luo D.; Feng L. A Review of the Technical and Economic Evaluation Techniques for Shale Gas Development. Appl. Energy 2015, 148, 49–65. 10.1016/j.apenergy.2015.03.040. [DOI] [Google Scholar]
- Jenkins C. D.; Boyer C. M. Coalbed- and Shale-Gas Reservoirs. J. Pet. Technol. 2008, 60, 92–99. 10.2118/103514-JPT. [DOI] [Google Scholar]
- Rivard C.; Lavoie D.; Lefebvre R.; Séjourné S.; Lamontagne C.; Duchesne M. An Overview of Canadian Shale Gas Production and Environmental Concerns. Int. J. Coal Geol. 2014, 126, 64–76. 10.1016/j.coal.2013.12.004. [DOI] [Google Scholar]
- Fan K.; Li Y.; Elsworth D.; Dong M.; Yin C.; Li Y.; Chen Z. Three Stages of Methane Adsorption Capacity Affected by Moisture Content. Fuel 2018, 231, 352–360. 10.1016/j.fuel.2018.05.120. [DOI] [Google Scholar]
- Liang X.; Wang G.; Xu Z.; Zhang J.; Chen Z.; Xian C.; Lu H.; Liu C.; Zhao C.; Xiong S. Comprehensive Evaluation Technology for Shale Gas Sweet Spots in the Complex Marine Mountains, South China: A Case Study from Zhaotong National Shale Gas Demonstration Zone. Nat. Gas Ind. 2016, 3, 27–36. 10.1016/j.ngib.2016.02.003. [DOI] [Google Scholar]
- Zhang S.; Pu H.; Zhao J. X. Experimental and Numerical Studies of Spontaneous Imbibition with Different Boundary Conditions: Case Studies of Middle Bakken and Berea Cores. Energy Fuels 2019, 33, 5135–5146. 10.1021/acs.energyfuels.9b00909. [DOI] [Google Scholar]
- Fan K. K.; Sun R. Y.; Elsworth D.; Dong M. Z.; Li Y. J.; Yin C. B.; Li Y. C.. Radial Permeability Measurement for Shale Using Variable Pressure Gradients. SPE Trinidad and Tobago Section Energy Resources Conference; Society of Petroleum Engineers; 2018.
- Zhang S.; Li Y.; Pu H. Studies of the Storage and Transport of Water and Oil in Organic-Rich Shale Using Vacuum Imbibition Method. Fuel 2020, 266, 117096. 10.1016/j.fuel.2020.117096. [DOI] [Google Scholar]
- Zhang S.; Pu H.; Zhao J. X. Experimental and Numerical Studies of Spontaneous Imbibition with Different Boundary Conditions: Case Studies of Middle Bakken and Berea Cores. Energy Fuels 2019, 33, 5135–5146. 10.1021/acs.energyfuels.9b00909. [DOI] [Google Scholar]
- Curtis J. B. Fractured Shale-Gas Systems. AAPG Bull. 2002, 86, 1921–1938. 10.1306/61EEDDBE-173E-11D7-8645000102C1865D. [DOI] [Google Scholar]
- Bowker K. A. Barnett Shale Gas Production, Fort Worth Basin: Issues and Discussion. AAPG Bull. 2007, 91, 523–533. 10.1306/06190606018. [DOI] [Google Scholar]
- Ren B.; Zhang L.; Huang H.; Ren S.; Chen G.; Zhang H. Performance Evaluation and Mechanisms Study of Near-Miscible CO2 Flooding in a Tight Oil Reservoir of Jilin Oilfield China. J. Nat. Gas Sci. Eng. 2015, 27, 1796–1805. 10.1016/j.jngse.2015.11.005. [DOI] [Google Scholar]
- Busch A.; Gensterblum Y. CBM and CO2-ECBM Related Sorption Processes in Coal: A Review. Int. J. Coal Geol. 2011, 87, 49–71. 10.1016/j.coal.2011.04.011. [DOI] [Google Scholar]
- Shi J.-Q.; Durucan S.; Fujioka M. A Reservoir Simulation Study of CO2 Injection and N2 Flooding at the Ishikari Coalfield CO2 Storage Pilot Project, Japan. Int. J. Greenhouse Gas Control 2008, 2, 47–57. 10.1016/S1750-5836(07)00112-0. [DOI] [Google Scholar]
- Wang L.; Cheng Y.; Wang Y. Laboratory Study of the Displacement Coalbed CH4 Process and Efficiency of CO2 and N2 Injection. Sci. World J. 2014, 2014, 1–9. 10.1155/2014/242947. [DOI] [PMC free article] [PubMed] [Google Scholar]
- Zhou F.; Hou W.; Allinson G.; Wu J.; Wang J.; Cinar Y. A Feasibility Study of ECBM Recovery and CO2 Storage for a Producing CBM Field in Southeast Qinshui Basin, China. Int. J. Greenhouse Gas Control 2013, 19, 26–40. 10.1016/j.ijggc.2013.08.011. [DOI] [Google Scholar]
- Tang X.; Ripepi N.; Valentine K. A.; Keles C.; Long T.; Gonciaruk A. Water Vapor Sorption on Marcellus Shale: Measurement, Modeling and Thermodynamic Analysis. Fuel 2017, 209, 606–614. 10.1016/j.fuel.2017.07.062. [DOI] [Google Scholar]
- Edwards R. W. J.; Celia M. A.; Bandilla K. W.; Doster F.; Kanno C. M. A Model To Estimate Carbon Dioxide Injectivity and Storage Capacity for Geological Sequestration in Shale Gas Wells. Environ. Sci. Technol. 2015, 49, 9222–9229. 10.1021/acs.est.5b01982. [DOI] [PubMed] [Google Scholar]
- Lackner K. S. CLIMATE CHANGE: A Guide to CO2 Sequestration. Science 2003, 300, 1677–1678. 10.1126/science.1079033. [DOI] [PubMed] [Google Scholar]
- Seto C. J.; McRae G. J. Reducing Risk in Basin Scale CO2 Sequestration: A Framework for Integrated Monitoring Design. Environ. Sci. Technol. 2011, 45, 845–859. 10.1021/es102240w. [DOI] [PubMed] [Google Scholar]
- Duan S.; Gu M.; Du X.; Xian X. Adsorption Equilibrium of CO2 and CH4 and Their Mixture on Sichuan Basin Shale. Energy Fuels 2016, 30, 2248–2256. 10.1021/acs.energyfuels.5b02088. [DOI] [Google Scholar]
- Wang X.; Zhai Z.; Jin X.; Wu S.; Li J.; Sun L.; Liu X. Molecular Simulation of CO2/CH4 Competitive Adsorption in Organic Matter Pores in Shale under Certain Geological Conditions. Pet. Explor. Dev. 2016, 43, 841–848. 10.1016/S1876-3804(16)30100-8. [DOI] [Google Scholar]
- Khosrokhavar R.; Wolf K.-H.; Bruining H. Sorption of CH4 and CO2 on a Carboniferous Shale from Belgium Using a Manometric Setup. Int. J. Coal Geol. 2014, 128–129, 153–161. 10.1016/j.coal.2014.04.014. [DOI] [Google Scholar]
- Khan C.; Amin R.; Madden G. Economic Modelling of CO2 Injection for Enhanced Gas Recovery and Storage: A Reservoir Simulation Study of Operational Parameters. Adv. Energy Environ. Res. 2012, 2, 65–82. 10.5539/eer.v2n2p65. [DOI] [Google Scholar]
- Moinfar A.; Sepehrnoori K.; Johns R. T.; Varavei A.. Coupled Geomechanics and Flow Simulation for an Embedded Discrete Fracture Model. SPE Reservoir Simulation Symposium; Society of Petroleum Engineers, 2013.
- Kim T. H.; Cho J.; Lee K. S. Evaluation of CO2 Injection in Shale Gas Reservoirs with Multi-Component Transport and Geomechanical Effects. Appl. Energy 2017, 190, 1195–1206. 10.1016/j.apenergy.2017.01.047. [DOI] [Google Scholar]
- Liu J.; Xie L.; Yao Y.; Gan Q.; Zhao P.; Du L. Preliminary Study of Influence Factors and Estimation Model of the Enhanced Gas Recovery Stimulated by Carbon Dioxide Utilization in Shale. ACS Sustainable Chem. Eng. 2019, 7, 20114–20125. 10.1021/acssuschemeng.9b06005. [DOI] [Google Scholar]
- Sun H.; Yao J.; Gao S.-h.; Fan D.-y.; Wang C.-c.; Sun Z.-x. Numerical Study of CO2 Enhanced Natural Gas Recovery and Sequestration in Shale Gas Reservoirs. Int. J. Greenhouse Gas Control 2013, 19, 406–419. 10.1016/j.ijggc.2013.09.011. [DOI] [Google Scholar]
- Li X.; Elsworth D. Geomechanics of CO2 Enhanced Shale Gas Recovery. J. Nat. Gas Sci. Eng. 2015, 26, 1607–1619. 10.1016/j.jngse.2014.08.010. [DOI] [Google Scholar]
- Bacon D. H.; Yonkofski C. M. R.; Schaef H. T.; White M. D.; McGrail B. P. CO2 Storage by Sorption on Organic Matter and Clay in Gas Shale. J. Unconv. Oil Gas Resour. 2015, 12, 123–133. 10.1016/j.juogr.2015.09.004. [DOI] [Google Scholar]
- Liu F.; Ellett K.; Xiao Y.; Rupp J. A. Assessing the Feasibility of CO2 Storage in the New Albany Shale (Devonian–Mississippian) with Potential Enhanced Gas Recovery Using Reservoir Simulation. Int. J. Greenhouse Gas Control 2013, 17, 111–126. 10.1016/j.ijggc.2013.04.018. [DOI] [Google Scholar]
- Sang Q.; Li Y.; Zhu C.; Zhang S.; Dong M. Experimental Investigation of Shale Gas Production with Different Pressure Depletion Schemes. Fuel 2016, 186, 293–304. 10.1016/j.fuel.2016.08.057. [DOI] [Google Scholar]