Abstract
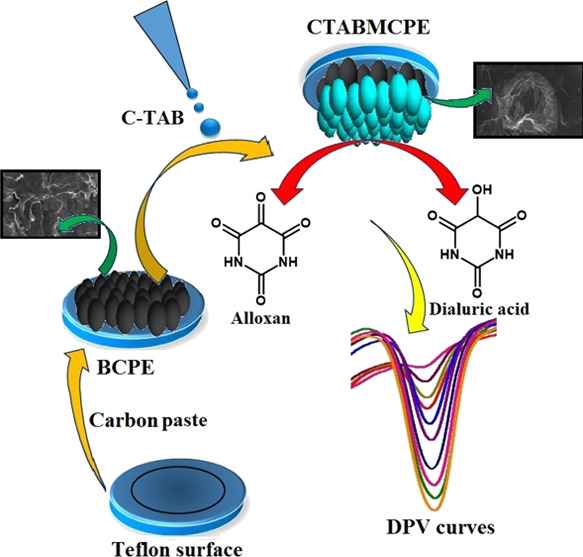
Alloxan (AL) is a toxic glucose analogue that acts as a potent diabetogenic inducer by selectively destroying the insulin-producing β-cells of the pancreas. Hence, a sensitive and selective cetyl trimethylammonium bromide (CTAB)-immobilized carbon paste electrode was utilized for the analysis of AL in the existence of anthrone. The CTAB-modified carbon paste electrode in contrast with the bare carbon paste electrode showed a magnificent behavior for the electrocatalytic oxidation of AL by cyclic voltammetry (CV) and differential pulse voltammetry (DPV) methods. CV studies reveal a quasi-reversible diffusion-controlled process in the potential window of −0.5 to 0.4 V at an optimum pH of 6.5 in 0.2 M phosphate buffer solution. The electrode materials were characterized by CV, field emission-scanning electron microscopy, and electrochemical impedance spectroscopy. Under optimized experimental conditions, low detection limits of 1.09 and 3.64 μM were obtained in a linear dynamic range of 5–80 μM and from 8 to 90 μM by DPV and CV methods, respectively. The performance of the modified electrode is impressive in terms of least charge transfer resistance (Rct), surface concentration (Γ), and heterogeneous electron transfer rate constant (k0). A 50-fold excess concentration of other potential interferants such as food additives and other organic species present in the human body does not significantly alter the peak potential and peak current of AL. The analytical application of the modified sensor was appraised by determining AL in the spiked refined flour sample. The modified sensor with a swift fabrication procedure exhibited enduring stability, adequate reproducibility, and acceptable repeatability.
1. Introduction
Alloxan (AL) (pyrimidine-2,4,5,6-tetrone) is a carcinogenic and cytotoxic glucose analogue that persuades as a potent diabetogenic agent, which selectively damages insulin-producing pancreatic β-cells.1 It is assumed that because of the uptake of AL by pancreatic β-cells, it comes in contact with the reducing agent such as reduced glutathione, which is present in eukaryotic cells. Because of the interaction between AL and reducing species such as glutathione, reactive oxygen species will be formed, which can be assigned to the cytotoxic nature of AL potentially leading to selective necrosis of β-cells.2,3 However, the concurrent existence of reducing agents such as glutathione and AL, which creates a redox cycle where AL is reduced to dialuric acid, which then endures autoxidation back to AL in the presence of suitable electron acceptors such as oxygen.4 As a ramification of this redox cycling, reactive oxygen species such as superoxide radical anion (O2–), hydroxyl radical (OH), hydrogen peroxide (H2O2), and the oxidized form of glutathione will be formed. Because the catalase activity is very low in pancreas, H2O2 accumulates and in the existence of a ferrous ion chelate, Fenton-reaction takes place where extremely reactive hydroxyl radicals (OH) are formed. Hydroxyl radical is apparently considered to be the potent cause for toxicity of insulin-producing β-cell and AL diabetogenicity.5 Foods made from refined flour are tainted with AL and they are considered to be the leading cause for diabetes. Generally, wheat flour is yellow in color and because of its less sticky and hard nature, it is difficult to use it in bakery products. With an intention of overcoming this problem, the food industry uses bleaching agents. Saiz et al.6 reported the use of benzoyl peroxide, Hamill et al.7 reported the use of nitrogen peroxide and nitrosyl chlorides while Al-Dmoor et al.8 reported the use of chlorine gas as bleaching agents to improve its texture and as a result of which AL will be formed as a by-product. AL enters into the human body on consuming these bakery products made out of bleached flour and becomes a target of AL-induced diabetes. The expected amount of AL limit in the human blood is 1.5 μg/mL9 but with the increase in AL content, it leads to AL-diabetes, which in turn causes weight loss, polyuria, ketonuria, and polydipsia.9,10 Hence, it is imperative to develop a sensitive, efficient, simple, and cost-effective technique for the determination of AL. Research enthusiasts have given ample consideration for developing methods to quantitatively determine bioactive substances such as AL in food products. Goyal et al.11 used HPLC, Raghavamenon et al.12 used fluorometric high performance liquid chromatography, Zheng13 developed spectrophotometric method while Shpigun et al.14 used flow injection method and Murthy et al.15 used electrochemical techniques. Electrochemical techniques prove to be the most optimistic approach because of its ability to determine analyte levels up to the picomolar range and its automation at nominal cost in comparison with other instruments. Experimental output of electroanalytical techniques is not affected by the color, turbidity, and suspension. Because of its rapid rate of analysis, flexibility and convenience to handle in available working condition makes it a suitable tool for the analysis of the exclusive range of pharmaceutical samples, biologically active moieties, food samples, and water and soil analysis. Simplicity, efficiency and ecofriendliness in comparison with other methods reported makes it a desirable method for the determination of AL.16,17
In the present study, we have described a modest and effectual electrochemical technique for the quantitative determination of AL by using a surfactant-modified carbon paste electrode in conjunction with cyclic voltammetry (CV) and differential pulse voltammetry (DPV) methods. Carbon paste electrodes are explored as more appreciated electrode materials since eternities because of their nontoxic nature, cost efficiency, and its effortless accessibility. The mechanical properties such as less mass density, exceptional endurance to chemicals, thermal stability, low residual current in inclusive potential window, and facile modification of the electrode surface makes carbon paste electrodes the most preferred electrode material.18−20
Surfactant molecules that are amphiphilic in character, with a hydrophilic group that is compatible with water in one end and a long hydrophobic tail that is compatible with oil in the other end. These surface-active agents have the capacity to change the electrochemical process at the electrode and solution interface.21 Assimilation of the surfactant on the surface of the electrode forms an adsorptive layer, which aggregates the electron allocation, enhances the peak current, and amends the redox potential along with changing the stability of electrogenerated intermediates and electrochemical product.22,23 The influence of different surfactants such as sodium dodecyl sulfate (SDS), Triton-X 100 (TX-100), and cetyl trimethylammonium bromide (CTAB) on the redox behavior of AL are studied in this work. It was demonstrated that with a synergistic adsorption mechanism, the cationic surfactant CTAB combines with the substrate in convinced forms and displays distinct enhancement effect on the redox current of AL. It was assumed that CTAB formed a compact monolayer on the electrode surface with high density of positive charges focusing on the exterior of the electrode surface.24,25 In this work, the electrochemical behavior of AL was investigated at CTAB-modified carbon paste electrode (CTABMCPE) and analytical performance of the modified electrode was scrutinized by estimating AL in real samples. Interference studies was carried out and CTABMCPE was deliberated to portray exceptional sensitivity and selectivity toward AL.
2. Results and Discussions
2.1. Surface Characterization of BCPE and CTABMCPE by FESEM and EIS
In an attempt to relate the voltammetry response to surface topography, field emission-scanning electron microscopy (FESEM) images of the CTABMCPE and bare carbon paste electrode (BCPE) were recorded. Figure 1A shows the FESEM image of the BCPE and Figure 1B shows the image of the CTABMCPE. The surface of the BCPE is predominant with graphite flakes, which is more permeable for adsorption of the surfactant.26 The surface modification was successfully established in the CTABMCPE proving the development of active sites, which fills the space between graphite flakes due to adsorption of the surfactant on the surface of the carbon paste electrode.
Figure 1.
(A) FESEM depiction of the BCPE. (B) FESEM depiction of the CTABMCPE.
The surface modification mechanism is supported by electrochemical impedance spectroscopy (EIS) studies, which is based on electron transfer resistance (Rct). In this work, Rct values of the BCPE and CTABMCPE were studied using 1 mM K4[Fe (CN)6] solution containing 0.1 M KCl. Figure 2 shows the Nyquist diagram where the diameter of the semicircle is proportional to the charge transfer resistance (Rct), and the linear portion is correlated to the diffusion process.27,28 From the diagram, it is clear that the CTABMCPE [curve (b)] exhibits smaller semicircle in comparison with the BCPE [curve (a)], indicating that the CTABMCPE has high conductivity. The Rct value of 59.50 kΩ for the BCPE underpins the low electron transfer rate, whereas the CTABMCPE shows a Rct value 9.30 kΩ indicating the synergistic effect of conductivity due to CTAB adsorbed layer promoting a rapid electron transfer in the redox probe.
Figure 2.
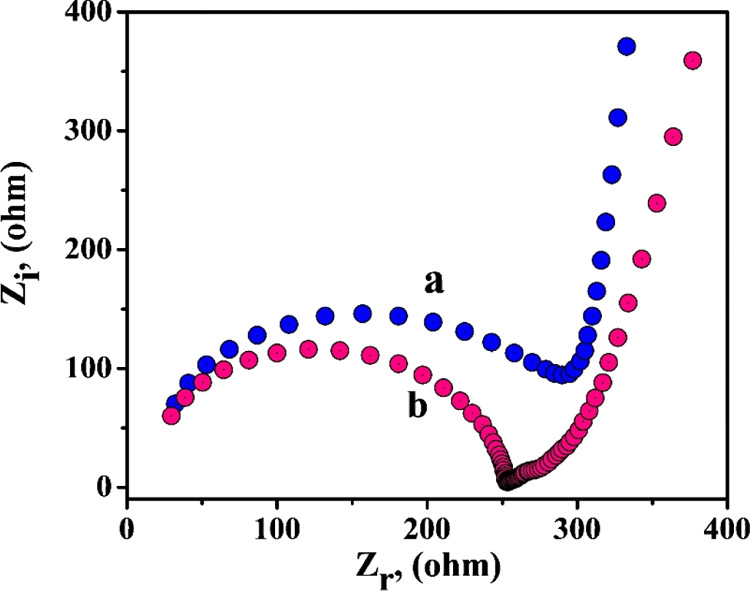
Nyquist diagrams of EIS of the BCPE [curve (a)] and the CTABMCPE [curve (b)].
2.2. Evaluation of Electrode Surface Area
CV of 1 mM K4 [Fe (CN)6] as an electrochemical redox probe in 0.1 M KCl on a CTABMCPE (curve a) and BCPE [curve (b)] are shown in Figure 3. It is clear from Figure 3 that the CTABMCPE displays stable enhancement in current response, indicating that the electrochemical active sites of the CPE increased on surface modification by the surfactant. The largest current response at the CTABMCPE (Ipa = 27.78 μA) in comparison to the BCPE (Ipa = 12.44 μA) is ascribed to electrocatalytic activity and enhancement in surface area because of surface modification. The electroactive surface area of the BCPE and CTABMCPE was analyzed by CV using 1 mM K4 [Fe (CN)6] as an electrochemical redox probe in 0.1 M KCl at diverse scan rates. Figure 4A shows the voltammograms of the BCPE and Figure 4B shows the voltammograms of the CTABMCPE. From Figure 4A,B it is clear that the oxidation and reduction potential shifts to more positive and more negative sides along with the linear enhancement in the redox peak current with the increase in the scan rate from 0.1 to 0.2 V/s.29 The plot of Ipa versus v1/2 (Figure 4C) shows linearity with R2 value of 0.9935 for the BCPE and 0.9964 for the CTABMCPE. The active surface area of the electrodes was estimated considering the slope of Ipa versus v1/2 based on the Randles–Sevcik equation
| 1 |
Ipa: anodic peak current, n: number of electrons exchanged during the redox process is presumed to be equal to one, A: surface area of electrode, Co: concentration of the redox probe, D: diffusion coefficient assumed to be equal to 7.6 × 10⁻⁶ cm2 s–1, v1/2: square root of scan rate in V/s. The microscopic electroactive surface area is maximum for the CTABMCPE (0.037 cm2) in comparison with the BCPE (0.027 cm2).30
Figure 3.
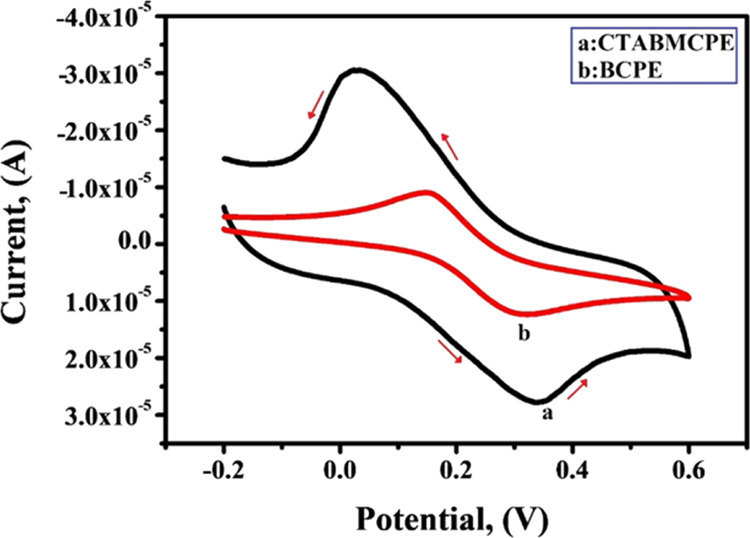
CV response of 1 mM K4[Fe (CN)6] at the CTABMCPE [curve (a)] and BCPE [curve (b)] at the scan rate of 0.1 V/s.
Figure 4.
(A) Cyclic voltammograms of 1 mM K4[Fe(CN)6] in 0.1 M KCl at the BCPE by varying scan rates (0.1–0.2 V/s) (B) Cyclic voltammograms obtained for the CTABMCPE in the same electrolytic solution at different scan rates (0.1–0.2 V/s) (C) Plot of Ipa vs v1/2.
2.3. Optimization of the Surfactant on the Electrode Surface
The influence of the surfactant on the peak current of AL was analyzed by immobilizing CTAB (cationic surfactant), SDS (anionic surfactant), and TX-100 (non-ionic surfactant). Even at trace levels, surfactant molecules will have significant impact on the electrooxidation process. Surfactant molecules reduce the surface tension at the interface and allow the molecule to spread effortlessly.31−33 The type and amount of surfactant will have a substantial impact on the peak current, peak potential, and extent of the electrooxidation process. Among the three surfactants used in the present work, it is obvious from Figure 5B in the inset that SDS and TX-100 portrayed diminished peak intensity while CTAB displayed healthier electrochemical response by enhancing the peak current intensity. The pivotal reason behind this is the head groups and the alkyl chains length of the surfactants. The surfactant molecules aggregate the species with alike charges and repel the species with like charges. It is assumed that because in our optimum pH range AL exists in anionic form, SDS may repel and TX-100 may hinder the formation of the adsorb layer. CTAB enhances the polarity on the exterior surface of the CPE, as an outcome of which the enhancement of current signals is observed, and hence CTAB was considered for our successive work.34,35
Figure 5.
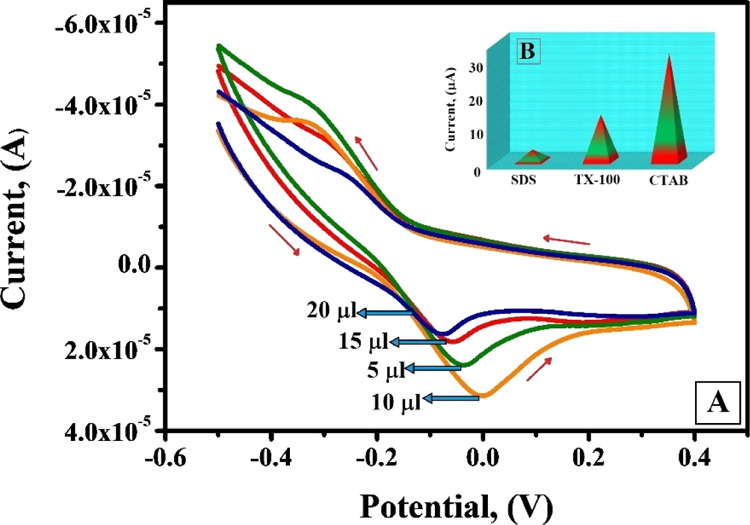
(A) Cyclic voltammograms of AL (1 × 10⁻³ M) at the CTABMCPE in 0.2 M PBS, pH 6.5, (v = 0.1 V/s) for different amounts of CTAB (5–20 μL) (B) Plot of different surfactants (SDS, TX-100, CTAB) vs Ipa (μA) (figure in the inset).
The performance of the fabricated sensor was examined by changing the concentrations of CTAB between 5 and 20 μL and the voltammetric response is shown in Figure 5A. The peak current response of the fabricated sensor increased gradually with the increase in immobilization concentration of CTAB from 5 to 10 μL and after reaching the saturation level at 10 μL further addition in the immobilization concentration of the surfactant diminishes the peak current response. Hence, it can be resolved that the amount of CTAB adsorption reaches a maximum value at 10 μL and further increase in immobilization concentration of CTAB on the CPE does not improve the adsorption of CTAB.36,37 After that, CTAB reaches its critical micelle concentration and there will be a corresponding decrease in free CTAB molecules for adsorption. Therefore, 10 μL was considered as the optimum immobilization concentration of CTAB to modify the BCPE into CTABMCPE.
2.4. Accumulation Time
Accumulation time (ACT) can potentially enhance the amount of adsorption of AL, as a consequence of which enhancement in peak current sensitivity is observed. Voltammetric responses (Figure 6A) at different ACT ranging from 5 to 30 s were obtained through CV technique in pH 6.5 phosphate buffer solution (PBS) at a scan rate of 0.1 V/s. In order to fulfil the objective of swift detection, the range of ACT was kept below 30 s. From Figure 6B, it is clear that ACT of 5 s shows the highest current sensitivity and with the further increase in ACT up to 30 s, the current sensitivity showed a steady decline.38,39 A full surface coverage is obtained at 5 s where a stable and high current sensitivity response was observed. Hence, it is apparent that the method employed in this work is accomplished to detect the target ion in 5 s and was considered as the optimum ACT.
Figure 6.
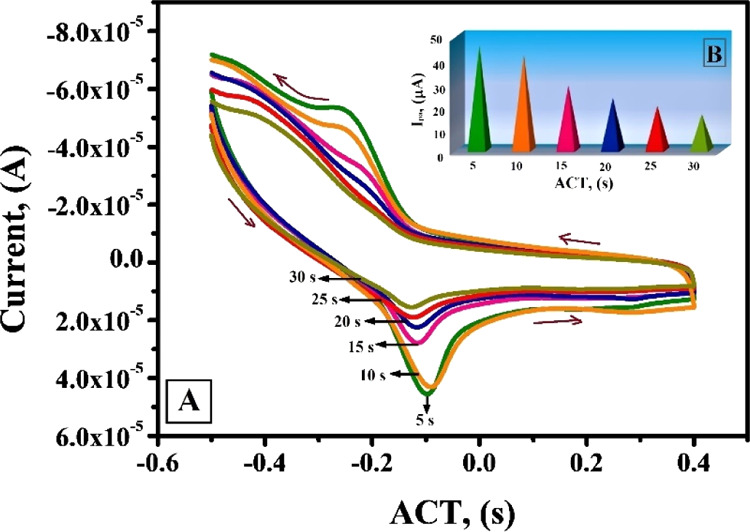
(A) CV test for optimization of ACT from 5 to 30 s at the CTABMCPE in 0.2 M PBS, pH 6.5 (v = 0.1 V/s) (B) plot of Ipa vs ACT under optimum condition.
2.5. Effect of pH
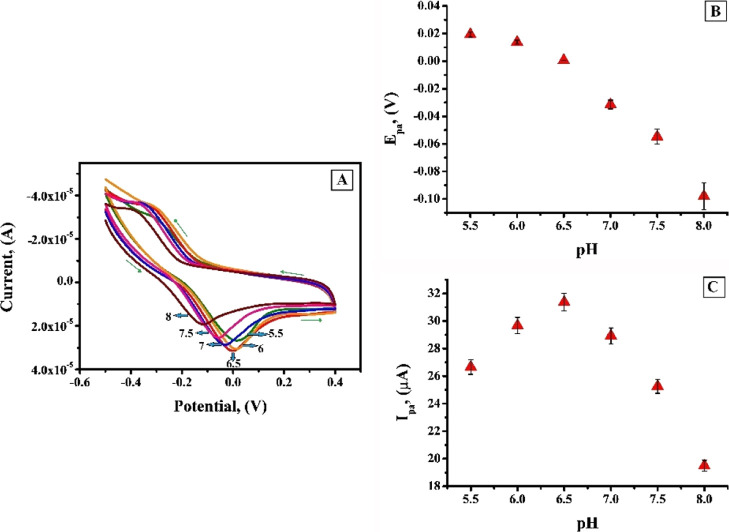
The redox peak current of analyte has a close proximity with the pH of electrolytic solution because proton is always involved in the electrochemical reaction of an organic compound. Sharper response accompanied with intense sensitivity can be obtained by optimizing the pH of the supporting electrolyte.40−42 In order to ascertain the voltammetric response of AL at the CTABMCPE, pH of 0.2 M PBS was varied from 5.5 to 8 (Figure 7A) where a sharp oxidation peak and a weak broad redox peak with diminished current sensitivity was observed. Figure 7A clearly shows that anodic peak potential (Epa) linearly shifts to cathodic direction during the change in pH from acidic to basic. The plot of Epa versus pH (Figure 7B) evidently specifies that Epa linearly depends on pH values with equation Epa (V) = −0.0510 pH + 0.0310 and correlation coefficient; R2 = 0.9872. The slope of 0.0510 is near to theoretical value, which recommend that the number of electrons transferred is equal to number of protons in the electrode reaction.43 The anodic peak current (Ipa) increased gradually from pH 5.5 to 6.5 and with the further increase in pH from 6.5 to 8, the oxidation peak current conversely decreased (Figure 7C). From the plot of Ipa versus pH it is clear that the finest outcome with respect to sensitivity escorted with sharper response was obtained at pH 6.5, which is assumed to be due to the faster rate of electron transfer and imperative interaction between AL and the CTABMCPE. Hence, pH 6.5 was designated for further analysis. The number of electrons exchanged “n” can be calculated by eq 2:44
| 2 |
Figure 7.
(A) CV response of 1 × 10⁻³ M AL at the CTABMCPE in 0.2 M PBS of pH in the range 5.5–8.0 at the scan rate of 0.1 V/s (B) plot of the anodic peak potential (Epa) vs pH (C) graph of oxidation peak current (Ipa) versus pH of solution.
Calculated value on “n” by using eq 2 is found to be 1.89, which is considered to be equal to 2. Epa and Epa/2 are anodic potential and half-wave anodic potential, respectively, R, T, and F have their own physical significance, “α” the charge transfer coefficient is calculated to be equal to 0.23 by Bard and Faulkner eq 3.
| 3 |
The calculated value of surface concentration (Γ) by using eq 4 was found to be 2.71 nmol/cm2.
| 4 |
Q is the integrated charge from the area of CV peak under optimum condition, A is surface area of the electrode, F is Faradays constant, n is number of electrons.
2.6. Electrochemical Behavior of AL
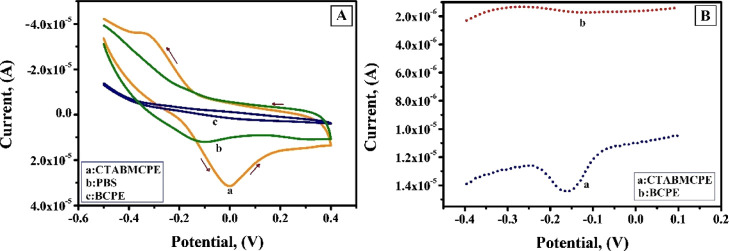
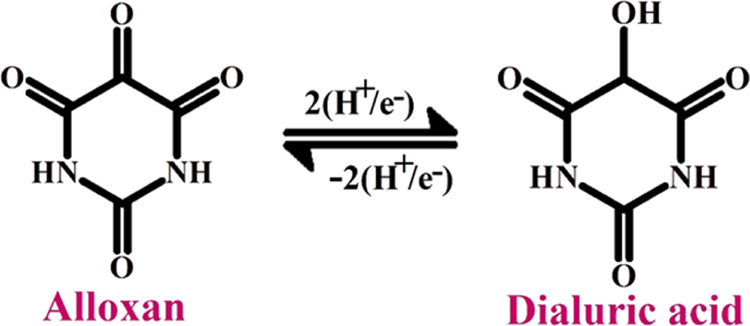
CV and DPV studies are used to determine the redox behavior of AL in 0.2 M PBS of pH 6.5 at a scan rate of 0.1 V/s. Figure 8A shows the voltammetric behavior of 1 × 10⁻³ M AL at the surface of the CTABMCPE [curve (a)], BCPE [curve (c)], and curve (b) depicts the voltammogram of only 0.2 M PBS in a potential window of −0.5 to 0.4 V. The absence of voltammetric peaks for blank [curve (b)] at the CTABMCPE indicates its electrochemical inertness in the potential window of attention. AL shows a well-defined oxidation peak at a potential of −0.0105 V (Ipa = 38.37 μA) and a weak plateau-kind reduction peak at a potential of −0.3260 V (Ipc = −35.85 μA) at the CTABMCPE; on the contrary, the BCPE under identical conditions displays redox peak with low current signal. The substantial increase in the peak current with a sharper and well-defined peak at the CTABMCPE reflects the faster electron transfer kinetics due to the presence of the CTAB film, which enlarges the surface area of the electrode in comparison with the BCPE where there is low rate of electron transfer. The cathodic peak is because of the reduction of AL to dialuric acid and the anodic peak is attributed to be the oxidation of dialuric acid to AL. The probable mechanism is depicted in Scheme 1.45Figure 8B shows the DPV, which shows the electrochemical behavior of AL under optimum condition at the CTABMCPE [curve (a)] and at the BCPE [curve (b)]. The enhanced peak current is observed at the CTABMCPE [curve (a)] in contrary to the BCPE [curve (b)] that shows a diminished peak current.
Figure 8.
(A) CV response of 1 × 10⁻³ M AL at the CTABMCPE [curve (a)], BCPE [curve (c)], and only PBS [curve (b)] at a scan rate of 0.1 V/s in 0.2 M PBS (B) DPV response of 1 × 10⁻³ M AL at the CTABMCPE [curve (a)] and at the BCPE [curve (b)] under optimum condition.
Scheme 1. Probable Reaction Mechanism of AL.
2.7. Effect of Concentration of AL on Peak Current
Quantitative analysis of AL was accomplished by recording the DPV and CV under optimized condition by varying the concentration from 2 to 100 μM. From the DPV (figure in the inset of Figure 9A) obtained, it is obvious that the peak current shows enhancement with the increase in concentration. Using the optimized conditions, linear calibration plot (Figure 9A) was obtained with the increase in the concentration of AL from 5 to 80 μM. The linear equation was Ipa (μA) = 9.6000 × 10⁻⁶ + 0.0480 [AL] (M); (R2 = 0.9964). From the obtained data, detection limit (LOD) and quantification limit (LOQ) at the surface of the CTABMCPE were estimated to be 1.09 and 3.64 μM, respectively. (LOD = 3S/N, LOQ = 10 S/N where S is the standard deviation of the peak current of blank and N represents the slope of the calibration plot).46Figure 9B shows the linear calibration plot obtained under optimized condition for the anodic peak current of AL versus concentration change of AL in the range of 8–90 μM by CV technique at the CTABMCPE. Figure 9B shows that the peak current shows an upsurge with the increase in the concentration of AL. The linearity is stated by the subsequent equation: Ipa (μA) = 1.1260 × 10⁻⁵ + 0.1004 [AL] (M); (R2 = 0.9955). From the data obtained, calculated value of LOD and LOQ by CV was found to be 3.64 and 13.1 μM, respectively.
Figure 9.
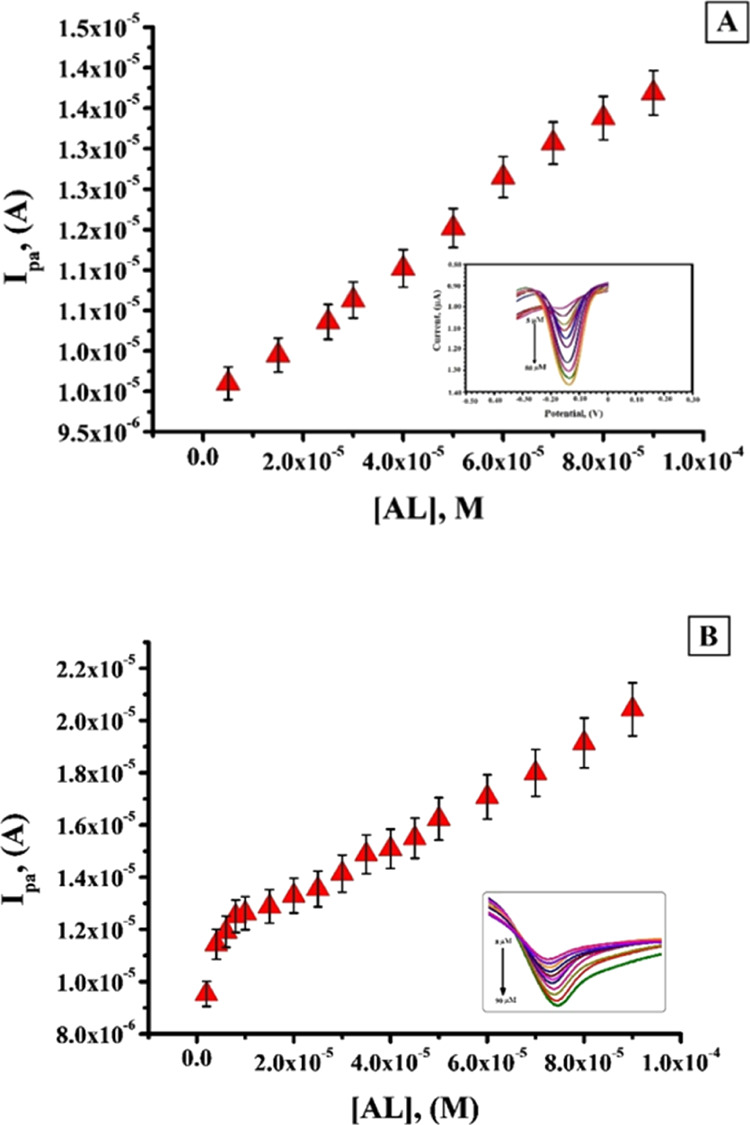
(A) Calibration plot for AL at the CTABMCPE in 0.2 M PBS of pH 6.5 at a scan rate of 0.1 V/s (inset) DPV curve for the variation of concentration of 1 × 10⁻³ M AL in 0.2 M PBS of pH 6.5 at the CTABMCPE (B) Calibration plot for AL at the CTABMCPE in 0.2 M PBS of pH 6.5 at a scan rate of 0.1 V/s.
The obtained values of LOD are comparable with the values obtained in the literature and it is depicted in Table 1.
Table 1. Comparison of the LOD Values of the CTABMCPE with Previously Reported Sensor for Voltammetric Quantization of AL.
2.8. Effect of the Scan Rate
The electrochemical properties of the CTABMCPE on the redox peak of AL was examined by CV at pH 6.5 in the potential window of −0.5 to 0.4 V by increasing the scan rate from 0.050 to 0.250 V/s. From the voltammograms (Figure 10A) obtained, it is clear that the peak current increases with the increase of the scan rate where both the anodic peak potential and cathodic peak potential shifts toward more positive and negative side, respectively, indicating that the redox action of AL is quasi-reversible.47,48 As shown in Figure 10B, a linear dependence of the anodic peak current (Ipa) with the square root of the scan rate (v1/2) is observed, which recommends that the electrode reaction is a diffusion-controlled process and the linearity equation can be stated as Ipa (μA) = −0.4588 + 121.55v1/2 (V/s); R2 = 0.9963. Figure 10C shows the plot of log Ipa versus log v, which shows linearity (R2 = 0.9970) with a slope of 0.53, which is in close proximity with theoretical value of 0.5 for the diffusion-controlled process. Further, the plot of anodic peak potential (Epa) versus log v (Figure 10D) was investigated. The regression equation is expressed as follows: Epa = 0.1876 + 0.1893 log v; R2=0.9974.
Figure 10.
(A) CV response of 1 × 10⁻³ M AL at the CTABMCPE in pH 6.5 at various scan rates from (0.05 to 0.250 V/s) (B) plot of Ipa vs v1/2 (C) Plot of log Ipa vs log v (D) plot of Epa vs log v.
The electron transfer rate constant (k0) at the interface of the electrode and electrolytic solution is the primary preference and is calculated by using eq 5(49)
| 5 |
Epa symbolizes the anodic peak potential, Epa/2 symbolizes the potential where the current is half the peak value, v represents the scan rate, and k0 is the rate constant that was calculated to be 3.17 × 10⁻³ s–1.
2.9. Simultaneous Determination of AL and AN by DPV
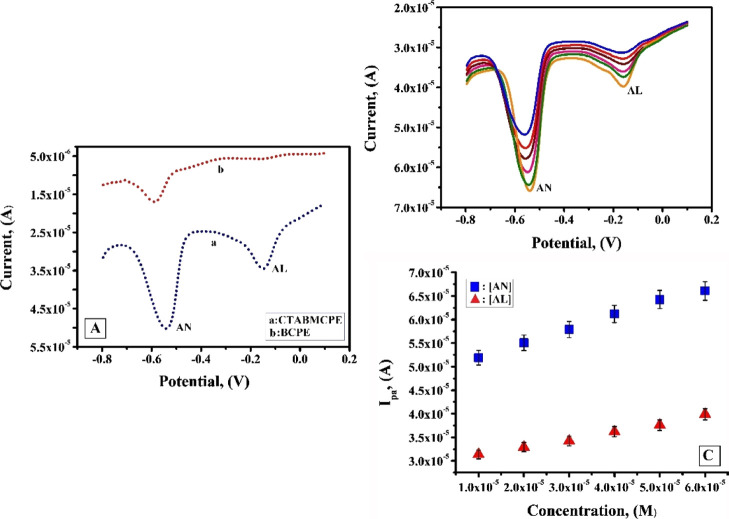
One of the main objectives of this study is to analyze the explicitness of the modified electrode and its sensing ability in selectively determining AL that is a cytotoxic glucose analogue and anthrone (AN) that is used in the quantitative estimation of carbohydrate. AN is also used as a laxative and long-term exposure to AN can cause respiratory tract disorders in human.50 So the CTABMCPE was used to do the concurrent determination of 1 × 10 –3 M solutions of AL and AN under optimized condition of pH 6.5 in 0.2 M PBS at a scan rate of 0.1 V/s. Figure 11A shows the voltammetric response for the concurrent determination of AN and AL at the CTABMCPE [curve (a)] and at the BCPE [curve (b)]. BCPE shows diminished current sensitivity, and on the contrary, under the identical condition, the CTABMCPE shows two secluded oxidation peaks with a peak separation of 0.39 V. AN confirms an enhanced current sensitivity of 50. 21 μA at a potential of −0.54 V and AL depicts a current sensitivity of 34.58 μA at a potential of −0.15 V. Figure 11B shows the DPV obtained by simultaneously changing the concentration of AN and AL. The peak current displays a linear upsurge with the surge in the concentration of AN and AL from 100 to 600 μM under optimized condition. The plot of peak current variation of AN and AL versus concentration variation of AN and AL (Figure 11C) shows linearity with correlation coefficient of 0.9975 and 0.9966 respectively. The sensitivity of the modified electrode for the detection of AL in the absence and in the company of AN were almost the same, which demonstrates that the oxidation process of AL at the CTABMCPE are independent. Hence, the CTABMCPE can be used for the independent measurement of AN and AL without any interference.
Figure 11.
(A) DPV response for simultaneous determination of AL and AN (1 × 10⁻³ M) at the CTABMCPE [curve (a)] and BCPE [curve (b)] in 0.2 M PBS of pH 6.5 at a scan rate of 0.1 V/s (B) DPV response for interference analysis with varying concentration from 100 to 600 μM of AL and AN in 0.2 M PBS of pH 6.5 at a scan rate of 0.1 V/s (C) Plot of Ipa vs concentration variation of AL and AN under optimum condition.
2.10. Interference Studies
Interference studies were performed under optimum condition in the presence of various potentially interfering substances whose concentrations were 50 times higher than the concentration of AL (1 × 10⁻³ M). The addition of food additives such as vanillin and sodium benzoate and food coloring agents such as carmine, amaranth, acid yellow 23, and tartrazine caused no significant influence on the DPV response of AL. The addition of certain organic species such as estriol, tyrosine, uric acid, and folic acid do not alter the peak current and peak potential of AL. These outcomes specify that the CTABMCPE with a high interference withstanding ability permits a selective surface for the detection of AL.51
2.11. Examination of Reproducibility, Repeatability, and Stability of the CTABMCPE
Sensing performance of the modified electrode can be appraised by evaluating reproducibility, repeatability, and stability. Five modified electrodes were fabricated independently by the same procedure and CV response of 1 × 10⁻³ M AL was recorded under optimized condition. The relative standard deviation (RSD) was 4.34% with a stable reproducible peak. Repeatability of the modified electrode was evaluated by running five sequential CV cycles using the same electrode, which gives an RSD of 3.68% suggesting that the modified electrode can be used for more measurements. The stability of the modified electrode was analyzed by running 30 successive CV cycles under optimum condition and it was noticed that 95.2% of the initial current was retained, which manifests that the modified electrode is stable.
2.12. Real Sample Analysis
CTABMCPE was used for the analysis of AL in the refined flour sample to prove its viability in real sample analysis. The sample was dissolved in water and centrifuged, and later, the centrifugate was spiked with an equivalent amount of AL as used in stock solution.52,53 The resultant solution was added by the standard addition method and DPV (Figure 12) was recorded after each run under optimized condition in 0.2 PBS of pH 6.5. The recovery for the procured real sample was found to be in the range of 96.74–99.16%, which provides an authentication that the fabricated sensor is a reliable tool for real sample analysis. Experimental data are tabulated in Table 2.
Figure 12.
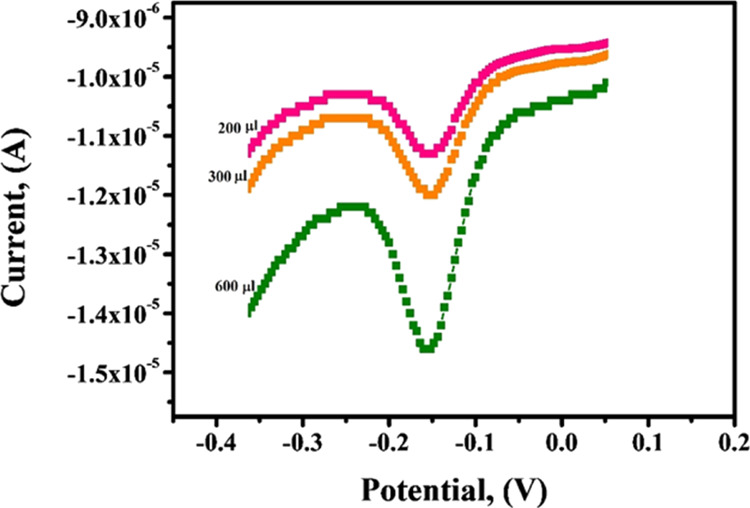
DPV obtained for the variation of peak current with variation of the spiked real sample of AL at the CTABMCPE under optimized experimental parameters in the real sample.
Table 2. Estimation of Al in Spiked Refined Flour Sample.
| sample | added (10–5 M) | found (10–5 M) | recovery (%) |
|---|---|---|---|
| refined flour | 20 | 19.34 | 96.70 |
| 30 | 29.74 | 99.13 | |
| 60 | 58.86 | 98.10 |
3. Conclusions
The present work demonstrates the construction of a facile and versatile CTABMCPE for the sensitive and selective trace level detection of AL individually and simultaneously in 0.2 M PBS of pH 6.5. The electrochemical behavior of AL at the modified electrode was studied by CV and DPV techniques where the fabricated sensor exhibited highest sensitivity (Ipa = 38.37 μA, Ipc = −35.85 μA) in comparison with the BCPE, which displays low current signal. Surface morphological studies were done by CV, FESEM, and EIS techniques. Trace amount of the surfactant was sufficient to bring about an excellent electrocatalytic response with a LOD value of 1.09 and 3.64 μM by the DPV and CV method, respectively. Fifty fold excess concentration of other interferants such as food additives and other organic species did not interfere in the determination of AL. The performance and efficacy of the AL sensor was evaluated and found satisfactory in terms of repeatability, reproducibility, and stability. Recovery range for real sample analysis was found to be in between 96.70 and 99.13%. Henceforth, with a less expensive fabrication procedure and quick effectual response in comparison with other techniques for similar application, which makes the CTABMCPE an effective tool for the determination of AL in various matrices.
4. Materials and Methods
4.1. Apparatus and Procedure
Voltammetry experiments were executed by using the electrochemical analyzer model CHI6038E from the USA. All of the experiments were performed in a conventional three electrode cell with a CTABMCPE of 3 mm diameter as working electrode, calomel electrode saturated with KCl as the reference electrode (Equiptronics, Mumbai) and a platinum wire (Equiptronics, Mumbai) that acts as an auxiliary electrode. FE-SEM data for the surface characterization of the BCPE and CTABMCPE were obtained from the DST-PURSE Laboratory, Mangalore University, India. Carbon paste electrode was prepared by optimizing the ratio of graphite powder and binder in the proportion of 70:30 (w/w) methodically to get a homogeneous mixture in the agate mortar using a pestle. The resultant homogeneous mixture was then securely filled into the cave of the Teflon tube and rubbed on a tissue paper to get an even surface of the BCPE. The contact with the external circuit is established by the copper wire implanted into the Teflon tube. Surfactant CTAB (10 μL) was dropped onto the surface of the BCPE by a microinjector and left for 5 min where maximum adsorption of the surfactant on the electrode surface takes place, after which the unadsorbed surfactants were rinsed with distilled water.
4.2. Chemicals and Reagents
Analytical grade AL, SDS, TX-100, CTAB, graphite powder, silicone oil, monosodium dihydrogen phosphate, and disodium hydrogen phosphate were obtained from Nice Chemicals, Cochin, India. AN from Molychem, Mumbai, India. The 25 × 10–4 M solutions of SDS, TX-100, CTAB were prepared in double-distilled water. The 1 × 10⁻³ M stock solution of AL and AN were prepared by dissolving it in double-distilled water and acetone, respectively. PBS solution (0.2 M) used as a supporting electrolyte was prepared by mixing the required quantity of NaH2PO4 (0.2 M) and Na2HPO4 (0.2 M). For real sample analysis, refined flour sample was purchased from the local market. Weighed quantity of the sample was suspended in the measured amount of water with frequent stirring for 30 min. The solution was centrifuged and the centrifugate was collected for the analysis.
Acknowledgments
The authors would like to thank the reviewers for their valuable suggestions.
The authors declare no competing financial interest.
Notes
No ethical issues for this work
References
- Korzhenevskiy D. A.; Selischeva A. A.; Saveliev S. V. Measurement of Endogenous Alloxan in Human Blood. Biochem. Suppl. Ser. B: Biomed. Chem. 2009, 3, 404–407. 10.1134/s199075080904012x. [DOI] [Google Scholar]
- Lucchesi A. N.; Cassettari L. L.; Spadella C. T. Alloxan-Induced Diabetes Causes Morphological and Ultrastructural Changes in Rat Liver that Resemble the Natural History of Chronic Fatty Liver Disease in Humans. J. Diabetes Res. 2015, 2015, 494578. 10.1155/2015/494578. [DOI] [PMC free article] [PubMed] [Google Scholar]
- Brömme H.-J.; Ebelt H.; Peschke D.; Peschke E. Alloxan acts as a prooxidant only under reducing conditions: influence of melatonin. Cell. Mol. Life Sci. 1999, 55, 487–493. 10.1007/s000180050305. [DOI] [PMC free article] [PubMed] [Google Scholar]
- Weinandy R.; Peschke D.; Peschke E. Simultaneous Quantitative Determination of Alloxan, GSH and GSSG by HPLC. Estimation of the Frequency of Redox Cycling Between Alloxan and Dialuric Acid. Horm. Metab. Res. 2001, 33, 106–109. 10.1055/s-2001-12402. [DOI] [PubMed] [Google Scholar]
- Ighodaro O. M.; Adeosun A. M.; Akinloye O. A. Alloxan-induced diabetes, a common model for evaluating the glycemic-control potential of therapeutic compounds and plants extracts in experimental studies. Medicina 2017, 53, 365. 10.1016/j.medici.2018.02.001. [DOI] [PubMed] [Google Scholar]
- Saiz A. I.; Manrique G. D.; Fritz R. Determination of Benzoyl Peroxide and Benzoic Acid Levels by HPLC during Wheat Flour Bleaching Process. J. Agric. Food Chem. 2001, 49, 98–102. 10.1021/jf9912304. [DOI] [PubMed] [Google Scholar]
- Hamill J. M. On the Bleaching of Flour and the Addition of So-Called “Improvers” to Flour. J. Hyg. 1911, 11, 142–166. 10.1017/s0022172400016612. [DOI] [PMC free article] [PubMed] [Google Scholar]
- Al-Dmoor H.; El-Qudah J. Cake Flour Chlorination and Alternative Treatments (Review). Curr. Res. Nutr. Food Sci. 2016, 4, 127–134. 10.12944/crnfsj.4.2.06. [DOI] [Google Scholar]
- Mrozikiewicz A.; Kiełczewska-Mrozikiewicz D.; Lowicki Z.; Chmara E.; Korzeniowska K.; Mrozikiewicz P. M. Blood levels of alloxan in children with insulin-dependent diabetes mellitus. Acta Diabetol. 1994, 31, 236–237. 10.1007/bf00571958. [DOI] [PubMed] [Google Scholar]
- Haghdoost I. S.; Ghaleshahi A. J.; Safi S. Clinicopathological findings of diabetes mellitus induced by alloxan in goats. Comp. Clin. Pathol. 2007, 16, 53–59. 10.1007/s00580-006-0627-1. [DOI] [Google Scholar]
- Goyal R. N.; Rastogi A. Electrochemical and peroxidase catalysed oxidation of 9-β-D-ribofuranosyluric acid 5′-monophosphate. J. Chem. Soc., Perkin Trans. 2 1997, 2423–2430. 10.1039/a701601h. [DOI] [Google Scholar]
- Raghavamenon A. C.; Dupard-Julien C. L.; Kandlakunta B.; Uppu R. M. Determination of alloxan by fluorometric high performance liquid chromatography. Toxicol. Mech. Methods 2009, 19, 498–502. 10.3109/15376510903334862. [DOI] [PubMed] [Google Scholar]
- Zheng X.; Duan C.; Shen J.; Duan X. Determination of Reduced Glutathione by Spectrophotometry Coupled with Anti-interference Compensation. Anal. Methods 2015, 7, 5006. 10.1039/c5ay00825e. [DOI] [Google Scholar]
- Shpigun L. K.; Margolin S. L.; Suranova M. A. Flow Injection Determination of Alloxan. J. Flow Injection Anal. 2008, 25, 53–56. [Google Scholar]
- Murthy A. P.; Duraimurugan K.; Sridhar J.; Madhavan J. Application of derivative voltammetry in the quantitative determination of alloxan at single-walled carbon nanotubes modified electrode. Electrochim. Acta 2019, 317, 182–190. 10.1016/j.electacta.2019.05.163. [DOI] [Google Scholar]
- Gururaj K. J.; Manjunatha J. G. Electro Oxidation and Determination of Estriol Using a Surfactant Modified Nanotube Paste Electrode. Eurasian J. Anal. Chem. 2019, 14, 1–11. 10.29333/ejac/20190101. [DOI] [Google Scholar]
- Ramalakshmi N.; Muthukumar S.; Marichamy B. Electrochemical study of Mn2+ Redox system on 4-hydroxybenzylideneCarbamide -CTAB modified Glassy Carbon Electrode. Res. J. Chem. Sci. 2013, 8, 29–37. [Google Scholar]
- Tadesse Y.; Tadese A.; Saini R. C.; Pal R. Cyclic Voltammetric Investigation of Caffeine at Anthraquinone Modified Carbon Paste Electrode. Int. J. Electrochem. 2013, 2013, 1–7. 10.1155/2013/849327. [DOI] [Google Scholar]
- Charithra M. M.; Manjunatha J. G. Poly (l-Proline) modified carbon paste electrode as the voltammetric sensor for the detection of Estriol and its simultaneous determination with Folic and Ascorbic acid. Mater. Sci. Energy Technol. 2019, 2, 365–371. 10.1016/j.mset.2019.05.002. [DOI] [Google Scholar]
- Horta D. G.; Bevilaqua D.; Acciari H. A.; Garcia Júnior O.; Benedetti A. V. Optimization of the use of carbon paste electrodes (CPE) for electrochemical study of the chalcopyrite. Quim. Nova 2009, 32, 1734–1738. 10.1590/s0100-40422009000700010. [DOI] [Google Scholar]
- Dang X.; Wei Y.; Hu S. Effects of Surfactants on the Electroreduction of Dioxygen at an Acetylene Black Electrode. Anal. Sci. 2004, 20, 307–310. 10.2116/analsci.20.307. [DOI] [PubMed] [Google Scholar]
- Amrutha B. M.; Manjunatha J. G.; Bhatt A. S.; Hareesha N. Electrochemical Analysis of Evans Blue by Surfactant Modified Carbon Nanotube Paste Electrode. J. Mater. Environ. Sci. 2019, 10, 668–676. [Google Scholar]
- Gururaj K. J.; Norberto C.; Pablo D. A. S.; Roberto F. M. Role of Defects on Regioselectivity of Nano Pristine Graphene. J. Phys. Chem. A 2016, 120, 9101–9108. 10.1021/acs.jpca.6b08810. [DOI] [PubMed] [Google Scholar]
- Teradale A. B.; Lamani S. D.; Ganesh P. S.; Kumara Swamy B. E.; Das S. N. CTAB immobilized carbon paste electrode for the determination of mesalazine: A cyclic voltammetric method. Sens Biosensing Res 2017, 15, 53–59. 10.1016/j.sbsr.2017.08.001. [DOI] [Google Scholar]
- Nayak D. S.; Shetti N. P. Voltammetric Response and Determination of an Anti-Inflammatory Drug at a Cationic Surfactant-Modified Glassy Carbon Electrode. J. Surfactants Deterg. 2016, 19, 1071–1079. 10.1007/s11743-016-1854-3. [DOI] [Google Scholar]
- Mbokou S. F.; Pontié M.; Bouchara J.-P.; et al. Electroanalytical Performance of a Carbon Paste Electrode Modified by Coffee Husks for the Quantification of Acetaminophen in Quality Control of Commercialized Pharmaceutical Tablet. Int. J. Electrochem. 2016, 2016, 1–10. 10.1155/2016/1953278. [DOI] [Google Scholar]
- Elbasri M.; Rhazi M. E. Preparation and characterization of carbon paste electrode modified by poly(1,8-diaminonaphthalene) and nickel ions particles: Application to electrocatalytic oxidation of methanol. Mater. Today: Proc. 2015, 2, 4676–4683. 10.1016/j.matpr.2015.09.022. [DOI] [Google Scholar]
- Zhang K.; Zhang N.; Zhang L.; Wang H.; Shi H.; Liu Q. Simultaneous voltammetric detection of dopamine, ascorbic acid and uric acid using a poly(2-(Nmorpholine)ethane sulfonic acid)/RGO modified electrode. RSC Adv. 2018, 8, 5280–5285. 10.1039/c7ra13267k. [DOI] [PMC free article] [PubMed] [Google Scholar]
- Rahman M. M.; Jeon I. C. Studies of electrochemical behavior of SWNT-film electrodes. J. Braz. Chem. Soc. 2007, 18, 1150. 10.1590/s0103-50532007000600008. [DOI] [Google Scholar]
- Kumari C. T. R.; Mamatha G. P.; Santhosh H. M. Voltammetric Detection of Trimethoprim at CTAB Modified Carbon Paste Electrode. Chem. Sci. Trans. 2016, 5, 619–626. 10.7598/cst2016.1263. [DOI] [Google Scholar]
- Mukdasai K.; Mukdasai S. The Fabrication of in Situ Triton X-100 on Multi-Walled Carbon Nanotubes Modified Gold Electrode for Sensitive Determination of Caffeine. Int. J. Electrochem. Sci. 2018, 13, 58–70. 10.20964/2018.01.39. [DOI] [Google Scholar]
- Thomas T.; Mascarenhas R. J.; D’ Souza O. J.; Detriche S.; Mekhalif Z.; Martis P. Pristine multi-walled carbon nanotubes/SDS modified carbon paste electrode as an amperometric sensor for epinephrine. Talanta 2014, 125, 352–360. 10.1016/j.talanta.2014.03.027. [DOI] [PubMed] [Google Scholar]
- Manjunatha J. G.; Deraman M.; Basri N. H.; Nor N. S. M.; et al. Sodium dodecyl sulfate modified carbon nanotubes paste electrode as a novel sensor for the simultaneous determination of dopamine, ascorbic acid, and uric acid. Compt. Rendus Chem. 2014, 17, 465–476. 10.1016/j.crci.2013.09.016. [DOI] [Google Scholar]
- Hu C.; Hu S. Electrochemical characterization of cetyl trimethyl ammonium bromide modified carbon paste electrode and the application in the immobilization of DNA. Electrochim. Acta 2004, 49, 405–412. 10.1016/j.electacta.2003.08.022. [DOI] [Google Scholar]
- Ibrahim H.; Khorshid A. A Modified Carbon Paste Sensor for Cetyl trimethyl ammonium Ion Based on Its Ion-Associate With tetra chloro palladate (II). Anal. Sci. 2007, 23, 573–579. 10.2116/analsci.23.573. [DOI] [PubMed] [Google Scholar]
- Manjunatha J. G. Surfactant modified carbon nanotube paste electrode for the sensitive determination of mitoxantrone anticancer drug. J. Electrochem. Sci. Eng. 2017, 7, 39–49. 10.5599/jese.368. [DOI] [Google Scholar]
- Digua K.; Kauffmann J.-M.; Khodari M. Surfactant modified carbon paste electrode: Part 2: Analytical performances. Electroanal 1994, 6, 459–462. 10.1002/elan.1140060516. [DOI] [Google Scholar]
- Elqudaby H. M.; Mohamed G. G.; Ali F. A.; Eid S. M. Validated voltammetric method for the determination of some antiprotozoa drugs based on the reduction at an activated glassy carbon electrode. Arabian J. Chem. 2013, 6, 327–333. 10.1016/j.arabjc.2011.05.019. [DOI] [Google Scholar]
- Gilbert R.; Siddiquee S.; Saallah S.; Lal T. M. Optimisation of parameters for detection of manganese ion using electrochemical method. IOP Conf. Ser.: Mater. Sci. Eng. 2019, 606, 012009. 10.1088/1757-899x/606/1/012009. [DOI] [Google Scholar]
- Hareesha N.; Manjunatha J. G. Surfactant and polymer layered carbon composite electrochemical sensor for the analysis of estriol with ciprofloxacin. Mater. Res. Innovat. 2020, 24, 1–14. 10.1080/14328917.2019.1684657. [DOI] [Google Scholar]
- Shamsadin-Azad Z.; Taher M. A.; Cheragh i S.; Maleh H. K. A nanostructure voltammetric platform amplified with ionic liquid for determination of tert-butylhydroxyanisole in the presence kojic acid. J. Food Meas. Charact. 2019, 13, 1781–1787. 10.1007/s11694-019-00096-6. [DOI] [Google Scholar]
- Shetti N. P.; Nayak D. S.; Bukkitgar S. D. Electrooxidation of antihistamine drug methdilazine and its analysis in human urine and blood samples. Cogent Chem. 2016, 2, 1153274. 10.1080/23312009.2016.1153274. [DOI] [Google Scholar]
- Murthy A. P.; Duraimurugan K.; Sridhar J.; Madhavan J. Application of derivative voltammetry in the quantitative determination of alloxan at single-walled carbon nanotubes modified electrode. Electrochim. Acta 2019, 317, 182–190. 10.1016/j.electacta.2019.05.163. [DOI] [Google Scholar]
- Eldefrawy M.; Goma E. G. A.; Salem S.; Razik F. A. Cyclic Voltammetric studies of calcium acetate salt with Methylene blue (MB) Using Gold Electrode. Prog. Chem. Biochem. Res. 2018, 1, 11–18. 10.29088/sami/pcbr.2018.1.1118. [DOI] [Google Scholar]
- Paramasivam S.; Venkateswara Raju C.; Hemalatha S.; Mathiyarasu J.; Senthil Kumar S. Electrochemical Detection of Alloxan on Reduced Graphene oxide Modified Glassy Carbon Electrode. Electroanal 2020, 32, 1273–1279. 10.1002/elan.201900631. [DOI] [Google Scholar]
- Manjunatha J. G. A Surfactant Enhanced Graphene Paste Electrode as an Effective Electrochemical Sensor for the Sensitive and Simultaneous Determination of Catechol and Resorcinol. Chem. Data Collect. 2020, 25, 100331. 10.1016/j.cdc.2019.100331. [DOI] [Google Scholar]
- Aristov N.; Habekost A. Cyclic Voltammetry - A Versatile Electrochemical Method Investigating Electron Transfer Processes. World J. Chem. Educ. 2015, 3, 115–119. 10.12691/wjce-3-5-2. [DOI] [Google Scholar]
- Chokkareddy R.; Redhi G. G.; Karthick T. A lignin polymer nanocomposite based electrochemical sensor for the sensitive detection of chlorogenic acid in coffee samples. Heliyon 2019, 5, e01457 10.1016/j.heliyon.2019.e01457. [DOI] [PMC free article] [PubMed] [Google Scholar]
- Pushpanjali P. A.; Manjunatha J. G.; Tigari G.; Fattepur S. Poly (Niacin) Based Carbon Nanotube Sensor for the Sensitive and Selective Voltammetric Detection of Vanillin with Caffeine. Anal. Bioanal. Electrochem. 2020, 12, 553–568. [Google Scholar]
- Prinith N. S.; Manjunatha J. G. Surfactant modified electrochemical sensor for determination of Anthrone – A cyclic voltammetry. Mater. Sci. Energy Technol. 2019, 2, 408–416. 10.1016/j.mset.2019.05.004. [DOI] [Google Scholar]
- Tigari G.; Manjunatha J. G. A Surfactant Enhanced Novel Pencil graphite and Carbon Nanotube Composite Paste Material as an Effective Electrochemical Sensor for the Determination of Riboflavin. J. Sci. 2020, 5, 56–64. 10.1016/j.jsamd.2019.11.001. [DOI] [Google Scholar]
- Giaccone V.; Lo Dico G. M.; Pantano L.; Pantano L.; et al. First report on the presence of Alloxan in Bleached Flour by LC-MS/MS Method. Biodivers. J. 2019, 10, 493–494. 10.31396/biodiv.jour.2019.10.4.493.494. [DOI] [Google Scholar]
- Raril C.; Manjunatha J. G. A Simple Approach for the Electrochemical Determination of Vanillin at Ionic Surfactant Modified Graphene Paste Electrode. Microchem. J. 2020, 154, 104575. 10.1016/j.microc.2019.104575. [DOI] [Google Scholar]


