

Abstract
Malignant ascites is one of the major clinical features of ovarian cancer, which serves as a carrier for the peritoneal dissemination of tumor cells and predicts a poor prognosis in patients. In the microenvironment of ovarian cancer ascites, antitumor immunity is suppressed, which enables the tumor cells to escape from immune surveillance. The metabolic factors, including hypoxia, nutrient deprivation and accumulation of metabolic products, contribute to the immunosuppressive status of malignant ascites. The malignant ascites and ovarian solid tumors exhibit differential metabolic profiles. In this review, we have summarized the most recent findings on the interaction between immune cells and metabolic factors in the ovarian cancer ascites. The effects of metabolic factors on the antitumor functions of T‐cells in the malignant ascites were analyzed. Finally, we have discussed the potential directions for future research in this field.
Keywords: T‐cell, metabolism, immunosuppression, ascites, ovarian cancer
Abbreviations
- 4‐HNE
4‐hydroxy‐trans‐2‐nonenal
- AA
arachidonic acid
- ARG1
arginase‐1
- CAFs
cancer‐associated fibroblasts
- DCs
dendritic cells
- DHA
docosahexaenoic acid
- ER
endoplasmic reticulum
- EVs
extracellular vesicles
- FASN
fatty acid synthase
- G1P
glucose‐1‐phosphate
- HPLC
high‐performance liquid chromatography
- IDO
indoleamine 2,3‐dioxygenase
- IL‐2
interleukin‐2
- iNOS
inducible nitric oxide synthase
- LA
linoleic acid
- LPA
lysophosphatidic acid
- MDSCs
myeloid‐derived suppressor cells
- MRI
magnetic resonance imaging
- MSI
mass spectrometry imaging
- PET
positron emission tomography
- PGE2
prostaglandin E2
- PPARs
peroxisome proliferators‐activated receptors
- ROS
reactive oxygen species
- TAMs
tumor‐associated macrophages
- TDO
tryptophan 2,3‐dioxygenase
- TLRs
toll‐like receptors
- TME
tumor microenvironment
- Tregs
regulatory T‐cells
Introduction
Ascites is the abnormal accumulation of fluid in the abdominal cavity. Ascites caused due to malignancy is called malignant ascites.1 Carcinogenesis in the abdominal cavity is associated with the accumulation of fluids in the abdominal cavity, which is caused due to the exudation of tumor microvascular fluid and lymphatic obstruction.2 The accumulated fluid results in the formation of ascites. More than one‐third of patients with ovarian cancer exhibit ascites at diagnosis and almost all cases exhibit ascites at recurrence.2 The formation of malignant ascites, which is involved in the peritoneal dissemination of ovarian cancer, predicts a poor prognosis in patients with ovarian cancer.2 The malignant ascites contains cellular and noncellular components. The cellular components include the immune cells, stromal cells (such as cancer‐associated fibroblasts (CAFs), mesothelial cells and endothelial cells) and detached tumor cells, while the noncellular components comprise soluble factors and extracellular molecules, such as cytokines, chemokines, small molecular metabolites, cell‐free DNAs, RNAs, exosomes, microvesicles and extracellular matrix proteins.2 Malignant ascites and solid tumor tissue constitute the ovarian cancer microenvironment.
The suppressed antitumor immunity is one of the major characteristics of the malignant ascites microenvironment. The direct evidence of suppressed antitumor immunity is the immune cell profiles of the malignant ascites. In the ascites, the proportions of LAG‐3+, PD‐1+, TIM+ and CTLA‐4+ cells in both CD4+ and CD8+ cells were higher than those in the peripheral blood T‐cells.3 Several studies have demonstrated that the regulatory T‐cells (Tregs) and myeloid‐derived suppressor cells (MDSCs) accumulate in the ascites.3, 4, 5 Furthermore, in vitro experiments have demonstrated that the characteristics of cultured immune cells from normal tissue (e.g., peripheral blood from the normal specimen) change upon incubation with the cell‐free ovarian cancer ascites. For example, treatment with the malignant ascites suppresses the activity and proliferation of T‐cells and impairs their cytokine secretion ability.6, 7 Incubation with the malignant ascites can also attenuate the Toll‐like receptor (TLR)‐mediated activation of the dendritic cells (DCs).8 It is worth noting that the noncellular components in the ascites can affect the survival of immune cells and tumor cells. The ovarian cancer cells derived from the ascites are reported to constitutively secrete functional Fas ligand, which can induce apoptosis of the CD95/Fas‐positive immune cells.9 Some factors of the malignant ascites can activate the PI3K/AKT signaling pathway through αvβ5 integrin on the ovarian cancer cells and subsequently inhibit TRAIL‐induced apoptosis of tumor cells.10, 11 This is another mechanism for the tumor to escape the immune response.
Thus, the noncellular components in the ovarian cancer ascites are enough to exert immunosuppressive effects. Among these noncellular factors, the cytokines and chemokines are closely linked to the immune status of malignant ascites. Furthermore, several studies have suggested that metabolic factors contribute to the immunosuppressive status of malignant ascites. These metabolic factors in the microenvironment include hypoxia, nutrient depletion and accumulated immunosuppressive metabolites. These metabolic factors can directly affect the metabolism of various types of cells, including the immune cells.
In this review, we have summarized the metabolic factors in the ovarian cancer ascites and the effect of these factors on the antitumor functions of T‐cells. We have discussed the possible mechanism underlying the interactions between immune cells and metabolic factors. Ovarian cancer can be classified into the following five main histologic types: high‐grade serous carcinoma, low‐grade serous carcinoma, clear‐cell carcinoma, endometrioid carcinoma and mucinous carcinoma.12 This review mainly focuses on serous carcinoma, as more than 70% of ovarian cancer cases belong to serous carcinoma, which accounts for most deaths of ovarian cancer clinically.13
Metabolic Factors Associated with T‐Cell Suppression in the Malignant Ascites
Mild hypoxia
Oxygen content and pH value of the ovarian cancer ascites
The typical tumor microenvironment (TME) is characterized by hypoxia and low pH, which contribute to tumor growth and metastasis, as well as the suppression of antitumor immunity. In contrast to the hypoxic and acidic microenvironment of solid tumors, the malignant ascites is hypoxic but not markedly acidic. Previous studies have demonstrated that the O2 pressure in the patients with ovarian cancer is 45.65 ± 8.68 mm Hg in the malignant ascites.14 The O2 pressure in the healthy control subjects is approximately 100 mm Hg in the arterial vessel and approximately 40 mm Hg in the venous vessel.15 In the solid tumor, the O2 pressure decreases to 8–10 mm Hg.15 There are few studies that have reported the pH value of the ovarian cancer ascites. The preliminary results from our lab revealed that the pH value of the ovarian cancer ascites is >7.3. In contrast, the extracellular pH (pHe) values of the normal tissue and solid tumor tissue are approximately 7.4 and less than 7.0, respectively.16 As the malignant ascites is not markedly acidic, we will only discuss the immunosuppressive effects of hypoxia in the following sections.
Hypoxia mediates immunosuppression in most types of solid tumor
Hypoxia may stimulate the immune cells in some cases. However, hypoxia is a key factor that mediates immunosuppression in a typical solid tumor microenvironment.17 Hypoxia directly suppresses antitumor immunity by suppressing the proliferation, differentiation, survival and function of the T‐cells. For example, the survival rate of T‐cells markedly decreases at low O2 levels,18 and the interleukin‐2 (IL‐2) secretion by naïve T‐cells decreases as HIF1α becomes more stable under hypoxic conditions.19 In addition, hypoxia can indirectly affect the T‐cell function. For example, the hypoxic condition promotes tumor cells to produce immunosuppressive factors, such as TGFβ, IL‐10, VEGF, IL‐6, CCL22, CCL28 and galectin‐1/3.17 These factors can not only directly suppress T‐cell function but also promote the recruitment and polarization of immunosuppressive cells, such as MDSCs and tumor‐associated macrophages (TAMs).20 Hypoxia also promotes the expression of PD‐L1 on the tumor cells and MDSCs, which suppresses T‐cell function.21, 22
Effects of hypoxia in solid ovarian cancer tissue on the immune status of malignant ascites
Compared to the peripheral blood, the ascitic fluid is more hypoxic. HIF1α is the master regulator that regulates the cellular response to hypoxia. It functions as a transcriptional factor, which activates over 40 genes associated with metabolic adaptation to hypoxia. Previous studies have demonstrated that the stability of HIF1α markedly increases at O2 pressure of 2 kPa (~15 mm Hg) and below, which activates the hypoxic response.23 However, the O2 level in the ovarian cancer ascites is above 2 kPa. In contrast, HIF2α can be stabilized under a relatively mild hypoxic condition (O2 level is lower than 5%).24 Therefore, HIF2α may be activated under hypoxic conditions in the malignant ascites. The downstream effects of HIF1α and HIF2α activation are different.24, 25, 26 Hence, further studies are needed to identify the role of mild hypoxia in mediating immunosuppression in the ascites.
Hypoxia in the solid tumor tissue of ovarian cancer may indirectly contribute to immunosuppression in the malignant ascites
Several studies have demonstrated that the solid tumor tissue of ovarian cancer exhibits an enhanced expression of HIF1α,27 which mediates a series of immunosuppressive effects.28, 29, 30 The close proximity between solid tumor tissue in the abdominal cavity and malignant ascites enables the exchange of various factors between them. Thus, various hypoxia‐induced immunosuppressive factors in the solid tumor tissue may be secreted into the ascites (Fig. 1). For example, hypoxia in the solid tumor microenvironment can upregulate the expression of CCL28, which contributes to the recruitment of Tregs, in a mouse model of ovarian cancer.28 The overexpression of CCL28 in the solid tumor tissue also enhances the level of CCL28 in the ascites.28
Figure 1.
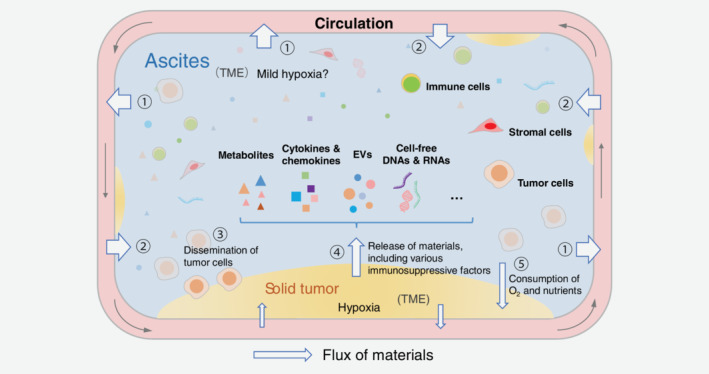
Unique microenvironment of ovarian cancer in the abdominal cavity. The malignant ascites and solid tumor tissue constitute the ovarian cancer microenvironment, which can be regarded as an evolutionary outcome of the original normal tissue microenvironment in the abdominal cavity. There is a frequent material exchange in this microenvironment. The ascites is continuously exchanging materials with the circulatory system (marked with ① and ②), and the solid tumor tissue (marked with ③, ④ and ⑤). The solid tumor tissue can release various soluble immunosuppressive factors into the ascites fluid and may consume the O2 and nutrients in the ascites. These effects may contribute to converting the microenvironment of normal tissue into the tumor microenvironment. However, these effects are “diluted” due to the material exchange between ascites and peripheral blood. The O2 and nutrients can be replenished from the peripheral blood, and the immunosuppressive factors may diffuse out into the blood. Even so, the diluted soluble factors in the malignant ascites can still mediate immunosuppression effectively. The ascites microenvironment is unique when compared to the normal tissue and typical tumor microenvironment (TME) of the solid tumors.
Hypoxia can induce the production of various immunosuppressive metabolic factors
These immunosuppressive metabolic factors have been found in the ovarian cancer ascites. For example, hypoxia can increase the production of prostaglandin E2 (PGE2),31 reactive oxygen species (ROS)32 and adenosine.33 These factors contribute to T‐cell inhibition in the malignant ascites (discussed in the following sections). Thus, hypoxia may play a central role in regulating the metabolic factors that can mediate immunosuppression in the ascites (Fig. 2).
Figure 2.
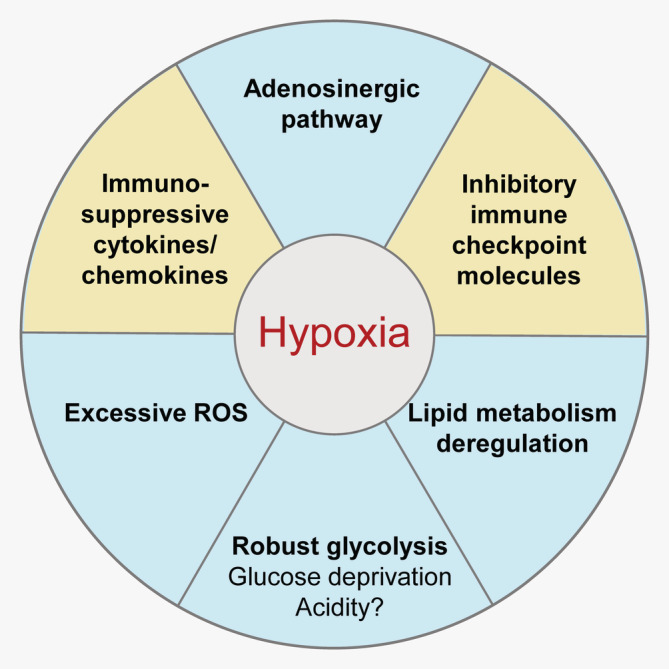
Hypoxia is a key factor in mediating immunosuppression in ovarian cancer. Hypoxia can directly suppress T‐cell function and induce the production of various immunosuppressive factors, such as TGFβ and IL‐10. Hypoxia can also promote the expression of inhibitory immune checkpoint molecules, such as PD‐L1. Additionally, hypoxia can strengthen other immunosuppressive metabolic factors, including reactive oxygen species (ROS) and adenosine. Hypoxia can also promote the expression of COX‐2, which enhances the synthesis of PGE2.
Deficiency of nutrients
Similar to the tumor cells, the activated T‐cells require a high amount of nutrients, such as glucose and amino acids to drive protein synthesis and glycolysis (Warburg effect) during proliferation.34, 35 Additionally, the tumor cells can promote glycolysis in the stromal cells, such as CAFs and mesothelial cells, which involves high consumption of glucose and other nutrients in the TME.36, 37 Consequently, the competition among tumor cells, tumor‐associated stromal cells and T‐cells leads to nutrient deficiency in the T‐cells, which can impair the antitumor function of T‐cells.38, 39
Glucose deprivation
Glucose is an essential nutrient for the proliferation of effector T‐cells
Glucose deficiency directly suppresses the activation and proliferation of T‐cells and induces T‐cell anergy and death.40, 41, 42 In contrast to the effector T‐cells, the Tregs exhibit downregulated glycolysis and rely mainly on the oxidation of fatty acids for energy.43, 44 Glucose deficiency promotes the induction of Tregs.43
Glucose is actively consumed in the ovarian cancer ascites but is not depleted
Previous studies have demonstrated that the ascites from patients with ovarian cancer exhibits a lower level of glucose and a higher level of glucose‐1‐phosphate (G1P) than the ascites from patients with liver cirrhosis.45 This suggested an enhanced consumption of glucose in the malignant ascites. However, the glucose level in the malignant ascites was similar to the normal blood glucose levels.6 The blood capillaries are rich in the peritoneum, which is a semipermeable membrane.46 Hence, glucose in the malignant ascites may be replenished from the peripheral blood through the peritoneum (Fig. 1). Therefore, enhanced glucose consumption in the ovarian cancer ascites may not result in glucose deficiency in the T‐cells.
However, the ovarian cancer ascites can hamper the glucose uptake by T‐cells, which impairs the T‐cell immune function. GLUT1 is the key transporter in the plasma membrane for T‐cell glucose uptake.47 The cell‐free malignant ascites can markedly decrease the expression of GLUT1 and subsequently downregulate glycolysis.6 The decreased glucose uptake also results in the inhibition of N‐linked protein glycosylation, which induces endoplasmic reticulum (ER) stress. ER stress triggers the IRE1α‐XBP1 pathway and contributes to the abnormal mitochondrial activity of aerobic respiration and glutamine intake. The activities of CD4+ T‐cells markedly decline upon incubation with the malignant ascites. The animal studies demonstrated that blocking the IRE1α‐XBP1 pathway can rescue the malignant ascites‐induced attenuated antitumor activity of T‐cells.6 Further investigations are needed to determine the mechanism underlying the suppression of GLUT1 expression in the T‐cells by the malignant ascites.
Amino acid catabolism
Generally, amino acid catabolism contributes to immunosuppression in the TME. The tumor cells and immunosuppressive cells (such as MDSCs and TAMs) consume high amounts of amino acids and produce various metabolic products.35, 48 Both amino acid depletion and products of amino acid catabolism can directly suppress the antitumor functions of T‐cells.35 Tryptophan and arginine catabolism are the hallmarks of TME metabolism. Indoleamine 2,3‐dioxygenase (IDO) and tryptophan 2,3‐dioxygenase (TDO) are rate‐limiting enzymes during tryptophan decomposition. Arginase‐1 (ARG1) and inducible nitric oxide synthase (iNOS) are key enzymes involved in arginine catabolism. These enzymes can mediate immunosuppressive effects,35 and they are primarily located within the cells.49 In addition, studies have shown that ARG1 can be released into the extracellular space, and keep its immunosuppressive activity.50, 51
Previous studies have demonstrated that IDO1, ARG1 and iNOS are expressed in various types of cells in the ovarian cancer ascites (Table 1). Additionally, the CD14+HLA‐DR−/low MDSCs cultured with the ascites from patients with ovarian cancer in vitro exhibited upregulated expression of ARG1 and iNOS.53 Treatment with inhibitors of IDO1, ARG1 or iNOS, or with L‐arginine abolished the suppressive effects of MDSCs derived from/induced by ascites on T‐cells.52, 53 Interestingly, the extracellular vesicles (EVs) in the ovarian cancer ascites also exhibit ARG1 expression.51 In vitro studies have demonstrated that EVs containing ARG1 can inhibit T‐cell proliferation, which can be mitigated by ARG1 inhibitor or l‐arginine. These EVs can also be internalized by DCs, which blocks the DC‐primed T‐cell proliferation.51 Thus, IDO1, ARG1 and iNOS are involved in T‐cell inhibition in the ovarian cancer ascites.
Table 1.
An overview of IDO1/ARG1/iNOS expression status associated with human ovarian ascites
| Cell types | Enzymes of amino acid catabolism | Usage of enzyme inhibitors in the reports | References |
|---|---|---|---|
| MDSC derived from ascites | IDO1/ARG1/NOS |
1‐MT (IDO inhibitor) Nor‐NOHA (arginase inhibitor) L‐NMMA (NOS inhibitor) |
52 |
| MDSC (CD14+HLA‐DR−/low) induced by ascites | ARG1/iNOS |
Nor‐NOHA (arginase inhibitor) SMT (iNOS inhibitor) |
53 |
| MDSC derived from ascites | IDO1/ARG1 | N/A | 54 |
| MDSC (CD33+) derived from ascites | ARG1 | N/A | 55 |
| Macrophage derived from ascites | ARG1 | N/A | 56 |
| Macrophage derived from ascites | ARG1 | N/A | 57 |
| Ascites‐derived tumor cells and extracellular vesicles | ARG1 | OAT‐1746 (arginase inhibitor) | 51 |
Immunosuppressive metabolic products
In addition to lactate and the products of amino acid catabolism, other metabolic products, such as lipids, adenosine and ROS also accumulate in the malignant ascites. These metabolic products can also affect T‐cell function.
Immunosuppressive functions of lipids in the ovarian cancer ascites
Origin of lipids in the ovarian cancer ascites
The metabolomic analysis revealed that the ovarian cancer ascites contains different types of lipids, including saturated and unsaturated fatty acids, fatty acid amides, cholesterol and its derivatives, as well as various forms of phospholipids.45, 58 Lipid accumulation is one of the major characteristics of the ovarian cancer ascites. These lipids may be derived from the adipose cells,59 which are rich in omentum, and tumor cells.60 The omental adipocytes are reported to supply fatty acids to the tumor cells via a FABP4‐dependent mechanism to promote homing, migration and invasion of tumor cells.59 Additionally, the human ovarian cancer tissue exhibits higher fatty acid synthase (FASN) expression than the normal ovarian tissue, and the expression level of FASN in the metastatic tumor is higher than that in the primary tumor.58, 60 In the mouse model of ovarian cancer, the upregulation of FASN in the tumor cells results in an elevated level of lipids in the ascites. In the ascites of ID8 tumor‐bearing mice, the level of saturated and unsaturated fatty acids, as well as the level of triglyceride, is positively correlated with the expression level of FASN.60
Abundant lipids induce robust lipid metabolism in the ovarian cancer ascites
The lipids enriched in the ovarian cancer microenvironment may cause global changes in lipid metabolism.58 The tumor cells and immune cells have multiple lipid‐sensing pathways, which regulate lipid metabolism and other cellular processes. The ovarian cancer ascites contain various types of unsaturated fatty acids, including linoleic acid (LA), arachidonic acid (AA) and docosahexaenoic acid (DHA).45, 61 The concentrations of LA, AA and DHA are above the half‐maximal inhibitory concentration (IC50) required for binding to the peroxisome proliferators‐activated receptors (PPARs), which are a group of nuclear receptor proteins, and play key roles in fatty acid sensing.61, 62, 63 The functions of activated PPARs vary between cell and tissue types. On the whole, the activated PPARs not only upregulate the levels of lipid synthesis and storage, but also shift the level of lipid degradation and oxidation.62 Several studies have reported that the level of ketone bodies in the ovarian cancer ascites was higher than that in the effusions of breast carcinoma and mesothelioma.64 This indicates robust lipid degradation in the TME of ovarian cancer.
Robust lipid metabolism in the ovarian cancer ascites suppresses the antitumor functions of T‐cell through multiple pathways
The unsaturated fatty acids regulate immune functions via PPARs. PPARs can be activated by the enriched unsaturated fatty acids in the ovarian cancer ascites. However, there are contradictory reports on the mechanism underlying the regulation of PPARs. Some studies have reported that PPARγ is involved in the suppression of T‐cell function by inhibiting IL‐2 production directly.65 However, other studies have reported that PPAR‐induced fatty acid oxidation in T‐cells increases the number of active effector CD8+ T‐cells and subsequently facilitates anti‐PD‐1 therapy.66 Moreover, unsaturated fatty acids in the malignant ascites can also regulate the functions of macrophages via PPARs, which may indirectly affect the T‐cell function. Past research has demonstrated that PPARδ/β in the macrophage is activated by LA, AA and DHA in the ovarian cancer ascites. Thus, the gene expression patterns are affected in the macrophages, which contribute to the protumorigenic polarization of TAMs.61
Some types of unsaturated fatty acids in the ovarian cancer ascites can be converted into eicosanoids, which regulate antitumor immunity. For example, LA and AA in the malignant ascites can be transformed into PGE2 by COX‐2,5 which is a kind of cyclooxygenase actively expressed in various types of cells (such as MDSCs). In the TME, PGE2 can mediate T‐cell inhibition indirectly through multiple pathways.52, 67 In the ovarian cancer ascites, PGE2 can induce the secretion of CXCL12 and the expression of CXCR4 to promote MDSC accumulation, which inhibits T‐cell functions.5 Hypoxia, a characteristic of ovarian cancer TME, can upregulate the expression of COX‐2 and subsequently promote the synthesis of PGE2.31
The byproducts of lipid metabolism can regulate antitumor immunity in the ovarian cancer ascites. The accumulation of lipid peroxide is often observed in the dysfunctional DCs in the TME.68, 69 The enhanced level of ROS in the ovarian cancer ascites can cause lipid peroxidation in the DCs and generate reactive byproducts, such as 4‐hydroxy‐trans‐2‐nonenal (4‐HNE).70 Previous studies have demonstrated that 4‐HNE can form stable adducts with the ER‐resident chaperones in these DCs and subsequently trigger ER stress. The ER stress activates the IRE1α‐XBP1 pathway and upregulates various triglyceride biosynthetic genes. In vitro experiments have revealed that the lipid levels in DCs markedly increase upon incubation with the cell‐free malignant ascites. Additionally, these DCs exhibit impaired antigen‐presenting capacity, which affects the T‐cell activation.70 The lipid accumulation is suppressed and the number of lipid droplets decreases when XBP1 is knocked out in the DCs. XBP1 knockout enhances the ability of DCs to activate the T‐cells, suppresses the tumor growth and prolongs the mouse lifespan.70 Additionally, lipid accumulation occurs in the macrophages of the ovarian cancer ascites.61 Some studies suggest that these lipids may be derived from the extracellular environment.61 Thus, both lipid synthesis and uptake can cause lipid accumulation in certain types of immune cells and consequently remodel their immune function.
Phospholipids are also detected in the malignant ascites.45 Lysophosphatidic acid (LPA) is closely associated with ovarian cancer progression, which may cause excessive cell proliferation and result in carcinogenesis and metastasis. A considerable amount of LPA in the ovarian cancer ascites is obtained from the peritoneal mesothelial cells.71 Studies on a mouse melanoma model have demonstrated that LPA can suppress the activation and proliferation of CD8+ T‐cells.72 However, the effects of LPA on the T‐cells should be verified in the ovarian cancer ascites.
Adenosinergic pathway contributes to the immunosuppressive status in the ovarian cancer ascites
The general mechanism of adenosine‐mediated immunosuppression
Adenosine in the TME is mainly obtained from ATP degradation. Previous studies have demonstrated that the extracellular ATP concentration in the tumor tissue was a 1,000‐fold higher than that in the normal tissue. The superabundant ATP in the TME derives mainly from large numbers of dying cells.73
The extracellular ATP can be degraded into adenosine by ectonucleotidases (CD39 and CD73).33 These adenosines bind to the adenosine receptors, such as A1R, A2AR, A2BR and A3R to induce the downstream regulation and mediate a series of protumor and immunosuppressive effects.33 These adenosine receptors, CD39 and CD73, which are termed as “adenosinergic molecules,” are expressed on the plasma membrane of various cell types, including the tumor, stromal and immune cells.33 Adenosine can directly or indirectly suppress the T‐cell function. For example, the activation of A2AR induces the differentiation of CD4+ T‐cells into Tregs,74 while the CD39 and CD73 expressed by Tregs further strengthen the immunosuppression.75 Additionally, the A2BR activation on the MDSCs promotes the secretion of VEGF, which indirectly suppresses T‐cell function.76
Hypoxia, a characteristic of TME, promotes the immunosuppressive effects of the adenosinergic pathway. Hypoxia can promote ATP release, which provides raw materials for the adenosine synthesis.73 Hypoxia can also activate HIF1α to promote the expression of CD39, CD73 and A2BR, which strengths the adenosinergic pathway.33 Additionally, the levels of adenosinergic molecules are also influenced by cytokines (such as TNFα and TGFβ) in the TME.33 Thus, the level of adenosinergic molecules is closely related to the overall immune status of TME.
Adenosinergic pathway is closely related to the immunosuppressive status of the ovarian cancer microenvironment
Many studies have demonstrated that the adenosinergic pathway contributes to immunosuppression in the TME of ovarian cancer.77 Clinically, the enhanced expression level of CD73 in the tumor tissue predicts a poor prognosis in patients with ovarian carcinoma.78 The tumor cells from the ovarian cancer ascites express functional CD39 and CD73, which promote the generation of adenosine.79 Moreover, the macrophages derived from the malignant ascites exhibit enhanced expression of CD39 and CD73.56 These results suggest that the adenosinergic pathway is activated in the malignant ascites.
Further studies are needed to assess the contribution of the adenosinergic pathway in promoting immunosuppression in the malignant ascites. Interestingly, adenosine cannot be detected in the cell culture supernatant of ovarian tumor cells by high‐performance liquid chromatography (HPLC). However, adenosine can be detected by a luciferase‐based assay employing the ADORA2A‐transfected HEK‐293 “sensor” cells.79 These results suggest that the cells that exhibit CD39 and CD73 expression may produce a high adenosine level in the local region. However, the newly generated adenosine may be rapidly diluted or degraded in the microenvironment. Thus, adenosine in the malignant ascites may be maintained at a high level in the local region, which modulates the antitumor immunity via a paracrine/autocrine mechanism.
High level of ROS suppresses T‐cell function in the malignant ascites
Ovarian cancer ascites exhibits enhanced ROS level
The ovarian cancer ascites exhibits enhanced levels of ROS.6, 70, 75 Hypoxia, robust glycolysis and lipid metabolism contributes to ROS production in the malignant ascites and adjacent solid tumors.32 The sources of ROS are tumor cells, CAFs, Tregs, MDSCs and immune effector cells. H2O2 is the most reactive form of ROS, which can be released into the microenvironment and promote signaling at long‐distance.32 The ROS derived from the tumor cells can promote glycolysis in CAFs, and the enhanced glycolysis may further increase ROS production.32
The immunosuppressive effects induced by ROS
In addition to oxidative stress, ROS mediates multiple effects. An appropriate level of ROS benefits T‐cell functioning. However, excessive ROS levels can directly impair the T‐cell function,80 which can disturb the redox balance of T‐cells and inhibit T‐cell activation.81, 82 The high level of ROS in the ovarian cancer ascites can inhibit the T‐cell function. Previous studies have demonstrated that the level of ROS in the CD4+ T‐cells increases after in vitro treatment with the cell‐free ascites.6 Additionally, incubation with the cell‐free ascites also enhances the ROS level in DCs, which induces ER stress and subsequently impairs the antigen‐presenting capacity of DCs and inhibits T‐cell activation.70 Moreover, the MDSCs and Tregs accumulate in the ovarian cancer ascites. These cells can release ROS molecules to suppress effector T‐cells.20, 83
Summary and Perspective
The immune status of TME is determined by various factors. Recently, several metabolic factors in the TME were reported to be the key factors involved in immunosuppression. This is because metabolism provides energy and materials for cell growth and function, and the regulatory pathways of metabolism are coupled to the global regulation network (Fig. 3). Although several common metabolic mechanisms of immunosuppression have been elucidated in different types of cancer, it is important to study the characteristics and mechanisms of immunosuppression in a specific cancer type. In this review, we have summarized the metabolic factors in the microenvironment of ovarian cancer, especially those that can affect the immune status of the malignant ascites microenvironment.
Figure 3.
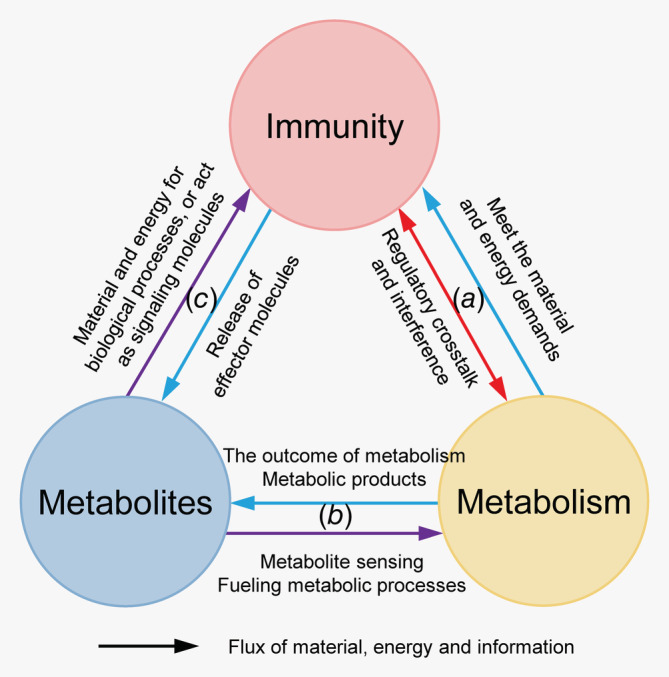
Metabolic factors are closely linked to immune functions. (a) The metabolic process provides energy and materials for the immune process. The regulatory pathways of metabolic and immune processes are highly coupled to each other. (b) The composition and levels of intracellular and extracellular metabolites can reflect and directly affect the metabolic status of the cells. Simultaneous metabolomic analysis of large numbers of metabolites can be useful for determining the metabolic status of cells. (c) Some types of metabolites are closely related to immunity. Some metabolites (such as nitric oxide) are directly involved in the immune processes by functioning as signaling and effector molecules. Additionally, the levels of amino acids, such as tryptophan and arginine, can markedly affect the functions of immune cells.
Ovarian cancer is located in the abdominal cavity and is often associated with the formation of ascites. There is an exchange of materials between the ascites and solid tumor tissues and between the ascites and circulatory system through the peritoneum (Fig. 1). Therefore, the ovarian cancer TME should be considered as a whole. The exchange of materials plays an important role in shaping the ovarian cancer microenvironment via various metabolites and other factors, such as cytokines, chemokines and so on, which influence the immune status profoundly.
The metabolic features of the ovarian cancer TME may be predominantly determined by the metabolism of tumor cells and tumor‐associated stromal cells. Large numbers of tumor cells undergo the Warburg effect to meet their energy and material demands. Actually, reverse Warburg effect cooperates with Warburg effect in TME.36, 37 For example, the invasive tumor cells are reported to exhibit robust oxidative phosphorylation fueled by reverse Warburg effect.36 First, cancer cells induce the aerobic glycolysis in neighboring stromal fibroblasts. Then, these CAFs secrete lactate and pyruvate. As a result, cancer cells take up these energy‐rich metabolites and facilitate mitochondrial TCA cycle, thereby promoting efficient energy production, resulting in a higher proliferative capacity. Furthermore, the adipocytes in omentum may supply abundant lipids to the microenvironment of ovarian cancer,59 which is a distinctive and unique feature of ovarian cancer microenvironment. These metabolic processes mentioned above together contribute to low oxygen, lack of nutrients and accumulation of metabolites in the microenvironment of ascites.
The metabolic factors, such as hypoxia, nutrient deficiency and accumulated metabolic products, have multiple effects on the intracellular metabolic sensors and regulators (such as HIF1α and PPARs). Consequently, they can not only affect the metabolic processes, but also modulate the immune regulation, as well as the global signaling network of various types of cells. It is worth noting that the metabolic factors in the solid tumor tissue may affect the immune status of the malignant ascites. Hypoxia, as well as soluble factors induced by hypoxia, can mediate immunosuppression through multiple mechanisms (Fig. 2). Additionally, the abundant lipids in the ovarian cancer microenvironment regulate immune functions in a variety of ways. In summary, hypoxia, lipid enrichment and their relevant regulators play a comprehensive and critical role in shaping the immune status of the ovarian cancer microenvironment in both intracellular and extracellular manner.
Future studies must elucidate the mechanism underlying the interactions between immune and metabolic responses in the TME of ovarian cancer.
Future studies on elucidating the mechanisms
In addition to the metabolites in the ascites, other factors, which is directly related to the metabolic process and regulation, are also considered as metabolic factors. These factors (such as HIF1α, GLUT1, ARG1, PPARs, CD39, etc.) include various metabolic enzymes, metabolite transporters, sensors, as well as signal transductors. They participate in the regulation of T‐cell function holistically. The interactions between the metabolites and other metabolic factors need further elucidation, which can aid in a better understanding of the mechanisms underlying the metabolite sensing, and the role of various metabolites in the ascites. Additionally, newly discovered mechanisms need to be verified in the ascites. For example, ferroptosis is an iron‐dependent, nonapoptosis form of cell death, which represents the dysregulation of iron metabolism and lipid peroxidation.84 Indeed, lipid peroxide accumulation is observed in some types of immune cells in the malignant ascites. Future studies should identify the potential factors in the malignant ascites that trigger or inhibit ferroptosis, and investigate their influence on the survival of various cells in the TME.85, 86
Potential clinical transformation
Ovarian cancer has the following characteristics: a high tendency of metastasis, inherent chemo‐resistance, inefficiency in immunotherapy.87, 88, 89 The ovarian cancer ascites is reported to promote tumor progression and metastasis and inhibit tumor cell death induced by immune cells or chemotherapy.10 Thus, there is an urgent need to explore the correlation between the specific metabolites in the ascites and response to chemotherapy or immunotherapy. Additionally, it is important to further analyze the differences in the metabolic factors between the different histologic types of ovarian cancer. These studies may provide novel biomarkers for diagnosis and prognosis, as well as new targets for drug development.
Ongoing technological innovation
To fully understand the metabolic features of TME, it is necessary to develop real‐time, dynamic and visualized metabolite detection technology to monitor the level of various metabolites inside and outside the cells. Currently, various new technologies and strategies, including positron emission tomography (PET), magnetic resonance imaging (MRI), mass spectrometry imaging (MSI) and some genetically encoded metabolite sensors, are being continuously developed to understand the metabolic features of the TME.90, 91, 92, 93
The ascites, a pathological effusion, are easier to obtain than solid tumor tissue and extracellular fluid in tissues. Compared to the peripheral blood, the ascites is more powerful to reflect the features of ovarian cancer. Thus, the ascites is an ideal model to study the TME, especially the extracellular environment. The study of metabolic factors in the malignant ascites can aid in elucidating the mechanism underlying the occurrence and development of ovarian cancer and provide new clues for diagnosis and treatment.
Conflict of interest
The authors declare no conflicts of interest.
Acknowledgements
We thank Jie Zhang, Zhongnan Yin, Tong Liu and Qing Ji from Peking University Third Hospital, China, and Yuchen Sun from the University of Virginia, USA for their assistance in revising the manuscript. This review article was supported by the National Natural Science Foundation of China (81972966, 81672091, 91749107).
Y.G. and J.Y. contributed equally to this work
Contributor Information
Lixiang Xue, Email: lixiangxue@hsc.pku.edu.cn.
Junjie Wang, Email: junjiewang_edu@sina.cn.
References
- 1. Kipps E, Tan DS, Kaye SB. Meeting the challenge of ascites in ovarian cancer: new avenues for therapy and research. Nat Rev Cancer 2013;13:273–82. [DOI] [PMC free article] [PubMed] [Google Scholar]
- 2. Ahmed N, Stenvers KL. Getting to know ovarian cancer ascites: opportunities for targeted therapy‐based translational research. Front Oncol 2013;3:256. [DOI] [PMC free article] [PubMed] [Google Scholar]
- 3. Radestad E, Klynning C, Stikvoort A, et al. Immune profiling and identification of prognostic immune‐related risk factors in human ovarian cancer. Onco Targets Ther 2019;8:e1535730. [DOI] [PMC free article] [PubMed] [Google Scholar]
- 4. Landskron J, Helland O, Torgersen KM, et al. Activated regulatory and memory T‐cells accumulate in malignant ascites from ovarian carcinoma patients. Cancer Immunol Immunother 2015;64:337–47. [DOI] [PMC free article] [PubMed] [Google Scholar]
- 5. Obermajer N, Muthuswamy R, Odunsi K, et al. PGE(2)‐induced CXCL12 production and CXCR4 expression controls the accumulation of human MDSCs in ovarian cancer environment. Cancer Res 2011;71:7463–70. [DOI] [PMC free article] [PubMed] [Google Scholar]
- 6. Song M, Sandoval TA, Chae CS, et al. IRE1alpha‐XBP1 controls T cell function in ovarian cancer by regulating mitochondrial activity. Nature 2018;562:423–8. [DOI] [PMC free article] [PubMed] [Google Scholar]
- 7. Simpson‐Abelson MR, Loyall JL, Lehman HK, et al. Human ovarian tumor ascites fluids rapidly and reversibly inhibit T cell receptor‐induced NF‐kappaB and NFAT signaling in tumor‐associated T cells. Cancer Immun 2013;13:14. [PMC free article] [PubMed] [Google Scholar]
- 8. Brencicova E, Jagger AL, Evans HG, et al. Interleukin‐10 and prostaglandin E2 have complementary but distinct suppressive effects on toll‐like receptor‐mediated dendritic cell activation in ovarian carcinoma. PLoS One 2017;12:e0175712. [DOI] [PMC free article] [PubMed] [Google Scholar]
- 9. Abrahams VM, Straszewski SL, Kamsteeg M, et al. Epithelial ovarian cancer cells secrete functional Fas ligand. Cancer Res 2003;63:5573–81. [PubMed] [Google Scholar]
- 10. Lane D, Goncharenko‐Khaider N, Rancourt C, et al. Ovarian cancer ascites protects from TRAIL‐induced cell death through alphavbeta5 integrin‐mediated focal adhesion kinase and Akt activation. Oncogene 2010;29:3519–31. [DOI] [PubMed] [Google Scholar]
- 11. Lane D, Robert V, Grondin R, et al. Malignant ascites protect against TRAIL‐induced apoptosis by activating the PI3K/Akt pathway in human ovarian carcinoma cells. Int J Cancer 2007;121:1227–37. [DOI] [PubMed] [Google Scholar]
- 12. Kobel M, Rahimi K, Rambau PF, et al. An immunohistochemical algorithm for ovarian carcinoma typing. Int J Gynecol Pathol 2016;35:430–41. [DOI] [PMC free article] [PubMed] [Google Scholar]
- 13. Labidi‐Galy SI, Papp E, Hallberg D, et al. High grade serous ovarian carcinomas originate in the fallopian tube. Nat Commun 2017;8:1093. [DOI] [PMC free article] [PubMed] [Google Scholar]
- 14. Kim KS, Sengupta S, Berk M, et al. Hypoxia enhances lysophosphatidic acid responsiveness in ovarian cancer cells and lysophosphatidic acid induces ovarian tumor metastasis in vivo. Cancer Res 2006;66:7983–90. [DOI] [PubMed] [Google Scholar]
- 15. Carreau A, El Hafny‐Rahbi B, Matejuk A, et al. Why is the partial oxygen pressure of human tissues a crucial parameter? Small molecules and hypoxia. J Cell Mol Med 2011;15:1239–53. [DOI] [PMC free article] [PubMed] [Google Scholar]
- 16. Webb BA, Chimenti M, Jacobson MP, et al. Dysregulated pH: a perfect storm for cancer progression. Nat Rev Cancer 2011;11:671–7. [DOI] [PubMed] [Google Scholar]
- 17. Barsoum IB, Koti M, Siemens DR, et al. Mechanisms of hypoxia‐mediated immune escape in cancer. Cancer Res 2014;74:7185–90. [DOI] [PubMed] [Google Scholar]
- 18. Sun J, Zhang Y, Yang M, et al. Hypoxia induces T‐cell apoptosis by inhibiting chemokine C receptor 7 expression: the role of adenosine receptor a(2). Cell Mol Immunol 2010;7:77–82. [DOI] [PMC free article] [PubMed] [Google Scholar]
- 19. Zuckerberg AL, Goldberg LI, Lederman HM. Effects of hypoxia on interleukin‐2 mRNA expression by T lymphocytes. Crit Care Med 1994;22:197–203. [DOI] [PubMed] [Google Scholar]
- 20. Kumar V, Patel S, Tcyganov E, et al. The nature of myeloid‐derived suppressor cells in the tumor microenvironment. Trends Immunol 2016;37:208–20. [DOI] [PMC free article] [PubMed] [Google Scholar]
- 21. Barsoum IB, Smallwood CA, Siemens DR, et al. A mechanism of hypoxia‐mediated escape from adaptive immunity in cancer cells. Cancer Res 2014;74:665–74. [DOI] [PubMed] [Google Scholar]
- 22. Noman MZ, Desantis G, Janji B, et al. PD‐L1 is a novel direct target of HIF‐1alpha, and its blockade under hypoxia enhanced MDSC‐mediated T cell activation. J Exp Med 2014;211:781–90. [DOI] [PMC free article] [PubMed] [Google Scholar]
- 23. McNamee EN, Korns Johnson D, Homann D, et al. Hypoxia and hypoxia‐inducible factors as regulators of T cell development, differentiation, and function. Immunol Res 2013;55:58–70. [DOI] [PMC free article] [PubMed] [Google Scholar]
- 24. Koh MY, Powis G. Passing the baton: the HIF switch. Trends Biochem Sci 2012;37:364–72. [DOI] [PMC free article] [PubMed] [Google Scholar]
- 25. Zou W, Shah YM. A PHD in immunosuppression: oxygen‐sensing pathways regulate immunosuppressive Tregs. J Clin Invest 2019;130:3524–6. [DOI] [PMC free article] [PubMed] [Google Scholar]
- 26. Yamamoto A, Hester J, Macklin PS, et al. Systemic silencing of PHD2 causes reversible immune regulatory dysfunction. J Clin Invest 2019;130:3640–56. [DOI] [PMC free article] [PubMed] [Google Scholar]
- 27. Birner P, Schindl M, Obermair A, et al. Expression of hypoxia‐inducible factor 1alpha in epithelial ovarian tumors: its impact on prognosis and on response to chemotherapy. Clin Cancer Res 2001;7:1661–8. [PubMed] [Google Scholar]
- 28. Facciabene A, Peng X, Hagemann IS, et al. Tumour hypoxia promotes tolerance and angiogenesis via CCL28 and T(reg) cells. Nature 2011;475:226–30. [DOI] [PubMed] [Google Scholar]
- 29. Daponte A, Ioannou M, Mylonis I, et al. Prognostic significance of hypoxia‐inducible factor 1 alpha(HIF‐1 alpha) expression in serous ovarian cancer: an immunohistochemical study. BMC Cancer 2008;8:335. [DOI] [PMC free article] [PubMed] [Google Scholar]
- 30. Kryczek I, Lange A, Mottram P, et al. CXCL12 and vascular endothelial growth factor synergistically induce neoangiogenesis in human ovarian cancers. Cancer Res 2005;65:465–72. [PubMed] [Google Scholar]
- 31. Greenhough A, Smartt HJ, Moore AE, et al. The COX‐2/PGE2 pathway: key roles in the hallmarks of cancer and adaptation to the tumour microenvironment. Carcinogenesis 2009;30:377–86. [DOI] [PubMed] [Google Scholar]
- 32. Costa A, Scholer‐Dahirel A, Mechta‐Grigoriou F. The role of reactive oxygen species and metabolism on cancer cells and their microenvironment. Semin Cancer Biol 2014;25:23–32. [DOI] [PubMed] [Google Scholar]
- 33. Vijayan D, Young A, Teng MWL, et al. Targeting immunosuppressive adenosine in cancer. Nat Rev Cancer 2017;17:709–24. [DOI] [PubMed] [Google Scholar]
- 34. Jung J, Zeng H, Horng T. Metabolism as a guiding force for immunity. Nat Cell Biol 2019;21:85–93. [DOI] [PubMed] [Google Scholar]
- 35. Lemos H, Huang L, Prendergast GC, et al. Immune control by amino acid catabolism during tumorigenesis and therapy. Nat Rev Cancer 2019;19:162–75. [DOI] [PubMed] [Google Scholar]
- 36. Pavlides S, Whitaker‐Menezes D, Castello‐Cros R, et al. The reverse Warburg effect: aerobic glycolysis in cancer associated fibroblasts and the tumor stroma. Cell Cycle 2009;8:3984–4001. [DOI] [PubMed] [Google Scholar]
- 37. Hart PC, Kenny HA, Grassl N, et al. Mesothelial cell HIF1alpha expression is metabolically downregulated by metformin to prevent oncogenic tumor‐stromal crosstalk. Cell Rep 2019;29:4086–98.e6. [DOI] [PMC free article] [PubMed] [Google Scholar]
- 38. Chang CH, Qiu J, O'Sullivan D, et al. Metabolic competition in the tumor microenvironment is a driver of cancer progression. Cell 2015;162:1229–41. [DOI] [PMC free article] [PubMed] [Google Scholar]
- 39. Sukumar M, Roychoudhuri R, Restifo NP. Nutrient competition: a new Axis of tumor immunosuppression. Cell 2015;162:1206–8. [DOI] [PMC free article] [PubMed] [Google Scholar]
- 40. Jacobs SR, Herman CE, Maciver NJ, et al. Glucose uptake is limiting in T cell activation and requires CD28‐mediated Akt‐dependent and independent pathways. J Immunol 2008;180:4476–86. [DOI] [PMC free article] [PubMed] [Google Scholar]
- 41. Cham CM, Driessens G, O'Keefe JP, et al. Glucose deprivation inhibits multiple key gene expression events and effector functions in CD8+ T cells. Eur J Immunol 2008;38:2438–50. [DOI] [PMC free article] [PubMed] [Google Scholar]
- 42. Zhao E, Maj T, Kryczek I, et al. Cancer mediates effector T cell dysfunction by targeting microRNAs and EZH2 via glycolysis restriction. Nat Immunol 2016;17:95–103. [DOI] [PMC free article] [PubMed] [Google Scholar]
- 43. Michalek RD, Gerriets VA, Jacobs SR, et al. Cutting edge: distinct glycolytic and lipid oxidative metabolic programs are essential for effector and regulatory CD4+ T cell subsets. J Immunol 2011;186:3299–303. [DOI] [PMC free article] [PubMed] [Google Scholar]
- 44. Beier UH, Angelin A, Akimova T, et al. Essential role of mitochondrial energy metabolism in Foxp3(+) T‐regulatory cell function and allograft survival. FASEB J 2015;29:2315–26. [DOI] [PMC free article] [PubMed] [Google Scholar]
- 45. Shender VO, Pavlyukov MS, Ziganshin RH, et al. Proteome‐metabolome profiling of ovarian cancer ascites reveals novel components involved in intercellular communication. Mol Cell Proteom 2014;13:3558–71. [DOI] [PMC free article] [PubMed] [Google Scholar]
- 46. Blake P, Burkart JM, Churchill DN, et al. Recommended clinical practices for maximizing peritoneal dialysis clearances. Perit Dial Int 1996;16:448–56. [PubMed] [Google Scholar]
- 47. Macintyre AN, Gerriets VA, Nichols AG, et al. The glucose transporter Glut1 is selectively essential for CD4 T cell activation and effector function. Cell Metab 2014;20:61–72. [DOI] [PMC free article] [PubMed] [Google Scholar]
- 48. Lyssiotis CA, Kimmelman AC. Metabolic interactions in the tumor microenvironment. Trends Cell Biol 2017;27:863–75. [DOI] [PMC free article] [PubMed] [Google Scholar]
- 49. UniProt: a worldwide hub of protein knowledge. Nucleic Acids Res 2019;47:D506–15. [DOI] [PMC free article] [PubMed] [Google Scholar]
- 50. Munder M, Schneider H, Luckner C, et al. Suppression of T‐cell functions by human granulocyte arginase. Blood 2006;108:1627–34. [DOI] [PubMed] [Google Scholar]
- 51. Czystowska‐Kuzmicz M, Sosnowska A, Nowis D, et al. Small extracellular vesicles containing arginase‐1 suppress T‐cell responses and promote tumor growth in ovarian carcinoma. Nat Commun 2019;10:3000. [DOI] [PMC free article] [PubMed] [Google Scholar]
- 52. Wong JL, Obermajer N, Odunsi K, et al. Synergistic COX2 induction by IFNgamma and TNFalpha self‐limits type‐1 immunity in the human tumor microenvironment. Cancer Immunol Res 2016;4:303–11. [DOI] [PMC free article] [PubMed] [Google Scholar]
- 53. Wu L, Deng Z, Peng Y, et al. Ascites‐derived IL‐6 and IL‐10 synergistically expand CD14(+)HLA‐DR(−/low) myeloid‐derived suppressor cells in ovarian cancer patients. Oncotarget 2017;8:76843–56. [DOI] [PMC free article] [PubMed] [Google Scholar]
- 54. Okla K, Czerwonka A, Wawruszak A, et al. Clinical relevance and immunosuppressive pattern of circulating and infiltrating subsets of myeloid‐derived suppressor cells (MDSCs) in epithelial ovarian cancer. Front Immunol 2019;10:691. [DOI] [PMC free article] [PubMed] [Google Scholar]
- 55. Horikawa N, Abiko K, Matsumura N, et al. Expression of vascular endothelial growth factor in ovarian cancer inhibits tumor immunity through the accumulation of myeloid‐derived suppressor cells. Clin Cancer Res 2017;23:587–99. [DOI] [PubMed] [Google Scholar]
- 56. Montalban Del Barrio I, Penski C, Schlahsa L, et al. Adenosine‐generating ovarian cancer cells attract myeloid cells which differentiate into adenosine‐generating tumor associated macrophages ‐ a self‐amplifying, CD39‐ and CD73‐dependent mechanism for tumor immune escape. J Immunother Cancer 2016;4:49. [DOI] [PMC free article] [PubMed] [Google Scholar]
- 57. Madeddu C, Gramignano G, Kotsonis P, et al. Microenvironmental M1 tumor‐associated macrophage polarization influences cancer‐related anemia in advanced ovarian cancer: key role of interleukin‐6. Haematologica 2018;103:e388–91. [DOI] [PMC free article] [PubMed] [Google Scholar]
- 58. Chen RR, Yung MMH, Xuan Y, et al. Targeting of lipid metabolism with a metabolic inhibitor cocktail eradicates peritoneal metastases in ovarian cancer cells. Commun Biol 2019;2:281. [DOI] [PMC free article] [PubMed] [Google Scholar]
- 59. Nieman KM, Kenny HA, Penicka CV, et al. Adipocytes promote ovarian cancer metastasis and provide energy for rapid tumor growth. Nat Med 2011;17:1498–503. [DOI] [PMC free article] [PubMed] [Google Scholar]
- 60. Jiang L, Fang X, Wang H, et al. Ovarian cancer‐intrinsic fatty acid synthase prevents anti‐tumor immunity by disrupting tumor‐infiltrating dendritic cells. Front Immunol 2018;9:2927. [DOI] [PMC free article] [PubMed] [Google Scholar]
- 61. Schumann T, Adhikary T, Wortmann A, et al. Deregulation of PPARbeta/delta target genes in tumor‐associated macrophages by fatty acid ligands in the ovarian cancer microenvironment. Oncotarget 2015;6:13416–33. [DOI] [PMC free article] [PubMed] [Google Scholar]
- 62. Poulsen L, Siersbaek M, Mandrup S. PPARs: fatty acid sensors controlling metabolism. Semin Cell Dev Biol 2012;23:631–9. [DOI] [PubMed] [Google Scholar]
- 63. Xu HE, Lambert MH, Montana VG, et al. Molecular recognition of fatty acids by peroxisome proliferator‐activated receptors. Mol Cell 1999;3:397–403. [DOI] [PubMed] [Google Scholar]
- 64. Vettukattil R, Hetland TE, Florenes VA, et al. Proton magnetic resonance metabolomic characterization of ovarian serous carcinoma effusions: chemotherapy‐related effects and comparison with malignant mesothelioma and breast carcinoma. Hum Pathol 2013;44:1859–66. [DOI] [PubMed] [Google Scholar]
- 65. Daynes RA, Jones DC. Emerging roles of PPARs in inflammation and immunity. Nat Rev Immunol 2002;2:748–59. [DOI] [PubMed] [Google Scholar]
- 66. Chowdhury PS, Chamoto K, Kumar A, et al. PPAR‐induced fatty acid oxidation in T cells increases the number of tumor‐reactive CD8(+) T cells and facilitates anti‐PD‐1 therapy. Cancer Immunol Res 2018;6:1375–87. [DOI] [PubMed] [Google Scholar]
- 67. Wang D, DuBois RN. The role of prostaglandin E(2) in tumor‐associated immunosuppression. Trends Mol Med 2016;22:1–3. [DOI] [PMC free article] [PubMed] [Google Scholar]
- 68. Herber DL, Cao W, Nefedova Y, et al. Lipid accumulation and dendritic cell dysfunction in cancer. Nat Med 2010;16:880–6. [DOI] [PMC free article] [PubMed] [Google Scholar]
- 69. Ramakrishnan R, Tyurin VA, Veglia F, et al. Oxidized lipids block antigen cross‐presentation by dendritic cells in cancer. J Immunol 2014;192:2920–31. [DOI] [PMC free article] [PubMed] [Google Scholar]
- 70. Cubillos‐Ruiz JR, Silberman PC, Rutkowski MR, et al. ER stress sensor XBP1 controls anti‐tumor immunity by disrupting dendritic cell homeostasis. Cell 2015;161:1527–38. [DOI] [PMC free article] [PubMed] [Google Scholar]
- 71. Ren J, Xiao YJ, Singh LS, et al. Lysophosphatidic acid is constitutively produced by human peritoneal mesothelial cells and enhances adhesion, migration, and invasion of ovarian cancer cells. Cancer Res 2006;66:3006–14. [DOI] [PubMed] [Google Scholar]
- 72. Oda SK, Strauch P, Fujiwara Y, et al. Lysophosphatidic acid inhibits CD8 T cell activation and control of tumor progression. Cancer Immunol Res 2013;1:245–55. [DOI] [PMC free article] [PubMed] [Google Scholar]
- 73. Di Virgilio F, Sarti AC, Falzoni S, et al. Extracellular ATP and P2 purinergic signalling in the tumour microenvironment. Nat Rev Cancer 2018;18:601–18. [DOI] [PubMed] [Google Scholar]
- 74. Ohta A, Kini R, Ohta A, et al. The development and immunosuppressive functions of CD4(+) CD25(+) FoxP3(+) regulatory T cells are under influence of the adenosine‐A2A adenosine receptor pathway. Front Immunol 2012;3:190. [DOI] [PMC free article] [PubMed] [Google Scholar]
- 75. Maj T, Wang W, Crespo J, et al. Oxidative stress controls regulatory T cell apoptosis and suppressor activity and PD‐L1‐blockade resistance in tumor. Nat Immunol 2017;18:1332–41. [DOI] [PMC free article] [PubMed] [Google Scholar]
- 76. Sorrentino C, Miele L, Porta A, et al. Myeloid‐derived suppressor cells contribute to A2B adenosine receptor‐induced VEGF production and angiogenesis in a mouse melanoma model. Oncotarget 2015;6:27478–89. [DOI] [PMC free article] [PubMed] [Google Scholar]
- 77. Bahreyni A, Samani SS, Ghorbani E, et al. Adenosine: an endogenous mediator in the pathogenesis of gynecological cancer. J Cell Physiol 2018;233:2715–22. [DOI] [PubMed] [Google Scholar]
- 78. Turcotte M, Spring K, Pommey S, et al. CD73 is associated with poor prognosis in high‐grade serous ovarian cancer. Cancer Res 2015;75:4494–503. [DOI] [PubMed] [Google Scholar]
- 79. Hausler SF, Montalban del Barrio I, Strohschein J, et al. Ectonucleotidases CD39 and CD73 on OvCA cells are potent adenosine‐generating enzymes responsible for adenosine receptor 2A‐dependent suppression of T cell function and NK cell cytotoxicity. Cancer Immunol Immunother 2011;60:1405–18. [DOI] [PMC free article] [PubMed] [Google Scholar]
- 80. Nathan C, Cunningham‐Bussel A. Beyond oxidative stress: an immunologist's guide to reactive oxygen species. Nat Rev Immunol 2013;13:349–61. [DOI] [PMC free article] [PubMed] [Google Scholar]
- 81. Gelderman KA, Hultqvist M, Holmberg J, et al. T cell surface redox levels determine T cell reactivity and arthritis susceptibility. Proc Natl Acad Sci USA 2006;103:12831–6. [DOI] [PMC free article] [PubMed] [Google Scholar]
- 82. Williams MS, Kwon J. T cell receptor stimulation, reactive oxygen species, and cell signaling. Free Radic Biol Med 2004;37:1144–51. [DOI] [PubMed] [Google Scholar]
- 83. Efimova O, Szankasi P, Kelley TW. Ncf1 (p47phox) is essential for direct regulatory T cell mediated suppression of CD4+ effector T cells. PLoS One 2011;6:e16013. [DOI] [PMC free article] [PubMed] [Google Scholar]
- 84. Yang WS, Stockwell BR. Ferroptosis: death by lipid peroxidation. Trends Cell Biol 2016;26:165–76. [DOI] [PMC free article] [PubMed] [Google Scholar]
- 85. Lang X, Green MD, Wang W, et al. Radiotherapy and immunotherapy promote tumoral lipid oxidation and ferroptosis via synergistic repression of SLC7A11. Cancer Discov 2019;9:1673–85. [DOI] [PMC free article] [PubMed] [Google Scholar]
- 86. Wang W, Green M, Choi JE, et al. CD8(+) T cells regulate tumour ferroptosis during cancer immunotherapy. Nature 2019;569:270–4. [DOI] [PMC free article] [PubMed] [Google Scholar]
- 87. Wang W, Liu JR, Zou W. Immunotherapy in ovarian cancer. Surg Oncol Clin N Am 2019;28:447–64. [DOI] [PMC free article] [PubMed] [Google Scholar]
- 88. Worzfeld T, Pogge von Strandmann E, Huber M, et al. The unique molecular and cellular microenvironment of ovarian cancer. Front Oncol 2017;7:24. [DOI] [PMC free article] [PubMed] [Google Scholar]
- 89. Wahba J, Natoli M, Whilding LM, et al. Chemotherapy‐induced apoptosis, autophagy and cell cycle arrest are key drivers of synergy in chemo‐immunotherapy of epithelial ovarian cancer. Cancer Immunol Immunother 2018;67:1753–65. [DOI] [PMC free article] [PubMed] [Google Scholar]
- 90. Wadsak W, Mitterhauser M. Basics and principles of radiopharmaceuticals for PET/CT. Eur J Radiol 2010;73:461–9. [DOI] [PubMed] [Google Scholar]
- 91. Hesketh RL, Brindle KM. Magnetic resonance imaging of cancer metabolism with hyperpolarized (13)C‐labeled cell metabolites. Curr Opin Chem Biol 2018;45:187–94. [DOI] [PubMed] [Google Scholar]
- 92. Porta Siegel T, Hamm G, Bunch J, et al. Mass spectrometry imaging and integration with other imaging modalities for greater molecular understanding of biological tissues. Mol Imaging Biol 2018;20:888–901. [DOI] [PMC free article] [PubMed] [Google Scholar]
- 93. Zou Y, Wang A, Shi M, et al. Analysis of redox landscapes and dynamics in living cells and in vivo using genetically encoded fluorescent sensors. Nat Protoc 2018;13:2362–86. [DOI] [PMC free article] [PubMed] [Google Scholar]