

Abstract
Objectives
To describe haemodynamic resuscitation practices in ED patients with suspected sepsis and hypotension.
Methods
This was a prospective, multicentre, observational study conducted in 70 hospitals in Australia and New Zealand between September 2018 and January 2019. Consecutive adults presenting to the ED during a 30‐day period at each site, with suspected sepsis and hypotension (systolic blood pressure <100 mmHg) despite at least 1000 mL fluid resuscitation, were eligible. Data included baseline demographics, clinical and laboratory variables and intravenous fluid volume administered, vasopressor administration at baseline and 6‐ and 24‐h post‐enrolment, time to antimicrobial administration, intensive care admission, organ support and in‐hospital mortality.
Results
A total of 4477 patients were screened and 591 were included with a mean (standard deviation) age of 62 (19) years, Acute Physiology and Chronic Health Evaluation II score 15.2 (6.6) and a median (interquartile range) systolic blood pressure of 94 mmHg (87–100). Median time to first intravenous antimicrobials was 77 min (42–148). A vasopressor infusion was commenced within 24 h in 177 (30.2%) patients, with noradrenaline the most frequently used (n = 138, 78%). A median of 2000 mL (1500–3000) of intravenous fluids was administered prior to commencing vasopressors. The total volume of fluid administered from pre‐enrolment to 24 h was 4200 mL (3000–5661), with a range from 1000 to 12 200 mL. Two hundred and eighteen patients (37.1%) were admitted to an intensive care unit. Overall in‐hospital mortality was 6.2% (95% confidence interval 4.4–8.5%).
Conclusion
Current resuscitation practice in patients with sepsis and hypotension varies widely and occupies the spectrum between a restricted volume/earlier vasopressor and liberal fluid/later vasopressor strategy.
Keywords: emergency department, fluid therapy, hypotension, sepsis, vasopressor
Key findings.
The optimal volume and timing of fluid resuscitation and initiation of vasopressor support in patients with sepsis and hypotension is unknown.
Current resuscitation practices in patients with sepsis and hypotension vary widely in our study, with fluid volume given in the first 24 hours ranging from 1–12 L.
This study will inform the design of a randomised controlled trial comparing a restricted volume (earlier vasopressor) to a liberal fluid (later vasopressor) strategy.
Introduction
Hypotension in sepsis results from a variable combination of fluid extravasation, peripheral vasodilatation and myocardial depression.1 A cornerstone of immediate management is the administration of intravenous (IV) fluid, followed by commencement of a vasopressor infusion if hypotension and/or poor end‐organ perfusion persists. In the absence of high‐quality evidence to support specific fluid volumes, a 30 mL/kg or greater IV fluid bolus is recommended by the Surviving Sepsis Campaign.2 However, the evaluation of a protocolised sepsis care bundle in almost 50 000 patients did not find any association between administration of 30 mL/kg IV fluid within 3 h of ED presentation, and differential mortality.3
Despite the almost universal clinical acceptance of fluid administration in sepsis, there are multiple studies that suggest possible harm from the liberal use of this intervention.4, 5, 6, 7, 8, 9, 10 As these studies were conducted in intensive care settings,4, 5 conducted in low‐income countries,6, 7, 8 or involved preclinical models,10 their findings cannot be generalised to adults presenting to the ED with suspected sepsis in Australia and New Zealand. Indeed, an alternative approach to sepsis resuscitation is earlier initiation of vasopressor infusions, with observational studies reporting increased mortality when this is delayed.11, 12 Moreover, a recent single centre double‐blind randomised controlled trial conducted in a tertiary hospital in Thailand demonstrated that administration of low‐dose noradrenaline resulted in greater shock resolution by 6 h, as compared with placebo (75 vs 48%).13
Accordingly, the optimal volume and timing of fluid resuscitation and initiation of vasopressor support in patients with sepsis and hypotension represent significant knowledge gaps.14, 15, 16 A comprehensive understanding of current resuscitation practices is essential for the design and conduct of future large‐scale clinical trials evaluating the effects of alternative strategies (such as restricted fluid therapy combined with early vasopressor use), in patients presenting to the ED with septic shock.
As such, the aim of the Australasian resuscitation in sepsis evaluation: Fluid or vasopressors in ED sepsis (ARISE FLUIDS) observational study was to describe current resuscitation practices and outcomes in patients presenting to the ED with sepsis, specifically to determine: (i) current IV fluid and vasopressor administration; (ii) in‐hospital mortality and receipt of organ support; and (iii) the incidence of patients presenting to the ED with sepsis and hypotension.
Methods
Design, setting and participants
The methodology of the ARISE FLUIDS observational study has been published previously,17 and was endorsed by the Australasian College for Emergency Medicine Clinical Trials Network. Human Research and Ethics and governance approval was obtained for all sites according to local requirement and data collection with a waiver of patient consent was approved. Briefly, ARISE FLUIDS was a prospective, multi‐centre observational study conducted in 70 EDs in Australia and New Zealand, where individual sites could select a consecutive 30‐day data collection period commencing between 13 September 2018 and 15 December 2018, with final data collected on 13 January 2019. During the site‐selected data collection period, adult patients presenting to the ED were eligible for inclusion if they met the following inclusion criteria: (i) clinically suspected infection; (ii) IV antimicrobials commenced; and (iii) systolic blood pressure (SBP) <100 mmHg at any time in ED despite at least 1000 mL IV fluid resuscitation. This had to be given as fluid bolus(es) of at least 500 mL, within 60 min per bolus, inclusive of pre‐hospital fluids. Exclusion criteria were: (i) hypotension suspected to be due to another cause e.g. arrhythmia, haemorrhage; (ii) confirmed or suspected pregnancy; (iii) comorbidities such that intensive care unit (ICU) or high dependency unit admission for vasopressor use is not appropriate; (iv) death deemed imminent or inevitable by the treating clinician; (v) life expectancy <90 days due to an underlying illness; and (vi) transfer from another acute care hospital.
Screening, data collection and follow‐up
All sites were provided with a preformatted screening form and standardised education material to optimise screening, identification of eligible patients and data collection. For patients meeting all study entry criteria (Fig. 1), a detailed case report form was completed.17 Relevant variables and outcomes included: (i) baseline demographics and comorbidities; (ii) vital signs and laboratory variables at baseline and at 6 h post‐enrolment; (iii) type, timing and dose of IV fluid and vasopressor administration from ED presentation up to 24 h post‐enrolment (including fluids administered pre‐hospital); (iv) time to commencing the first IV antimicrobial agent; (v) source of sepsis and source control; (vi) ED duration of stay; (vii) ICU/high dependency unit admission; and (viii) in‐hospital mortality. For patients admitted to the ICU, we collected additional information on ICU duration of stay and receipt and duration of invasive mechanical ventilation, vasopressors and acute renal replacement therapy. De‐identified data were entered by local site investigators or the coordinating site into a purpose‐built web‐based database (REDCap®) hosted by the Australian and New Zealand Intensive Care Research Centre, Monash University. The ARISE FLUIDS study conforms to the STROBE principles for reporting of observational studies.18
Figure 1.
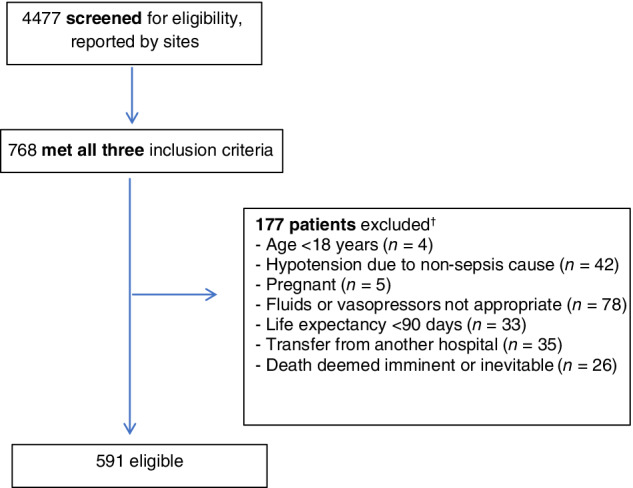
Patient flowchart. †Some patients met >1 exclusion criterion.
Statistical analysis
We did not perform a formal sample size calculation as this was a descriptive study. The analysis plan anticipated data collection on 400 patients.17 Continuous variables are reported as mean and standard deviation (SD) or median and interquartile range (IQR) and categorical variables as proportions (%) as appropriate. Baseline characteristics, process‐of‐care measures (e.g. fluid volume at 6‐ and 24‐h post‐enrolment and frequency, timing and duration of vasopressor administration) and outcomes (e.g. ED disposition, ICU admission, receipt and duration of organ support and in‐hospital mortality) are reported.
Subgroups based on pre‐enrolment characteristics were specified a priori: (i) hospital type (rural/regional, metropolitan/district, private, tertiary); (ii) age <65 versus ≥65 years; (iii) quartiles of the Acute Physiology and Chronic Health Evaluation (APACHE II) score at T0; (iv) presence of cardiovascular disease; (v) SBP <90 versus ≥90 mmHg; (vi) lactate <2.0 versus ≥2.0 mmol/L; (vii) SBP <90 mmHg and lactate ≥2.0 mmol/L and first dose of IV antimicrobials commenced patients versus patients not meeting these criteria; (vi) source of sepsis; abdominal source versus other; respiratory source versus other; (vii) quartiles of fluid volume administered up to 6 h post‐enrolment; and (viii) quartiles of time to commencing a vasopressor infusion. Between‐group differences in in‐hospital mortality, ICU admission and receipt and duration of organ support were compared for the quartiles of volume of fluid administered and quartiles of time to commencing vasopressors sub‐groups. Chi‐squared or Fisher's exact test for categorical variables were used and Student's t‐test or Mann–Whitney U‐test used for continuous variables.
Results
The 70 participating EDs had a combined adult patient attendance during their respective 30‐day data collection periods of 295 904 patients. Of 4477 patients screened, 591 (13.2%) patients met the eligibility criteria for detailed data collection (Fig. 1).
Baseline characteristics
Baseline characteristics are summarised in Table 1. The mean (SD) age was 62.4 (19.1) years and APACHE II score 15.2 (6.7). The median time from ED presentation to commencing IV antimicrobials was 77 (IQR 42–148) minutes. More than one‐third (37.6%, n = 222) had no prior co‐morbidities and 9.8% (n = 58) lived in a residential care setting. Table S1 portrays vital signs, blood gas analyses, receipt of invasive ventilation and laboratory data at baseline, 6, and 24 h.
Table 1.
Baseline characteristics and comorbidities at T0 (n = 591)
| Variable | n | |
|---|---|---|
| Age, years, mean (SD) | 62.4 (19.1) | 583 |
| Female sex, n (%) | 290 (49.2) | 590 |
| Weight, kg, median (IQR) | 75 (62.3–90) | 363 |
| Lactate, mmol/L, median (IQR) | 2.2 (1.4–3.4) | 474 |
| APACHE II score, mean (SD) | 15.2 (6.67) | 590 |
| Time from triage to T0, h, median (IQR) | 2.43 (1.28–4.28) | 590 |
| Time from triage to first IV antimicrobials, min, median (IQR) | 77 (42–148) | 584 |
| Total fluid volume prior to T0, mL, median (IQR) | 1000 (1000–1500) | 590 |
| Invasive ventilation, n (%) | 4 (0.86) | 466 |
| Non‐invasive ventilation, n (%) | 17 (3.6) | 567 |
| Prior living status, n (%) | 589 | |
| Home | 526 (89.3) | |
| Residential care | 58 (9.8) | |
| Comorbidities, n (%) | 591 | |
| Respiratory disease | 150 (25.4) | |
| Immuno‐suppressed | 151 (25.6) | |
| Cardiac disease | 190 (32.1) | |
| Liver disease | 40 (6.8) | |
| Renal dialysis | 27 (4.6) | |
| None | 222 (37.6) |
T0 is defined as the time when all three inclusion criteria were met. Comorbidities as defined as per APACHE II definitions. Invasive ventilation indicates mechanical ventilation. APACHE II, Acute Physiology and Chronic Health Evaluation.
Fluid resuscitation and vasopressor therapy
Table 2 and Figure 2 summarise fluid and vasopressor administration up to 24 h post‐enrolment (including pre‐hospital fluids) for the overall cohort and the SBP and lactate subgroups. Overall, the fluid volume administered in the first 6 h post‐enrolment was 1789 mL (1000–2500) and, from pre‐enrolment to 24 h post‐enrolment, 4200 mL (3000–5661). Patients with a baseline SBP <90 mmHg, lactate ≥2 mmol/L or both, received total median fluid volumes of 4582, 4645 and 4805 mL up to 24 h, respectively. The majority of resuscitation fluid in the first 24 h consisted of 0.9% saline and balanced isotonic fluid (Table S2).
Table 2.
Fluid volume and vasopressor use, for overall group and selected subgroups
| Overall (n = 591) | SBP <90 (n = 191) | Lactate ≥2 (n = 264) | SBP <90 and lactate ≥2 (n = 82) | |
|---|---|---|---|---|
| Total fluid administered, mL | ||||
| Pre‐T0 h | ||||
| Median (IQR) | 1000 (1000–1500) | 1000 (1000–1500) | 1000 (1000–1900) | 1000 (1000–1900) |
| Mean (SD) | 1389 (647) | 1377 (642) | 1461 (669) | 1486 (753) |
| Between T0 and T6 h | ||||
| Median (IQR) | 1789 (1000–2500) | 2000 (1250–3000) | 2000 (1000–3000) | 2015 (1320–300) |
| Mean (SD) | 1908 (1230) | 2254 (1252) | 2126 (1244) | 2317 (1231) |
| Between T6 and T24 h | ||||
| Median (IQR) | 1000 (200–2000) | 1200 (500–2000) | 1165 (540–2000) | 1250 (625–2000) |
| Mean (SD) | 1273 (1111) | 1383 (1085) | 1394 (1111) | 1354 (1031) |
| Total: preT0‐T24 h | ||||
| Median (IQR) | 4200 (3000–5661) | 4582 (3500–6200) | 4645 (3498–6108) | 4805 (3900–6170) |
| Mean (SD) | 4518 (1980) | 4962 (1986) | 4936 (1973) | 5124 (1883) |
| Vasopressors started in ED, n (%) | 134 (22.7) | 74 (38.7) | 84 (31.8) | 42 (51.2) |
| Total fluid volume prior starting vasopressor infusion, mL | ||||
| Median (IQR) | 2000 (1500–3000) | 2000 (1500–3000) | 2000 (1500–3000) | 2000 (1250–3000) |
| Mean (SD) | 2465 (1280) | 2255 (1258) | 2461 (1292) | 2297 (1394) |
| Vasopressor infusion started before T24, n (%) | 177 (30.2) | 92 (48.4) | 114 (43.3) | 53 (64.6) |
| Time from Triage to start of vasopressor infusion, h, median (IQR) | 4.7 (2.7–7.8) | 4.2 (2.2–7.0) | 3.8 (2.3–6.7) | 3.5 (2.1–6.3) |
| Time from T0 to start of vasopressor infusion, h, median (IQR) | 2.5 (0.8–5.0) | 2.0 (0.6–4.5) | 1.9 (0.7–4.5) | 1.8 (0.4–3.1) |
| Duration of vasopressor infusion, h, median (IQR) | 26.2 (12–48) | 31 (15.6–52) | 29.8 (15–59) | 32.1 (19–69) |
| Type and median duration of individual vasopressors | ||||
| Noradrenaline, n (%) | 138 (78) | 70 (76.1) | 95 (83.3) | 43 (81.1) |
| Duration, h, median (IQR) | 5.27 (3.0–9.2) | 31 (17–50) | 33 (14–54) | 39 (19.5–55) |
| Metaraminol, n (%) | 74 (42) | 38 (41.8) | 45 (39.5) | 20 (37.7) |
| Duration, h, median (IQR) | 5.8 (2.7–26) | 7 (2.4–26) | 4 (2.4–17.1) | 4 (2.4–17.2) |
| Adrenaline, n (%) | 15 (8.6) | 11 (12.2) | 11 (9.8) | 7 (13.5) |
| Duration, h, median (IQR) | 4.6 (2.0–13.8) | 11 (5.5–22.7) | 13.7 (3.3–32) | 19.6 (5.5–42) |
| Vasopressin, n (%) | 19 (10.9) | 10 (11.1) | 18 (16.1) | 7 (13.5) |
| Duration, h, median (IQR) | 10.8 (5.4–15.1) | 22.7 (17–29) | 21.2 (16–36) | 19.7 (16–23) |
| Dobutamine, n (%) | 4 (2.3) | 2 (2.2) | 3 (2.7) | 1 (1.9) |
| Duration, h, median (IQR) | 9.1 (3.6–33.5) | N/A | N/A | N/A |
| CVC or PICC inserted before T24 hrs | 126 (21.5) | 65 (34.2) | 94 (35.7) | 41 (50.0) |
| Time from Triage to CVC/PICC insertion, hrs, median (IQR) | 6.5 (3.5–10.1) | 5.9 (3.5–8.9) | 6.1 (3.0–8.9) | 6.2 (3.5–8.0) |
Fluid volumes did not include maintenance fluids. T0 is defined as the time when all three inclusion criteria were met. CVC, central venous catheter; PICC, peripherally inserted central catheter.
Figure 2.
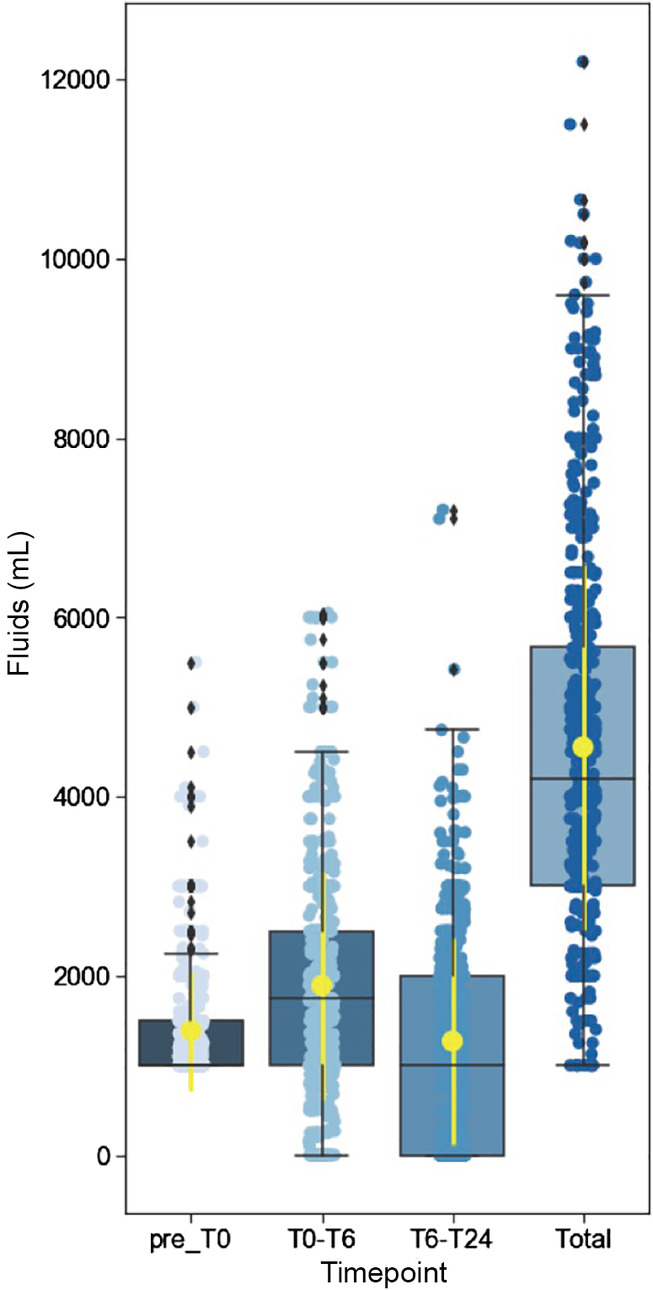
Intravenous fluid volumes administered in all eligible patients (n = 591). Box plots with median and IQR shown. Yellow: mean and standard deviation.
Almost one‐third of patients (30.2%, n = 177) received a vasopressor infusion in the first 24 h post‐enrolment, with noradrenaline (78%, n = 138) and metaraminol (42%, n = 74) most frequently used (Table 3). In patients with a SBP <90 mmHg at baseline, 48.4% (n = 92) received a vasopressor infusion up to 24 h post‐enrolment and in patients with a SBP <90 mmHg and a lactate ≥2 mmoL/L, almost two‐thirds (64.6%, n = 53) received a vasopressor. A central venous catheter or peripherally inserted central catheter were inserted in the first 24 h in 126 patients (21.5%).
Table 3.
Outcomes. Source of sepsis, ED disposition, ICU outcomes and organ support and mortality, for overall group and selected subgroups
| Overall (n = 581) | SBP <90 (n = 191) | Lactate ≥2 (n = 264) | SBP <90 and lactate ≥2 (n = 82) | |
|---|---|---|---|---|
| Source of sepsis, n (%) | ||||
| Respiratory | 198 (33.7) | 64 (33.5) | 88 (33.3) | 25 (30.5) |
| Urinary | 147 (25.0) | 45 (23.6) | 58 (22) | 20 (24.4) |
| Skin/soft tissue | 67 (11.4) | 28 (14.7) | 29 (11) | 11 (13.4) |
| Bloodstream | 14 (2.4) | 4 (2.1) | 7 (2.7) | 3 (3.7) |
| Abdo/pelvis | 80 (13.6) | 24 (12.6) | 43 (16.3) | 10 (12.2) |
| Central nervous system | 6 (1) | 0 (0) | 2 (0.8) | 0 (0) |
| Bone/joint | 7 (1.2) | 3 (1.6) | 4 (1.5) | 1 (1.2) |
| Other | 9 (1.5) | 2 (1) | 2 (0.8) | 1 (1.2) |
| No source found | 60 (10.2) | 20 (10.5) | 29 (11) | 10 (12.2) |
| Source control procedures performed, n (%) | 50 (8.5) | 21 (11.1) | 9.1 (24) | 10 (12.2) |
| Discharge destination from ED, n (%) | ||||
| ICU | 172 (29.4) | 84 (44.4) | 109 (41.6) | 46 (57.5) |
| HDU | 30 (5.1) | 13 (6.9) | 14 (5.3) | 5 (6.3) |
| CCU | 14 (2.4) | 0 (0) | 2 (0.8) | 0 (0) |
| Ward | 314 (53.7) | 74 (39.2) | 115 (43.9) | 21 (26.3) |
| ED short stay ward | 11 (1.9) | 3 (1.6) | 1 (0.4) | 0 (0) |
| Operating theatre | 13 (2.2) | 6 (3.2) | 8 (3.1) | 2 (2.5) |
| Transfer to other hospital | 31 (5.3) | 9 (4.8) | 11 (4.2) | 4 (5.0) |
| ED length of stay, h, median (IQR) | 7.9 (5.35–13.4) | 7.3 (4.8–11) | 7.7 (5.1–11.5) | 6.5 (4.3–9.8) |
| ICU outcomes | ||||
| Admitted to ICU within 24 h, n (%) | 218 (37.1) | 107 (56.6) | 132 (50.0) | 54 (65.9) |
| ICU duration of stay, days, median (IQR) | 2.4 (1.3–4.6) | 2.4 (1.2–4.5) | 2.7 (1.5–4.6) | 2.7 (1.7–4.5) |
| Patients receiving invasive ventilation, n (%) | 36 (16.7) | 14 (13.3) | 27 (20.8) | 8 (15.1) |
| Duration of ventilation, days, median (IQR) | 5.6 (2.0–7.08) | 4.35 (1.8–7.5) | 5.5 (1.9–7.3) | 4.4 (1.9–7.7) |
| Patients receiving acute (RRT), n (%) | 13 (6.1) | 7 (6.7) | 8 (6.3) | 3 (5.8) |
| Duration of RRT, days, median (IQR) | 2.2 (0.6–8.1) | 4.0 (0.2–6.8) | 3.1 (0.7–8.8) | 4.0 (0.2–6.8) |
| Hospital outcomes | ||||
| Hospital length of stay, days, median (IQR) | 5.1 (2.8–10.1) | 6.2 (3.6–12) | 7.1 (4.0–15) | 8.4 (4.0–15) |
| Discharge destination for survivors, n (%) | ||||
| Home | 451 (79.8) | 137 (75.7) | 202 (80.2) | 62 (80.5) |
| Care facility | 79 (14) | 27 (14.9) | 29 (11.5) | 9 (11.7) |
| Mortality, n (%) | ||||
| ED | 4 (0.7) | 2 (1) | 2 (0.8) | 2 (2.4) |
| ICU | 18 (8.6) | 8 (7.8) | 12 (9.4) | 1 (2) |
| In‐hospital | 36 (6.2) | 17 (9.3) | 21 (8.2) | 6 (7.8) |
ICU outcomes uses number of patients admitted to ICU as denominator. HDU, high dependency unit; RRT, renal replacement therapy.
Clinical outcomes
Overall, one‐third (33.7%, n = 198) of patients had a respiratory source and a quarter (25.0%, n = 147) had a urinary source, with no source found in 10.2% (n = 60). The median ED length of stay was 7.9 h (5.4–13.4) and over one‐third (37.1%, n = 218) of patients were admitted to an intensive care setting in the first 24 h. ICU admission rates were higher for the subgroups SBP <90 mmHg (56.6%, n = 107) and SBP <90 mmHg and lactate ≥2 mmol/L (65.9%, n = 54). For patients admitted to ICU within 24 h, the median length of stay was 2.4 days (1.3–4.6). One in six (16.7%, n = 36) patients admitted to ICU received invasive ventilation and 6.1% (n = 13) received acute renal replacement therapy. Hospital duration of stay for the whole patient cohort was 5.1 (2.8–10.1) days with an in‐hospital mortality of 6.2% (95% confidence interval 4.5–8.5%).
Subgroup analyses by fluid volume and time to vasopressor infusion
Pre‐specified sub‐group analyses are provided in Tables S3–S11. Tables 4, 5 show the clinical outcomes according to the volume of fluid administered in the 6 h post‐enrolment and the timing of commencing a vasopressor infusion.
Table 4.
Baseline characteristics, fluid volume, need for organ support and mortality; overall group and by quartiles of fluid administered T0–T6
| Overall (n = 584) | 0–1000 mL (n = 188)† | 1001–1800 mL (n = 104) | 1801–2501 mL (n = 147) | >2501 mL (n = 145) | |
|---|---|---|---|---|---|
| Female, n (%) | 286 (49) | 87 (46.3) | 49 (47.1) | 78 (53.1) | 72 (49.7) |
| Age, years | 62.5 (19.1) | 65.8 (19) | 61.3 (16.6) | 61.6 (18.6) | 59.8 (19.2) |
| Lactate, mmol/L | 2.2 (1.4–3.4) | 1.8 (1.3–3.1) | 2.1 (1.3–3.4) | 2.2 (1.5–3.4) | 2.8 (1.8–4.1) |
| APACHE II score | 15.2 (6.7) | 14.4 (6.4) | 14.5 (6.3) | 15.2 (6.5) | 16.6 (7.3) |
| SBP, mmHg | 94.8 (13.7) | 97.4 (12.5) | 94.3 (11) | 94.5 (14) | 91.8 (16.1) |
|
Time from triage to antibiotics, mins |
77 (42–147) | 85 (46–172) | 97 (41–180) | 77 (47–135) | 59 (34–117) |
| Fluid volume administered, mL | |||||
| Pre‐T0 h | |||||
| Median (IQR) | 1000 (1000–1500) | 1000 (1000–1535) | 1000 (1000–1500) | 1000 (1000–1500) | 1000 (1000–2000) |
| Mean (SD) | 1389 (647) | 1362 (571) | 1410 (743) | 1330 (564) | 1442 (678) |
| Between T0 and T6 h | |||||
| Median (IQR) | 1789 (1000–2500) | 900 (469–1000) | 1400 (1250–1538) | 2000 (2000–2306) | 3200 (3000–4000) |
| Mean (SD) | 1908 (1230) | 689 (380) | 1404 (212) | 2141 (211) | 3612 (871) |
| Between T6 and T24 h | |||||
| Median (IQR) | 1000 (200–2000) | 1000 (0–1825) | 1250 (759–1883) | 1000 (0–2000) | 1550 (850–2370) |
| Mean (SD) | 1273 (1111) | 975 (1091) | 1369 (993) | 1275 (1121) | 1590 (1119) |
| Total: pre‐T0 and T24 h | |||||
| Median (IQR) | 4200 (3000–5661) | 3000 (2000–4000) | 4000 (3300–4792) | 4500 (3753–5675) | 5350 (3600–6250) |
| Mean (SD) | 4543 (1969) | 3011 (1348) | 4183 (1269) | 4729 (1316) | 6600 (1724) |
| Total fluid volume administered prior to starting vasopressors, mL, n | 134 | 23 | 22 | 37 | 50 |
| Median (IQR) | 2000 (1500–3000) | 1750 (1125–3000) | 2000 (1500–2500) | 2000 (1850–3800) | 2750 (2000–3500) |
| Mean (SD) | 246 (1280) | 1887 (981) | 2072 (935) | 2492 (1220) | 2894 (1440) |
| Vasopressor infusion started in ED, n (%) | 132 (22.6) | 23 (12.2) | 22 (21.1) | 37 (25.2) | 50 (34.5) |
| Vasopressor infusion started before T24, n (%) | 176 (30.1) | 36 (19.1) | 27 (26) | 44 (29.9) | 69 (47.6) |
| Duration of vasopressor infusion, h, median (IQR) | 26.6 (12–48) | 24.5 (11–38) | 21.7 (6–45) | 17.5 (8–48) | 36 (22–69) |
| Time to start vasopressor infusion from T0, h, median (IQR) | 2.5 (0.9–5.0) | 2.4 (1.2–4.7) | 2.1 (0.5–5.4) | 2.1 (0.7–5.5) | 2.7 (1.0–5.3) |
| ICU outcomes | |||||
| Admitted to ICU within 24 h, n (%) | 217 (37.2) | 45 (23.9) | 32 (30.8) | 53 (36.1) | 87 (60.0) |
| Patients receiving invasive ventilation, n (%) | 36 (16.7) | 4 (9.1) | 4 (12.5) | 9 (17.0) | 19 (22.1) |
| Duration of ventilation, days, median (IQR) | 5.6 (2.0–7.1) | 4.4 (1.4–6.2) | 7.8 (0.6–8.4) | 6.0 (5.7–7.5) | 4.1 (2.0–6.9) |
| Patients receiving RRT, n (%) | 13 (6.1) | 2 (4.7) | 1 (3.1) | 3 (5.7) | 7 (8.2) |
| Duration of RRT, days, median (IQR) | 2.2 (0.6–6.8) | 0.9 (0.5–1.3) | 4.1 (4.1–4.1) | 0.6 (0.2–11) | 4.0 (0.9–20) |
| ICU mortality, n (%) | 18 (8.6) | 6 (14.3) | 4 (12.5) | 5 (9.6) | 3 (3.6) |
| Hospital mortality, n (%) | 36 (6.3) | 12 (6.5) | 7 (6.7) | 8 (5.5) | 9 (6.4) |
| Hospital length of stay, days, median (IQR) | 5.1 (2.8–10) | 4.5 (2.5–8.2) | 4.3 (2.8–8.3) | 5.8 (6.1–15) | 7.0 (3.7–14) |
As 88 patients had exactly 1000 mL administered in the first 6 h, the first and second fluid quartile do not have the same number of patients.
APACHE II: Acute Physiology and Chronic Health Evaluation; RRT, renal replacement therapy; SBP, systolic blood pressure; T0, time when all three inclusion criteria were met.
Table 5.
Baseline characteristics, fluid volume, need for organ support and mortality; overall group and by quartiles of time to start of vasopressor infusion
| Overall (n = 177) | 0–2.7 h (n = 45) | 2.71–4.7 h (n = 44) | 4.71–7.7 h (n = 44) | >7.71 h (n = 44) | |
|---|---|---|---|---|---|
| Female, n (%) | 78 (44.1) | 20 (44.4) | 19 (43.2) | 21 (47.7) | 18 (40.9) |
| Age, years, mean (SD) | 65.2 (16.3) | 68.6 (12.8) | 65.5 (18.4) | 68.9 (15.3) | 58.3 (16.4) |
| Lactate, mmol/L, median (IQR) | 3.0 (2.0–4.9) | 3.7 (2.4–6.3) | 2.7 (2.1–4.5) | 3.3 (1.7–4.7) | 2.8 (1.6–4) |
| APACHE II score, mean (SD) | 17.8 (6.3) | 20.5 (6.2) | 18 (6.1) | 18.6 (5.7) | 14.1 (5.0) |
| SBP, mmHg, mean (SD) | 89 (13.7) | 84.3 (12.3) | 91.3 (17.6) | 88.2 (8.7) | 92.5 (12.1) |
| Time from triage to antibiotics, mins, median (IQR) | 59 (33–118) | 43 (20–71) | 53 (27–100) | 67 (42–130) | 88 (46–196) |
| Fluid volume administered, mL | |||||
| Pre‐T0 h | |||||
| Median (IQR) | 1250 (1000–2000) | 1000 (1000–1650) | 1283 (1000–2000) | 1475 (1000–2000) | 1383 (1000–2000) |
| Mean (SD) | 1533 (6980) | 1488 (748) | 1533 (678) | 1552 (625) | 1561 (755) |
| Between T0 and T6 h | |||||
| Median (IQR) | 2188 (1250–3250) | 2260 (1320–3750) | 2088 (1188–3475) | 2263 (1250–3000) | 2102 (1295–3100) |
| Mean (SD) | 2420 (1465) | 2582 (1560) | 2324 (1431) | 2300 (1315) | 2466 (1567) |
| Between T6 and T24 h | |||||
| Median (IQR) | 1710 (950–2500) | 1592 (600–2677) | 1200 (650–2200) | 1120 (943–2000) | 2000 (1780–2553) |
| Mean (SD) | 1666 (1145) | 1710 (1348) | 1435 (1037) | 1373 (999) | 2134 (1038) |
| Total: pre‐T0–T24 h | |||||
| Median (IQR) | 5300 (4000–7000) | 5565 (3600–7350) | 5000 (4030–6650) | 5156 (3850–6208) | 4653 (2750–6003) |
| Mean (SD) | 5567 (2130) | 5704 (2425) | 5260 (1878) | 5141 (2017) | 6160 (2072) |
| Total fluid volume administered prior to starting vasopressors, mL, n | 134 | 44 | 31 | 31 | 21 |
| Median (IQR) | 2000 (1500–3000) | 2000 (1000–2625) | 2000 (2000–3100) | 2184 (1750–2854) | 3500 (3000–4100) |
| Mean (SD) | 2465 (1280) | 2015 (1169) | 2565 (1036) | 2400 (1074) | 3652 (1448) |
| Vasopressor infusion started in ED, n (%) | 126 (71.2) | 43 (95.6) | 31 (70.5) | 31 (70.5) | 21 (47.7) |
| Vasopressor infusion started before T24, n (%) | 177 (100) | 45 (100) | 44 (100) | 44 (100) | 44 (100) |
| Duration of vasopressor infusion, h, median (IQR) | 26.6 (12–48) | 32 (11–88) | 26 (12–44) | 22 (17–38) | 31 (8.1–51) |
|
Time to start vasopressor infusion from T0, h, median (IQR) |
2.5 (0.8–5.0) | 0.5 (0–1.25) | 2.0 (1.1–2.7) | 3.8 (2.2–5.0) | 7.1 (4.9–9.5) |
| Admitted to ICU within 24 h, n (%) | 155 (88.1) | 42 (93.3) | 37 (84.1) | 38 (88.4) | 38 (86.4) |
| Patients receiving invasive ventilation, n (%) | 31 (20.3) | 12 (28.6) | 8 (22.2) | 2 (5.3) | 9 (24.3) |
| Duration of ventilation, days, median (IQR) | 5.6 (5.7–6.5) | 2.7 (1.8–7.1) | 5.7 (1.8–7.5) | 9.5 (5.7–13) | 5.2 (2.9–32) |
| Patients receiving acute RRT, n (%) | 13 (8.6) | 3 (7.3) | 5 (3.9) | 2 (5.4) | 3 (8.1) |
| Duration of RRT, days, median (IQR) | 2.2 (0.6–6.8) | 2.2 (0.2–4.0) | 4.1 (0.9–6.8) | 0.3 (0.2–0.5) | 20 (1.3–23) |
| ICU mortality, n (%) | 16 (10.7) | 6 (14.6) | 2 (5.7) | 3 (8.1) | 5 (13.9) |
| Hospital mortality, n (%) | 22 (13.1) | 6 (14) | 4 (9.8) | 7 (17.1) | 5 (11.6) |
| Hospital length of stay, days, median (IQR) | 8.6 (4.4–18) | 9.3 (4.2–18) | 7.8 (4.1–15) | 7.1 (4.9–13) | 9.8 (4.4–19) |
ICU outcomes uses number of patients admitted to ICU as denominator.
APACHE II, Acute Physiology and Chronic Health Evaluation; RRT, renal replacement therapy; SBP, systolic blood pressure; T0, time when all three inclusion criteria were met.
The highest fluid quartile received more than 5 times the fluid volume as the lowest quartile in the first 6 h post‐enrolment (3612 vs 689 mL) and twice as much in the first 24 h (6600 vs 3011 mL). Between quartile 1 and quartile 4, there was an increase in vasopressor initiation (from 19.1 to 47.6%), ICU admission (from 23.9 to 60%) and receipt of invasive ventilation (from 9.1 to 22.1%) (Table 4). Duration of vasopressor therapy varied between 17.5 and 24.5 h in the lowest three fluid quartiles and was 36 (IQR 22–69) hours in the highest fluid quartile. Although in‐hospital mortality was similar across all fluid quartiles, duration of hospital stay was 4.5 days in quartile 1 and 7.0 days in quartile 4.
The quartile of patients who commenced a vasopressor infusion the earliest (within 2.7 h of ED presentation) tended to be older and tended to have a higher baseline lactate and APACHE II score as well as a lower SBP compared to the remaining quartiles (Table 5). The total volume of fluid administered between 0 and 6 h and up to 24 h was similar across the vasopressor quartiles, although the quartile of patients who received vasopressors the latest (after 7.71 h), were given most fluid (3500 mL [3000–4100]) prior to commencement of vasopressors. The in‐hospital mortality for patients receiving vasopressors was 13.1% (n = 23) with a median hospital length of stay of 8.6 (4.4–18) days.
Discussion
Key findings
Our study provides critical contemporary data concerning sepsis resuscitation in EDs throughout Australia and New Zealand. Namely, patients received on average 2 L of IV fluid in the first 6 h after enrolment, and 4.5 L in the first 24 h in hospital (including pre‐enrolment). Approximately 30% required vasopressor support within the first 24 h, after a median of 2 L of IV fluid, and 4.7 h from ED triage. A SBP <90 mmHg and/or lactate ≥2 mmoL/L was associated with greater fluid administration, more frequent use of vasopressors, and higher rates of admission to ICU. Patients receiving larger volume fluid resuscitation more commonly needed vasopressors and mechanical ventilation, and had a longer hospital stay. Overall, in‐hospital mortality was low (6.2%).
Comparison with other studies
The routine care arms in the ARISE Early Goal Directed Therapy19 and Restricted Fluid Resuscitation in Sepsis associated Hypotension (REFRESH)20 randomised controlled trials delivered different fluid volumes from pre‐enrolment to 6 h post (4.2 vs 3 L). This may reflect differences in severity of disease or inclusion criteria, but could also suggest adoption of a more fluid restrictive approach over time. The routine care group in REFRESH received a median of 1715 mL between 0 and 6 h and 4250 mL from pre‐enrolment to 24 h, which is similar to the overall findings in the current study.
The quartile of patients receiving the lowest fluid volume (median 900 mL administered in the first 6 h after enrolment and 3 L in the first 24 h), had somewhat less fluid administered than the restricted volume arm of REFRESH.20 In contrast, the quartile of patients in our study receiving the most fluid were administered 3.2 L in the first 6 h after enrolment and 5.4 L from pre‐enrolment to 24 h, with the overall range of fluid given in the first 24 h varied between 1 and 12.2 L. These findings are consistent with sepsis being a highly variable clinical syndrome, where an individualised approach to fluid resuscitation is often employed.
Of note was the low in‐hospital mortality observed in the present study (6.2%, 95% confidence interval 4.5–8.5%), whereas other Australasian studies of patients with sepsis and hypotension have reported in‐hospital mortality rates between 18 and 25%.21, 22 In contrast, and consistent with our study, when assessing patients without limitations of care, the 30‐day mortality was 6.2% in a cohort of 399 ED patients with septic shock in a tertiary hospital in Australia.21 Temporal improvements of sepsis care and an associated decrease in mortality in Australia and New Zealand may also partially explain our findings.22
Our study used a similar methodology to that undertaken in 32 Australian and New Zealand hospitals conducted in 2009.23 However, the inclusion criteria for that study were a SBP <90 mmHg despite a 500 mL bolus or a lactate greater than 4 mmol/L. Notably, all patients with sepsis were included in the 2009 study, whereas in our study patients with limitations of care were excluded. These differences in eligibility may explain the higher APACHE II score in the 2009 study compared to ARISE FLUIDS (19 ± 8.2 vs 15.2 ± 6.7) as well as the higher mortality (23.1%). In ARISE 2009, approximately 2 L was administered between 0 and 6 h, which was similar to ARISE FLUIDS. Almost one‐third (32%) of patients received vasopressors in the first 6 h after enrolment in ARISE 2009, whereas in ARISE FLUIDS a similar proportion had vasopressors started before 24 h (30.2%). The median time to vasopressor commencement was 4.6 h (2.7–7.8) which was shorter than median time to central line access of 6.5 h (3.5–10.1), indicating vasopressor delivery through a peripheral line occurred. This practice is supported by an analysis of patients who received peripheral vasopressors in the ARISE Early Goal Directed Therapy trial19 which showed that this was associated with some improvements in processes of care, and not associated with differential mortality.24 A recent systematic review concluded when given for a limited duration and under close observation, adverse events of peripheral vasopressors are rare.25
Study implications
Our study found significant heterogeneity in fluid volume resuscitation in hypotensive patients with sepsis, implying that the clinical environment might potentially support a controlled trial in this area.26 With falling mortality among patients with sepsis who are eligible for ICU care, there is a growing recognition that long‐term quality of life among survivors relates to organ failure.27, 28 In this respect, our data suggest a potential relationship between greater fluid volume resuscitation in the first 6 and 24 h and organ dysfunction, implying that the need for invasive organ support represents a logical endpoint for future work. Finally, our study provided important insights into the yield of our screening procedures. One in every 66 adult ED presentations (1.51%) were screened with an enrolment rate of 13.2%, or a ‘number needed to screen’ of 7.6. This corresponded with 2 in every 1000 adult attendances in the present study being eligible, which is consistent with prior research.29
Limitations
The participating sites were self‐selected based on an expression of interest via the Australasian College for Emergency Medicine, with data collection occurring only in spring and summer. However, the 70 hospitals represented a wide geographical spread ranging from tertiary to rural and remote facilities with varying levels of onsite ICU facilities. As such we believe our findings have robust external validity. Although in‐hospital mortality is lower in this study than most others performed in similar settings, comparisons are difficult to make, as compared to other studies we did not report 90‐day mortality. This was because we utilised an endpoint more proximal to the exposure of interest (e.g. fluid administration in ED), as 90‐day mortality is likely to be confounded by other factors. We excluded 26 patients where death was imminent and 33 with a life‐expectancy <90 days.
It is possible that not all patients were screened or enrolled. In particular, the low mortality rate raises the question as to whether sicker patients were missed. A more likely explanation is that patients who were not eligible for ICU admission were excluded from our study, particularly since we had dedicated site clinician–investigators actively screening for suitable patients. In the Australasian ED setting these patients not eligible for ICU admission represent a substantial proportion of patients who die as a result of their sepsis, with mortality rates varying between 47 and 66%.22, 23 Further, missing data were inevitable as patients received routine care which may not include all relevant variables. Any ‘missingness’ is therefore likely to be random.
The observation that an increasing volume of fluid was associated with a greater proportion requiring vasopressors and/or mechanical ventilation should be viewed cautiously. Although greater fluid administration has been associated with harm, this is clearly confounded by illness severity. In this respect, these data should be considered hypothesis‐generating at best, and reinforces the need for future systematic research in this area.
Conclusion
The ARISE FLUIDS observational study is the largest Australasian observational study providing a 30‐day snapshot of contemporary ED practice across a wide range of settings, from rural/regional to metropolitan teaching hospitals. Current resuscitation practices in patients with sepsis and hypotension in Australia and New Zealand vary widely, occupying the spectrum between a restricted volume/earlier vasopressor and liberal fluid/later vasopressor strategy.
Supporting information
Table S1. Vital signs and laboratory results at eligibility (T0) and 6 and 24 h.
Table S2. Main fluid types administered.
Table S3. Systolic blood pressure at T0; ≥90 versus <90 mmHg.
Table S4. Lactate at T0. <2 versus ≥2 mmol/L.
Table S5. Systolic blood pressure <90 and lactate ≥2 mmol/L at T0 versus patients not meeting these criteria.
Table S6. Abdominal source of sepsis versus other source.
Table S7. Respiratory source of sepsis versus other source.
Table S8. Age <65 versus ≥65 years.
Table S9. Cardiovascular comorbidities absent or present.
Table S10. Severity of illness – by APACHE II quartiles at T0.
Table S11. Hospital type.
Acknowledgements
This project received funding from the Emergency Medicine Foundation and the Research Grant Scheme from the Gold Coast Hospital Foundation.
Coordinating centres were the Gold Coast University Hospital (GCUH), the Australian and New Zealand Intensive Care Research Centre (ANZIC‐RC), the Centre for Centre for Clinical Research in Emergency Medicine (CCREM) and the Medical Research Institute of New Zealand (MRINZ), with oversight from a representative steering committee. Participating institutions for ARISE FLUIDS observational study and site investigators: New South Wales (20): Auburn Hospital (Khanh Nguyen), Bankstown Health Service (Lai Heng Foong), Belmont Hospital (Carolyn Hullick), Blacktown and Mount Druitt Hospital (Richard McNulty), Canterbury Hospital (Khanh Nguyen), Coffs Harbour Base Hospital (Andrew Na), Gosford Hospital (Christopher Trethewy), Hornsby Ku‐ring‐gai Hospital (Lucy Lutze), John Hunter Hospital (Michael Zhang, Tim Cowan), Liverpool Hospital (Paul Middleton, Suzanne Avis), Maitland Hospital (Sam Vidler), Nepean Hospital (Mark Salter), Queanbeyan District Hospital (Simon Janes), Royal North Shore Hospital (Anthony Delaney, Tom Harwood), Royal Prince Alfred Hospital (Matthew Oliver), St Vincent's Hospital, Sydney (Farzad Jazayeri), Tamworth Rural Referral Hospital (Sarah Jones), Wagga Wagga Base Hospital (Michael Davoren), Westmead Hospital (Andrew Coggins), Wollongong Hospital (Bibhu Pradhananga). New Zealand (9): Auckland City Hospital (Peter Jones, Lynette Newby), Dunedin Hospital (Sierra Beck), Hawke's Bay Hospital (Brad Sandleback, Sophie Rabas, Simon Harger), Middlemore Hospital (Eunicia Tan, Rima Song), Nelson Hospital (Marc Gutenstein, Andrew Munro), Taranaki Base Hospital (Michael Connely), Tauranga Hospital (Jennifer Goodson, Alastair Mclean), Waikato Hospital (Christine Brabyn), Wellington Hospital (Saptarshi Mukerji, Harnah Simmonds, Paul Young). Queensland (18): Bundaberg Base Hospital (Yulia Sugeng), Cairns Hospital (Cheryl Bird, Amanda McConnell), Gold Coast University Hospital (Gerben Keijzers, Peter Henderson), Hervey Bay Hospital (David Johnson), Logan Hospital (Siegfried Perez), Mackay Base Hospital (Abbas Mahani), Maryborough Hospital (David Johnson), Mount Isa Hospital (Ulrich Orda), Nambour Hospital (Ogilvie Thom, Kym Roberts), The Prince Charles Hospital (Frances Kinnear, Sarah Hazelwood, Hanh Pham), Princess Alexandra Hospital (Rob Eley, Georgia Livesay), Queen Elizabeth II Jubilee Hospital (Michael Devlin, Ian Murdoch), Redcliffe Hospital (Erik Wood), Robina Hospital (Gerben Keijzers, Peter Henderson), Royal Brisbane and Women's Hospital (Julian Williams, Nathan Brown), Sunshine Coast University Hospital (Ogilvie Thom, Kym Roberts), Toowoomba Hospital (Alex King), The Townsville Hospital (Jan Sadewasser, Leonie Jones, Vinay Gangathimmaiah). South Australia (3): Lyell McEwin Hospital (Anit Manudhane), The Queen Elizabeth Hospital (Daniel Haustead), Royal Adelaide Hospital (Daniel Haustead). Tasmania (2): North West Regional Hospital Burnie (Juan‐Carlos Ascencio‐Lane), Royal Hobart Hospital (Juan‐Carlos Ascencio‐Lane). Victoria (10): Austin Health (David McD. Taylor), Box Hill Hospital (Paul Buntine), Cabrini Hospital (Katie Walker), Casey Hospital (Pourya Pouryahya), Dandenong Hospital (Daniel Crompton), Epworth Richmond Hospital (Ron Sultana, Timothy Campbell), Frankston Hospital (Rosamond Dwyer), Monash Medical Centre (Gabriel Blecher), Royal Melbourne Hospital (Jonathan Knott), The Alfred Hospital (Biswadev Mitra, Carl Luckhoff). Western Australia (8): Albany Regional Hospital (Russel Young, Natalie Rudling), Armadale‐Kelmscott District Memorial Hospital (Ashes Mukherjee, Kerry‐Lee Dyke), Broome Hospital (Casey Parker), Fiona Stanley Hospital (Glenn Arendts, Alannah Cooper, Yusuf Nagree), Karratha Health Campus (Keng Koay, Coert Kruger), Midland St John of God Hospital (Nicole Ghedina), Rockingham General Hospital (Ben Smedley), Royal Perth Hospital (Jonathon Burcham, Stephen Macdonald, Helen Hamersley).
Competing interests
GK and SPJM are section editors for Emergency Medicine Australasia.
Gerben Keijzers, MSc (Biomed Health Sci), MBBS, FACEM, PhD, Emergency Physician, Adjunct Professor; Stephen PJ Macdonald, BSc, MBChB, PhD, FRCP, FACEM, Clinical Research Fellow, Emergency Physician; Andrew A Udy, BHB, MBChB, FCICM, PhD, Intensive Care Physician; Glenn Arendts, MBBS, MMed, PhD, Emergency Physician, Professor; Michael Bailey, PhD, MSc (Statistics), BSc (Hons), Head Statistician, Professor of Critical Care Trial Statistics; Rinaldo Bellomo, MBBS, MD, FCICM, FRACP, Intensive Care Physician, Professor; Gabriel E Blecher, MBBS (Hons), PDM, FACEM, CCPU, MSc (Epi), Deputy Director Emergency Department; Jonathon Burcham, BSc (Nursing), PGDip (Emergency Nursing), MACN, RN, Clinical Nurse Manager; Andrew R Coggins, MBChB, FRCP (UK), FACEM, MAcadMEd, FRCEM, Staff Specialist; Anthony Delaney, MBBS, MSc, PhD, FACEM, FCICM, Intensive Care Physician, Honorary Professorial Fellow; Daniel M Fatovich, MBBS, FACEM, PhD, Professor of Emergency Medicine; John F Fraser, MBChB, PhD, FRCP, FRCA, FFARCSI, FCICM, Intensive Care Physician, Professor; Amanda Harley, BN, GradDipEd, MEmergN, Paediatric Sepsis Clinical Nurse Consultant; Peter Jones, MBChB, MSc (Oxon), PhD, FACEM, Emergency Physician, Associate Professor; Frances B Kinnear, BSc (Hons), MBChB, PhD, FACEM, Senior Lecturer, Director of Research, Senior Emergency Medicine Specialist; Katya May, BA, MSN, PhD, Nurse Researcher; Sandra Peake, BMBS, BSc (Hons), FCICM, PhD, Director Intensive Care Medicine, Professor; David McD Taylor, MBBS, DRCOG, MPH, MD, FACEM, FIFEM, Academic Emergency Physician, Professor; Patricia Williams, BNP (Intensive Care), Research Coordinator.
Contributor Information
Gerben Keijzers, Email: gerben.keijzers@health.qld.gov.au.
the ARISE FLUIDS Observational Study Group:
Khanh Nguyen, Lai Heng Foong, Carolyn Hullick, Richard McNulty, Andrew Na, Christopher Trethewy, Lucy Lutze, Michael Zhang, Tim Cowan, Paul Middleton, Suzanne Avis, Sam Vidler, Mark Salter, Simon Janes, Anthony Delaney, Tom Harwood, Matthew Oliver, Farzad Jazayeri, Sarah Jones, Michael Davoren, Andrew Coggins, Bibhu Pradhananga, Peter Jones, Lynette Newby, Sierra Beck, Brad Sandleback, Sophie Rabas, Simon Harger, Eunicia Tan, Rima Song, Marc Gutenstein, Andrew Munro, Michael Connely, Jennifer Goodson, Alastair Mclean, Christine Brabyn, Saptarshi Mukerji, Harnah Simmonds, Paul Young, Yulia Sugeng, Cheryl Bird, Amanda McConnell, Gerben Keijzers, Peter Henderson, David Johnson, Siegfried Perez, Abbas Mahani, Ulrich Orda, Ogilvie Thom, Kym Roberts, Frances Kinnear, Sarah Hazelwood, Hanh Pham, Rob Eley, Georgia Livesay, Michael Devlin, Ian Murdoch, Erik Wood, Julian Williams, Nathan Brown, Alex King, Jan Sadewasser, Leonie Jones, Vinay Gangathimmaiah, Anit Manudhane, Daniel Haustead, Juan‐Carlos Ascencio‐Lane, David McD. Taylor, Paul Buntine, Katie Walker, Pourya Pouryahya, Daniel Crompton, Ron Sultana, Timothy Campbell, Rosamond Dwyer, Gabriel Blecher, Jonathan Knott, Biswadev Mitra, Carl Luckhoff, Russel Young, Natalie Rudling, Ashes Mukherjee, Kerry‐Lee Dyke, Casey Parker, Glenn Arendts, Alannah Cooper, Yusuf Nagree, Keng Koay, Coert Kruger, Nicole Ghedina, Ben Smedley, Jonathon Burcham, Stephen Macdonald, and Helen Hamersley
References
- 1. Angus DC, van de Poll T. Severe sepsis and septic shock. N. Engl. J. Med. 2013; 369: 840–51. [DOI] [PubMed] [Google Scholar]
- 2. Rhodes A, Evans LE, Alhazzani W et al Surviving Sepsis Campaign: international guidelines for management of sepsis and septic shock: 2016. Intensive Care Med. 2017; 43: 304–77. [DOI] [PubMed] [Google Scholar]
- 3. Seymour CW, Gesten F, Prescott HC et al Time to treatment and mortality during mandated emergency care for sepsis. N. Engl. J. Med. 2017; 376: 2235–44. [DOI] [PMC free article] [PubMed] [Google Scholar]
- 4. Acheampong A, Vincent J‐L. A positive fluid balance is an independent prognostic factor in patients with sepsis. Crit. Care 2015; 19: 251. [DOI] [PMC free article] [PubMed] [Google Scholar]
- 5. Sirvent J‐M, Ferri C, Baro A, Murcia C, Lorencio C. Fluid balance in sepsis and septic shock as a determining factor of mortality. Am. J. Emerg. Med. 2015; 33: 186–9. [DOI] [PubMed] [Google Scholar]
- 6. Maitland K, Kiguli S, Opoka RO et al Mortality after fluid bolus in African children with severe infections. N. Engl. J. Med. 2011; 364: 2483–95. [DOI] [PubMed] [Google Scholar]
- 7. Maitland K, George EC, Evans JA et al Exploring mechanisms of excess mortality with early fluid resuscitation: insights from the FEAST trial. BMC Med. 2013; 11: 68. [DOI] [PMC free article] [PubMed] [Google Scholar]
- 8. Andrews B, Semler MW, Muchemwa L et al Effect of an early resuscitation protocol on in‐hospital mortality among adults with sepsis and hypotension: a randomized clinical trial. JAMA 2017; 318: 1233–40. [DOI] [PMC free article] [PubMed] [Google Scholar]
- 9. Macdonald SPJ, Taylor DMD, Keijzers G et al Restricted fluid resuscitation in sepsis associated hypotension (REFRESH): protocol for a pilot randomised controlled trial. Trials 2017; 18: 399. [DOI] [PMC free article] [PubMed] [Google Scholar]
- 10. Byrne L, Obonyo NG, Diab SD et al Unintended consequences: fluids resuscitation worsens shock in an ovine model endotoxemia. Am. J. Respir. Crit. Care Med. 2018; 198: 1043–54. [DOI] [PMC free article] [PubMed] [Google Scholar]
- 11. Bai X, Yu W, Ji W et al Early versus delayed administration of norepinephrine in patients with septic shock. Crit. Care 2014; 18: R532. [DOI] [PMC free article] [PubMed] [Google Scholar]
- 12. Morimatsu H, Singh K, Uchino S, Bellomo R, Hart G. Early and exclusive use of norepinephrine in septic shock. Resuscitation 2004; 62: 249–54. [DOI] [PubMed] [Google Scholar]
- 13. Permpikul C, Tongyoo S, Viarasilpa T, Trainarongsakul T, Chakorn T, Udompanturak S. Early use of norepinephrine in septic shock resuscitation (CENSER): a randomized trial. Am. J. Respir. Crit. Care Med. 2019; 199: 1097–105. [DOI] [PubMed] [Google Scholar]
- 14. Perner A, Gordon AC, Angus DC et al The intensive care medicine research agenda on septic shock. Intensive Care Med. 2017; 43: 1294–305. [DOI] [PubMed] [Google Scholar]
- 15. Smith J, Keating L, Flowerdew L et al An emergency medicine research priority setting partnership to establish the top 10 research priorities in emergency medicine. Emerg. Med. J. 2017; 34: 454–6. [DOI] [PMC free article] [PubMed] [Google Scholar]
- 16. Deane HC, Wilson CL, Babl FE et al PREDICT prioritization study: establishing the research priorities of paediatric emergency medicine physicians in Australia and New Zealand. Emerg. Med. J. 2018; 35: 39–45. [DOI] [PubMed] [Google Scholar]
- 17. Keijzers G, Macdonald SP, Udy AA et al The Australasian resuscitation in sepsis evaluation: FLUid or vasopressors in emergency department sepsis, a multicentre observational study (ARISE FLUIDS observational study): rationale, methods and analysis plan. Emerg. Med. Australas. 2019; 31: 90–6. [DOI] [PubMed] [Google Scholar]
- 18. Von Elm E, Altman DG, Egger M et al The strengthening the reporting of observational studies in epidemiology (STROBE) statement: guidelines for reporting observational studies. PLoS Med. 2007; 4: e296. [DOI] [PMC free article] [PubMed] [Google Scholar]
- 19. ARISE Investigators , ANZICS Clinical Trials Group , Peake SL et al Goal‐directed resuscitation for patients with early septic shock. N. Engl. J. Med 2014; 371: 1496–506. [DOI] [PubMed] [Google Scholar]
- 20. Macdonald SPJ, Keijzers G, Taylor DM et al Restricted fluid resuscitation in sepsis associated hypotension (REFRESH): a pilot randomised controlled trial. Intensive Care Med. 2018; 44: 2070–8. [DOI] [PubMed] [Google Scholar]
- 21. Williams JM, Greenslade JH, Dymond CA, Chu K, Bronw AFT, Lipman J. Characteristics, treatment and outcomes for all emergency department patients fulfilling criteria for septic shock: a prospective observational study. J. Emerg. Med. 2018; 25: 97–104. [DOI] [PubMed] [Google Scholar]
- 22. Kaukonen KM, Bailey M, Suzuki S, Pilcher D, Bellomo R. Mortality related to severe sepsis and septic shock among critically ill patients in Australia and New Zealand 2000‐2012. JAMA 2014; 311: 1308–16. [DOI] [PubMed] [Google Scholar]
- 23. Peake SL, Bailey M, Bellomo R et al ARISE Investigators, for the Australian and New Zealand Intensive Care Society Clinical Trials Group. Australasian resuscitation of sepsis evaluation (ARISE): a multi‐centre, prospective inception cohort study. Resuscitation 2009; 80: 811–8. [DOI] [PubMed] [Google Scholar]
- 24. Tian DH, Smyth C, Keijzers G et al Safety of peripheral administration of vasopressor medications: a systematic review. Emerg. Med. Australas. 2020; 32: 220–7. [DOI] [PubMed] [Google Scholar]
- 25. Delaney A, Finnis M, Bellomo R et al Initiation of vasopressor infusions via peripheral versus central access in patients with early septic shock: a retrospective cohort study. Emerg. Med. Australas. 2020; 32: 210–9. [DOI] [PubMed] [Google Scholar]
- 26. Self WH, Semler MW, Bellomo R et al Liberal versus restrictive intravenous fluid therapy for early septic shock: rationale for a randomized trial. Ann. Emerg. Med. 2018; 72: 457–66. [DOI] [PMC free article] [PubMed] [Google Scholar]
- 27. Higgins AM, Peake SL, Bellomo R et al Quality of life and 1‐year survival in patients with early septic shock: long‐term follow‐up of the Australasian resuscitation in sepsis evaluation trial. Crit. Care Med. 2019; 47: 765–73. [DOI] [PubMed] [Google Scholar]
- 28. Prescott HC, Iwashyna TJ, Blackwood B et al Understanding and enhancing seposis survivorship: priorities for research and practice. Am. J. Respir. Crit. Care Med. 2019; 200: 972–81. [DOI] [PMC free article] [PubMed] [Google Scholar]
- 29. Finfer S, Bellomo R, Lipman J, French C, Dobb G, Myburgh J. Adult population incidence of severe sepsis in Australian and New Zealand intensive care units. Int. Care Med. 2004; 30: 589–96. [DOI] [PubMed] [Google Scholar]
Associated Data
This section collects any data citations, data availability statements, or supplementary materials included in this article.
Supplementary Materials
Table S1. Vital signs and laboratory results at eligibility (T0) and 6 and 24 h.
Table S2. Main fluid types administered.
Table S3. Systolic blood pressure at T0; ≥90 versus <90 mmHg.
Table S4. Lactate at T0. <2 versus ≥2 mmol/L.
Table S5. Systolic blood pressure <90 and lactate ≥2 mmol/L at T0 versus patients not meeting these criteria.
Table S6. Abdominal source of sepsis versus other source.
Table S7. Respiratory source of sepsis versus other source.
Table S8. Age <65 versus ≥65 years.
Table S9. Cardiovascular comorbidities absent or present.
Table S10. Severity of illness – by APACHE II quartiles at T0.
Table S11. Hospital type.