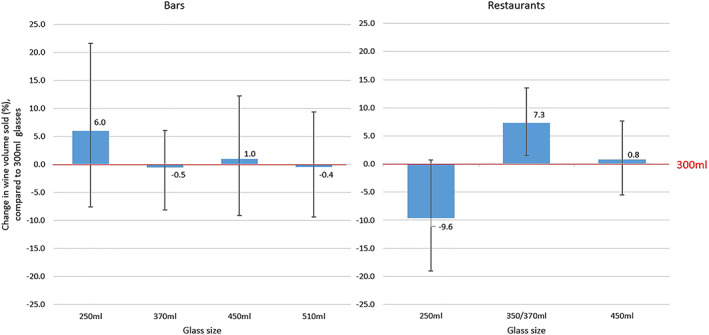
Figure 1.

Predicted percentage change (with 95% confidence interval) in daily wine volume sales from 300‐ml glasses in (i) bars and (ii) restaurants. The red line indicates zero change compared to sales with 300‐ml glasses. [Colour figure can be viewed at wileyonlinelibrary.com]
