

Abstract
Background/Objectives
Standard optical coherence tomography angiography (OCTA) has been limited to imaging blood vessels actively undergoing perfusion, providing a temporary picture of surface microvasculature. Capillary perfusion in the skin is dynamic and changes in response to the surrounding tissue's respiratory, nutritional, and thermoregulatory needs. Hence, OCTA often represents a given perfusion state without depicting the actual extent of the vascular network. Here we present a method for obtaining a more accurate anatomic representation of the surface capillary network in human skin using OCTA, along with proposing a new parameter, the Relative Capillary Capacity (RCC), a quantifiable proxy for assessing capillary dilation potential and permeability.
Methods
OCTA images were captured at baseline and after compression of the skin. Baseline images display ambient capillary perfusion, while images taken upon capillary refill display the network of existing capillaries at full capacity. An optimization‐based automated vessel segmentation method was used to automatically analyze and compare OCTA image sequences obtained from two volunteers. RCC was then compared with visual impressions of capillary viability.
Results
Our OCTA imaging sequence provides a method for mapping cutaneous capillary networks independent of ambient perfusion. Differences between baseline and refill images clearly demonstrate the shortcomings of standard OCTA imaging and produce the RCC biometric as a quantifiable proxy for assessing capillary dilation potential and permeability.
Conclusion
Future dermatological OCTA diagnostic studies should implement the Capillary Refill Methods over standard imaging techniques and further explore the relevance of RCC to differential diagnosis and dermatopathology. Lasers Surg. Med. © The Authors. Lasers in Surgery and Medicine published by Wiley Periodicals, Inc.
Keywords: optical coherence tomography, OCT angiography, skin condition, capillary refilling technique
INTRODUCTION
Optical coherence tomography angiography (OCTA) has emerged as a promising tool for the differential diagnosis of dermatological conditions affecting the microvasculature 1, 2, 3. OCTA provides a means of imaging capillary perfusion by contrasting the motion of scattering blood components with static structural tissue 4, 5. OCTA overcomes limitations of other diagnostic tools in clinical dermatology by generating non‐invasive, high‐resolution maps of perfusion in vivo 1. Previous studies validated the application of OCTA in dermatology with established clinical techniques and investigated its sensitivity to induced physiological blood flow changes 6, 7. OCTA images are often subjected to automatic or semi‐automatic methods for vessel segmentation and analysis of microvascular morphology 2, 8, 9, 10 Segmented capillary maps are then further characterized by quantitative metrics such as vessel area, number, tortuosity, and the complexity of capillary network architecture. These metrics provide the basis for comparing sets of OCTA imaging to identify unique biomarkers of cutaneous dermatological pathologies such as atopic dermatitis 2, melanoma 11, hemangiomas 12, and other inflammatory skin conditions 3, 13, 14 and to evaluate treatment response 15 or assist for treatment planning 12. The human cutaneous capillary network is embedded in the papillary dermis beneath the dermal–epidermal junction. Capillary perfusion is the primary channel for nutrient and gas exchange in the skin and changes dynamically to meet cellular requirements 16. However, thermoregulation is the major determinant in capillary perfusion dynamics of the skin, enabling the human body to rapidly adjust to changes in environmental temperature 17. Various factors including aging, smoking, and certain pathological states have been associated with morphological changes in the cutaneous capillary bed including stiffening of the vascular wall, decreased permeability, and variation in vessel network density 18. However, measurements obtained by standard OCTA imaging methods are limited to capturing perfusion at a given point in time, providing an incomplete representation of the underlying anatomy. Distinct from retinal or cerebral capillaries, perfusion in skin is primarily dependent on ambient and body temperatures, and it is impossible to derive a complete map of cutaneous microvasculature from a standard scan. Standard OCTA imaging can vary dramatically between images of the same area at different time points, making the values obtained from the representations of limited use and rarely reproducible. Moreover, the maximum capacity of the capillary bed cannot be assessed. These limitations can be overcome by applying pressure to the skin and inhibiting perfusion to the capillaries. When pressure is released after an extended length of compression, blood rushes into the capillaries and the skin visibly reddens within seconds 15. To correct for shortcoming in standard OCTA imaging, we propose acquiring a sequence of images before and after compression. By deriving perfusion of the vascular network in both OCTA images using an automatic vessel segmentation algorithm, for example, the optimization‐based vessel segmentation pipeline (OBVS) 10, and quantitative metrics, it is possible to acquire a quantitative representation of the existing capillary network and to assess the dilation capacity of the vessel walls. Using the composite data from the two samples, we propose a novel criterion for comparing the functionality of microvasculature. The relative capillary capacity (RCC) quantifies the relative dilation of vessels at baseline compared with maximum capacity, which serves as a proxy for vascular efficiency in gas exchange and nutrient delivery. This proposed metric not only maps the capillary bed, but also provides valuable insight into the character of the imaged vessels.
METHODS
Specimen/Subjects
OCTA imaging sequences were performed on the inner forearms of two healthy volunteers. Subject 1 is a 22‐year‐old Caucasian female with no history of smoking, and Subject 2 is a 66‐year‐old Caucasian female with a history of smoking half a pack of cigarettes per day for 10 years before discontinuing approximately 15 years prior to imaging. All procedures were approved by the Institutional Review Board (IRB) of Massachusetts General Hospital (Protocol No.: 2018P001115) and informed consent was obtained from both subjects.
Image Acquisition
OCTA images were acquired with the commercially available spectral‐domain OCT scanner TELESTO II (Thorlabs, Newton, NJ). The device operates at a central wavelength of 1,300 nm with an axial resolution of 4.2 µm in tissue. Images were acquired by a lens with a lateral resolution of 13 µm (LSM03; Thorlabs) and images were two times oversampled with a voxel size of 6.5 × 6.5 × 4.2 µm. The field‐of‐view (FOV) was (length × width × depth). Angiographic OCT volumes were acquired with 2× slow‐axis averaging, using an A‐Scan rate of 76 kHz. Image acquisition took approximately 30 seconds with another 30 seconds for saving data onto the hard drive. During imaging, the subject's forearm was positioned on a surgical arm pillow and the imaged skin area was immobilized using a z‐spacer mounted on the scanner (IMM3; Thorlabs). Glycerol was used as an immersion fluid for the spacer head. The z‐spacer and glycerol were kept at room temperature at all times. Sequential OCTA images were acquired from each subject. For the baseline measurement, the z‐spacer was positioned on the skin to avoid motion. Great care was taken to not include air bubbles inside the immersion media or suppress any blood flow. After completing the baseline scan, the z‐spacer was used to compress the skin until the point of visible blanching for 2 minutes. The capillary refill measurements were obtained immediately after the release of compression.
The sequence of acquired images is shown schematically in Fig. 1.
Figure 1.
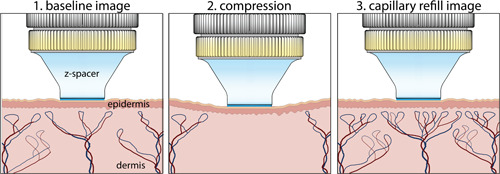
Optical coherence tomography angiography imaging sequence to assess cutaneous capillary viability. Images were acquired before and after compression of the skin.
Angiographic Imaging
Angiographic volumes were generated using the speckle‐variance algorithm (svOCT) proposed by Barton et al. 4, 19 with two times slow‐axis averaging. For further analysis, angiographic volumes were cropped to show capillary layers between 80 and 420 µm and condensed to a two‐dimensional representation by a maximum‐intensity projection.
Vessel Segmentation Technique
The automatic characterization of the capillary network in the OCTA image requires a reliable vessel segmentation technique. This study employs the optimization‐based vessel segmentation (OBVS) method described in our previous work 10. Briefly, the optimal combination of image processing methods and parameters was found to best approximate the result of manual labeling by an expert. The segmentation pipeline entails of methods of denoising, contrast enhancement, binarizing, refining, and skeletonizing OCTA images with the following components:
-
(1)
denoising: block‐matching 3D (BM3D) filter with 20
-
(2)
contrast enhancement: contrast‐limited adaptive histogram equalization (CLAHE) with and
-
(3)
segmentation: local adaptive thresholding with
-
(4)
refinement: max‐flow/min‐cut (graph‐cut) with and Potts weighting 21
-
(5)
skeletonization: morphological skeletonization
The segmented vessel map and skeleton are shown in Fig. 2. OBVS was implemented in MATLAB (R2016b; MathWorks, Natick, MA) and computations were performed on a Dell Precision T1700 with an Intel Xeon(R) CPU with 4 cores (8 threats) at 3.6 GHz.
Figure 2.
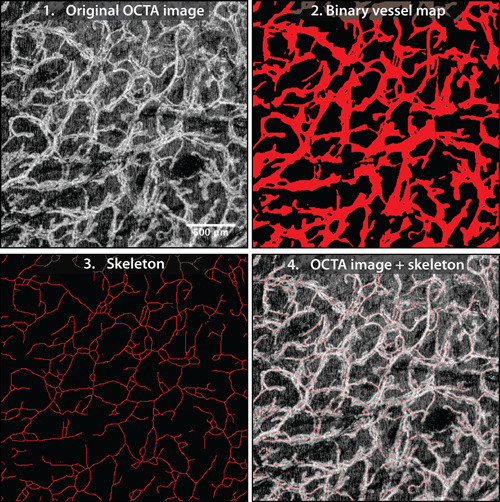
Example of vessel segmentation using the optimization‐based vessel segmentation pipeline (OBVS) 10. Field‐of‐view cropped to 2.5 × 2.5 mm.
Vascular Characterization Metrics
Segmented vascular maps were characterized by quantitative metrics that have been utilized in previous work of OCTA 5, 10, 22.
The vascular area density (VAD) is defined as the relative area of the image displaying perfusion. VAD was computed on the binary vessel segmentation map (2.2.) of size with if pixel represented vessel and for background.
| (1) |
The Vascular Length Density (VLD) indicates the number of vessel shown in the image. VLD was computed on the skeleton map (2.3.) of size with if pixel contained a skeleton pixel and for background.
| (2) |
The branchpoint index (BI) of a skeleton map was determined as the number of branchpoints divided by the image size. A branchpoint was identified when the neighborhood around a skeleton pixel contained at least 3 more skeleton pixel.
The RCC was obtained by combining metrics from the base and refill images from the imaging sequence shown in Fig. 1.
| (3) |
RCC represents the dilation potential of the cutaneous capillaries, which varies due to the stiffness of the capillary wall and is correlated with vessel permeability and capacity for gas exchange and nutrient delivery 18. RCC is typically handled in percent.
RESULTS
OCTA sequences were obtained from two volunteers, with images shown in Figs. 3 and 4. The vascular networks differed substantially between subjects with each experimental condition. In baseline images, a homogenously distributed network of capillaries was visible. Upon capillary refill, the vessels of the capillary network appear more detailed and of greater number compared with the baseline images, with many new vessels and branchpoints visible. Additionally, pairs of aligned vascular structures that appeared as a single vessel in the baseline image could be resolved.
Figure 3.
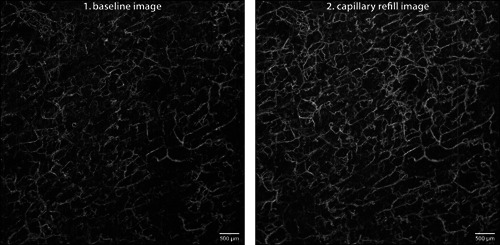
Sequence of Subject 1: optical coherence tomography angiography sequence acquired at the forearm of Subject 1—a 22‐year‐old Caucasian female with no history of smoking—shown as maximum‐intensity projection of the papillary dermis. Image size 6 × 6 mm, depth range 80–420 μm, resolution 6.5 μm.
Figure 4.
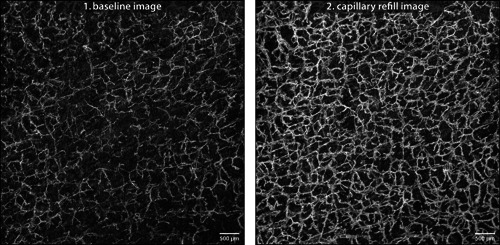
Sequence of Subject 2: optical coherence tomography angiography sequence acquired at the forearm of Subject 2—a 66‐year‐old Caucasian female with a history of smoking—shown as maximum‐intensity projection of the papillary dermis. Image size 6 × 6 mm, depth range 80–420 μm, resolution 6.5 μm.
Comparing both subjects, the baseline images captured a similar number of capillaries (VLD Score 0.053 vs. 0.045); however, Subject 1's vessels appear slightly smaller in diameter than those of Subject 2 (average diameter given by the ratio VAD/VLD: 5.2 vs. 5.7). Upon capillary refill, while OCTA images of both subjects showed a greater number of capillaries than baseline, Subject 1 showed greater dilation compared with baseline images (RCC Index 81.1% vs. 25.3%). Quantitative metrics were derived from vessel maps obtained by the OBVS method and confirm the qualitative observations from the image sequences.
For both subjects, the maximum values of the three metrics (VAD, VLD, and BI) correspond to the capillary refill images. The RCC metric quantifies vessel dilation by normalizing measurements in the maximum capillary capacity image by the respective baseline values (Equation (3)). In this study, the RCC metric clearly differentiates between Subject 1, with a score of 81.1% of the RCC index, and Subject 2, with a score of 25.3%.
DISCUSSION
OCTA imaging is an established technique for visualizing capillary perfusion in the human retina and brain. Recently, these methods of OCTA imaging have been applied to the study of cutaneous microvasculature without considering the unique challenges posed by human skin. OCTA imaging is reliant on the active perfusion of capillaries, which is a dynamic, multifactorial process. It has been demonstrated that OCTA derived metrics differ by anatomical site and are sensitive to moderate physical stimuli 7, 8 or even just the positioning of the specimen 6. Still, in previous OCTA studies, differences between single baseline images have been used to distinguish between skin diseases in vivo 2, 3, 11, 12, 13; however, the exact mechanism behind these differences remains controversial. Standard OCTA imaging has been limited to baseline conditions that are a poor approximation of actual capillary bed anatomy. While this limitation also applies to retinal and neurological imaging, skin is unique in that the metabolic needs of the surrounding tissue only play a minor role in determining capillary circulation 17. Pappano established that the changes in skin blood flow are primarily due to the dynamics of ambient and internal body temperatures; however, previous OCTA studies have not differentiated between thermoregulatory, inflammatory, and metabolic capillary responses, introducing confounding factors to their experiments 2, 3, 8, 11, 12, 13, 14. Findings of such studies demand sensible interpretation, especially in the context of melanoma diagnosis 11 and when used for treatment guidance 12. Furthermore, standard OCTA imaging does not provide any information about the functional characteristics of the imaged vessels, making it difficult to provide valid interpretations of experimental results.
To address this shortcoming, we propose the capillary refill method as a means of controlling for the thermoregulatory and inflammatory contributions to skin microvasculature. By maximizing capillary perfusion and diameter, it becomes possible to visualize the patient's actual anatomy. Furthermore, we propose the use of a two‐image OCTA sequence to produce the RCC. Quantifying the dilation potential of the capillary bed serves as a valuable proxy for assessing vascular wall stiffening and oxygenation capacity 18. The RCC metric can be used to suggest reasons for the differences in VAD and VLD observed between the two study subjects. Subject 2's capillaries are of larger caliber than Subject 1's in the baseline images. Since Subject 1 is a 22‐year‐old female with no history of smoking and Subject 2 is a 66‐year‐old female with a long history of smoking, this result is surprising. Both age and smoking status are associated with ischemia, poor gas exchange, and stiffening of the vascular wall 18, so one would expect the relationship between the subjects’ vessel caliber to be reversed.
Interpreting these results in terms of RCC and the two‐image OCTA sequence, a more coherent explanation emerges. While the old smoker's baseline capillary vessel area measurements (VAD) are greater than those seen in the young non‐smoker, the young non‐smoker experiences a greater increase in vessel area during capillary refill. This observation is quantified by the RCC metric, which takes into account vessel dilation potential by calibrating the mean capillary diameter at baseline with that at maximum capacity (Equation (3)). Differences in baseline measurement can now be explained by looking to physiological disparities between the capillary networks. We posit that Subject 2's low score on the capillary capacity index is associated with the blood vessels’ impaired dilation potential and permeability to gas exchange.
This RCC theory is consistent with the lack of observed differences in the VLD and BI metrics across subjects; however, it is impossible to determine statistical significance with a single subject in each experimental group. Further investigation is necessary to make this claim generalizable and promote novel diagnostic techniques in clinical dermatology. While our OCTA method shows great promise, the technique requires scrutiny. Although the reperfusion OCTA images reveal a more extensive capillary network than standard OCTA images, it is unclear how closely the image approximates the physical reality. Further investigation is necessary to validate the correlation between maximum capillary capacity OCTA imaging and histological evaluation of vascular endothelial cells.
On the technological side, during the acquisition of the OCTA sequence, some vessels that appeared as singular structures in baseline imaging appeared as multiple structures upon capillary refill. Current OCTA analysis cannot determine whether the baseline image represents a singular or multiple perfused structures because of the imaging system's poor resolution. To counteract the effect of VLD doubling with the increased ability to differentiate between paired structures in the capillary refill images, the OBVS segmentation method does not distinguish between paired structures to preserve the integrity of the RCC metric. Additionally, the OBVS segmentation method employed in this study was developed and optimized for OCTA imaging of murine skin, and it has yet to be optimized for human skin imaging 10. Due to the prohibitive cost of obtaining manual delineation of the images, the quality of the segmentation results in this study was not quantified.
CONCLUSION
The OCTA sequential imaging method proposed in this paper introduces a new biomarker for assessing the relative capacity of capillaries and generates a more accurate representation of the existing vascular network than standard OCTA methods. The vascular architecture represented by the capillary refill images is believed to provide a complete picture of microvasculature; however, cross‐validation of OCTA refill images with histology or other imaging modalities is necessary. The relationship between baseline and reperfusion images provides novel information about the percentage of the capillary network perfused under ambient conditions along with valuable data on vessel dilation potential. The proposed RCC metric quantifies the observed functionality of imaged vessels into a single parameter. This metric is useful in that it provides information beyond simply documenting the architecture of a capillary network by suggesting differences in the stiffening of the vascular wall, vessel permeability, and capacity for gas exchange 18. Further studies are necessary to assess the distinction of the RCC metric and will require controlled experimental groups with a sample size large enough to achieve statistical significance. We believe the systematic implementation of our method of OCTA imaging in clinical settings will be invaluable in the differential diagnosis of a wide array of dermatological and vascular conditions by providing new pathological biomarkers, along with providing the tools for monitoring therapies targeted at manipulating surface microvasculature. Potential technological improvements to OCTA imaging include benchmarking OBVS with deep learning vessel segmentation, which may result in enhanced segmentation quality. Additionally, the use of faster OCTA imaging systems could allow for real‐time visualization of reperfusion, generating novel insights into the mechanisms of vascular physiology.
[Correction added on April 27,2019 after first online publication: added additional affiliation to Prof. Hüettmann's: Airway Research Center North (ARCN), Member of the German Center of Lung Research (DZL), Gießen, Germany]
REFERENCES
- 1. Schuh S, Holmes J, Ulrich M, et al. Imaging blood vessel morphology in skin: Dynamic optical coherence tomography as a novel potential diagnostic tool in dermatology. Dermatol Therapy 2017;7(2):187–202. [DOI] [PMC free article] [PubMed] [Google Scholar]
- 2. Byers RA, Maiti R, Danby SG, et al. Sub‐clinical assessment of atopic dermatitis severity using angiographic optical coherence tomography. Biomed Opt Express 2018;9(4):2001–2017. [DOI] [PMC free article] [PubMed] [Google Scholar]
- 3. Deegan AJ, Talebi‐Liasi F, Song S, et al. Optical coherence tomography angiography of normal skin and inflammatory dermatologic conditions. Lasers Surg Med 2018. 1–11. [DOI] [PMC free article] [PubMed] [Google Scholar]
- 4. Barton JK, Stromski S. Flow measurement without phase information in optical coherence tomography images. Opt Express 2005;13(14):5234. [DOI] [PubMed] [Google Scholar]
- 5. Zhang A, Zhang Q, Chen CL, Wang RK. Methods and algorithms for optical coherence tomography‐based angiography: A review and comparison. J Biomed Opt 2015;20(10):100901. [DOI] [PMC free article] [PubMed] [Google Scholar]
- 6. Themstrup L, Welzel J, Ciardo S, et al. Validation of dynamic optical coherence tomography for non‐invasive, in vivo microcirculation imaging of the skin. Microvasc Res 2016;107(8):97–105. [DOI] [PubMed] [Google Scholar]
- 7. Men S, Wong JM, Welch EJ, et al. OCT‐based angiography of human dermal microvascular reactions to local stimuli: Implications for increasing capillary blood collection volumes. Lasers Surg Med 2018;50(9):908–916. [DOI] [PubMed] [Google Scholar]
- 8. Carter HH, Gong P, Kirk RW, et al. Optical coherence tomography in the assessment of acute changes in cutaneous vascular diameter induced by heat stress. J Appl Physiol 2016;121:965–972. [DOI] [PubMed] [Google Scholar]
- 9. Gong P, Es'haghian S, Harms KA, et al. Optical coherence tomography for longitudinal monitoring of vasculature in scars treated with laser fractionation. J Biophotonics 2015;9(6):626–636. [DOI] [PubMed] [Google Scholar]
- 10. Casper M, Schulz‐Hildebrandt H, Evers M, Birngruber R, Manstein D, Hüttmann G. Optimization‐based vessel segmentation pipeline for robust quantification of cutaneous capillary networks with optical coherence tomography angiography. J Biomed Opt 2019;24(4):046005. [DOI] [PMC free article] [PubMed] [Google Scholar]
- 11. De Carvalho N, Welzel J, Schuh S, et al. The vascular morphology of melanoma is related to Breslow index: An in vivo study with dynamic optical coherence tomography. Exp Dermatol 2018;27(11):1280–1286. [DOI] [PubMed] [Google Scholar]
- 12. Waibel JS, Holmes J, Rudnick A, Woods D, Kelly KM. Angiographic optical coherence tomography imaging of hemangiomas and port wine birthmarks. Laser Surg Med 2018;50(7):718–726. [DOI] [PubMed] [Google Scholar]
- 13. Fuchs CS, Andersen AJ, Ardigo M, Philipsen PA, Haedersdal M, Mogensen M. Acne vulgaris severity graded by in vivo reflectance confocal microscopy and optical coherence tomography. Laser Surg Med 2019;51(1):104–113. [DOI] [PubMed] [Google Scholar]
- 14. Ulrich M, Themstrup L, De Carvalho N, et al. Dynamic optical coherence tomography in dermatology. Dermatology 2016;232(3):298–311. [DOI] [PubMed] [Google Scholar]
- 15. Tibby SM, Hatherill M, Murdoch IA. Capillary refill and core—Peripheral temperature gap as indicators of haemodynamic status in paediatric intensive care patients capillary. Arch Dis Child 1999;80(2):163–166. [DOI] [PMC free article] [PubMed] [Google Scholar]
- 16. Boron WF, Boulpaep EL. Medical Physiology. 3rd edition Elsevier; 2017. [Google Scholar]
- 17. Pappano AJ, Wier WG. Cardiovascular Physiology. 10th edition Elsevier; 2013. [Google Scholar]
- 18. Bentov I, Reed MJ. The effect of aging on the cutaneous microvasculature. Microvasc Res 2015;100:25–31. [DOI] [PMC free article] [PubMed] [Google Scholar]
- 19. Mariampillai A, Leung MK, Jarvi M, et al. Optimized speckle variance OCT imaging of microvasculature. Opt Lett 2010;35(8):1257–1259. [DOI] [PubMed] [Google Scholar]
- 20. Dabov K, Foi A, Katkovnik V, Egiazarian K. Image denoising by sparse 3D transform‐domain collaborative filtering. IEEE Trans Image Process 2007;16(8):2080–2095. [DOI] [PubMed] [Google Scholar]
- 21. Boykov Y, Veksler O, Zabih R. Efficient approximate energy minimization via graph cuts. IEEE Trans Pattern Anal Mach Intell 2001;20(12):1222–1239. [Google Scholar]
- 22. Reif R, Qin J, An L, Zhi H, Dziennis S, Wang RK. Quantifying optical microangiography images obtained from a spectral domain optical coherence tomography system. Int J Biomed Imag 2012;2012:1–11. Article ID 509783. [DOI] [PMC free article] [PubMed] [Google Scholar]