

ABSTRACT
Introduction
Long‐term use of unfractionated heparin (UFH) or low‐molecular‐weight heparin (LMWH) causes bone loss and osteoporosis in patients not receiving hemodialysis. This study aimed to investigate the effect of UFH and LMWH on bone mineral density (BMD) in patients undergoing maintenance hemodialysis (MHD).
Methods
Patients undergoing MHD using UFH or LMWH as anticoagulants were enrolled. BMD (in g/cm2), T‐score and Z‐score (BMDs) were measured at the lumbar spine and femur neck using dual‐energy X‐ray absorptiometry (DXA) at baseline and 2 years later. Patient demographics and clinical indices were collected. Correlation analysis was used to identify significant predictors of bone loss. Multiple linear regression was used to explore the relationship between heparin type and bone loss progression.
Findings
A total of 104 patients were enrolled and completed the baseline BMD test; 72 completed the test again 2 years later. Six patients were excluded because they used both UFH and LMWH. Although BMD decreased in some patients in the UFH group, a slight increase in the BMD was observed on an average in the LMWH group after 2 years. The mean change in BMD (in g/cm2) [0(−0.03,0.04) vs. 0.04(0,0.06), P = 0.023], T‐score [0(−0.40,0.30) vs. 0.35(−0.03,0.53), P = 0.038], and Z‐score [0.10(−0.30,0.40) vs. 0.45(0.08,0.63), P = 0.031] in the lumbar spine in the UFH group was lower than those in the LMWH group. Femur neck BMD did not change significantly. In a linear regression model, after adjusting for diabetes mellitus, parathyroid hormone, and serum phosphate, we did not find an association between heparin substances and BMD.
Discussion
UFH might be associated with loss of lumbar spine BMD in patients undergoing MHD.
Keywords: Hemodialysis, heparin, low‐molecular‐weight heparin, bone mineral density, osteoporosis
INTRODUCTION
Chronic kidney disease mineral and bone disorder (CKD‐MBD) is one of the crucial complications of chronic kidney disease (CKD). In 2009, Kidney Disease: Improving Global Outcomes (KDIGO) guideline made the definition of CKD‐MBD, including abnormalities in bone turnover, mineralization, and volume. 1 Low bone mass is frequent especially in patients on dialysis. 2 Osteoporosis characterized by low bone mass is part of renal osteodystrophy and a risk for bone fractures. 3 , 4 Particularly, compared to patients without kidney disease, patients with CKD‐MBD have a frequency of vertebral and hip fractures up to fourfold greater. 5 , 6 Furthermore, osteoporosis‐induced bone fractures are associated with reduced quality of life and increased mortality. 7 , 8
Bone mineral density (BMD), measured by dual‐energy X‐ray absorptiometry (DXA), is a valid method to assess the risk of bone fractures in patients without kidney disease. 9 In the previous guidelines, KDIGO recommended that in patients with CKD G3a‐G5D with evidence of CKD‐MBD and/or risk factors of osteoporosis, BMD testing should be used to assess the risk of fracture, if the results impact treatment decisions. 10 Yenchek et al. have demonstrated that lower BMD is a risk for fracture in older individuals with or without moderate CKD. 11 In addition, growing evidence shows that BMD can predict fractures in patients on dialysis, 12 although some reports reached the opposite conclusion. 13 , 14
Heparin is an anticoagulant commonly used in clinical practice, especially in hemodialysis treatment. Unfractionated heparin (UFH) is a mucopolysaccharide molecule that exerts anticoagulant effect by binding to antithrombin. Low‐molecular‐weight heparin (LMWH) is prepared by chemical or enzymatic reactions to reduce the length of the unfractionated heparin pentasaccharide chain. LMWH exerts anticoagulant effect by inhibiting Xa activity by binding to antithrombin. 15 In recent years, animal experiments and clinical observations have confirmed that long‐term use of UFH could induce bone loss, osteoporosis, and increase the risk of fracture. 16 , 17 , 18 In vitro, Li et al. found that UFH promoted osteoclastogenesis by inhibiting the activity of osteoprotegerin. 19 The side effects of LMWH were fewer than that of UFH, but the long‐term use of LMWH is not without risks. 16
In patients undergoing MHD, CKD‐MBD makes the relationship between heparin and osteoporosis more complex. To date, few studies have focused on the effects of long‐term use of UFH or LMWH on BMD change in patients undergoing MHD. According to the criteria for the diagnosis of osteoporosis, lumbar spine and femoral neck are the most common skeletal measured sites. 19 In our prospective cohort of patients undergoing MHD, the relationship between type of heparin and BMD changes in the lumbar spine and femoral neck were analyzed.
MATERIALS AND METHODS
Study design and patients
This single‐center prospective, prevalent cohort study was conducted among patients undergoing MHD. This study was approved by the Ethics Committee of Peking University People's Hospital, and the investigators adhered to the ethical principles of the Declaration of Helsinki when conducting the study.
Patients who had received hemodialysis therapy at the dialysis center in Peking University People's Hospital were checked for enrollment from October 2011 to December 2017. Inclusion criteria were age ≥18 years, chronic maintenance dialysis for at least 3 months, mental competence, use of UFH or LMWH as an anticoagulant during dialysis, and willingness to participate in the study. Exclusion criteria included systemic illnesses or organ diseases that may affect bone (except diabetes mellitus), clinical conditions that may limit study participation (e.g., cardiovascular disease and infections), chronic alcoholism, and drug addiction.
Patient grouping according to heparin usage
The type of heparin used for each patient during the 2‐year follow‐up was retrieved from the medical chart. Patients were grouped as UFH users (provided with UFH in more than 80% dialysis sessions) and LMWH users (provided with LMWH in more than 80% dialysis sessions). Patients who used both UFH and LMWH were excluded.
Demographics and clinical indices
Patient age, sex, primary causes of uremia, dialysis duration, and body mass index (BMI) were collected at baseline. Clinical indices including hemoglobin (Hb, g/dL), albumin (Alb, g/dL), corrected calcium (cCa, mmol/L), phosphorus (P, mmol/L), alkaline phosphatase (ALP, U/L), and intact PTH (iPTH, pg/ml) were also collected at baseline and at the end of follow‐up. Blood samples were taken immediately before the dialysis session.
Bone mineral density measurement
Enrolled patients received DXA to evaluate BMD at baseline and 2 years later. DXA was used to assess the lumbar spine (from L1 through L4) and the left proximal femur (femoral neck) BMD. BMD was measured with a Hologic Delphi QDR Series (HOLOGIC Inc., Waltham, USA). BMD was reported in absolute values (g/cm2). T‐score was calculated based on comparison with a 30‐year‐old reference group and Z‐score was based on comparison with age‐ and sex‐matched reference group. 20 Osteoporosis was defined as a T‐score ≤ −2.5 at least one site (lumbar spine and/or femoral neck), and osteopenia as T‐score between −1.0 and −2.5.
Statistical analyses
Continuous data are shown as mean ± standard deviation (SD) and categorical data as percentages. Nonparametric data are expressed as median and 25th to 75th interquartile range (IQR25‐75). Analyses were conducted using SPSS version 22 software (IBM SPSS, USA). Continuous data were evaluated for normality before statistical testing. The Mann‐Whitney test was used for non‐normally distributed continuous variables and the t test for normally distributed continuous variables. The chi‐square test was used for categorical variables. Spearman or Pearson correlation analysis was used to test the relationship between the clinical indices and changes in BMD (in g/cm2), T‐score, and Z‐score (BMDs) depending on the distribution and equality of variance. Six multiple linear regression models were built to explore the relationship between heparin type and each change in BMD at the lumbar spine and femur neck after adjusting for cCa, P, DM, and iPTH. For each test, a P value less than 0.05 was considered as statistically significant.
RESULTS
Study cohort description
Patient demographics, clinical indices, and diagnosis according to BMD at baseline and 2 years are shown in Table 1. A total of 104 patients undergoing MHD were enrolled at baseline, 32 patients were excluded, and 72 patients completed BMD measurements 2 years later. Reasons for exclusion included 15 patients did not have the second BMD measurement, six patients died, three patients received kidney transplantation, and eight patients withdrew due to transferring to another hospital or personal reasons. The study was conducted on 72 HD patients, including 32 (44.44%) female patients, with an average age of 59.75 ± 15.18, and a median dialysis duration of 17.00 (7.25, 57.75) months. Eighteen (25.00%) patients had complications of diabetes mellitus. Among the patients, 38 (52.78%) had osteopenia, 20 (27.78%) osteoporosis, and 14 (19.44%) had normal bone mass at baseline. After 2 years, the number changed to 38 (52.78%) with osteopenia, 23 (31.94%) osteoporosis, and 11 (15.28%) normal bone mass. There were no significant difference in demographics, proportion of DM, data on BMD at different sites, and clinical indices of serum such as Hb, P, ALP, and iPTH between the two groups. The serum cCa level was higher 2 years later (P = 0.009). BMDs at the lumbar spine and femoral neck are shown in Figure 1.
Table 1.
Population characteristics, clinical indices, and BMD in patients undergoing MHD at baseline and 2 years
| At baseline (n = 72) | At 2 years (n = 72) | |
|---|---|---|
| Age | 59.75 ± 15.18 | 61.75 ± 15.18 |
| Dialysis vintage (months) | 17.00 (7.25, 57.75) | 41.00 (30.25, 83.00) |
| Female, n (%) | 32 (44.44) | 32 (44.44) |
| DM, n (%) | 18 (25.00) | 18 (25.00) |
| BMI | 23.48 ± 3.48 | 24.05 ± 3.74 |
| Hb (g/L) | 110.94 ± 9.85 | 114.35 ± 6.66 |
| Alb (g/L) | 39.85 ± 3.04 | 39.64 ± 2.86 |
| cCa (mmol/L) | 2.22 ± 0.14 | 2.31 ± 0.23* |
| P (mmol/L) | 1.55 ± 0.44 | 1.60 ± 0.48 |
| iPTH (pg/ml) | 202.47 ± 144.52 | 199.02 ± 149.72 |
| ALP (U/L) | 68.34 (59.00, 81.88) | 76.43 ± 28.58 |
| BMD at lumbar spine (g/cm2) | 0.93 ± 0.13 | 0.94 ± 0.17 |
| T score of lumbar spine | −1.28 ± 1.18 | −1.19 ± 1.39 |
| Z score of lumbar spine | −0.35 ± 1.22 | −0.24 ± 1.4 |
| BMD at femur neck (g/cm2) | 0.68 ± 0.15 | 0.67 ± 0.14 |
| T score of femur neck | −1.70 ± 1.21 | −1.79 ± 1.14 |
| Z score of femur neck | −0.70 ± 1.08 | −0.74 ± 1.05 |
| Diagnosis | ||
| Normal bone mass, n (%) | 14 (19.44) | 11 (15.28) |
| Osteopenia, n (%) | 38 (52.78) | 38 (52.78) |
| Osteoporosis, n (%) | 20 (27.78) | 23 (31.94) |
P < 0.05.
Alb = albumin; ALP = alkaline phosphatase; BMD = bone mineral density; BMI = body mass index; cCa = corrected calcium; DM = diabetes mellitus; Hb = hemoglobin; iPTH = intact parathyroid hormone; P = phosphate.
Figure 1.
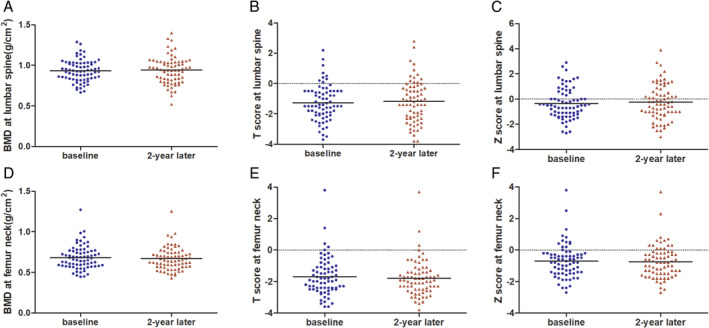
BMD, T‐score, and Z‐score at the lumbar spine and femoral neck at baseline and 2 years. (A)–(C) BMD (in g/cm2), T‐score and Z‐score at the lumbar spine; (D)–(F) BMD (in g/cm2), T‐score and Z‐score at the femoral neck. BMD: bone mineral density. [Color figure can be viewed at wileyonlinelibrary.com]
Characteristics and BMD in UFH and LMWH groups
Characteristics and BMD values of patients using UFH and LMWH at baseline and 2 years later are shown in Table 2. Excluding six patients who used both UFH and LMWH, 40 (60.61%) were UFH users, and 26 (39.39%) were LMWH users. In the LMWH group (n = 26), 24 (92.31%) were nadroparin users, and 2 (7.69%) were provided nadroparin in more than 80% dialysis sessions (but provided enoxaparin for the rest of dialysis sessions). The primary causes of uremia predominantly included chronic glomerulonephritis (n = 32, 48.48%), diabetic nephropathy (n = 14, 21.21%), hypertensive renal disease (n = 7, 10.6%), chronic tubulointerstitial nephropathy (n = 4, 6.1%), and others (n = 9, 13.64%). There were no significant differences in any demographic characteristics or clinical indices between the two groups. In addition, BMD and related diagnosis showed no significant difference either (Table 2). After 2 years, although BMD decreased in some patients in the UFH group, a slight increase in BMD was observed in the LMWH group. The mean changes in BMD (in g/cm2) [0(−0.03,0.04) vs. 0.04(0,0.06), P = 0.023], T‐score [0(−0.40,0.30) vs. 0.35(−0.03,0.53), P = 0.038], and Z‐score [0.10(−0.30,0.40) vs. 0.45(0.08,0.63), P = 0.031] in the lumbar spine in the UFH group were lower than those in the LMWH group. (Table 3). Femur neck BMD did not change significantly.
Table 2.
Characteristics and BMD in UFH and LMWH groups at baseline and 2 years
| UFH | LMWH | P value | |
|---|---|---|---|
| (n = 40) | (n = 26) | ||
| Female, n (%) | 21 (52.50) | 8 (30.77) | 0.127 |
| DM, n (%) | 10 (25.00) | 8 (30.77) | 0.778 |
| Primary causes of uremia, n (%) | |||
| CGN | 21 (52.50) | 11 (42.31) | 0.218 |
| DN | 7 (17.50) | 7 (26.92) | |
| HN | 6 (15.00) | 1 (3.85) | |
| CIN | 3 (7.50) | 1 (3.85) | |
| Others | 3 (7.50) | 6 (23.08) | |
| Age (years) | 61.6 ± 15.07 | 62.85 ± 15.80 | 0.684 |
| Dialysis vintage (months) | 17.50 (5.00, 64.75) | 15.50 (8.75, 28.25) | 0.713 |
| BMI | 23.21 ± 3.20 | 23.8 ± 3.60 | 0.616 |
| Baseline values | |||
| cCa (mmol/L) | 2.22 ± 0.16 | 2.22 ± 0.13 | 0.573 |
| P (mmol/L) | 1.58 ± 0.44 | 1.52 ± 0.45 | 0.806 |
| iPTH (pg/ml) | 187.68 ± 121.62 | 220.95 ± 170.51 | 0.197 |
| ALP (U/L) | 69.67 (57.13, 82.38) | 65.00 (57.42, 82.38) | 0.627 |
| Alb (g/L) | 40.01 ± 2.46 | 40.29 ± 2.44 | 0.797 |
| Hb (g/L) | 108.95 ± 11.21 | 113.75 ± 7.32 | 0.061 |
| BMD at lumbar spine (g/cm2) | 0.92 ± 0.13 | 0.94 ± 0.12 | 0.722 |
| T score | −1.35 ± 1.12 | −1.21 ± 1.05 | 0.768 |
| Z score | −0.70 (−1.30, 0.68) | −0.40 (−0.83, 0) | 0.550 |
| BMD at femur neck (g/cm2) | 0.68 ± 0.15 | 0.69 ± 0.12 | 0.598 |
| T score | −1.68 ± 1.34 | −1.71 ± 0.91 | 0.429 |
| Z score | −0.80 (−1.50, −0.30) | −0.60 (−1.25, −0.28) | 0.948 |
| Diagnosis | 0.315 | ||
| Normal bone mass, n (%) | 7 (17.50) | 5 (19.23) | |
| Osteopenia, n (%) | 20 (50.00) | 17 (65.38) | |
| Osteoporosis, n (%) | 13 (32.50) | 4 (15.38) | |
| Two‐year values | |||
| cCa (mmol/L) | 2.33 (2.33, 2.46) | 2.29 (2.22, 2.41) | 0.416 |
| P (mmol/L) | 1.63 ± 0.49 | 1.58 ± 0.44 | 0.960 |
| iPTH (pg/ml) | 178.98 (62.62, 294.05) | 131.2 (64.51, 255.26) | 0.723 |
| ALP (U/L) | 70.2 (61.50, 94.67) | 68.50 (51.94, 82.75) | 0.279 |
| Alb (g/L) | 39.55 ± 2.41 | 40.33 ± 2.02 | 0.582 |
| Hb (g/L) | 114.48 ± 6.58 | 114.92 ± 4.86 | 0.407 |
| BMD at lumbar spine (g/cm2) | 0.92 ± 0.16 | 0.97 ± 0.14 | 0.428 |
| T score | −1.34 ± 1.24 | −1 ± 1.26 | 0.589 |
| Z score | −0.71 ± 1.17 | −0.73 ± 0.86 | 0.150 |
| BMD at femur neck (g/cm2) | 0.66 (0.58,0.72) | 0.64 (0.57,0.77) | 0.713 |
| T score | −1.95 (−2.50, −1.43) | −1.95 (−2.53, −1.10) | 0.674 |
| Z score | −0.71 ± 1.17 | −0.73 ± 0.86 | 0.631 |
| Diagnosis | 0.640 | ||
| Normal bone mass, n (%) | 4 (10.00) | 5 (19.23) | |
| Osteopenia, n (%) | 23 (57.50) | 14 (53.85) | |
| Osteoporosis, n (%) | 13 (32.50) | 7 26.92) |
Alb = albumin; ALP = alkaline phosphatase; BMD = bone mineral density; BMI = body mass index; cCa = corrected calcium; CGN = chronic glomerulonephritis; CTIN = chronic tubulointerstitial nephropathy; DM = diabetes mellitus; DN = diabetic nephropathy; Hb = hemoglobin; HN = hypertensive nephropathy; iPTH = intact parathyroid hormone; P = phosphate; UFH = unfractionated heparin; LMWH = low‐molecular‐weight heparin. In the LMWH group (n = 26), 24(92.31%) were nadroparin users and 2(7.69%) were provided nadroparin in more than 80% dialysis sessions (but provided Enoxaparin for the rest dialysis sessions).
Table 3.
BMD changes between UFH and LWMH groups
| UFH (n = 40) | LMWH (n = 26) | P value | |
|---|---|---|---|
| ΔBMD at lumbar spine (g/cm2) | 0 (−0.03, 0.04) | 0.04 (0, 0.06) | 0.023* |
| ΔT score | 0 (−0.40, 0.30) | 0.35 (−0.03, 0.53) | 0.038* |
| ΔZ score | 0.10 (−0.30, 0.40) | 0.45 (0.08, 0.63) | 0.031* |
| ΔBMD at femur neck (g/cm2) | −0.02 (−0.04, 0.01) | 0 (−0.03, 0.03) | 0.412 |
| ΔT score | −0.1 (−0.30, 0) | 0 (−0.20, 0.20) | 0.256 |
| ΔZ score | 0 (−0.20, 0.10) | 0.10 (−0.13, 0.30) | 0.406 |
| Progression of bone loss, n (%) | 6 (15.00) | 3 (11.54) | 1.000 |
P < 0.05.
Δ represented the changes in BMD within 2 years. BMD = bone mineral density; UFH = unfractionated heparin; LMWH = low‐molecular‐weight heparin. In the LMWH group (n = 26), 24(92.31%) were nadroparin users and 2(7.69%) were provided Nadroparin in more than 80% dialysis sessions (but provided Enoxaparin for the rest dialysis sessions).
Progression of bone loss
Clinical parameters were compared between patients with bone loss progression and those without (Table 4). Of the 66 patients, 9 (13.64%) had bone loss progression and 57 (86.36%) did not have progression. No significant differences in demographic characteristics and clinical indices (except P 2 years later) were found between the progression and nonprogression groups. The serum P level was higher in the progression group (P = 0.037).
Table 4.
Comparison of demographic, clinical indices and doses of heparin substances in two groups
| Progression | Non‐progression | P value | |
|---|---|---|---|
| (n = 9) | (n = 57) | ||
| Female, n (%) | 4 (44.44) | 25 (43.86) | 1.000 |
| DM, n (%) | 4 (44.44) | 13 (22.81) | 0.220 |
| Age (years) | 58.22 ± 18.07 | 62.7 ± 14.86 | 0.495 |
| Dialysis vintage (months) | 30.00 (26.50, 100.50) | 41.00 (31.00, 82.75) | 0.489 |
| BMI | 23.81 ± 3.45 | 24.11 ± 3.72 | 0.674 |
| Baseline values | |||
| cCa (mmol/L) | 2.26 ± 0.14 | 2.22 ± 0.15 | 0.525 |
| P (mmol/L) | 1.67 ± 0.51 | 1.54 ± 0.43 | 0.531 |
| iPTH (pg/ml) | 199.85 (88.21, 311.85) | 186.60 (93.80, 253.14) | 0.607 |
| ALP (U/L) | 68.88 ± 16.49 | 73.78 ± 26.14 | 0.779 |
| Alb (g/L) | 39.57 ± 2.65 | 40.2 ± 2.42 | 0.438 |
| Hb (g/L) | 108.01 ± 11.63 | 111.29 ± 9.86 | 0.531 |
| Two‐year values | |||
| cCa (mmol/L) | 2.37 ± 0.17 | 2.3 ± 0.24 | 0.184 |
| P (mmol/L) | 1.86 ± 0.28 | 1.57 ± 0.48 | 0.037* |
| iPTH (pg/ml) | 236.2 (165.64, 441.85) | 137.58 (60.67, 263.39) | 0.123 |
| ALP (U/L) | 77.00 (65.00, 106.38) | 69.00 (57.25, 82.00) | 0.178 |
| Alb (g/L) | 39.26 ± 2.07 | 39.95 ± 2.31 | 0.355 |
| Hb (g/L) | 113.44 ± 5.94 | 114.85 ± 5.96 | 0.601 |
P < 0.05.
Alb = albumin; ALP = alkaline phosphatase; BMI = body mass index; cCa = corrected calcium; DM = diabetes mellitus; Hb = hemoglobin; iPTH = intact parathyroid hormone; P = phosphate; UFH = unfractionated heparin; LMWH = low‐molecular‐weight heparin.
Factors affecting BMD changes
The correlation analysis of BMD changes, clinical indices, and heparin substance dosage was evaluated using Spearman's rank correlations at the lumbar spine and femoral neck (Table 5). The results indicated that changes in BMD at the lumbar spine had significant negative associations with P (Table 5).
Table 5.
Correlation analysis of BMD changes and clinical indices
| ΔBMD at lumbar spine (g/cm2) | ΔT score | ΔZ score | ΔBMD at femur neck (g/cm2) | ΔT score | ΔZ score | |||||||
|---|---|---|---|---|---|---|---|---|---|---|---|---|
| r | P value | r | P value | r | P value | r | P value | r | P value | r | P value | |
| P | −0.268 | 0.031* | −0.276 | 0.026* | −0.277 | 0.026* | −0.169 | 0.176 | −0.156 | 0.211 | −0.199 | 0.108 |
| cCa | −0.065 | 0.609 | −0.053 | 0.672 | −0.065 | 0.605 | −0.163 | 0.192 | −0.187 | 0.133 | −0.205 | 0.098 |
| ALP | −0.065 | 0.606 | −0.117 | 0.353 | −0.105 | 0.407 | −0.037 | 0.766 | −0.068 | 0.588 | −0.056 | 0.653 |
P < 0.05.
Δ represented the changes in BMD within 2 years. BMD = bone mineral density; P = phosphate; UFH = unfractionated heparin; LMWH = low‐molecular‐weight heparin.
The results of multiple linear regression analyses are shown in Table 6. We found that P was a negative independent risk factor associated with the changes in BMD (in g/cm2) (β = −0.293, P = 0.025), T‐score (β = −0.283, P = 0.031), and Z‐score (β = −0.284, P = 0.030) at the lumbar spine. DM was another independent risk factor associated with changes in BMD (in g/cm2) (β = 0.269, P = 0.035), T‐score (β = 0.256, P = 0.043), and Z‐score (β = 0.274, P = 0.029) at the femoral neck. However, the type of heparin substance was not correlated with BMD changes (Table 6).
Table 6.
Multiple linear regression analytical method analyzed the independent risk factors of BMD changes
| Variable | β | T | P value | |
|---|---|---|---|---|
| ΔBMD at lumbar spine (g/cm2) | P | −0.293 | −2.302 | 0.025* |
| cCa | −0.083 | −0.674 | 0.503 | |
| iPTH | 0.053 | 0.422 | 0.675 | |
| DM | −0.142 | −1.144 | 0.257 | |
| Heparin type | 0.132 | 1.075 | 0.287 | |
| ΔT score | P | −0.283 | −2.212 | 0.031* |
| cCa | −0.052 | −0.423 | 0.674 | |
| iPTH | 0.077 | 0.608 | 0.546 | |
| DM | −0.012 | −0.099 | 0.921 | |
| Heparin type | 0.175 | 1.417 | 0.162 | |
| ΔZ score | P | −0.284 | −2.226 | 0.030* |
| cCa | −0.058 | −0.472 | 0.639 | |
| iPTH | 0.033 | 0.262 | 0.794 | |
| DM | −0.007 | −0.053 | 0.958 | |
| Heparin type | 0.181 | 1.465 | 0.148 | |
| ΔBMD at femur neck (g/cm2) | P | −0.064 | −0.501 | 0.618 |
| cCa | 0.010 | 0.081 | 0.936 | |
| iPTH | −0.106 | −0.834 | 0.408 | |
| DM | 0.269 | 2.157 | 0.035* | |
| Heparin type | 0.037 | 0.301 | 0.764 | |
| ΔT score | P | −0.072 | −0.566 | 0.574 |
| cCa | 0.010 | 0.084 | 0.933 | |
| iPTH | −0.128 | −1.017 | 0.313 | |
| DM | 0.256 | 2.063 | 0.043* | |
| Heparin type | 0.102 | 0.829 | 0.411 | |
| ΔZ score | P | −0.101 | −0.801 | 0.426 |
| cCa | 0.014 | 0.115 | 0.909 | |
| iPTH | −0.150 | −1.210 | 0.231 | |
| DM | 0.274 | 2.238 | 0.029* | |
| Heparin type | 0.077 | 0.638 | 0.526 |
P < 0.05.
Δ represented the changes in BMD within 2 years. BMD = bone mineral density; cCa = corrected calcium; DM = diabetes mellitus; iPTH = intact parathyroid hormone; P = phosphate.
DISCUSSION
Long‐term use of heparin is associated with bone loss, osteoporosis, and fracture in nondialysis patients. 15 In this study, we found that UFH might be related to the loss of lumbar spine BMD in patients undergoing MHD. However, we did not find evidence that the type of heparin substance was correlated with the progression of bone loss in patients undergoing MHD in our center.
CKD‐MBD, which is common among patients undergoing MHD, results in an increased risk of fracture and mortality. 1 Among the 72 patients undergoing MHD, 58(80.56%) cases at baseline had osteopenia and osteoporosis in accordance to the diagnostic criteria, suggesting that patients undergoing MHD have a high risk of decreased BMD (Table 1). A total of 66 patients undergoing MHD using UFH and LMWH and took the BMD test twice completed the follow‐up study. The results showed that there was no significant difference in baseline and 2‐year values between the UFH and LMWH groups. However, changes in BMD (in g/cm2), T‐score, and Z‐score at lumbar spine in the UFH group decreased significantly compared to those in the LMWH group in 2 years. This indicated that UFH might be correlated with lumbar spine loss in patients undergoing MHD compared with LMWH. A similar result was found wherein the mean BMD of the lumbar spine was significantly lower in the UFH group than in the LMWH group in women 3 years after delivery according to Pettilä et al. 21 We did not observe a significant difference in bone loss progression at the femur neck between the UFH and LMWH groups.
Clinical trials and animal experiments have demonstrated that long‐term use of heparin can induce bone loss and osteoporosis, and a high cumulative dosage of heparin was related to the progression of bone loss. 17 , 18 , 22 However, our results were negative. The reasons were as follows: (1) The follow‐up period was not long enough. Osteoporosis in CKD is a complication with many influencing factors. It has a long progression and changes slowly. Meng et al. demonstrated that there was no difference in BMD between UFH and LMWH group in rats after a 6‐week intervention. 23
Similar results were reported in the study by Matzsch et al. 18 In our research, lumbar spine BMD changes were significantly different between the UFH and LMWH groups (Table 3). A prolonged follow‐up period might lead to additional observations. (2) Low dosage and little difference in the dosage of UFH or LMWH might be another reason. In previous studies, UFH and LMWH used were usually over 10,000 IU and 5000 IU per day for several months to treat thrombosis. 24 However, marginal dosage of UFH or LMWH during dialysis sessions were usually used. The effect of low doses of UFH or LMWH might be small and undetectable. In addition, the difference in the dosage of either UFH or LMWH was small among patients. The narrow range also made it challenging to determine the relationship between doses of UFH or LMWH and BMD changes. (3) Receiving calcium or vitamin D supplements or phosphate binders and participating in physical activity may impact BMD. In a study by Cianciolo et al., active vitamin D increased BMD after renal transplantation. 25 Zhang indicated that lanthanum carbonate could improve bone density in patients with diabetes undergoing MHD. 26 Dolgos et al. followed 133 renal transplant patients, stating that physical activity was associated with high BMD shortly after renal transplantation. 27 We observed increased BMD in some participants after 2 years (Table 3). The comprehensive effect of oral medication and physical activity may play an important role.
Our results also found that some factors were related to the progression of bone loss, including diabetes mellitus and phosphate. These findings were consistent with those of previous studies. Both type 1 and type 2 diabetes mellitus are associated with low BMD, and an increased fracture risk is well documented. 28 Vestergaard showed that patients with diabetes had decreased BMD and increased fracture risk. 29 Furthermore, an increased level of phosphate could predict a low level of lumbar spine BMD, which is similar to Campos‐Obando et al. 30
Our study had several limitations. First, the sample size was small and the follow‐up period was short. A larger sample size might help us conduct a stratified analysis of different LMWH forms. Longer time might be needed to detect the progression of osteoporosis. Second, some participants were receiving calcium or vitamin D supplements or phosphate binders, but information on drug intervention and physical activity were not included in the analysis.
In summary, UFH might be associated with loss of lumbar spine BMD in patients undergoing MHD. Further studies with larger sample sizes and longer follow‐up periods are needed to confirm the effect of heparin substances on BMD in patients undergoing MHD.
ACKNOWLEDGMENTS
This research was supported by the National Natural Science Foundation of China. The grant recipient is Li Zuo, and the grant number is 81870524.
Conflicts of Interest: There are no conflicts of interest to declare.
Disclosure of grants or other funding: Dr. Li Zuo was supported by grants from the National Natural Science Foundation of China and the grant number is 81870524.
REFERENCES
- 1. KDIGO . Clinical practice guideline for the diagnosis, evaluation, prevention, and treatment of Chronic Kidney Disease‐Mineral and Bone Disorder (CKD‐MBD). Kidney Int Suppl. 2009;113:S1–S130. [DOI] [PubMed] [Google Scholar]
- 2. Malluche HH, Monier‐Faugere MC. Renal osteodystrophy: What's in a name? Presentation of a clinically useful new model to interpret bone histologic findings. Clin Nephrol. 2006;65:235–242. [DOI] [PubMed] [Google Scholar]
- 3. Najar MS, Mir MM, Muzamil M. Prevalence of osteoporosis in patients with chronic kidney disease (stages 3‐5) in comparison with age‐ and sex‐matched controls: A study from Kashmir Valley Tertiary Care Center. Saudi J Kidney Dis Transpl. 2017;28:538–544. [DOI] [PubMed] [Google Scholar]
- 4. Galambosi P, Hiilesmaa V, Ulander V, Laitinen L, Tiitinen A, Kaaja R. Prolonged low‐molecular‐weight heparin use during pregnancy and subsequent bone mineral density. Thromb Res. 2016;143:122–126. [DOI] [PubMed] [Google Scholar]
- 5. Ensrud KE, Lui LY, Taylor BC, et al. Renal function and risk of hip and vertebral fractures in older women. Arch Intern Med. 2007;167:133–139. [DOI] [PubMed] [Google Scholar]
- 6. Ball AM, Gillen DL, Sherrard D, et al. Risk of hip fracture among dialysis and renal transplant recipients. JAMA. 2002;288:3014–3018. [DOI] [PubMed] [Google Scholar]
- 7. Muraki S, Yamamoto S, Ishibashi H, Nakamura K. Factors associated with mortality following hip fracture in Japan. J Bone Miner Metab. 2006;24:100–104. [DOI] [PubMed] [Google Scholar]
- 8. Marques A, Lourenco O, Da SJ. The burden of osteoporotic hip fractures in Portugal: Costs, health related quality of life and mortality. Osteoporos Int. 2015;26:2623–2630. [DOI] [PubMed] [Google Scholar]
- 9. Johnell O, Kanis JA, Oden A, et al. Predictive value of BMD for hip and other fractures. J Bone Miner Res. 2005;20:1185–1194. [DOI] [PubMed] [Google Scholar]
- 10. Ketteler M, Block GA, Evenepoel P, et al. Executive summary of the 2017 KDIGO Chronic Kidney Disease‐Mineral and Bone Disorder (CKD‐MBD) Guideline Update: What's changed and why it matters. Kidney Int. 2017;92:26–36. [DOI] [PubMed] [Google Scholar]
- 11. Yenchek RH, Ix JH, Shlipak MG, et al. Bone mineral density and fracture risk in older individuals with CKD. Clin J Am Soc Nephrol. 2012;7:1130–1136. [DOI] [PMC free article] [PubMed] [Google Scholar]
- 12. Iimori S, Mori Y, Akita W, et al. Diagnostic usefulness of bone mineral density and biochemical markers of bone turnover in predicting fracture in CKD stage 5D patients‐‐a single‐center cohort study. Nephrol Dial Transplant. 2012;27:345–351. [DOI] [PubMed] [Google Scholar]
- 13. Ambrus C, Marton A, Nemeth ZK, Mucsi I. Bone mineral density in patients on maintenance dialysis. Int Urol Nephrol. 2010;42:723–739. [DOI] [PubMed] [Google Scholar]
- 14. Benyahia M, Shahapuni I, Ghazali A, Massy Z, Fournier A. Bone mineral density, biochemical markers and skeletal fractures in haemodialysis patients. Nephrol Dial Transplant. 2004;19:2153–2154. [DOI] [PubMed] [Google Scholar]
- 15. Mulloy B, Hogwood J, Gray E, Lever R, Page CP. Pharmacology of heparin and related drugs. Pharmacol Rev. 2015;68:76–141. [DOI] [PubMed] [Google Scholar]
- 16. Gajic‐Veljanoski O, Phua CW, Shah PS, Cheung AM. Effects of long‐term low‐molecular‐weight heparin on fractures and bone density in non‐pregnant adults: A systematic review with meta‐analysis. J Gen Intern Med. 2016;31:947–957. [DOI] [PMC free article] [PubMed] [Google Scholar]
- 17. Bick RL, Frenkel EP, Walenga J, Fareed J, Hoppensteadt DA. Unfractionated heparin, low molecular weight heparins, and pentasaccharide: basic mechanism of actions, pharmacology, and clinical use. Hematol Oncol Clin North Am. 2005;19:1–51. [DOI] [PubMed] [Google Scholar]
- 18. Matzsch T, Bergqvist D, Hedner U, Nilsson B, Ostergaard P. Effects of low molecular weight heparin and unfragmented heparin on induction of osteoporosis in rats. Thromb Haemost. 1990;63:505–509. [PubMed] [Google Scholar]
- 19. Li B, Lu D, Chen Y, Zhao M, Zuo L. Unfractionated heparin promotes osteoclast formation in vitro by inhibiting osteoprotegerin activity. Int J Mol Sci. 2016;17:613. [DOI] [PMC free article] [PubMed] [Google Scholar]
- 20. Valkovsky I, Olsanska R, Tvrdik J, et al. Evaluation of biochemical markers and bone mineral density in patients with chronic kidney disease stage 5D at the start of hemodialysis treatment. Biomed Pap Med Fac Univ Palacky Olomouc Czech Repub. 2015;159:93–99. [DOI] [PubMed] [Google Scholar]
- 21. Pettila V, Leinonen P, Markkola A, Hiilesmaa V, Kaaja R. Postpartum bone mineral density in women treated for thromboprophylaxis with unfractionated heparin or LMW heparin. Thromb Haemost. 2002;87:182–186. [PubMed] [Google Scholar]
- 22. Muir JM, Hirsh J, Weitz JI, Andrew M, Young E, Shaughnessy SG. A histomorphometric comparison of the effects of heparin and low‐molecular‐weight heparin on cancellous bone in rats. Blood. 1997;89:3236–3242. [PubMed] [Google Scholar]
- 23. Meng Y, Zhang H, He N, Shi D, Zhao J, Li Q, et al. A comparative study on effects of low molecular weight heparin and unfractionated heparin on renal osteodystrophy and vascular calcification in rats with chronic kidney disease. Chin J Osteoporos. 2018;24:181–186. [Google Scholar]
- 24. Rajgopal R, Bear M, Butcher MK, Shaughnessy SG. The effects of heparin and low molecular weight heparins on bone. Thromb Res. 2008;122:293–298. [DOI] [PubMed] [Google Scholar]
- 25. Cianciolo G, Galassi A, Capelli I, Angelini ML, La Manna G, Cozzolino M. Vitamin D in kidney transplant recipients: Mechanisms and therapy. Am J Nephrol. 2016;43:397–407. [DOI] [PubMed] [Google Scholar]
- 26. Zhang C, Wang S, Zhao S, Zhang X. Effect of lanthanum carbonate on coronary artery calcification and bone mineral density in maintenance hemodialysis patients with diabetes complicated with adynamic bone disease: A prospective pilot study. Medicine (Baltimore). 2017;96:e8664. [DOI] [PMC free article] [PubMed] [Google Scholar]
- 27. Dolgos S, Hartmann A, Bonsnes S, et al. Determinants of bone mass in end‐stage renal failure patients at the time of kidney transplantation. Clin Transplant. 2008;22:462–468. [DOI] [PubMed] [Google Scholar]
- 28. Starup‐Linde J, Lykkeboe S, Gregersen S, et al. Bone structure and predictors of fracture in type 1 and type 2 diabetes. J Clin Endocrinol Metab. 2016;101:928–936. [DOI] [PubMed] [Google Scholar]
- 29. Vestergaard P. Discrepancies in bone mineral density and fracture risk in patients with type 1 and type 2 diabetes‐‐a meta‐analysis. Osteoporos Int. 2007;18:427–444. [DOI] [PubMed] [Google Scholar]
- 30. Campos‐Obando N, Koek WNH, Hooker ER, et al. Serum phosphate is associated with fracture risk: The Rotterdam study and MrOS. J Bone Miner Res. 2017;32:1182–1193. [DOI] [PMC free article] [PubMed] [Google Scholar]