

Abstract
Objective
Brain tissue oxygen (partial oxygen pressure [pO2]) levels are tightly regulated to stay within the normoxic zone, with deviations on either side resulting in impaired brain function. Whereas pathological events such as ischemic attacks and brief seizures have previously been shown to result in pO2 levels well below the normoxic zone, oxygen levels during prolonged status epilepticus (SE) and the subsequent endogenous kindling period are unknown.
Methods
We utilized two models of acquired temporal lobe epilepsy in rats: intrahippocampal kainic acid infusion and prolonged perforant pathway stimulation. Local tissue oxygen was measured in the dorsal hippocampus using an optode during and for several weeks following SE.
Results
We observed hyperoxia in the hippocampus during induced SE in both models. Following termination of SE, 88% of rats initiated focal self‐generated spiking activity in the hippocampus within the first 7 days, which was associated with dynamic oxygen changes. Self‐generated and recurring epileptiform activity subsequently organized into higher‐frequency bursts that became progressively longer and were ultimately associated with behavioral seizures that became more severe with time and led to postictal hypoxia.
Significance
Induced SE and self‐generated recurrent epileptiform activity can have profound and opposing effects on brain tissue oxygenation that may serve as a biomarker for ongoing pathological activity in the brain.
Keywords: epilepsy, hyperoxia, hypoxia, seizures, status epilepticus
Key Points.
SE induced by kainic acid or electrical stimulation leads to long‐lasting hyperoxia
Self‐generated recurrent epileptiform activity begins early after SE and shows dynamic oxygen changes
Self‐generated recurrent epileptiform activity becomes progressively longer and more severe and is associated with postictal hypoxia
1. INTRODUCTION
Mammalian brains consume a highly disproportionate amount of energy given their relatively small size, 1 thus requiring a system capable of balancing cellular oxygen metabolism and the control of cerebral blood flow to maintain brain oxygen levels (partial oxygen pressure [pO2]) within the normoxic zone. 2 Impaired cerebral blood flow typically leads to severely hypoxic conditions, insufficient production of adenosine triphosphate, and a failure to meet the high energetic demands of synaptic plasticity 3 and results in behavioral dysfunction. 4 , 5 In contrast, when oxygen delivery to the brain becomes too great, hyperoxia typically occurs. Hyperoxia favors the production of reactive oxygen species, which can also lead to neuronal damage and behavioral dysfunction. 6 , 7 , 8 , 9 Seizures have previously been shown to move oxygen levels out of the normoxic range, which raises the possibility that seizure‐driven changes in brain pO2 could influence brain function during and after seizures. 10
Induced self‐terminating seizures in rodent models result in postictal vasoconstriction, hypoperfusion, and severe hypoxia that is responsible for acute behavioral deficits and cognitive dysfunction. 3 , 11 , 12 Likewise, postictal hypoperfusion is observed in people with self‐generated recurrent seizures. 13 , 14 In contrast, following exposure to a long‐acting convulsant agent, neuronal hyperexcitability correlates with increased cerebral blood flow and hyperoxia in rats. 15 However, the effect of both induced status epilepticus (SE) and post‐SE self‐generated epileptiform activity on local tissue pO2 is unknown. Moreover, whereas oscillations in spectral oxygen signals have been shown to be predictive of absence seizures, 16 their role as a biomarker in models of focal epilepsy is also unknown.
In the following study, we determined how local dorsal hippocampal pO2 responds in both the intrahippocampal kainic acid (KA) and perforant pathway (PP) electrical stimulation models. 17 , 18 , 19 , 20 We measured pO2 during SE and for several subsequent weeks in relation to self‐generated epileptiform activity. We observed SE‐induced long‐lasting hyperoxia in the dorsal hippocampus in both models. Self‐generated spiking activity emerged within days following the termination of SE and was associated with robustly altered oxygen spectra, indicating that oxygen dynamics can be a useful biomarker for active nonconvulsive focal epilepsy. Post‐SE epileptiform activity increased in frequency, self‐organized into electrographic seizure activity that drove progressively more severe behavioral seizures (endogenous kindling), and was associated with postictal hypoxia. These results provide evidence that epilepsy is not only an electrical disorder, but a vascular one as well.
2. MATERIALS AND METHODS
2.1. Animals and housing conditions
The subjects were 27 male Sprague Dawley rats (Charles River), weighing 200‐273 g at the time of surgery, housed individually in transparent plastic cages with food and water available ad libitum. The colony room was maintained on a 12:12‐hour light‐dark cycle with lights on at 07:00 hours, and all testing took place during the light cycle. Rats were handled and maintained according to the Canadian Council for Animal Care guidelines, and all procedures were approved by the Health Sciences Animal Care Committee of the University of Calgary (AC16‐0272).
2.2. Surgery
Bipolar stimulating electrodes were made from 31‐gauge twisted Teflon‐coated stainless‐steel wires (A‐M Systems) with gold‐plated Amphenol pins attached to the ends. Recording electrodes for both PP‐stimulated rats and KA‐infused rats were composed of a two‐channel twisted stainless‐steel wire electrode (Plastics One). Rats were anesthetized using isoflurane (5% induction and 1.5%‐2.0% maintenance) mixed with 100% oxygen, and lidocaine (2%) was administered subcutaneously at the incision site as a local anesthetic. The skull was secured in a stereotaxic apparatus (David Kopf Instruments), and burr holes were drilled in the skull at the stereotaxic coordinates. For PP‐stimulated rats, two bipolar stimulating electrodes were implanted bilaterally into the perforant paths (anterior/posterior [A/P], −7.3 mm; medial/lateral [M/L], ±5.0 mm; dorsal/ventral [D/V], −6.0 mm) and a unilateral recording electrode into the right dorsal hippocampus (A/P, −3.0 mm; M/L, +2.0 mm; D/V, −3.5 mm). A pO2 optode (Oxford Optronix) was implanted into the right dorsal hippocampus as well (A/P, −4.5 mm; M/L, +4.5 mm; D/V, −4.0 mm) to closely record the tissue oxygenation changes in the hippocampus. For KA‐infused rats, a 22‐gauge guide cannula (Plastics One) was implanted into the right ventral hippocampus (A/P, −6.0 mm; M/L, +5.0 mm; D/V, −6.0 mm), a unilateral recording electrode in the right dorsal hippocampus, and a pO2 optode in the right dorsal hippocampus (A/P, −3.5 mm; M/L, +2.5 mm; D/V, −3.5 mm). Stainless steel screws and dental cement were used to secure the implanted devices to the skull, with one screw serving as a ground reference. All animals were given buprenorphine in a flavored gelatin preparation for 3 days following surgery and allowed at least 5 days rest for recovery prior to experimentation.
2.3. Electroencephalographic and oxygen recordings
Electroencephalographic (EEG) signals were amplified ×1000‐2000 (Grass Neurodata Acquisition System) and digitized at 100 Hz with DATAQ software (DATAQ Instruments). The pO2 optode was 250 µm in diameter and produces no detectible damage to brain tissue over time. Tissue oxygenation was monitored using an Oxylite Pro (Oxford Optronix) within a local area of approximately 500‐1000 µm3. 21 Unless otherwise stated, oxygen measurements were sampled at 0.333 Hz.
2.4. KA infusions
Following a 1‐week postsurgical recovery period and prior to SE induction, rats were administered with a sedating dose of urethane (Sigma), which has previously been shown to limit electrical activity during SE to the temporal lobe, thereby preventing extrahippocampal damage and mortality. 22 , 23 Urethane was dissolved in saline at 0.833 g/mL and injected subcutaneously (0.833 g/kg) at 3‐4 injection sites along the back of the rat. Following this, rats were placed into the recording cage to record baseline oxygen and local field potentials, which in the context of seizure monitoring will subsequently be referred to as EEG. Sixty minutes following urethane injection, the rat was unplugged, and KA (4.0 mg/mL) was infused unilaterally into the right ventral hippocampus at 0.1 µL/min for 4 minutes through a 1.0‐µL Hamilton syringe (Hamilton Robotics) with a microsyringe pump (Harvard Apparatus, model 55‐2222). A ventral hippocampal location was chosen, as it has been shown to produce a temporal lobe epilepsy model with a seizure phenotype similar to the standard dorsal model, 24 and is located at an appropriate distance such that the dorsal optode is not within the area of KA‐induced damage. The microsyringe needle was kept in the ventral hippocampus for 5 additional minutes before removing it and returning the animal to the recording cage. Oxygen measurements and EEG were recorded for a minimum of 90 minutes, or until SE ended, and the rat was returned to its home cage before being transferred to a new cage for 24/7 video‐EEG recording. KA‐induced SE was not terminated by the experimenter, as urethane sedation limited the severity and spread of SE and the rats fully recovered.
2.5. PP stimulation
Following the postsurgical recovery period and prior to SE induction, rats were administered a sedating dose of urethane (Sigma) as described above. Following this, rats were placed into the recording cage to record baseline oxygen and EEG. Sixty minutes following urethane injection, rats were stimulated bilaterally in the PP for 24 hours (2‐Hz paired‐pulse stimuli 40 milliseconds apart at 20 V and a 10‐second 20‐Hz train once per minute at 20 V) in accordance with previous work. 20 Oxygen was recorded at a sample rate of 0.333 Hz with an on/off cycle of 1.5 hour/2.5 hour to preserve oxygen probe life. Rats were administered additional subcutaneous saline, heating, and eye lubrication throughout the 24‐hour stimulation. At the 24‐hour mark, the stimulator was turned off and the rats could briefly return to their home cage before immediately being transferred to a new cage for 24/7 video‐EEG recording.
2.6. 24/7 Video‐EEG recording
Video‐EEG was monitored continuously over the course of 2 to 8 weeks. Electrode cables (Plastics One) were attached to the recording electrodes and a two‐channel commutator. EEG was at a sample rate of 250 Hz. Video was recorded concurrently with EEG using day/night infrared cameras. Following the 8 weeks of video‐EEG recording, remaining rats were removed, and transferred to colony housing for further oxygen measurements.
2.7. EEG scoring for epileptiform activity
EEG was scored by two independent reviewers blinded to animal condition. EEG was viewed in 2‐minute segments and monitored for large‐amplitude self‐generated events compared to baseline. When a candidate event was observed, it was compared to the corresponding video to confirm animal behavior and potential sources of artifact. Self‐generated epileptiform events were placed into four categories (Figure 1): spiking, low‐frequency discharges without behavior, high‐frequency focal seizures (FSs), and high‐frequency generalized seizures (GSs). Spiking (Figure 1A) was defined as low‐frequency (0.5‐1.0 Hz), high‐amplitude individual spikes that lasted for 1 to 20 minutes. Low‐frequency discharges without seizure behavior (Figure 1B) were defined as low‐frequency (1‐3 Hz) events of brief duration (typically <30 seconds). The amplitude of these events was spindlelike; they would begin at low amplitude, gradually increase in amplitude, and peak before decreasing in amplitude toward the end.
FIGURE 1.

Categories of self‐generated epileptiform events. Self‐generated epileptiform activity was divided into four categories: A, spiking or spike discharges; B, low‐frequency discharges without seizure behavior; C, high‐frequency discharges with focal seizures; and D, high‐frequency discharges with generalized seizures
High‐frequency FSs (Figure 1C) were high‐frequency (~5‐10 Hz), high‐amplitude events of moderate duration (typically between 30 and 90 seconds). These seizures are associated with Racine stage 1 and 2 behaviors 25 ; this includes facial automatisms, twitching, and eye‐blinking (stage 1), and chewing and clonic head movements (stage 2). Seizures with these behavioral manifestations were categorized as “focal” because seizure activity is likely discretely localized to a specific brain region or hemisphere. Seizures with unilateral forelimb clonus (stage 3) as the most severe behavioral manifestation were not observed in this study. High‐frequency GSs (Figure 1D) were high‐frequency (~5‐10 Hz), high‐amplitude events of even longer duration (typically >60 seconds), and were initially associated with Racine stages 1, 2, and 3 with progression to bilateral forelimb clonus (stage 4) and rearing, loss of balance, and hindlimb clonus (stage 5) within the same electrographic bout. Stage 4 and 5 seizures were categorized as “generalized” because seizure activity engages bilaterally distributed networks.
The first occurrence of a self‐generated spike discharge or low‐frequency discharge without behavior (Figure 1A,B) was recorded as the first “epileptiform event.” However, subsequent events of this type were not tracked due to their highly frequent occurrence. Each high‐frequency FS and GS in each rat was tracked and analyzed for seizure duration.
2.8. Oxygen dynamics experimentation and analysis
In a separate group of rats (n = 6), KA infusion experiments were performed in the same manner as described above. Following recovery from induced SE, oxygen and EEG were concurrently recorded in the dorsal hippocampus at three time points (48 hours, 1 week, and 2 weeks post‐SE). Oxygen measurements were sampled at 1 Hz to perform additional analysis. Python 3.6 was used for oxygen dynamics analysis. To isolate the relative changes and remove the absolute component of the data, a centered sliding average of 60 seconds was subtracted from the data. One minute of data was removed on both ends. This manipulation allowed us to do a power spectral density analysis (Matplotlib.org) and made the data more comparable to techniques only capable of measuring relative changes, which are most commonly used. Data were filtered for low‐, medium‐, and high‐frequency components using a bandpass Butterworth filter (SciPy.org). Data were isolated at the following frequency ranges: 0‐0.02 Hz, 0.02‐0.04 Hz, 0.04‐0.06 Hz, 0.06‐0.08 Hz, 0.08‐0.10 Hz, and 0.10‐0.12 Hz.
2.9. Statistical analysis
Statistical analysis was performed using Prism (GraphPad) version 6.01. Student t tests (within subjects) were used for experiments with only two groups, or where an a priori hypothesis was tested in experiments with more than two groups. Repeated measures analyses of variance (ANOVAs) were also used when more than two groups were compared. Bonferroni post hoc tests were used where appropriate. Linear regressions were used to analyze the relationship between seizure duration and time post‐SE.
3. RESULTS
3.1. Hippocampal oxygen levels during KA‐induced SE
Local pO2 was measured in the dorsal hippocampus of rats during KA‐induced SE (n = 13; Figure 2). Pre‐KA baseline hippocampal pO2 was 27.86 ± 2.29 mm Hg. Induction of KA‐induced SE significantly increased local hippocampal pO2 (F 9, 120 = 4.76, P < .0001). Mean hippocampal pO2 slowly increased 0.8 mm Hg every 10 minutes and was significantly elevated 50‐60 minutes after KA infusion (33.09 ± 2.29 mm Hg) compared to baseline. Hippocampal oxygen remained significantly elevated 80‐90 minutes after KA infusion (35.41 ± 1.98 mm Hg). Although mean hippocampal oxygen levels remained within the normoxic range for the first 50 minutes, graphs of pO2 for individual rats show highly variable changes in local oxygen levels (Figure 3). Sharp transient increases in pO2 outside of the normoxic range coincided with electrographic seizures during SE. As depicted in Figure 3A, bursts of electrical activity during SE precede brief increases in hippocampal pO2. During KA‐induced SE, for this rat, a brief seizure (30‐40 seconds in duration) caused an immediate 4‐ to 10‐mm Hg increase in pO2, which peaked at seizure termination before declining. In other rats (Figure 3B,C), these oxygen “spikes” were of larger amplitude (11‐29 mm Hg) and occurred more frequently during SE.
FIGURE 2.
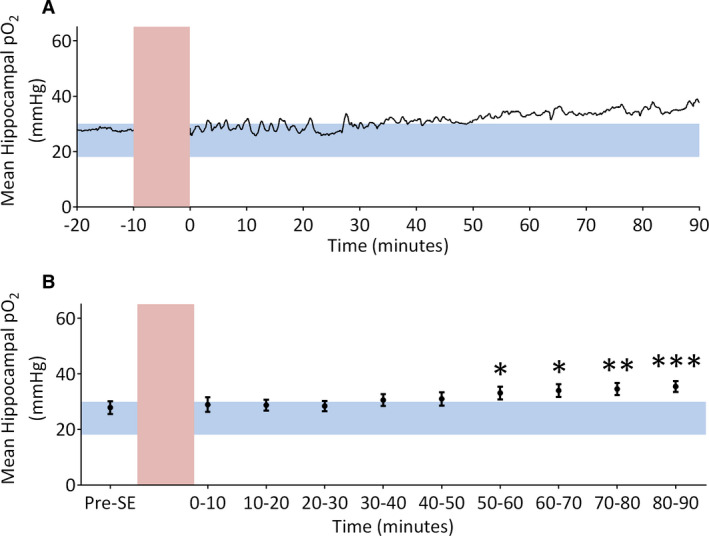
Mean hippocampal partial oxygen pressure (pO2) in rats receiving intrahippocampal kainic acid infusions. A, Mean hippocampal oxygen trace (n = 13) before and after kainic acid infusion. Pre–status epilepticus (SE) oxygen levels are within the normoxic range (blue horizontal bar), but following kainic acid infusion (red vertical bar) pO2 rises and becomes hyperoxic. B, Quantification of mean hippocampal pO2. Within‐subject one‐way analysis of variance revealed a significant effect of time (F 9, 120 = 4.76, P < .0001). Bonferroni posttests demonstrate oxygen is significantly elevated 50‐60 minutes (33.09 ± 2.44 mm Hg), 60‐70 minutes (33.95 ± 2.30 mm Hg), 70‐80 minutes (34.53 ± 2.20 mm Hg), and 80‐90 minutes (35.41 ± 1.98 mm Hg) after induction of SE. Significantly different at *P < .05, **P < .01, ***P < .001
FIGURE 3.

Hippocampal oxygen and electroencephalogram (EEG) during kainic acid (KA)‐induced status epilepticus (SE) from individual rats. Example traces from three individual rats during KA‐induced SE are shown. High‐amplitude and high‐frequency EEG activity is observed (dark blue) following the infusion of KA (vertical red bars). Length and intensity of SE vary greatly between individual rats seen in A‐C. Horizontal blue bars highlight normoxic range in the hippocampus. A, Insets indicate 15‐minute segments of EEG (dark blue) aligned with oxygen (black) to demonstrate seizure‐induced changes in partial oxygen pressure (pO2). Bursts of electrical activity during SE precede short increases in pO2
3.2. Hippocampal oxygen levels during perforant path stimulation‐induced SE
Hippocampal pO2 was continuously recorded during 24‐hour PP stimulation (n = 8; Figure 4). Prestimulation baseline hippocampal mean pO2 was 19.82 ± 2.37 mm Hg, but sharply increased to well above the normoxic range (40.39 ± 2.62 mm Hg) 1.5 hours after stimulation was initiated and remained significantly (F 6, 49 = 32.71, P < .0001) elevated above baseline for the duration of stimulation. A distinct oscillatory pattern in the pO2 trace was observed in each rat related to the stimulus parameters; every minute, a 10‐second train would induce an electrographic seizure (Figure 5A; dark blue) and subsequent increase in pO2. pO2 would rise and then peak shortly after seizure termination and begin to decline, at which point another 10‐second train would begin, repeating the pattern (Figure 5A). Although the amplitude of this oscillatory oxygen activity varied at different timepoints during SE and between different rats (Figure 5B,C), the temporal relationship between oxygen changes and seizure activity remained consistent.
FIGURE 4.

Mean hippocampal partial oxygen pressure (pO2) in rats receiving perforant pathway stimulation. A, Hippocampal oxygen trace (n = 8) before and during perforant pathway stimulation. Prestimulation baseline pO2 is in the normoxic range (blue horizontal bar; 18‐30 mm Hg); however, shortly after stimulation begins (red vertical dotted line), pO2 sharply increases and remains elevated for the duration of stimulation. B, Quantification of mean hippocampal pO2. Within‐subject one‐way analysis of variance revealed a significant effect of time (F 6, 49 = 32.71, P < .0001). Bonferroni posttests demonstrate significantly increased pO2 levels 0‐1.5 hours, 4‐5.5 hours, 8‐9.5 hours, 12‐13.5 hours, 16‐17.5 hours, and 20‐21.5 hours following the start of stimulation‐induced status epilepticus (SE). Significantly different at **P < .01, ***P < .001, ****P < .0001
FIGURE 5.

Hippocampal oxygen during perforant pathway (PP) stimulation‐induced status epilepticus in individual rats. Example hippocampal oxygen traces from three individual rats before and during PP stimulation are given in A‐C. Prestimulation baseline partial oxygen pressure (pO2) is in the normoxic range (horizontal blue bars), but sharply increases and remains elevated following the start of electrical stimulation (dotted red vertical lines). A, Inset indicates 7.5‐minute segment of electroencephalogram (dark blue) aligned with oxygen (black)
3.3. Endogenous kindling of self‐generated epileptiform events
Twenty‐four hours after the induction of SE, rats from both groups were continuously monitored for 60 days to determine the occurrence and progression of self‐generated epileptiform activity within the hippocampus. The first 24‐hours following SE termination were not included in the analysis to ensure that the observed epileptiform events were not due to residual SE activity.
In both models, 100% of rats developed and displayed a self‐generated epileptiform event in the form of spiking or low‐frequency electrographic seizures without seizure behavior. This was observed within 4.88 ± 1.70 days in KA‐infused rats and 2.75 ± 0.49 days in PP‐stimulated rats (Figure 6A,B). Endogenous kindling progressed in the following manner: spiking and low‐frequency electrographic seizures without seizure behavior always preceded the onset of FSs, which in turn always preceded the onset of the first GS in all rats. In KA‐infused rats, five of eight had at least one high‐frequency FS with a mean latency of 18.80 ± 5.73 days, and three of eight had at least one high‐frequency GS with a mean latency of 33.00 ± 10.02 days. In PP‐stimulated rats, seven of eight had at least one high‐frequency FS with a mean latency of 22.00 ± 8.31 days (Figure 6A,B), and five of eight had at least one high‐frequency GS with a mean latency of 33.00 ± 7.17 days. Combining KA‐infused and PP‐stimulated rats, 63% displayed self‐generated epileptiform activity within the second day post‐SE, 75% within the first 3 days, and 88% within the first week.
FIGURE 6.
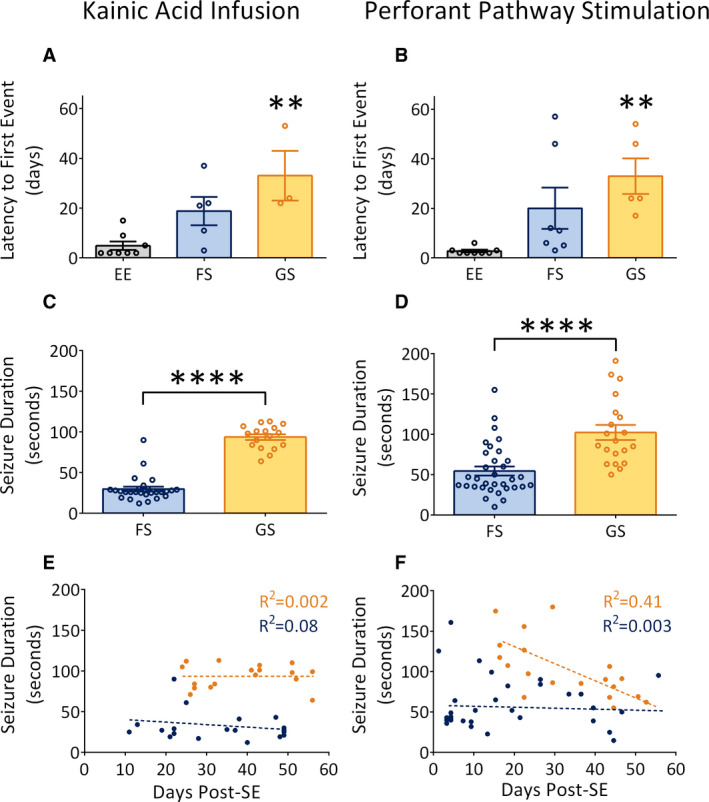
Endogenous kindling in two rat models of temporal lobe epilepsy. A, B, Latency to first epileptiform event in kainic acid (KA)‐infused and perforant pathway (PP)‐stimulated rats. In KA‐infused rats, epileptiform events (EE) occur first, followed by high‐frequency focal seizures (FS) and then high‐frequency generalized seizures (GS). A similar trend is observed in PP‐stimulated rats. C, D, Seizure duration of FS and GS in KA‐infused and PP‐stimulated rats. In both models, GS are significantly longer than FS. E, F, Scatterplots demonstrating the occurrence of FS (blue) and GS (orange) over time. In both models, FS occur earlier than GS. In KA‐infused rats, both seizure types do not increase in duration over time. In PP‐stimulated rats, FS do not increase in duration over time, but GS decrease in duration over time. Significantly different at **P < .01, ****P < .0001. SE, status epilepticus
KA‐infused rats had 27 FSs or a mean of 3.38 FSs per rat and 17 GSs or a mean of 2.13 GSs per rat, with FSs significantly (t 42 = 13.68, P < .0001) shorter in duration (29.67 ± 2.96 seconds) than GSs (93.71 ± 3.55 seconds; Figure 6C). PP‐stimulated rats had 33 FSs or 4.13 FSs per rat and 20 GSs or 2.50 GSs per rat. The PP‐stimulated rats also displayed FSs that were significantly (t 51 = 4.73, P < .0001) shorter (54.40 ± 5.54 seconds) in duration than GSs (102.20 ± 9.24 seconds; Figure 6D).
To precisely determine how seizure durations and phenotypes developed over time, individual FSs and GSs from both models were compared against the number of days following the induction of SE (Figure 6E,F). In KA‐infused rats, FSs were the first to emerge after the termination of SE and persisted for the duration of their recordings without significantly increasing in duration (R 2 = 0.08, P = .21). GSs began later after SE and also did not increase in duration over time (R 2 = 0.002, P = .88). In PP‐stimulated rats, FSs were also the first to emerge after the termination of SE and did not significantly increase in duration (R 2 = 0.003, P = .76). GSs began later after FSs and significantly decreased in duration over time (R 2 = 0.41, P = .002).
3.4. Self‐generated seizures and postictal hypoxia
Hippocampal pO2 was also recorded in rats during self‐generated seizures. Oxygen tracings from self‐generated GSs in both KA‐infused and PP‐stimulated rats are seen in Figure 7A,B. As depicted in Figure 7A, a 94‐second seizure induced a mild increase in hippocampal pO2 from 20 to 23 mm Hg, which rapidly declined following seizure termination to between 1 and 2 mm Hg. The hypoxia was sustained for 60 minutes before returning to baseline by minute 80. As depicted in Figure 7B, a 63‐second seizure caused an immediate increase in hippocampal pO2 from 30 to 39 mm Hg. Following seizure termination, oxygen levels dropped and varied between 4 and 12 mm Hg for 40 minutes before slowly rising back into the normoxic range.
FIGURE 7.
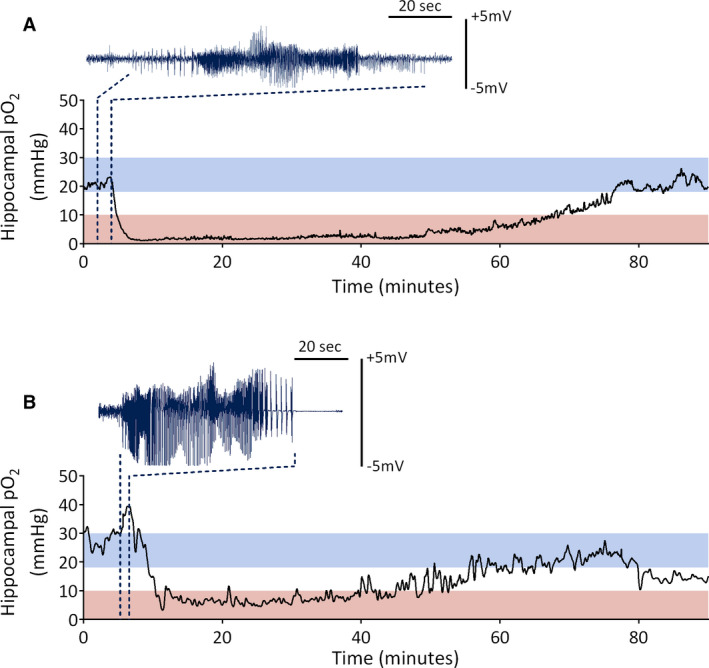
Hippocampal partial oxygen pressure (pO2) during self‐generating seizure events. A, Hippocampal pO2 before, during, and after a self‐generated generalized seizure in a rat that previously received kainic acid–induced status epilepticus. B, Hippocampal pO2 before, during, and after a self‐generated generalized seizure in a rat that previously received perforant pathway–induced status epilepticus. Red bars indicate the severely hypoxic range (0‐10 mm Hg), whereas blue bars indicate the normoxic range (18‐30 mm Hg). Dark blue traces indicate corresponding ictal electroencephalogram
3.5. Interictal oxygen dynamics in rats with KA‐induced epilepsy
Hippocampal oxygen measurements were taken every week post‐SE to determine whether oxygen dynamics were altered as a result of self‐generated spiking activity. Following the termination of KA‐induced SE, the absolute pO2 in the hippocampus was significantly elevated (F 3, 20 = 7.58, P = .003) compared to baseline (Figure 8A,B). Baseline hippocampal pO2 (24.48 ± 1.88 mm Hg) fluctuated within the normoxic range but was significantly increased at 48 hours post‐SE (35.53 ± 3.94 mm Hg) and 1 week post‐SE (35.20 ± 3.13 mm Hg). There was no difference between baseline hippocampal pO2 and 2 weeks post‐SE (31.08 ± 1.68 mm Hg).
FIGURE 8.

Altered interictal oxygen dynamics in rats with kainic acid (KA)‐induced epilepsy. A, Mean hippocampal partial oxygen pressure (pO2) in rats prior to and after the termination of KA‐induced status epilepticus (SE). Horizontal blue bar indicates the normoxic range (18‐30 mm Hg). B, Quantification of A indicates significantly elevated hippocampal pO2 at 48 hours and 1 week post‐SE. C, Power spectral density analysis of the hippocampal oxygen signal 1 week post‐SE plotted on a logarithmic dB scale. D, Quantification of C at binned frequencies. There is an increase in the power of the spectral oxygen signal at 0‐0.02 Hz and 0.04‐0.12 Hz. E, Standard deviation (SD) of the filtered oxygen signal at binned frequencies. There is an increase in the SD of the oxygen signal at 1‐week post‐SE at the lowest frequency range of 0.02‐0.04 Hz compared to pre‐KA baseline. Significantly different at *P < .05, **P < .01, ***P < .001, ****P < .0001
Interictal oxygen dynamics were determined by calculating the power of the hippocampal oxygen signal before, during, and after KA‐induced SE. Previous research has determined that vascular dynamics in the brain fluctuate at frequencies of <0.1 Hz, 26 thus the oxygen signal was analyzed at various bandwidths between 0 to 0.12 Hz. ANOVA revealed a significant effect of time after SE on the power of the oxygen signal (F 5, 30 = 25.96, P < .0001). Specifically, at 1 week post‐SE, there was a significant increase in the power of the oxygen signal (F 1, 35 = 96.37, P < .0001) compared to baseline (Figure 8C,D). Posttests revealed a significant increase in power at 0‐0.02 Hz, 0.04‐0.06 Hz, 0.06‐0.08 Hz, 0.08‐0.10 Hz, and 0.10‐0.12 Hz. The changes observed at 1 week post‐SE were consistent with data at 48 hours and 2 weeks post‐SE (Figure S1).
To further understand changes in oxygen dynamics, the standard deviation (SD) of the filtered oxygen signal was measured across all frequencies. ANOVA revealed a significant effect of time after SE on the SD of the oxygen signal (F 5, 30 = 17.03, P < .0001). Specifically, at 1 week post‐SE, there was an increase in the SD of the hippocampal oxygen signal (F 1, 35 = 27.25, P < .0001) compared to baseline (Figure 8E). Posttests revealed a significant increase in oxygen signal SD at 0.02‐0.04 Hz. The changes observed at 1 week post‐SE were consistent with data at 48 hours and 2 weeks post‐SE (Figure S2).
To demonstrate that the observed increases in both oxygen power and oxygen SD were due to self‐generated epileptiform activity, we isolated segments of the oxygen signal that corresponded to spiking (Figure 1A) on the EEG. EEG traces were analyzed, and four 15‐ to 20‐minute segments of self‐generated spiking from post‐KA rats were used in the analysis. ANOVA revealed a significant effect of spiking on the power of the oxygen signal (F 1, 41 = 105.7, P < .0001). Posttests demonstrate a significant increase in the power of the oxygen signal between 0.02 and 0.12 Hz (Figure 9A,B). There was also a main effect of spiking on the SD of the oxygen signal (F 1, 41 = 21.93, P < .0001), with posttests indicating a significant increase at 0.02‐0.06 Hz compared to pre‐KA baseline recordings (Figure S3). Next, post‐KA EEG traces were analyzed, and four 15‐ to 20‐minute segments, which contained no self‐generated epileptiform activity, were isolated and the corresponding oxygen signal was analyzed. ANOVA revealed a significant alteration in the power of the oxygen signal (F 1, 41 = 10.03, P = .004), but posttests demonstrated no significant changes in the power of the oxygen signal compared to pre‐KA baseline (Figure 9A,B). There was also a significant effect on the SD of the oxygen signal (F 1, 41 = 18.91, P = .0002), with posttests indicating a significant increase at 0.02‐0.04 Hz compared to pre‐KA baseline (Figure S3).
FIGURE 9.

Altered oxygen dynamics is due to the presence of self‐generated epileptiform activity. A, Power spectral density analysis of the hippocampal oxygen signal from segments where interictal self‐generated epileptiform activity was observed (green; post–kainic acid [KA] with spiking) and from post‐KA segments that lacked self‐generated epileptiform activity (blue; post‐KA no spiking) compared to pre‐KA baseline (black). B, Quantification of A at binned frequencies. During post‐KA periods with interictal spiking, there is an increase in the power of the spectral oxygen signal between 0.02 and 0.12 Hz. There is no change in the power of the oxygen signal at any frequency range during post‐KA periods without interictal spiking. This indicates that self‐generated interictal activity drives the observed changes in oxygen dynamics following KA infusion. Significantly different at *P < .05, **P < .01, ***P < .001, ****P < .0001
4. DISCUSSION
Using two established models of SE‐induced temporal lobe epilepsy, the relationship of local dorsal hippocampal oxygen levels with SE and self‐generated epileptiform activity was determined. Temporal lobe SE was associated with increases in local hippocampal pO2 to hyperoxic levels. Following termination of KA‐induced SE, the hippocampus remained hyperoxic for at least 2 weeks. During the first 2 weeks following SE termination, when self‐generated spiking was present, oxygen dynamics were significantly altered relative to baseline and can serve as a biomarker for the presence of epileptiform activity for focal nonconvulsive seizures. Self‐generated epileptiform activity progressively developed into focal and then later generalized behavioral seizures (endogenous kindling). These self‐generated seizures led to postictal severe hypoxia similar to previous descriptions following induced seizures in nonepileptic rodents. 11 Thus, SE and self‐generated behavioral seizures led to local oxygen levels outside of the normoxic zone but in opposite directions.
The initial observation of SE‐induced hyperoxia is consistent with previous work, 15 which has reported hyperoxia in the neocortex in response to soman‐induced generalized SE. SE increases the cerebral metabolic rate of oxygen 27 and neuronal glucose metabolism, 28 leading to increases in cerebral blood flow and local pO2 levels. Rodent imaging studies have observed increases in cerebral blood flow in the cortex during pilocarpine‐induced generalized SE 29 ; however, this study is the first characterization of oxygen levels during focal SE. This sustained hyperoxia may also contribute to brain damage, as the brain is extremely vulnerable to oxidative damage, 30 and KA‐induced SE leads to the production of reactive oxygen species. 31 , 32 The damage to neurons during this period 23 , 33 , 34 is sufficient to permanently alter neuronal excitability and cause self‐generated recurrent seizures, 20 but the contribution of SE‐induced hyperoxia remains to be determined.
The observation that KA‐induced SE resulted in hyperoxia in the hippocampus that was sustained for 2 weeks is consistent with previous work that reported hyperperfusion of the rat amygdala between 2 and 14 days following pilocarpine‐induced SE. 35 Interictal hyperperfusion has also been measured in clinical populations and correlates with interictal spike rate. 36 In animal models, bicuculline injections into the cortex lead to measurable increases in cerebral blood flow 37 and local capillary perfusion, 38 which align with interictal spikes. SE may drive vasodilation in response to heightened metabolic demand, with post‐SE interictal spiking responsible for the maintenance of dilated vessels and subsequent hyperoxia. Metabolic rate may also be chronically reduced following SE. Hypometabolism of glucose and mitochondrial metabolic dysfunction in the hippocampus following SE have been reported. 39 , 40 Compromised mitochondria that are consuming less oxygen for aerobic cellular respiration could contribute to hyperoxia. Neurons also become more dependent on glycolysis following KA‐induced SE, 41 and consume less oxygen. The balance between vascular and metabolic factors that contribute to sustained hyperoxia in the hippocampus following SE requires further study.
This study also provides evidence that oxygen dynamics are altered following SE. Previous work demonstrated an increase in the spectral power of the oxygen signal at and above 0.08 Hz in the Genetic Absence Epilepsy Rat From Strasbourg model. 16 In the KA‐induced focal epilepsy model, we observed increases in the power of the spectral oxygen signal at frequencies between 0 and 0.12 Hz, as well as an increase in the SD of the signal at 0.02‐0.06 Hz. These changes occur in the absence of clinically obvious (behavioral) seizure activity. Subclinical epileptiform activity, occurring post‐SE, likely drives changes in blood flow to the focal region without the sustained vasoconstriction and hypoperfusion typically observed after a clinically apparent seizure. 13 , 14 Interictal spikes are known to display blood oxygenation level–dependent (BOLD) changes, 42 , 43 and thus are a likely candidate to affect oxygen dynamics. These findings support the use of this technique in clinical populations to locate the seizure onset zone (SOZ), or to differentiate between epileptic and nonepileptic tissue. Human studies using simultaneous intracranial EEG–functional magnetic resonance imaging have shown local BOLD responses to focal interictal discharges, which are colocalized with the SOZ. 44 , 45 Furthermore, surgical studies have used optical mapping during nonictal periods to separate epileptogenic cortex from healthy tissue. The successful use of low‐frequency hemodynamic oscillations to map the cortex in pediatric patients with epilepsy, 46 along with similar findings in animal studies, further suggests that these analytical tools can be applied to other noninvasive blood flow imaging modalities.
At longer times after SE, self‐generated recurrent focal and generalized behavioral seizures are associated with long‐lasting and severe postictal hypoxia (<10 mm Hg). Oxygen levels in this range are associated with cell damage and worse outcomes. 47 , 48 Antagonism of the COX‐2 enzyme and L‐type calcium channels has been shown to effectively prevent seizure‐induced hypoxia in model systems, and clinical trials in Canada and the Netherlands are currently underway.
This study demonstrates that oxygen levels become hyperoxic during SE but hypoxic following self‐generated seizures and that during self‐generated focal nonconvulsive spiking, changes in oxygen dynamics can serve as a biomarker. Thus, epilepsy must also be understood as a vascular disorder, and oxygen levels may contribute to seizure‐induced behavior and anatomical anomalies.
CONFLICT OF INTEREST
None of the authors has any conflict of interest to disclose. We confirm that we have read the Journal's position on issues involved in ethical publication and affirm that this report is consistent with those guidelines.
Supporting information
Fig S1
Fig S2
Fig S3
ACKNOWLEDGMENTS
M.D.W. is funded by an Alberta Innovates Graduate Studentship. J.S.F. is supported by a Canadian Institutes for Health Research (CIHR) postdoctoral fellowship. This project was funded by CIHR grants (PTJ‐378054 and MOP‐130495) to M.H.S. and G.C.T., respectively.
Wolff MD, Farrell JS, Scantlebury MH, Teskey GC. Dynamic oxygen changes during status epilepticus and subsequent endogenous kindling. Epilepsia. 2020;61:1515–1527. 10.1111/epi.16554
REFERENCES
- 1. Magistretti PJ, Allaman I. Brain energy metabolism In: Pfaff DW, ed. Neuroscience in the 21st century. New York, NY: Springer; 2013:1591–620. [Google Scholar]
- 2. Watts ME, Pocock R, Claudianos C. Brain energy and oxygen metabolism: emerging role in normal function and disease. Front Mol Neurosci. 2018;11:216. [DOI] [PMC free article] [PubMed] [Google Scholar]
- 3. Farrell JS, Colangeli R, Dudok B, et al. In vivo assessment of mechanisms underlying the neurovascular basis of postictal amnesia. bioRxiv. 2020;926717:1–24. [DOI] [PMC free article] [PubMed] [Google Scholar]
- 4. Fricker M, Tolkovsky AM, Borutaite V, Coleman M, Brown GC. Neuronal cell death. Physiol Rev. 2018;98(2):813–80. [DOI] [PMC free article] [PubMed] [Google Scholar]
- 5. Sun MK, Xu H, Alkon DL. Pharmacological protection of synaptic function, spatial learning, and memory from transient hypoxia in rats. J Pharmacol Exp Ther. 2002;300(2):408–16. [DOI] [PubMed] [Google Scholar]
- 6. Brutus NA, Hanley S, Ashraf QM, Mishra OP, Delivoria‐Papadopoulos M. Effect of hyperoxia on serine phosphorylation of apoptotic proteins in mitochondrial membranes of the cerebral cortex of newborn piglets. Neurochem Res. 2009;34(7):1219–25. [DOI] [PubMed] [Google Scholar]
- 7. Terraneo L, Paroni R, Bianciardi P, et al. Brain adaptation to hypoxia and hyperoxia in mice. Redox Biol. 2017;11:12–20. [DOI] [PMC free article] [PubMed] [Google Scholar]
- 8. Tatarkova Z, Engler I, Calkovska A, et al. Effect of long‐term normobaric hyperoxia on oxidative stress in mitochondria of the guinea pig brain. Neurochem Res. 2011;36(8):1475–81. [DOI] [PubMed] [Google Scholar]
- 9. Cantuti‐Castelvetri I, Shukitt‐Hale B, Joseph JA. Neurobehavioral aspects of antioxidants in aging. Int J Dev Neurosci. 2000;18(4–5):367–81. [DOI] [PubMed] [Google Scholar]
- 10. Farrell JS, Colangeli R, Wolff MD, et al. Postictal hypoperfusion/hypoxia provides the foundation for a unified theory of seizure‐induced brain abnormalities and behavioural dysfunction. Epilepsia. 2017;58(9):1493–501. [DOI] [PubMed] [Google Scholar]
- 11. Farrell JS, Gaxiola‐Valdez I, Wolff MD, et al. Postictal behavioural impairments are due to a severe prolonged hypoperfusion/hypoxia event that is COX‐2 dependent. ELife. 2016;5:e19352. [DOI] [PMC free article] [PubMed] [Google Scholar]
- 12. Tran CHT, George AG, Teskey GC, Gordon GR. Seizures cause sustained microvascular constriction associated with astrocytic and vascular smooth muscle Ca2+ recruitment. bioRxiv. 2019;644039: 1–28. [Google Scholar]
- 13. Gaxiola‐Valdez I, Singh S, Perera T, Sandy S, Li E, Federico P. Seizure onset zone localization using postictal hypoperfusion detected by arterial spin labelling MRI. Brain. 2017;140(11):2895–911. [DOI] [PMC free article] [PubMed] [Google Scholar]
- 14. Li E, d'Esterre CD, Gaxiola‐Valdez I, et al. CT perfusion measurement of postictal hypoperfusion: localization of the seizure onset zone and patterns of spread. Neuroradiology. 2019;61(9):991–1010. [DOI] [PubMed] [Google Scholar]
- 15. Lee K, Bohnert S, Wu Y, et al. Assessment of brain oxygenation imbalance following soman exposure in rats. Neurotoxicology. 2018;65:28–37. [DOI] [PubMed] [Google Scholar]
- 16. Farrell JS, Greba Q, Snutch TP, Howland JG, Teskey GC. Fast oxygen dynamics as a potential biomarker for epilepsy. Sci Rep. 2018;8(1):17935. [DOI] [PMC free article] [PubMed] [Google Scholar]
- 17. Pisa M, Sandberg PR, Corcoran ME, Fibiger HC. Spontaneous recurrent seizures after intra‐cerebral injections of kainic acid in rats: a possible model of human temporal lobe epilepsy. Brain Res. 1980;200(2):481–7. [DOI] [PubMed] [Google Scholar]
- 18. Rattka M, Brandt C, Löscher W. The intrahippocampal kainate model of temporal lobe epilepsy revisited: epileptogenesis, behavioral and cognitive alterations, pharmacological response, and hippocampal damage in epileptic rats. Epilepsy Res. 2013;103(2–3):135–52. [DOI] [PubMed] [Google Scholar]
- 19. Sloviter RS, Damiano BP. Sustained electrical stimulation of the perforant path duplicates kainate‐induced electrophysiological effects and hippocampal damage in rats. Neurosci Lett. 1981;24(3):279–84. [DOI] [PubMed] [Google Scholar]
- 20. Bumanglag AV, Sloviter RS. No latency to dentate granule cell epileptogenesis in experimental temporal lobe epilepsy with hippocampal sclerosis. Epilepsia. 2018;59(11):2019–34. [DOI] [PubMed] [Google Scholar]
- 21. Ortiz‐Prado E, Natah S, Srinivasan S, Dunn JF. A method for measuring brain partial pressure of oxygen in unanesthetized unrestrained subjects: the effect of acute and chronic hypoxia on brain tissue PO2 . J Neurosci Methods. 2010;193(2):217–25. [DOI] [PMC free article] [PubMed] [Google Scholar]
- 22. Sloviter RS, Zappone CA, Bumanglag AV, Norwood BA, Kudrimoti H. On the relevance of prolonged generalized status epilepticus in animals to the etiology and neurobiology of human temporal lobe epilepsy. Epilepsia. 2007;48(S8):6–10. [DOI] [PubMed] [Google Scholar]
- 23. Norwood BA, Bumanglag AV, Osculati F, et al. Classic hippocampal sclerosis and hippocampal‐onset epilepsy produced by a single “cryptic” episode of focal hippocampal excitation in awake rats. J Comp Neurol. 2010;518(16):3381–407. [DOI] [PMC free article] [PubMed] [Google Scholar]
- 24. Zeidler Z, Brandt‐Fontaine M, Leintz C, Krook‐Magnuson C, Netoff T, Krook‐Magnuson E. Targeting the mouse ventral hippocampus in the intrahippocampal kainic acid model of temporal lobe epilepsy. eNeuro. 2018;5(4):ENEURO.0158‐18.2018. [DOI] [PMC free article] [PubMed] [Google Scholar]
- 25. Racine RJ. Modification of seizure activity by electrical stimulation. II. Motor seizure. Electroencephalogr Clin Neurophysiol. 1972;32(3):281–94. [DOI] [PubMed] [Google Scholar]
- 26. Mateo C, Knutsen PM, Tsai PS, Shih AY, Kleinfeld D. Entrainment of arteriole vasomotor fluctuations by neural activity is a basis of blood‐oxygenation‐level‐dependent “resting state” connectivity. Neuron. 2017;96(4):936–48.e3. [DOI] [PMC free article] [PubMed] [Google Scholar]
- 27. Sheth SA, Nemoto M, Guiou M, Walker M, Pouratian N, Toga AW. Linear and nonlinear relationships between neuronal activity, oxygen metabolism, and hemodynamic responses. Neuron. 2004;42(2):347–55. [DOI] [PubMed] [Google Scholar]
- 28. Patel AB, de Graaf RA, Mason GF, et al. Glutamatergic neurotransmission and neuronal glucose oxidation are coupled during intense neuronal activation. J Cereb Blood Flow Metab. 2004;24(9):972–85. [DOI] [PubMed] [Google Scholar]
- 29. Choy M, Wells JA, Thomas DL, Gadian DG, Scott RC, Lythgoe MF. Cerebral blood flow changes during pilocarpine‐induced status epilepticus activity in the rat hippocampus. Exp Neurol. 2010;225(1):196–201. [DOI] [PubMed] [Google Scholar]
- 30. Halliwell B. Reactive oxygen species and the central nervous system. J Neurochem. 1992;59(5):1609–23. [DOI] [PubMed] [Google Scholar]
- 31. Liang LP, Ho YS, Patel M. Mitochondrial superoxide production in kainate‐induced hippocampal damage. Neuroscience. 2000;101(3):563–70. [DOI] [PubMed] [Google Scholar]
- 32. Jarrett SG, Liang LP, Hellier JL, Staley KJ, Patel M. Mitochondrial DNA damage and impaired base excision repair during epileptogenesis. Neurobiol Dis. 2008;30(1):130–8. [DOI] [PMC free article] [PubMed] [Google Scholar]
- 33. Kienzler F, Norwood BA, Sloviter RS. Hippocampal injury, atrophy, synaptic reorganization, and epileptogenesis after perforant pathway stimulation‐induced status epilepticus in the mouse. J Comp Neurol. 2009;515(2):181–96. [DOI] [PMC free article] [PubMed] [Google Scholar]
- 34. Mouri G, Jimenez‐Mateos E, Engel T, et al. Unilateral hippocampal CA3‐predominant damage and short latency epileptogenesis after intra‐amygdala microinjection of kainic acid in mice. Brain Res. 2008;1213:140–51. [DOI] [PubMed] [Google Scholar]
- 35. Hawyward NM, Ndode‐Ekane XE, Kutchiashvili N, Gröhn O, Pitkänen A. Elevated cerebral blood flow and vascular density in the amygdala after status epilepticus in rats. Neurosci Lett. 2010;484(1):39–42. [DOI] [PubMed] [Google Scholar]
- 36. Wichert‐Ana L, de Azevedo‐Marques PM, Oliveira LF, et al. Interictal hyperemia correlates with epileptogenicity in polymicrogyric cortex. Epilepsy Res. 2008;79(1):38–48. [DOI] [PubMed] [Google Scholar]
- 37. Vanzetta I, Flynn C, Ivanov AI, Bernard C, Benar CG. Investigation of linear coupling between single‐event blood flow responses and interictal discharges in a model of experimental epilepsy. J Neurophysiol. 2010;103:3139–52. [DOI] [PubMed] [Google Scholar]
- 38. Hirase H, Creso J, Buzsaki G. Capillary level imaging of local cerebral blood flow in bicuculline‐induced epileptic foci. Neuroscience. 2004;128:209–16. [DOI] [PubMed] [Google Scholar]
- 39. Smeland OB, Hadera MG, McDonald TS, Sonnewald U, Borges K. Brain mitochondrial metabolic dysfunction and glutamate level reduction in the pilocarpine model of temporal lobe epilepsy in mice. J Cereb Blood Flow Metab. 2013;33(7):1090–7. [DOI] [PMC free article] [PubMed] [Google Scholar]
- 40. Bascuñana P, Brackhan M, Leiter I, et al. Divergent metabolic substrate utilization in brain during epileptogenesis precedes chronic hypometabolism. J Cereb Blood Flow Metab. 2020;40(1):204–13. [DOI] [PMC free article] [PubMed] [Google Scholar]
- 41. Tanaka S, Sako K, Tanaka T, Nishihara I, Yonemasu Y. Uncoupling of local blood flow and metabolism in the hippocampal CA3 in kainic acid‐induced limbic seizure status. Neuroscience. 1990;36(2):339–48. [DOI] [PubMed] [Google Scholar]
- 42. Duncan JS. Imaging in the surgical treatment of epilepsy. Nat Rev Neurol. 2010;6(10):537–50. [DOI] [PubMed] [Google Scholar]
- 43. Beers CA, Williams RJ, Gaxiola‐Valdez I, et al. Patient specific hemodynamic response functions associated with interictal discharges recorded via simultaneous intracranial EEG‐fMRI. Hum Brain Mapp. 2015;36(12):5252–64. [DOI] [PMC free article] [PubMed] [Google Scholar]
- 44. Cunningham CBJ, Goodyear BG, Badawy R, et al. Intracranial EEG‐fMRI analysis of focal epileptiform discharges in humans. Epilepsia. 2012;53(9):1636–48. [DOI] [PubMed] [Google Scholar]
- 45. Aghakhani Y, Beers CA, Pittman DJ, Gaxiola‐Valdez I, Goodyear BG, Federico P. Co‐localization between the BOLD response and epileptiform discharges recorded by simultaneous intracranial EEG‐fMRI. Neuroimage Clin. 2015;7:755–63. [DOI] [PMC free article] [PubMed] [Google Scholar]
- 46. Song Y, Riera JJ, Bhatia S, et al. Intraoperative optical mapping of epileptogenic cortices during non‐ictal periods in pediatric patients. Neuroimage Clin. 2016;11:423–34. [DOI] [PMC free article] [PubMed] [Google Scholar]
- 47. Farrar JK. Tissue PO2 threshold of ischemic cell damage following MCA occlusion in cats. J Cereb Blood Flow Metab. 1991;11:S553. [Google Scholar]
- 48. Maloney‐Wilensky E, Gracias V, Itkin A, et al. Brain tissue oxygen and outcome after severe traumatic brain injury: a systematic review. Crit Care Med. 2009;37(6):2057–63. [DOI] [PubMed] [Google Scholar]
Associated Data
This section collects any data citations, data availability statements, or supplementary materials included in this article.
Supplementary Materials
Fig S1
Fig S2
Fig S3