

Abstract
The inflammatory response involves the activation of several cell types to fight insults caused by a plethora of agents, and to maintain the tissue homoeostasis. On the one hand, cells involved in the pro‐inflammatory response, such as inflammatory M1 macrophages, Th1 and Th17 lymphocytes or activated microglia, must rapidly provide energy to fuel inflammation, which is essentially accomplished by glycolysis and high lactate production. On the other hand, regulatory T cells or M2 macrophages, which are involved in immune regulation and resolution of inflammation, preferentially use fatty acid oxidation through the TCA cycle as a main source for energy production. Here, we discuss the impact of glycolytic metabolism at the different steps of the inflammatory response. Finally, we review a wide variety of molecular mechanisms which could explain the relationship between glycolytic metabolites and the pro‐inflammatory phenotype, including signalling events, epigenetic remodelling, post‐transcriptional regulation and post‐translational modifications. Inflammatory processes are a common feature of many age‐associated diseases, such as cardiovascular and neurodegenerative disorders. The finding that immunometabolism could be a master regulator of inflammation broadens the avenue for treating inflammation‐related pathologies through the manipulation of the vascular and immune cell metabolism.
Keywords: ageing, immune cells, immunometabolism, inflammation, metabolites
Inflammatory cells switch their metabolism towards glycolysis to meet their high energetic and biosynthetic demand. Interestingly, metabolites that accumulate in glycolytic conditions have been described to reinforce the inflammatory response by modulating intracellular signalling pathways, remodelling the epigenetic landscape or regulating post‐transcriptional and post‐translational modifications. Regarding its impact on inflammation, the glycolytic metabolism of immune and vascular cells could be exploited to target inflammation‐associated pathologies.
Abbreviations
- 2‐DG
2‐deoxyglucose
- ACLY
ATP‐citrate lyase
- AD
Alzheimer's disease
- AGEs
advanced glycation end products
- Aβ
amyloid‐β
- BMDMs
bone marrow‐derived macrophages
- CIC
citrate carrier
- Citr
citrate
- DCs
dendritic cells
- ECs
endothelial cells
- ER
endoplasmic reticulum
- F2,6BP
fructose‐6‐phosphate to fructose‐2,6‐bisP
- FAO
fatty acid oxidation
- Fum
fumarate
- GAP
glyceraldehyde 3‐phosphate
- Itac
itaconate
- Lact
lactate
- LDHA
lactate dehydrogenase A
- LPS
lipopolysaccharide
- MS
Multiple Sclerosis
- NADH
nicotinamide adenine dinucleotide
- NETs
neutrophil extracellular traps
- NFAT
nuclear factor of activated T cells
- NO
nitric oxide
- OXPHOS
oxidative phosphorylation
- PD
Parkinson's disease
- PEP
phosphoenolpyruvate
- PFK‐1
6‐phosphofructokinase‐1
- PFK‐2
phosphofructo‐2‐kinase
- PPP
pentose phosphate pathway
- Pyr
pyruvate
- ROS
reactive oxygen species
- SAM
S‐adenosylmethionine
- SDH
succinate dehydrogenase
- Succ
succinate
- TCA
tricarboxylic acid
- TET
ten‐eleven translocation
- Tregs
regulatory T cells
- α‐KG
α‐ketoglutarate
Introduction
Inflammation is a protective response that occurs to defend and repair our tissues in response to an infection, tissue damage or stress [1]. An acute inflammatory response involves the coordinated delivery of blood components (plasma and leucocytes) to the target site. The recruitment of inflammatory cells from the blood, together with tissue‐resident immune cells, ensures a relatively rapid way to eliminate pathogens or contribute to healing. Importantly, the duration and the intensity of the inflammatory response is controlled by the secretion of certain extracellular factors like cytokines or lipid mediators and chemokines that attract innate and adaptive immune cells to the site of damage. A successful inflammatory response is followed by the resolution phase where the inflammatory response is gradually shut down once the danger signal or the injury has been eliminated, and this resolution phase is critical for restoring homoeostasis [2]. Under certain circumstances, the immune cells fail to switch from inflammatory to anti‐inflammatory states, and the inflammation persists over time, giving rise to chronic inflammation. Since chronic inflammation is associated with many human age‐associated pathologies [3], such as neurodegenerative, cardiovascular, bone and muscular diseases, controlling the resolution of the inflammatory response and preventing chronic inflammation must be a priority. Several complex molecular mechanisms control the switch from pro‐inflammatory to anti‐inflammatory states and, recently, the metabolism of immune cells has been pointed to be essential in this control between pro‐inflammatory and anti‐inflammatory profile.
Metabolism is the core process underlying all biological phenomena, providing energy and building blocks for macromolecules. One of the main metabolic pathways that provides energy for cellular processes is glycolysis, which comprises multiple enzymes that transform glucose into pyruvate. This pyruvate can access the tricarboxylic acid (TCA) cycle to be fully metabolized to CO2, generating NADH and reduced FADH2 to perform the oxidative phosphorylation (OXPHOS). On the other hand, pyruvate, even in the presence of oxygen, can be fermented to lactate without producing ATP but regenerating NAD+, which is commonly known as aerobic glycolysis. Despite glycolysis is much less efficient than OXPHOS, it is the metabolic pathway preferred by highly proliferating cells like cancer cells. Immune cells also undergo this metabolic reprogramming when they become activated to mount an inflammatory response. During the peak of inflammation, immune cells preferentially use glycolysis as a source of energy, whereas during the resolution phase they rely mainly on OXPHOS metabolism, acquiring a pro‐resolving phenotype [4] (Fig. 1). Thus, in recent years it has become evident that different metabolic routes determine the fate of immune cells and impact the inflammatory response.
Fig. 1.
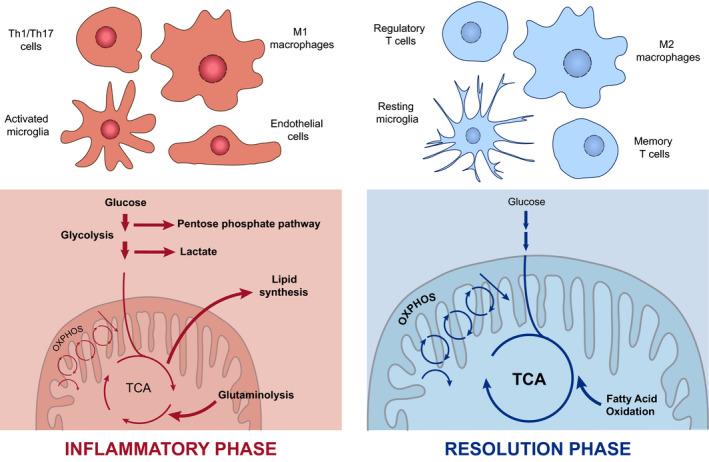
Distinctive metabolic profile of cells during the inflammatory response. Inflammatory cells such as Th1 and Th17 cells, activated microglia, endothelial cells or M1‐type macrophages are known to rely mainly on glycolysis and glutaminolysis upon inflammation, displaying a dysregulated TCA cycle and increased rate of lipid synthesis and the PPP to meet the highly biosynthetic and bioenergetic demand. Once the inflammatory response is completed, regulatory and memory T cells, resting microglia and M2‐type macrophages, which depend mostly on OXPHOS and fatty acid oxidation, are involved in the maintenance of the tissue homoeostasis to dampen the response.
The metabolic state of activated immune cells has been deeply characterized [5, 6]. During the glycolytic switch, glycolysis supplies metabolic intermediates for other biosynthetic pathways necessary for cellular growth and differentiation. In addition to glycolysis, the pentose phosphate pathway (PPP), the hexosamine pathway and the glutaminolysis are increased upon activation [7]. The cellular levels of metabolites resulting from this metabolic state determine the activation/repression of signalling pathways, the epigenetic and post‐transcriptional regulation of inflammatory genes and the post‐translational modification of proteins.
In this review, we summarize recent knowledge on how glycolysis orchestrates inflammation and how metabolic pathways control different steps of the inflammatory response, from vascular activation, leucocyte migration and expansion to the resolution phase. We finally discuss the mechanisms by which metabolism is associated with inflammation, explaining the role of different metabolites accumulated during glycolysis and the broken TCA cycle.
The glycolytic players of the inflammatory response
The inflammatory response involves the coordination of multiple players, including innate immune cells, such as neutrophils and macrophages; adaptive immune cells, mainly T lymphocytes; and vascular cells, including endothelial cells (ECs) and vascular smooth muscle cells. The classical inflammatory response progresses through two main clearly distinguished phases: initiation and resolution. The initiation phase is characterized by the sensing of the damaging agent by resident immune cells, the activation of the endothelial cells, and the clonal expansion, the proliferation and the recruitment of additional immune cells to the site of injury. The resolution phase consists in the clearance of activated immune cells, the generation of memory immune cells and the recovery of homoeostasis.
One of the first decisive steps involved in the onset of inflammation is the activation of the endothelium, which is characterized by an increase of the expression of cellular adhesion molecules such as E‐selectin, ICAM‐1 and VCAM‐1. These adhesion receptors facilitate the rolling, tethering and firm adhesion of immune cells to the vascular wall, increasing vascular permeability, promoting oedema and blushing. The activation of ECs is accomplished by the production of nitric oxide (NO), a well‐established inflammatory agent that induces an increase in vessel dilation and permeability [8]. In the steady state, ECs rely almost exclusively on glycolysis for energy generation. Their mitochondria mainly function as signalling organelles and metabolize fatty acids and glutamine for the production of TCA cycle intermediates [9, 10] and for the synthesis of dNTPs [11]. However, forcing ECs to be even more glycolytic by the overexpression of HIF‐1α, a transcription factor that regulates many genes associated with glycolysis, increases the expression of activation markers such as VCAM‐1, pro‐inflammatory cytokines such as IL‐8 and chemokines such as CCL2 [12]. The glycolytic rate in ECs is tightly controlled by 6‐phosphofructo‐2‐kinase (PFK‐2), which converts fructose‐6‐phosphate to fructose‐2,6‐bisP (F2,6BP). F2,6BP is an allosteric activator of 6‐phosphofructokinase‐1 (PFK‐1) that enhances glycolysis. Inflammatory cytokines such as VEGF, TNF‐α and IL‐6 stimulate PFK‐2 expression and activity, thus stimulating glycolysis in ECs [13]. Moreover, PFK‐2 partial inhibition reduces NF‐κB activation, resulting in repressed expression of adhesion molecules [14], pro‐inflammatory cytokines and chemokines [15]. Hence, the modulation of glycolysis in vascular cells might be a potential target to balance chronic inflammatory diseases.
The next step in the inflammatory cascade is the production and influx of neutrophils into the damaged tissue. It has been observed that granulopoiesis depends on the maintenance of mitochondrial fitness by autophagy [16]. Consequently, the disruption of autophagy by Atg7 deletion promotes a metabolic rewiring towards glycolysis in neutrophils, leading to defective differentiation [17]. Although mature neutrophils are mainly glycolytic, some examples have shown that mitochondrial respiration is also important for neutrophil transmigration. Blocking mitochondrial ATP production or mTOR activation impaired neutrophil chemotaxis [18, 19]. This suggests that both glycolysis and mitochondrial respiration could be mediating neutrophil transmigration. After transmigration, neutrophils reach the injured tissue and activate a number of antipathogen responses that include phagocytosis, degranulation, production of high levels of extracellular ROS and release of neutrophil extracellular traps (NETs). The production of extracellular ROS is mediated by the action of the membrane‐bound enzyme NADPH oxidase. Dampening glycolysis led to impaired NADPH oxidase function and subsequent deficient pathogen clearance [20, 21]. This confirms that glycolysis is essential for the microbial clearance of neutrophils. The production of NETs is also dependent on metabolism [22]. During this process, neutrophil DNA is released into the extracellular media alongside with proteases that possess antibacterial activity. The DNA nets trap the pathogen, immobilizing it and allowing the proteases to achieve their function [23]. Upon neutrophil activation, mTOR positively regulates the translation of HIF‐1α, inducing glycolytic metabolism that is essential for NETs production and bacterial killing [24, 25].
After the neutrophil influx, innate and adaptive immune cells are recruited to the injured or infected tissue. Again, the metabolic reprogramming drives both the migration and the fate of macrophages and T cells. The link between glycolysis and immune cell migration is revealed by the dual role of the mTORC1 and HIF‐1α pathways in controlling glycolytic metabolism and T‐cell trafficking. The mTORC1/HIF‐1α axis controls the expression of glucose transporters and rate‐limiting glycolytic enzymes, but also chemokine and adhesion receptors that regulate T‐cell trafficking. The mTORC1/HIF‐1α axis inhibits the expression of the adhesion molecules CD62L and CCR7, allowing the release of T cells to the blood [26, 27]. Interestingly, T‐cell migration and their metabolism are bidirectionally regulated since migratory signals may change the metabolic state of cells. Pro‐migratory stimuli upregulate glucokinase expression which provokes actin cytoskeleton rearrangements in regulatory T cells (Tregs) [28].
Dendritic cells (DCs) analyse their environment to identify pathogens through different pattern recognition receptors. Apart from antigen presentation, DCs produce cytokines, chemokines and costimulatory signals for instructing appropriate T‐cell responses. DCs, like other immune cells, undergo a metabolic switch accompanying their differentiation and activation [29, 30, 31]. The differentiation of DCs occurs with an increase of mitochondrial biogenesis and remodelling, supporting an important role of mitochondria for the development of DCs [32, 33]. DCs become active upon binding TLR agonists, which causes a marked increase in glucose consumption and lactic acid production [34, 35]. Activated DCs then increase the expression of Nos2 and, consequently, produce NO, which restricts the metabolism to glycolysis by blocking OXPHOS [36]. Inhibition of glycolysis with 2‐deoxyglucose (2‐DG) blocks both activation and differentiation of DCs [35, 37]. In contrast, glucose deprived DCs enhance T‐cell responses [38].
Similar to DCs, macrophages and T cells present different metabolism based on their activation state. Based on surface markers, genes expressed and cytokines produced, macrophages are classically classified into pro‐inflammatory or M1 macrophages [39, 40] and anti‐inflammatory or M2 macrophages [41, 42]. M1 differentiation is induced by pathogens or Th1 T cells, and their function is to kill pathogens and present antigens to T lymphocytes. In contrast, M2 macrophages are induced by anti‐inflammatory innate responses and Th2 T cells, and they play an important role in the resolution phase, producing anti‐inflammatory cytokines such as IL‐10 and dampening the production of TNF‐α and NO [42].
M1 macrophages change their metabolism upon activation, enhancing glycolysis, PPP and displaying a broken TCA cycle [43, 44, 45]. Glycolysis inhibition in M1 macrophages impairs their function by interfering with phagocytosis, ROS production and cytokine secretion [44, 46, 47]. Two of the most important signalling pathways for M1 macrophage activation are NF‐κB and Akt/mTOR [48, 49, 50, 51, 52, 53]. Akt regulates the polarization of macrophages since Akt1 inhibition promotes a M1 phenotype, whereas Akt2 deletion enhances M2 differentiation [50]. On the other hand, NF‐κB is activated in response to inflammatory signals and coordinates all macrophage pro‐inflammatory responses [48, 54]. Both NF‐κB and Akt pathways converge in the stabilization of HIF‐1α, which increases the expression of glucose transporters [55] and glycolytic enzymes to maintain the glycolytic flux [56, 57, 58]. HIF‐1α also promotes the expression of inflammatory mediators such as IL‐1β by directly binding the IL‐1β promoter [59, 60], by activating NF‐κB [54] or by activating the inflammasome through the expression of the glycolytic enzymes hexokinase‐1 [61] and PKM2 [62] in macrophages. Additionally, the metabolic switch of macrophages is controlled by the glycerol 3‐phosphate dehydrogenase (GPD2), a key component of the glycerol‐phosphate shuttle, that mediates the transport of electrons to the mitochondria. Upon lipopolysaccharide (LPS)‐induced activation, the expression and activity of the GPD2 is increased, boosting the oxidation of glucose. This enzyme is critical for macrophage function as the loss of GPD2 impairs IFN‐γ and IL‐6 secretion upon LPS activation [63].
The metabolic response in T cells follows a similar pattern to macrophages. Naïve T cells, which have a low energy demand, obtain their ATP from OXPHOS fuelled by glucose and FAO. Upon activation, effector T‐cell lymphocytes change completely their metabolism to fulfil higher energetic demand. Effector CD4+ and CD8+ T cells switch their metabolic programme towards glycolysis for faster ATP production, and they keep using the TCA cycle to produce intermediates for protein and lipid synthesis. In the first steps of the activation, TCR signalling activates PDHK1, which inhibits the pyruvate dehydrogenase, and therefore, pyruvate is metabolized into lactate [26, 64, 65] instead of entering the TCA cycle [66]. However, by using a novel C13 tracing in vivo approach, Ma et al. [67] have shown that in vivo activated CD8+ T cells use pyruvate also to fuel the TCA cycle. Similar to macrophages, different subpopulations of CD4+ T cells have distinct metabolic programmes. Effector short‐lived inflammatory populations, like Th1, Th2 and Th17 subsets, rely on glycolysis, while long‐lived T cells, like Tregs and memory T cells, preferentially use OXPHOS as a source of ATP [68, 69, 70]. Thus, blocking glycolysis with 2‐DG or galactose promotes the differentiation of activated CD4+ T cells into regulatory and memory T cells [71, 72, 73, 74, 75]. Specifically, inhibiting glycolysis with 2‐DG impairs Th1 and Th2 cells differentiation [76]. Surprisingly, limiting glycolysis does not block proliferation but cytokine production [72]. The metabolic switch of T cells is mainly controlled by the mTOR and c‐Myc signalling pathways [77, 78, 79, 80] that, upon activation, upregulate glucose transporters and glycolytic enzymes [26, 77, 81]. Inhibition of mTORC1 or mTORC2 prevents Th1 and Th2 differentiation, respectively, and simultaneous inhibition of both promotes Treg differentiation, demonstrating that mTOR is essential for effector differentiation of CD4+ [79, 82] and CD8+ T cells [83]. T cells, like macrophages, activate HIF‐1α to enable the glycolytic switch. Rapid ATP production and PPP occur when HIF‐1α is activated, increasing the biosynthetic capacity of the cell [71]. HIF‐1α is necessary for Th17 differentiation in vitro and, beyond promoting Th17 phenotype, inhibits Treg development [84, 85]. Surprisingly, Th17 differentiation in vivo in murine colitis also requires OXPHOS [86]. Eliminating mTORC1 or HIF‐1α in differentiating CD8+ cells impairs their cytolytic function [26].
At the end of the inflammatory response, both macrophages and T cells need to acquire a pro‐resolving phenotype in order to gradually shut down the inflammatory response. M2 macrophages, regulatory and memory T cells are key players in this phase. In contrast to M1 macrophages, M2 macrophages uptake fatty acids to fuel OXPHOS over glycolysis [87, 88]. M2 formation is induced by IL‐4 and IL‐13 cytokines that activate Akt, preventing the stabilization of HIF‐1α [89, 90]. The phosphoglycerate dehydrogenase, the rate‐limiting enzyme in de novo serine biosynthesis from glucose, is also required for M2 polarization [91]. In addition, M2 macrophages require glutamine to carry out their function since glutamine deprivation impairs M2 but not M1 polarization. In these cells, glutamine is required for the synthesis of UDP‐GlcNAc, an essential molecule for M2 polarization [92]. M2 macrophages still need glucose metabolism to fuel OXPHOS and FAO, since 2‐DG impairs M2 differentiation [93, 94].
In contrast to effector CD4+ T cells, Tregs and memory T cells rely on OXPHOS and FAO [95]. Disruption of OXPHOS specifically in Tregs by deletion of mitochondrial complex III causes a premature autoimmune death [96, 97]. In addition, boosting FAO enhances memory T‐cell development after stimulation [98]. Moreover, IL‐15, a cytokine that induces memory responses, promotes mitochondrial biogenesis and the expression of FAO enzymes [99], supporting that memory T cells use FAO as the principal source of ATP. This characteristic metabolism of Tregs and memory T cells biased towards OXPHOS and FAO is maintained by the AMPK and TRAF6 pathways [68, 98, 100]. Strikingly, it has been proposed that memory T cells do not uptake fatty acids but, instead, they generate them by de novo synthesis [101]. Although they depend on mitochondrial metabolism, memory T cells are capable of inducing the glycolytic switch much faster than naïve T cells [102, 103].
As mentioned, during the glycolytic switch the hexosamine pathway is enhanced, and the end product of this pathway, the UDP‐GlcNAc, serves for O‐GlcNAcylation of several proteins. Strikingly, while the O‐GlcNAcylation initiates an anti‐inflammatory response in macrophages, it triggers pro‐inflammatory effects in T cells through NF‐κB and NFAT pathways [104, 105]. Importantly, 2‐DG disturbs glycosylation of proteins and activation of the endoplasmic reticulum (ER) stress response [76]. Since some of the experiments uncovering the metabolism of immune cells are based on the use of 2‐DG, future experiments will be required to dissect the contribution of protein glycosylation or glycolysis inhibition of 2‐DG.
Neuroinflammation and glycolysis
Neuroinflammation is a common feature to most neurodegenerative diseases such as multiple sclerosis (MS), and those clearly associated with ageing like Alzheimer's disease (AD) or Parkinson's disease (PD). Several types of cells participate in the neuroinflammatory process, highlighting microglia and astrocytes. Microglia are the innate immune cells of the brain, closely related to macrophages with whom they share inflammatory signalling pathways such as the inflammasome [106]. In the resting state, microglia scan their surroundings in search of any potentially damaging agent. Upon injury, they become activated and exert a number of responses dedicated to restore homoeostasis. As it occurs with other immune cells, resting microglia mainly rely on OXPHOS and, upon activation, they switch on glycolysis and increase glucose uptake [107, 108]. Recent studies have identified several mechanisms by which glycolysis influences pro‐inflammatory gene transcription in microglia. One of these mechanisms involves the formation of advanced glycation end products (AGEs), which are modifications of proteins and lipids resulting from nonenzymatic reactions with sugars that typically accumulate during ageing [109]. Microglia express AGEs receptors which stimulate the expression of pro‐inflammatory genes [110]. Importantly, chronic or aberrant activation of microglia can amplify the underlying neurodegenerative process and worsen the disease outcome [109, 111]. A recent work by Baik et al. found that acute exposure to monomeric, oligomeric or fibrillary amyloid‐β (Aβ) was able to shift OXPHOS to glycolysis through the mTOR/HIF‐1α pathway in microglia. However, chronic exposure to Aβ had the opposite effect, turning down both glycolysis and OXPHOS, and impairing microglia responses. Interestingly, exposure to IFN‐γ activated mTOR and glycolysis, improving microglia response to Aβ and ameliorating disease signs in an AD mouse model [112]. Similarly, microglia from AD‐associated TREM‐2 alleles and from TREM‐2 knockout mice displayed decreased mTOR signalling, increased autophagy and impaired glycolysis [113]. These studies evidence the complexity of immune cell responses in vivo and how metabolic changes can induce different effects depending on the duration of the response. Importantly, glycolysis activation has also been recently found in activated microglia from MS patients [114] and actually targeting glycolysis and mitochondrial metabolism have been postulated as therapeutic options to treat MS [115]. Regarding this, neural stem cell (NSC) transplantation has been proved to show anti‐inflammatory properties in experimental models of MS [116]. This beneficial effect would be mediated by the secretion of succinate, a TCA intermediate metabolite, by mononuclear phagocytes. Extracellular succinate binds its receptor, SUCNR1/GPR91, in NSCs, triggering the production and release of prostaglandin E2, a potent anti‐inflammatory. Thereby, it impedes further entry of inflammatory monocytes into the central nervous system [117].
While microglia are the main executors of the inflammatory response in the brain, astrocytes also play a relevant role in this process. Astrocytes regulate the integrity and the permeability of the blood–brain barrier and also play a role in the control of immune cell trafficking and activation. In addition, astrocytes are immune‐competent cells able to detect danger signals, release cytokines and chemokines and activate adaptive immune defence [118]. Cumulative studies have shown that glycolysis is an important pathway in reactive astrocytes [119]. An increase in their glycolytic rate and a subsequent increase in lactate production has been observed in AD [120] and during ischaemic insult [121]. Astrocyte‐derived lactate is important for neuronal function and can actually boost memory formation [122]. Thus, activation of glycolysis by reactive astrocytes may be a mechanism to protect neurons from neuroinflammation. Recent evidences suggest that activated astrocytes also transit through different activation states. A1 astrocytes highly upregulate many classical complement cascade genes which are destructive to synapses, so they are postulated as harmful. In contrast, A2 astrocytes upregulate many neurotrophic factors, so it was hypothesized that they play a protective role during neurodegeneration [123]. A1 cells are abundant in several neurodegenerative diseases including AD, PD, Huntington's disease, amyotrophic lateral sclerosis or MS [124] as well as during normal ageing [125]. Since the discovery of A1/A2 astrocytes is very recent, whether changes in metabolic rates could have any impact on the acquisition of these phenotypes is still to be addressed.
How metabolism controls the inflammatory phenotype?
As a result of becoming glycolytic, cells accumulate certain metabolic intermediates typical of glycolysis and TCA cycle that define a specific metabolic profile. This metabolic state is characterized by an increased flux of glycolysis, high lactate production, augmented glutaminolysis, increased PPP and, in macrophages, broken TCA cycle [7]. In this scenario, the levels of several metabolites are unbalanced. In particular, phosphoenolpyruvate (PEP), succinate, citrate, itaconate, alpha‐ketoglutarate (α‐KG), lactate and 2‐hydroxyglutarate (2‐HG) have been demonstrated to impact the inflammatory state of cells. These metabolites modulate the inflammatory status by (a) activating signalling pathways, (b) promoting changes in the epigenetic landscape or (c) post‐translational mechanisms. Metabolic enzymes also can (d) post‐transcriptionally regulate the inflammatory outcome of cells (Fig. 2). Some of these metabolites, such as succinate, act through multiple of these mechanisms to modulate the inflammatory response (Fig. 3).
Fig. 2.
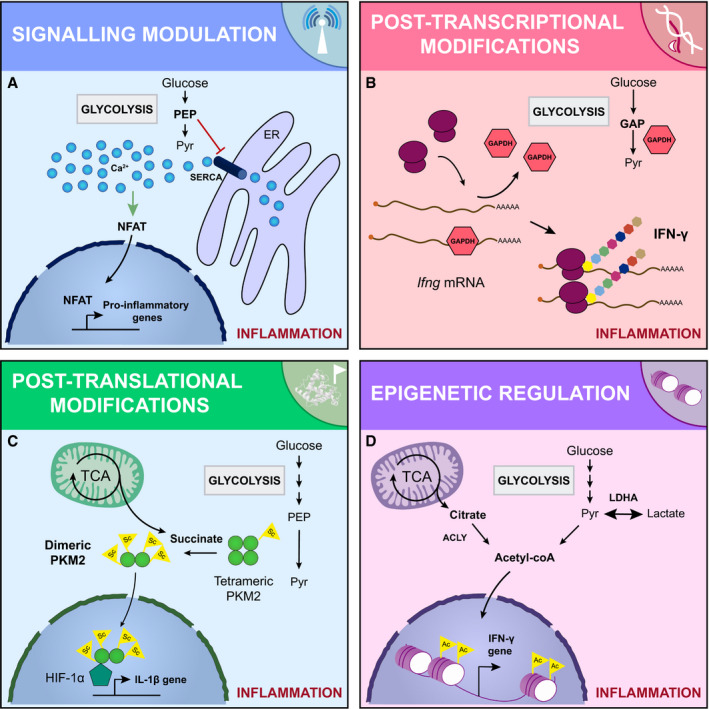
Molecular mechanisms dictating the metabolic control of the inflammatory phenotype. The metabolic signature of inflammatory cells fuels their pro‐inflammatory phenotype through different molecular mechanisms: (A) intracellular signalling events. For example, the PEP produced during glycolysis inhibits the ER calcium channel SERCA. The cytosolic calcium concentration is then increased, activating NFAT, which drives the expression of pro‐inflammatory genes. (B) Sophisticated post‐transcriptional modifications. Some glycolytic enzymes have a dual role and can act as RNA binding proteins. For example, GAPDH interacts with Ifng mRNA blocking its translation. When the glycolytic demand is high, GAPDH is required for glycolysis and the Ifng mRNA is released and translated, increasing the IFN‐γ secretion. (C) Post‐translational modifications. Certain metabolites can post‐translationally modify proteins. For example, succinate is accumulated in the cytosol of activated cells, resulting in the addition of succinyl groups to the glycolytic enzyme PKM2, which loses its tetrameric conformation. The hypersuccinylated dimeric PKM2 enters the nucleus and complex with HIF‐1α, enhancing the expression of the pro‐inflammatory cytokine IL‐1β. (D) Changes in the epigenome. The function of epigenetic remodelers is tightly modulated by the levels of certain metabolites. For example, upon activation, the intracellular levels of acetyl‐CoA are increased. The acetyl‐CoA is then used to acetylate histones enhancing the expression of pro‐inflammatory cytokines. GAP, glyceraldehyde 3‐phosphate; Pyr, pyruvate.
Fig. 3.
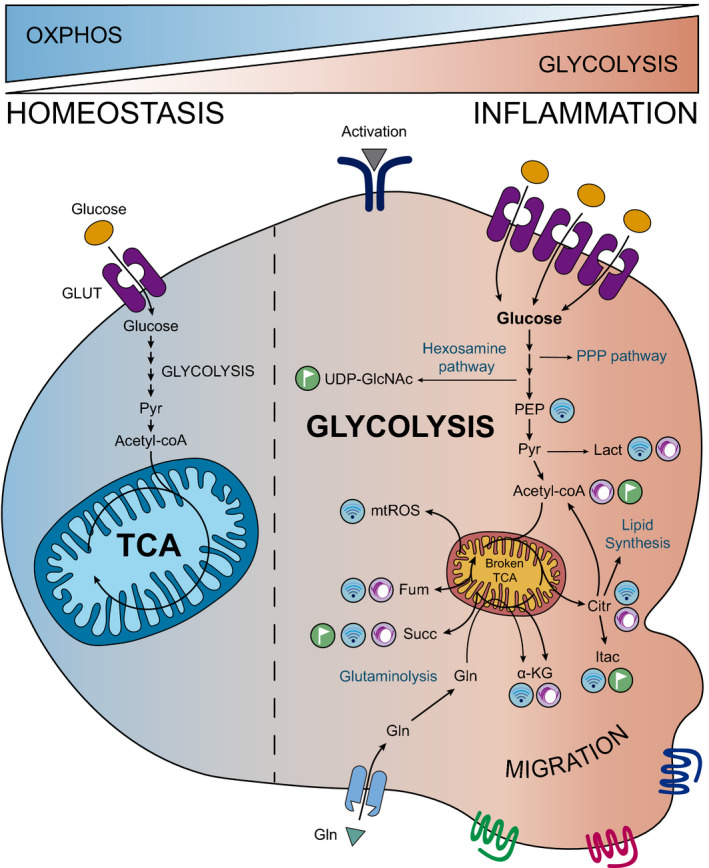
Glycolysis orchestrates the behaviour of inflammatory cells. Upon inflammation, immune cells are reprogrammed towards glycolysis, enhancing this pathway at the expense of OXPHOS and, in macrophages, disbalancing the TCA cycle. As a consequence, glycolysis and broken TCA cycle‐released metabolites such as lactate, citrate or succinate accumulate in immune cells promoting signalling, post‐translational and epigenetic modifications which drive the inflammatory response. Moreover, glycolytic intermediates fuel other pathways such as the PPP, which provides biosynthetic molecules, and the hexosamine one, which generates UDP‐GlcNAc for glycation reactions. Citr, citrate; Fum, fumarate; Gln, glutamine; Itac, itaconate; Lact, lactate; Pyr, pyruvate; Succ, succinate.
Signalling pathways regulated by metabolites
Phosphoenolpyruvate is generated during glycolysis by the enolase‐1 and is accumulated in T cells upon activation [126]. PEP contributes to inflammation by interfering with Ca2+ signalling. When T cells are stimulated through the TCR, Ca2+ enters from the extracellular space and triggers signalling pathways in the lymphocyte. PEP inhibits the ER calcium channel SERCA, avoiding Ca2+ flux to the ER. Consequently, Ca2+ levels increase in the cytoplasm, prolonging TCR signalling and activating the NFAT [127]. PEP accumulation has a similar pro‐inflammatory action on macrophages, promoting M1 polarization and increasing pro‐inflammatory cytokine expression [128]. The final product of glycolysis, lactate, is now known to display signalling properties during inflammation [129, 130, 131]. In this sense, lactate suppresses the immune response by impairing the metabolic reprogramming towards pro‐inflammatory phenotypes and by blocking pro‐inflammatory signalling pathways in monocytes, macrophages and DCs [132, 133, 134, 135]. Lactic acid accumulation in DCs drives the switch to an anti‐inflammatory phenotype by decreasing activation and increasing IL‐10 secretion [136]. Furthermore, it inhibits T‐cell migration [137] as well as CD8+ T‐cell survival and cytotoxic activity by inhibiting rate‐limiting glycolytic enzymes [137]. In addition, lactate also promotes the expansion of the Treg subpopulation [138]. However, it has been reported that lactate‐enriched environments enhance Th17 responses [137] and NF‐κB‐dependent pro‐inflammatory activities in macrophages [139]. In ECs, lactate is capable of entering the cells, stimulating the NF‐κB/IL‐8 pathway and inducing ROS production [140] (Table 1).
Table 1.
Metabolites accumulated in inflammatory cells impact the inflammatory pathways through different molecular mechanisms, including intracellular signalling events (indicated in blue), post‐translational (in orange) or epigenetic (in purple) mechanisms.
| Metabolite | Mechanism | Cell type | Reference |
|---|---|---|---|
| Phosphoenolpyruvate (PEP) | Increased cytosolic Ca2+ | T cells | [127] |
| Pro‐inflammatory cytokine expression (M1 polarization) | Macrophages | [128] | |
| Lactate (Lact) | Multiple blockade of the immune response | Monocytes, macrophages, DCs, NK cells, T cells | [132, 133, 134, 135] |
| Th17 responses | T cells | [137] | |
| TLR4/NF‐κB activation | Macrophages | [139] | |
| NF‐κB/IL‐8 activation | Endothelial cells | [140] | |
| Histone lactylation (M2 polarization) | Macrophages | [177] | |
| Acetate/Acetyl‐CoA | GAPDH acetylation | Memory CD8+ T cells | [162] |
| Histone acetylation (Th1 responses) | Macrophages | [178, 179, 182] | |
| Citrate (Citr) | ROS, NO, PGs | Macrophages | [149, 181] |
| Itaconate (Itac) | SDH inhibition | Macrophages | [154] |
| Keap1 alkylation (Nrf2 activation) | Macrophages | [156] | |
| α‐Ketoglutarate (α‐KG) | mTORC1 activation (Th1 responses) | T cells | [158] |
| Histone demethylation (M2 polarization) | Macrophages | [186] | |
| DNA methylation modification (Th1 responses) | T cells | [187] | |
| 2‐Hydroxyglutarate (2‐HG) | Histone and DNA methylation | T cells | [188, 189] |
| Succinate (Succ) | HIF‐1α stabilization (M1 polarization) | Macrophages | [60] |
| Protein succinylation | Macrophages | [144, 169] | |
| DNA methylase inhibition | T regulatory cells | [96] | |
| Fumarate (Fum) | Keap1 modification (Nrf2 activation) | Microglia, DCs, T cells | [163, 164, 165, 166] |
| Demethylase inhibition | Monocytes | [184] | |
| S‐adenosylmethionine (SAM) | Histone methylation | Macrophages, T cells | [190, 191] |
One of the metabolites accumulated as a consequence of the broken TCA cycle and high glutaminolysis is succinate. Succinate accumulates in macrophages both upon LPS exposure or in the synovium in rheumatoid arthritis [141]. Succinate accumulation leads to M1 polarization of macrophages by direct inhibition of the prolyl hydrolase, resulting in the stabilization of HIF‐1α and IL‐1β secretion [60, 142]. Succinate also limits the production of the anti‐inflammatory cytokine IL‐10 [143]. Some metabolites can act as extracellular signalling molecules. Inflammatory pathways can be modulated by the extracellular succinate levels through the binding to its receptor SUCNR1 [144]. Interestingly, both pro‐ and anti‐inflammatory effects can be mediated by SUCNR1. As mentioned, extracellular succinate triggers the production of the anti‐inflammatory prostaglandin E2 in NSCs [117]. In addition, SUCNR1 deletion in myeloid cells promoted a local pro‐inflammatory phenotype in adipose tissue, demonstrating that succinate triggers an anti‐inflammatory effect in adipose‐tissue‐resident macrophages [145]. In contrast, extracellular succinate causes a pro‐inflammatory effect in different immune cells [146], increasing the migration and the secretion of the pro‐inflammatory cytokines TNF‐α and IL‐1β in DCs and macrophages. In addition, upon DC presentation, succinate improves the production of IFN‐γ and TNF‐α in T cells without exerting a direct effect [147, 148].
Another metabolite that plays a signalling role and is implicated in defining the inflammatory state of cells is citrate, which accumulates in LPS‐stimulated macrophages [60, 92]. Citrate is generated during the TCA cycle in the mitochondria and is exported by the citrate carrier (CIC) to the cytosol, where it is required for fatty acid synthesis. Once in the cytoplasm, citrate is metabolized by the ATP‐citrate lyase (ACLY) to acetyl‐CoA and oxaloacetate, precursors for lipid synthesis, ROS and NO. Reducing cytoplasmic citrate levels by deletion of CIC decreases the production of ROS, NO and prostaglandins, impairing the pro‐inflammatory differentiation of cells and highlighting the importance that the different subcellular localization of certain metabolites has in the inflammatory response [149].
Itaconate is a metabolite derived from citrate that has been intensively studied due to its antibacterial properties [150]. Citrate can be transformed into cis‐aconitate, which exits the mitochondria and is decarboxylated to itaconate. Itaconate is accumulated during the broken TCA cycle in M1 macrophages [150, 151]. Interestingly, the absence of endogenous itaconate by genetic deletion of Igr1 causes an increased production of pro‐inflammatory cytokines [152]. In fact, despite itaconate is increased in macrophages upon LPS activation, it is considered as an anti‐inflammatory metabolite [152, 153]. Itaconate triggers two different anti‐inflammatory signalling effects in cells. Itaconate directly inhibits succinate dehydrogenase (SDH), stopping the pro‐inflammatory signals from succinate dehydrogenation [154]. In addition, itaconate has been recently proved to activate the transcription factors Nrf2 and ATF3 in macrophages, repressing pro‐inflammatory genes [155]. Knowledge about itaconate needs to be carefully interpreted since some studies have used itaconate derivatives instead of itaconate, such as dimethyl itaconate [153, 155, 156], which may trigger different effects in cells [157]. α‐KG results from glutamine anaplerosis and is accumulated upon IL‐2 signalling in Th1 CD4+ and CD8+ cells, increasing Th1 differentiation through mTORC1 activation. In addition, glutamine deprivation or α‐KG limitation, have been shown to favour in vitro Treg differentiation, even under Th1 stimulating conditions [158].
Post‐transcriptional regulation driven by glycolytic enzymes
In the last years, growing evidence supports that glycolytic enzymes can act as post‐transcriptional regulators of inflammatory genes. Pioneer work from the Pearce lab revealed that the classical glycolytic enzyme GAPDH is able to bind mRNA. In the naïve state of CD4+ T cells, GAPDH binds IFN‐γ and IL‐2 mRNA, inhibiting their translation. Therefore, when glycolysis is incremented, GAPDH releases these mRNAs to catabolize substrates, allowing the translation of these inflammatory cytokines [72]. In monocytes, GAPDH carries out a similar regulatory function with TNF‐α mRNA [159]. Accordingly, in a wide proteomic approach, glycolytic enzymes (such as GAPDH, pyruvate kinase, lactate dehydrogenase, enolase and aldolase) and enzymes involved in the TCA cycle and lipid synthesis were identified as mRNA binding proteins [160].
The enolase‐1 is codified by the gene ENO1, which encodes different transcripts besides the enolase‐1 mRNA. One of them is a noncoding RNA that specifically binds the promoter region of FoxP3, a master regulator of Tregs. This noncoding RNA impacts the splicing of FoxP3. Therefore, upon T‐lymphocyte activation, the expression of ENO1 is enhanced to fulfil the glycolytic flux and the functional isoform of FoxP3 is repressed, thus inhibiting Treg differentiation [161].
Besides its metabolic function, PKM2 can enter into the nucleus controlling the transcription of certain pro‐inflammatory genes. Upon LPS activation, PKM2 interacts with HIF‐1α, and this complex can directly bind and activate the IL‐1β promoter in bone marrow‐derived macrophages (BMDMs) [58].
Post‐translational modification of proteins
Some metabolites that accumulate in pro‐inflammatory cells can dictate post‐translational modifications of proteins such as acetylations, succinylations or lactylations. These post‐translational modifications can affect the epigenetic landscape but also other different proteins related to inflammation. The levels of acetyl‐CoA determine the acetylation of several different proteins for instance histones, tubulin or p53, but also metabolic enzymes such as GAPDH. CD8+ memory T cells uptake acetate in vitro and metabolize it into acetyl‐CoA, which in turn is used to acetylate GAPDH. This acetylation increases GAPDH function, improving the glycolytic flux and increasing IFN‐γ production [162]. Itaconate also alters protein function by inducing post‐translational modifications. Itaconate directly alkylates cysteine residues of the KEAP1 protein. KEAP1 is usually associated with Nrf2 and promotes its degradation, but alkylation of KEAP1 permits Nrf2 function, enhancing the expression of antioxidant and anti‐inflammatory genes [156]. Regarding Nrf2 function, a fumarate derivate, dimethyl fumarate, activates Nrf2 by modifying KEAP1 in a similar way to itaconate. This modification reduces microglial activation, DC maturation and T‐cell activation [163, 164, 165, 166]. The accumulation of succinate produces succinylation of proteins [167, 168]. Succinyl groups can be added to lysines, neutralizing lysine positive charges and thereby likely resulting in conformational changes [167]. Succinylation could be a mechanism for maintaining glycolysis since several glycolytic enzymes have been found succinylated in macrophages activated with LPS [144]. In fact, succinylation of PKM2 increases IL‐1β production in LPS‐activated BMDMs [169].
Epigenetics
Epigenetics controls gene expression in several important biological processes, including inflammation [170, 171]. The function of epigenetic remodelers is tightly modulated by the levels of metabolic intermediates and cofactors [172, 173]. Additionally, metabolic programmes can determine the epigenetic signature through the control of the NAD+/NADH balance [174, 175, 176]. One quintessential example is the role of sirtuins, histone deacetylases whose epigenetic function requires NAD+. Therefore, metabolism can impact gene expression by regulating cellular metabolites required for epigenetic modifications or by affecting epigenetic remodelers.
Very recently, lactate has been shown to lactylate histones and modify gene expression. Zhang et al. showed that lactate accumulation promotes the expression of M2‐characteristic genes during M1 BMDM polarization. After the first hours of macrophages exposure to bacteria, lactate promoted the lactylation of histones, initiating the expression of homoeostatic genes that have been traditionally associated with M2‐like macrophages [177]. Thus, lactate could lead a feedback mechanism to drive macrophages to an anti‐inflammatory outcome for the resolution phase. In addition, deletion of lactate dehydrogenase A (LDHA), which catalyses the interconversion between pyruvate and lactate, causes a decrease of IFN‐γ expression in T cells [178]. Surprisingly, LDHA controls the expression of IFN‐γ by modulating the acetyl‐CoA pool, which serves as a donor for histone acetylation [179, 180]. In CD4+ T cells, acetyl‐CoA is used for histone acetylation in the IFN‐γ promoter, promoting the differentiation towards Th1 subsets [178, 179]. Both citrate and acetyl‐CoA levels impact the inflammatory state of macrophages, T cells and microglia through epigenetic modifications. Reducing the acetyl‐CoA pool by ACLY deletion decreases the expression of glycolytic enzymes such as hexokinase‐2, PKF‐1 and LDHA [181]. Increasing acetyl‐CoA levels by acetate supplementation rescued this silencing [182]. In low‐glucose conditions, acetate is taken up and converted into acetyl‐CoA in CD8+ T cells modifying the epigenetic landscape and increasing IFN‐γ production [183]. Moreover, the levels of succinate influence the epigenetic state of cells through DNA modifications. Succinate inhibits the ten‐eleven translocation (TET) family of DNA methylases in Tregs, blocking expression of suppressive genes but without altering cell proliferation [96].
Another metabolite implicated in epigenetic regulation is fumarate. In monocytes that have been stimulated with β‐glucan, a second stimulation with LPS has been shown to trigger a more efficient response. This immunological training of monocytes is explained by an increase of fumarate levels upon β‐glucan stimulation. Fumarate decreases the activity of KDM5 demethylases, enabling the expression of genes involved in the immune response and the migration of leucocytes [184]. Therefore, altering metabolism is a way to improve innate immune training that acts through epigenetic modifications.
Furthermore, α‐KG is a cosubstrate for the histone demethylases family JmjC [185]. α‐KG accumulation induces M2 polarization in BMDMs through histone demethylation of M2‐specific genes, resulting in the expression of anti‐inflammatory molecules [186]. However, α‐KG seems to cause the opposite effect in T cells. This metabolite is accumulated after IL‐2 signalling and favours Th1 differentiation, increasing the expression of pro‐inflammatory and glycolytic genes by modifying DNA methylation [187]. 2‐HG is a structural analogue of α‐KG and acts as a competitive inhibitor of α‐KG‐dependent histone demethylases, promoting histone hypermethylation. 2‐HG is accrued upon activation or hypoxia and promotes histone and DNA hypermethylation through the inhibition of Utx and Tet2, respectively. 2‐HG increases the expression of CD62L and CD127, differentiating T cells to memory cells [188, 189]. Upon activation, glucose‐derived ribose and one‐carbon metabolism converges in the generation and accumulation of S‐adenosylmethionine (SAM) in macrophages and T cells. The production of SAM maintains a high SAM/S‐adenosylhomocysteine ratio that allows the trimethylation of histones, increasing the expression of pro‐inflammatory genes like IL‐1β in LPS‐stimulated macrophages. Consequently, impairment of SAM production promotes an anti‐inflammatory phenotype in macrophages both in vitro and in vivo [190]. SAM also controls T‐cell phenotype by modifying certain epigenetic marks. Decrease of SAM production by methionine restriction impairs T‐cell proliferation and cytokine production in both in vitro and in vivo experiments. SAM restricted T cells showed reduced histone trimethylation and limited Th17 expansion in an EAE model [191].
Given that different metabolites can simultaneously influence cell epigenetics and that each metabolite can modulate the inflammatory status by different mechanisms, it must be considered that the ratio between metabolites will determine the final inflammatory outcome (Fig. 3).
Concluding remarks
A growing body of evidence has accumulated supporting the immunomodulatory properties of glycolysis and TCA cycle‐released metabolites during inflammatory processes. Molecules such as succinate, citrate or lactate, which were at first thought to be mere by‐products of cellular metabolism, are now regarded as paramount signalling, post‐transcriptional, post‐translational or epigenetic modulators that dictate the inflammatory response. In the light of the studies about immunometabolism, it is clear that immune cells adapt their metabolism to maintain or change their inflammatory phenotype. However, very recent findings point to a metabolic switch as a result and not as a cause of inflammation [192]. Inflammatory processes are a common feature to many age‐associated diseases, such as cardiovascular and neurodegenerative disorders. The finding that immunometabolism could be a master regulator of inflammation broadens the avenue for treating inflammation‐related pathologies through the manipulation of the vascular and immune cell metabolism. Therefore, increased understanding of the metabolic pathways in inflammatory cells could be exploited therapeutically to dampen exacerbated inflammatory responses.
Conflict of interest
The authors declare no conflict of interest.
Author contributions
All authors listed have made a substantial, direct and intellectual contribution to the work.
Acknowledgements
We thank Dr E. Carrasco for helpful ideas and comments on the manuscript. This work was supported by the H2020‐EU.1.1, European Research Council (ERC‐2016‐StG 715322‐EndoMitTalk), and Fondo de Investigación Sanitaria del Instituto de Salud Carlos III (PI16/188, PI19/855), Fondo Europeo de Desarrollo Regional (FEDER). GS‐H was funded by a FPI‐UAM grant (Universidad Autónoma de Madrid). MMGH was funded by ERC. EG‐R was funded by a Juan de la Cierva grant (IJC2018‐036850‐I; Universidad Autónoma de Madrid). JO was funded by a Juan de la Cierva grant (FJCI‐2017‐33855; Universidad Autónoma de Madrid). M.M. was supported by the Miguel Servet programme from the Instituto de Salud Carlos III (Fundación de Investigación del Hospital 12 de Octubre).
Gonzalo Soto‐Heredero and Manuel M. Gómez de las Heras contributed equally to this article
References
- 1. Medzhitov R (2008) Origin and physiological roles of inflammation. Nature 454, 428–435. [DOI] [PubMed] [Google Scholar]
- 2. Schett G & Neurath MF (2018) Resolution of chronic inflammatory disease: universal and tissue‐specific concepts. Nat Commun 9, 3261. [DOI] [PMC free article] [PubMed] [Google Scholar]
- 3. Furman D, Campisi J, Verdin E, Carrera‐Bastos P, Targ S, Franceschi C, Ferrucci L, Gilroy DW, Fasano A, Miller GW et al (2019) Chronic inflammation in the etiology of disease across the life span. Nat Med 25, 1822–1832. [DOI] [PMC free article] [PubMed] [Google Scholar]
- 4. Puleston DJ, Villa M & Pearce EL (2017) Ancillary activity: beyond core metabolism in immune cells. Cell Metab 26, 131–141. [DOI] [PMC free article] [PubMed] [Google Scholar]
- 5. Pearce EL, Poffenberger MC, Chang C‐H & Jones RG (2013) Fueling immunity: insights into metabolism and lymphocyte function. Science 342, 1242454.24115444 [Google Scholar]
- 6. Mills EL, Kelly B & O'Neill LAJ (2017) Mitochondria are the powerhouses of immunity. Nat Immunol 18, 488–498. [DOI] [PubMed] [Google Scholar]
- 7. O'Neill LAJ (2015) A broken krebs cycle in macrophages. Immunity 42, 393–394. [DOI] [PubMed] [Google Scholar]
- 8. Bogdan C (2001) Nitric oxide and the immune response. Nat Immunol 2, 907–916. [DOI] [PubMed] [Google Scholar]
- 9. Huang H, Vandekeere S, Kalucka J, Bierhansl L, Zecchin A, Brüning U, Visnagri A, Yuldasheva N, Goveia J, Cruys B et al (2017) Role of glutamine and interlinked asparagine metabolism in vessel formation. EMBO J 36, 2334–2352. [DOI] [PMC free article] [PubMed] [Google Scholar]
- 10. Kim B, Li J, Jang C & Arany Z (2017) Glutamine fuels proliferation but not migration of endothelial cells. EMBO J 36, 2321–2333. [DOI] [PMC free article] [PubMed] [Google Scholar]
- 11. Schoors S, Bruning U, Missiaen R, Queiroz KCS, Borgers G, Elia I, Zecchin A, Cantelmo AR, Christen S, Goveia J et al (2015) Fatty acid carbon is essential for dNTP synthesis in endothelial cells. Nature 520, 192–197. [DOI] [PMC free article] [PubMed] [Google Scholar]
- 12. Wu D, Huang R‐T, Hamanaka RB, Krause M, Oh M‐J, Kuo C‐H, Nigdelioglu R, Meliton AY, Witt L, Dai G et al (2017) HIF‐1α is required for disturbed flow‐induced metabolic reprogramming in human and porcine vascular endothelium. Elife 6, 1–26. [DOI] [PMC free article] [PubMed] [Google Scholar]
- 13. Xu Y, An X, Guo X, Habtetsion TG, Wang Y, Xu X, Kandala S, Li Q, Li H, Zhang C et al (2014) Endothelial PFKFB3 plays a critical role in angiogenesis. Arterioscler Thromb Vasc Biol 34, 1231–1239. [DOI] [PMC free article] [PubMed] [Google Scholar]
- 14. Cantelmo AR, Conradi L‐C, Brajic A, Goveia J, Kalucka J, Pircher A, Chaturvedi P, Hol J, Thienpont B, Teuwen L‐A et al (2016) Inhibition of the glycolytic activator PFKFB3 in endothelium induces tumor vessel normalization, impairs metastasis, and improves chemotherapy. Cancer Cell 30, 968–985. [DOI] [PMC free article] [PubMed] [Google Scholar]
- 15. Zhang R, Li R, Liu Y, Li L & Tang Y (2019) The glycolytic enzyme PFKFB3 controls TNF‐α‐induced endothelial proinflammatory responses. Inflammation 42, 146–155. [DOI] [PubMed] [Google Scholar]
- 16. Palikaras K, Lionaki E & Tavernarakis N (2018) Mechanisms of mitophagy in cellular homeostasis, physiology and pathology. Nat Cell Biol 20, 1013–1022. [DOI] [PubMed] [Google Scholar]
- 17. Riffelmacher T, Clarke A, Richter FC, Stranks A, Pandey S, Danielli S, Hublitz P, Yu Z, Johnson E, Schwerd T et al (2017) Autophagy‐dependent generation of free fatty acids is critical for normal neutrophil differentiation. Immunity 47, 466–480.e5. [DOI] [PMC free article] [PubMed] [Google Scholar]
- 18. Bao Y, Ledderose C, Graf AF, Brix B, Birsak T, Lee A, Zhang J & Junger WG (2015) mTOR and differential activation of mitochondria orchestrate neutrophil chemotaxis. J Cell Biol 210, 1153–1164. [DOI] [PMC free article] [PubMed] [Google Scholar]
- 19. Zhou W, Cao L, Jeffries J, Zhu X, Staiger CJ & Deng Q (2018) Neutrophil‐specific knockout demonstrates a role for mitochondria in regulating neutrophil motility in zebrafish. Dis Model Mech 11, dmm033027. [DOI] [PMC free article] [PubMed] [Google Scholar]
- 20. Jun HS, Lee YM, Cheung YY, McDermott DH, Murphy PM, De Ravin SS, Mansfield BC & Chou JY (2010) Lack of glucose recycling between endoplasmic reticulum and cytoplasm underlies cellular dysfunction in glucose‐6‐phosphatase‐beta‐deficient neutrophils in a congenital neutropenia syndrome. Blood 116, 2783–2792. [DOI] [PMC free article] [PubMed] [Google Scholar]
- 21. Baillet A, Hograindleur M‐A, El Benna J, Grichine A, Berthier S, Morel F & Paclet M‐H (2017) Unexpected function of the phagocyte NADPH oxidase in supporting hyperglycolysis in stimulated neutrophils: key role of 6‐phosphofructo‐2‐kinase. FASEB J 31, 663–673. [DOI] [PubMed] [Google Scholar]
- 22. Branzk N, Lubojemska A, Hardison SE, Wang Q, Gutierrez MG, Brown GD & Papayannopoulos V (2014) Neutrophils sense microbe size and selectively release neutrophil extracellular traps in response to large pathogens. Nat Immunol 15, 1017–1025. [DOI] [PMC free article] [PubMed] [Google Scholar]
- 23. Papayannopoulos V, Metzler KD, Hakkim A & Zychlinsky A (2010) Neutrophil elastase and myeloperoxidase regulate the formation of neutrophil extracellular traps. J Cell Biol 191, 677–691. [DOI] [PMC free article] [PubMed] [Google Scholar]
- 24. McInturff AM, Cody MJ, Elliott EA, Glenn JW, Rowley JW, Rondina MT & Yost CC (2012) Mammalian target of rapamycin regulates neutrophil extracellular trap formation via induction of hypoxia‐inducible factor 1 α. Blood 120, 3118–3125. [DOI] [PMC free article] [PubMed] [Google Scholar]
- 25. Amini P, Stojkov D, Felser A, Jackson CB, Courage C, Schaller A, Gelman L, Soriano ME, Nuoffer J‐M, Scorrano L et al (2018) Neutrophil extracellular trap formation requires OPA1‐dependent glycolytic ATP production. Nat Commun 9, 2958. [DOI] [PMC free article] [PubMed] [Google Scholar]
- 26. Finlay DK, Rosenzweig E, Sinclair LV, Feijoo‐Carnero C, Hukelmann JL, Rolf J, Panteleyev AA, Okkenhaug K & Cantrell DA (2012) PDK1 regulation of mTOR and hypoxia‐inducible factor 1 integrate metabolism and migration of CD8+ T cells. J Exp Med 209, 2441–2453. [DOI] [PMC free article] [PubMed] [Google Scholar]
- 27. Miska J, Lee‐Chang C, Rashidi A, Muroski ME, Chang AL, Lopez‐Rosas A, Zhang P, Panek WK, Cordero A, Han Y et al (2019) HIF‐1α is a metabolic switch between glycolytic‐driven migration and oxidative phosphorylation‐driven immunosuppression of Tregs in glioblastoma. Cell Rep 27, 226–237.e4. [DOI] [PMC free article] [PubMed] [Google Scholar]
- 28. Kishore M, Cheung KCP, Fu H, Bonacina F, Wang G, Coe D, Ward EJ, Colamatteo A, Jangani M, Baragetti A et al (2017) Regulatory T cell migration is dependent on glucokinase‐mediated glycolysis. Immunity 47, 875–889.e10. [DOI] [PMC free article] [PubMed] [Google Scholar]
- 29. Kelly B & O'Neill LAJ (2015) Metabolic reprogramming in macrophages and dendritic cells in innate immunity. Cell Res 25, 771–784. [DOI] [PMC free article] [PubMed] [Google Scholar]
- 30. Pearce EJ & Everts B (2015) Dendritic cell metabolism. Nat Rev Immunol 15, 18–29. [DOI] [PMC free article] [PubMed] [Google Scholar]
- 31. He Z, Zhu X, Shi Z, Wu T & Wu L (2019) Metabolic regulation of dendritic cell differentiation. Front Immunol 10, 410. [DOI] [PMC free article] [PubMed] [Google Scholar]
- 32. Zaccagnino P, Saltarella M, Maiorano S, Gaballo A, Santoro G, Nico B, Lorusso M & Del Prete A (2012) An active mitochondrial biogenesis occurs during dendritic cell differentiation. Int J Biochem Cell Biol 44, 1962–1969. [DOI] [PubMed] [Google Scholar]
- 33. Ryu S‐W, Han EC, Yoon J & Choi C (2015) The mitochondrial fusion‐related proteins Mfn2 and OPA1 are transcriptionally induced during differentiation of bone marrow progenitors to immature dendritic cells. Mol Cells 38, 89–94. [DOI] [PMC free article] [PubMed] [Google Scholar]
- 34. Krawczyk CM, Holowka T, Sun J, Blagih J, Amiel E, DeBerardinis RJ, Cross JR, Jung E, Thompson CB, Jones RG et al (2010) Toll‐like receptor‐induced changes in glycolytic metabolism regulate dendritic cell activation. Blood 115, 4742–4749. [DOI] [PMC free article] [PubMed] [Google Scholar]
- 35. Everts B, Amiel E, Huang SC‐C, Smith AM, Chang C‐H, Lam WY, Redmann V, Freitas TC, Blagih J, van der Windt GJW et al (2014) TLR‐driven early glycolytic reprogramming via the kinases TBK1‐IKKɛ supports the anabolic demands of dendritic cell activation. Nat Immunol 15, 323–332. [DOI] [PMC free article] [PubMed] [Google Scholar]
- 36. Everts B, Amiel E, van der Windt GJW, Freitas TC, Chott R, Yarasheski KE, Pearce EL & Pearce EJ (2012) Commitment to glycolysis sustains survival of NO‐producing inflammatory dendritic cells. Blood 120, 1422–1431. [DOI] [PMC free article] [PubMed] [Google Scholar]
- 37. Kratchmarov R, Viragova S, Kim MJ, Rothman NJ, Liu K, Reizis B & Reiner SL (2018) Metabolic control of cell fate bifurcations in a hematopoietic progenitor population. Immunol Cell Biol 96, 863–871. [DOI] [PMC free article] [PubMed] [Google Scholar]
- 38. Lawless SJ, Kedia‐Mehta N, Walls JF, McGarrigle R, Convery O, Sinclair LV, Navarro MN, Murray J & Finlay DK (2017) Glucose represses dendritic cell‐induced T cell responses. Nat Commun 8, 15620. [DOI] [PMC free article] [PubMed] [Google Scholar]
- 39. Gordon S & Plüddemann A (2017) Tissue macrophages: heterogeneity and functions. BMC Biol 15, 53. [DOI] [PMC free article] [PubMed] [Google Scholar]
- 40. Murray PJ & Wynn TA (2011) Protective and pathogenic functions of macrophage subsets. Nat Rev Immunol 11, 723–737. [DOI] [PMC free article] [PubMed] [Google Scholar]
- 41. Stein M, Keshav S, Harris N & Gordon S (1992) Interleukin 4 potently enhances murine macrophage mannose receptor activity: a marker of alternative immunologic macrophage activation. J Exp Med 176, 287–292. [DOI] [PMC free article] [PubMed] [Google Scholar]
- 42. Doyle AG, Herbein G, Montaner LJ, Minty AJ, Caput D, Ferrara P & Gordon S (1994) Interleukin‐13 alters the activation state of murine macrophages in vitro: comparison with interleukin‐4 and interferon‐gamma. Eur J Immunol 24, 1441–1445. [DOI] [PubMed] [Google Scholar]
- 43. Fukuzumi M, Shinomiya H, Shimizu Y, Ohishi K & Utsumi S (1996) Endotoxin‐induced enhancement of glucose influx into murine peritoneal macrophages via GLUT1. Infect Immun 64, 108–112. [DOI] [PMC free article] [PubMed] [Google Scholar]
- 44. Freemerman AJ, Johnson AR, Sacks GN, Milner JJ, Kirk EL, Troester MA, Macintyre AN, Goraksha‐Hicks P, Rathmell JC & Makowski L (2014) Metabolic reprogramming of macrophages: glucose transporter 1 (GLUT1)‐mediated glucose metabolism drives a proinflammatory phenotype. J Biol Chem 289, 7884–7896. [DOI] [PMC free article] [PubMed] [Google Scholar]
- 45. Haschemi A, Kosma P, Gille L, Evans CR, Burant CF, Starkl P, Knapp B, Haas R, Schmid JA, Jandl C et al (2012) The sedoheptulose kinase CARKL directs macrophage polarization through control of glucose metabolism. Cell Metab 15, 813–826. [DOI] [PMC free article] [PubMed] [Google Scholar]
- 46. Michl J, Ohlbaum DJ & Silverstein SC (1976) 2‐Deoxyglucose selectively inhibits Fc and complement receptor‐mediated phagocytosis in mouse peritoneal macrophages II. Dissociation of the inhibitory effects of 2‐deoxyglucose on phagocytosis and ATP generation. J Exp Med 144, 1484–1493. [DOI] [PMC free article] [PubMed] [Google Scholar]
- 47. Pavlou S, Wang L, Xu H & Chen M (2017) Higher phagocytic activity of thioglycollate‐elicited peritoneal macrophages is related to metabolic status of the cells. J Inflamm (Lond) 14, 4. [DOI] [PMC free article] [PubMed] [Google Scholar]
- 48. Blouin CC, Pagé EL, Soucy GM & Richard DE (2004) Hypoxic gene activation by lipopolysaccharide in macrophages: implication of hypoxia‐inducible factor 1alpha. Blood 103, 1124–1130. [DOI] [PubMed] [Google Scholar]
- 49. van Uden P, Kenneth NS & Rocha S (2008) Regulation of hypoxia‐inducible factor‐1alpha by NF‐kappaB. Biochem J 412, 477–484. [DOI] [PMC free article] [PubMed] [Google Scholar]
- 50. Arranz A, Doxaki C, Vergadi E, Martinez de la Torre Y, Vaporidi K, Lagoudaki ED, Ieronymaki E, Androulidaki A, Venihaki M, Margioris AN et al (2012) Akt1 and Akt2 protein kinases differentially contribute to macrophage polarization. Proc Natl Acad Sci USA 109, 9517–9522. [DOI] [PMC free article] [PubMed] [Google Scholar]
- 51. Byles V, Covarrubias AJ, Ben‐Sahra I, Lamming DW, Sabatini DM, Manning BD & Horng T (2013) The TSC‐mTOR pathway regulates macrophage polarization. Nat Commun 4, 2834. [DOI] [PMC free article] [PubMed] [Google Scholar]
- 52. Joshi S, Singh AR, Zulcic M & Durden DL (2014) A macrophage‐dominant PI3K isoform controls hypoxia‐induced HIF1α and HIF2α stability and tumor growth, angiogenesis, and metastasis. Mol Cancer Res 12, 1520–1531. [DOI] [PubMed] [Google Scholar]
- 53. Cheng S‐C, Quintin J, Cramer RA, Shepardson KM, Saeed S, Kumar V, Giamarellos‐Bourboulis EJ, Martens JHA, Rao NA, Aghajanirefah A et al (2014) mTOR‐ and HIF‐1α‐mediated aerobic glycolysis as metabolic basis for trained immunity. Science 345, 1250684. [DOI] [PMC free article] [PubMed] [Google Scholar]
- 54. Rius J, Guma M, Schachtrup C, Akassoglou K, Zinkernagel AS, Nizet V, Johnson RS, Haddad GG & Karin M (2008) NF‐kappaB links innate immunity to the hypoxic response through transcriptional regulation of HIF‐1alpha. Nature 453, 807–811. [DOI] [PMC free article] [PubMed] [Google Scholar]
- 55. Wang T, Liu H, Lian G, Zhang S‐Y, Wang X & Jiang C (2017) HIF1α‐induced glycolysis metabolism is essential to the activation of inflammatory macrophages. Mediators Inflamm 2017, 9029327. [DOI] [PMC free article] [PubMed] [Google Scholar]
- 56. Semenza GL, Jiang BH, Leung SW, Passantino R, Concordet JP, Maire P & Giallongo A (1996) Hypoxia response elements in the aldolase A, enolase 1, and lactate dehydrogenase A gene promoters contain essential binding sites for hypoxia‐inducible factor 1. J Biol Chem 271, 32529–32537. [DOI] [PubMed] [Google Scholar]
- 57. Kim J, Tchernyshyov I, Semenza GL & Dang CV (2006) HIF‐1‐mediated expression of pyruvate dehydrogenase kinase: a metabolic switch required for cellular adaptation to hypoxia. Cell Metab 3, 177–185. [DOI] [PubMed] [Google Scholar]
- 58. Palsson‐McDermott EM, Curtis AM, Goel G, Lauterbach MAR, Sheedy FJ, Gleeson LE, van den Bosch MWM, Quinn SR, Domingo‐Fernandez R, Johnston DGW et al (2015) Pyruvate kinase M2 regulates Hif‐1α activity and IL‐1β induction and is a critical determinant of the warburg effect in LPS‐activated macrophages. Cell Metab 21, 65–80. [DOI] [PMC free article] [PubMed] [Google Scholar]
- 59. Hiscott J, Marois J, Garoufalis J, D'Addario M, Roulston A, Kwan I, Pepin N, Lacoste J, Nguyen H & Bensi G (1993) Characterization of a functional NF‐kappa B site in the human interleukin 1 beta promoter: evidence for a positive autoregulatory loop. Mol Cell Biol 13, 6231–6240. [DOI] [PMC free article] [PubMed] [Google Scholar]
- 60. Tannahill GM, Curtis AM, Adamik J, Palsson‐McDermott EM, McGettrick AF, Goel G, Frezza C, Bernard NJ, Kelly B, Foley NH et al (2013) Succinate is an inflammatory signal that induces IL‐1β through HIF‐1α. Nature 496, 238–242. [DOI] [PMC free article] [PubMed] [Google Scholar]
- 61. Moon J‐S, Hisata S, Park M‐A, DeNicola GM, Ryter SW, Nakahira K & Choi AMK (2015) mTORC1‐induced HK1‐dependent glycolysis regulates NLRP3 inflammasome activation. Cell Rep 12, 102–115. [DOI] [PMC free article] [PubMed] [Google Scholar] [Retracted]
- 62. Xie M, Yu Y, Kang R, Zhu S, Yang L, Zeng L, Sun X, Yang M, Billiar TR, Wang H et al (2016) PKM2‐dependent glycolysis promotes NLRP3 and AIM2 inflammasome activation. Nat Commun 7, 13280. [DOI] [PMC free article] [PubMed] [Google Scholar]
- 63. Langston PK, Nambu A, Jung J, Shibata M, Aksoylar HI, Lei J, Xu P, Doan MT, Jiang H, MacArthur MR et al (2019) Glycerol phosphate shuttle enzyme GPD2 regulates macrophage inflammatory responses. Nat Immunol 20, 1186–1195. [DOI] [PMC free article] [PubMed] [Google Scholar]
- 64. Pearce EL & Pearce EJ (2013) Metabolic pathways in immune cell activation and quiescence. Immunity 38, 633–643. [DOI] [PMC free article] [PubMed] [Google Scholar]
- 65. Gerriets VA & Rathmell JC (2012) Metabolic pathways in T cell fate and function. Trends Immunol 33, 168–173. [DOI] [PMC free article] [PubMed] [Google Scholar]
- 66. Menk AV, Scharping NE, Moreci RS, Zeng X, Guy C, Salvatore S, Bae H, Xie J, Young HA, Wendell SG et al (2018) Early TCR signaling induces rapid aerobic glycolysis enabling distinct acute T cell effector functions. Cell Rep 22, 1509–1521. [DOI] [PMC free article] [PubMed] [Google Scholar]
- 67. Ma EH, Verway MJ, Johnson RM, Roy DG, Steadman M, Hayes S, Williams KS, Sheldon RD, Samborska B, Kosinski PA et al (2019) Metabolic profiling using stable isotope tracing reveals distinct patterns of glucose utilization by physiologically activated CD8+ T cells. Immunity 51, 856–870.e5. [DOI] [PubMed] [Google Scholar]
- 68. Michalek RD, Gerriets VA, Jacobs SR, Macintyre AN, MacIver NJ, Mason EF, Sullivan SA, Nichols AG & Rathmell JC (2011) Cutting edge: distinct glycolytic and lipid oxidative metabolic programs are essential for effector and regulatory CD4+ T cell subsets. J Immunol 186, 3299–3303. [DOI] [PMC free article] [PubMed] [Google Scholar]
- 69. Baixauli F, Acín‐Pérez R, Villarroya‐Beltrí C, Mazzeo C, Nuñez‐Andrade N, Gabandé‐Rodriguez E, Ledesma MD, Blázquez A, Martin MA, Falcón‐Pérez JM et al (2015) Mitochondrial respiration controls lysosomal function during inflammatory T cell responses. Cell Metab 22, 485–498. [DOI] [PMC free article] [PubMed] [Google Scholar]
- 70. Sun I‐H, Oh M‐H, Zhao L, Patel CH, Arwood ML, Xu W, Tam AJ, Blosser RL, Wen J & Powell JD (2018) mTOR complex 1 signaling regulates the generation and function of central and effector Foxp3+ regulatory T cells. J Immunol 201, 481–492. [DOI] [PMC free article] [PubMed] [Google Scholar]
- 71. Shi LZ, Wang R, Huang G, Vogel P, Neale G, Green DR & Chi H (2011) HIF1α–dependent glycolytic pathway orchestrates a metabolic checkpoint for the differentiation of Th17 and Treg cells. J Exp Med 208, 1367–1376. [DOI] [PMC free article] [PubMed] [Google Scholar]
- 72. Chang C‐H, Curtis JD, Maggi LB, Faubert B, Villarino AV, O'Sullivan D, Huang SC‐C, van der Windt GJW, Blagih J, Qiu J et al (2013) Posttranscriptional control of T cell effector function by aerobic glycolysis. Cell 153, 1239–1251. [DOI] [PMC free article] [PubMed] [Google Scholar]
- 73. Sukumar M, Liu J, Ji Y, Subramanian M, Crompton JG, Yu Z, Roychoudhuri R, Palmer DC, Muranski P, Karoly ED et al (2013) Inhibiting glycolytic metabolism enhances CD8+ T cell memory and antitumor function. J Clin Invest 123, 4479–4488. [DOI] [PMC free article] [PubMed] [Google Scholar]
- 74. Cham CM, Driessens G, O'Keefe JP & Gajewski TF (2008) Glucose deprivation inhibits multiple key gene expression events and effector functions in CD8+ T cells. Eur J Immunol 38, 2438–2450. [DOI] [PMC free article] [PubMed] [Google Scholar]
- 75. Cham CM & Gajewski TF (2005) Glucose availability regulates IFN‐gamma production and p70S6 kinase activation in CD8+ effector T cells. J Immunol 174, 4670–4677. [DOI] [PubMed] [Google Scholar]
- 76. Brucklacher‐Waldert V, Ferreira C, Stebegg M, Fesneau O, Innocentin S, Marie JC & Veldhoen M (2017) Cellular stress in the context of an inflammatory environment supports TGF‐β‐independent T helper‐17 differentiation. Cell Rep 19, 2357–2370. [DOI] [PMC free article] [PubMed] [Google Scholar]
- 77. Wang R, Dillon CP, Shi LZ, Milasta S, Carter R, Finkelstein D, McCormick LL, Fitzgerald P, Chi H, Munger J et al (2011) The transcription factor Myc controls metabolic reprogramming upon T lymphocyte activation. Immunity 35, 871–882. [DOI] [PMC free article] [PubMed] [Google Scholar]
- 78. Sinclair LV, Rolf J, Emslie E, Shi Y‐B, Taylor PM & Cantrell DA (2013) Control of amino‐acid transport by antigen receptors coordinates the metabolic reprogramming essential for T cell differentiation. Nat Immunol 14, 500–508. [DOI] [PMC free article] [PubMed] [Google Scholar]
- 79. Powell JD, Pollizzi KN, Heikamp EB & Horton MR (2012) Regulation of immune responses by mTOR. Annu Rev Immunol 30, 39–68. [DOI] [PMC free article] [PubMed] [Google Scholar]
- 80. Oestreich KJ, Read KA, Gilbertson SE, Hough KP, McDonald PW, Krishnamoorthy V & Weinmann AS (2014) Bcl‐6 directly represses the gene program of the glycolysis pathway. Nat Immunol 15, 957–964. [DOI] [PMC free article] [PubMed] [Google Scholar]
- 81. Macintyre AN, Gerriets VA, Nichols AG, Michalek RD, Rudolph MC, Deoliveira D, Anderson SM, Abel ED, Chen BJ, Hale LP et al (2014) The glucose transporter Glut1 is selectively essential for CD4 T cell activation and effector function. Cell Metab 20, 61–72. [DOI] [PMC free article] [PubMed] [Google Scholar]
- 82. Delgoffe GM, Kole TP, Zheng Y, Zarek PE, Matthews KL, Xiao B, Worley PF, Kozma SC & Powell JD (2009) The mTOR kinase differentially regulates effector and regulatory T cell lineage commitment. Immunity 30, 832–844. [DOI] [PMC free article] [PubMed] [Google Scholar]
- 83. Pollizzi KN, Patel CH, Sun I, Oh M, Waickman AT, Wen J, Delgoffe GM & Powell JD (2015) mTORC1 and mTORC2 selectively regulate CD8+ T cell differentiation. J Clin Invest 125, 2090–2108. [DOI] [PMC free article] [PubMed] [Google Scholar]
- 84. Dang EV, Barbi J, Yang H‐Y, Jinasena D, Yu H, Zheng Y, Bordman Z, Fu J, Kim Y, Yen H‐R et al (2011) Control of T(H)17/T(reg) balance by hypoxia‐inducible factor 1. Cell 146, 772–784. [DOI] [PMC free article] [PubMed] [Google Scholar]
- 85. Böttcher M, Renner K, Berger R, Mentz K, Thomas S, Cardenas‐Conejo ZE, Dettmer K, Oefner PJ, Mackensen A, Kreutz M et al (2018) D‐2‐hydroxyglutarate interferes with HIF‐1α stability skewing T‐cell metabolism towards oxidative phosphorylation and impairing Th17 polarization. Oncoimmunology 7, e1445454. [DOI] [PMC free article] [PubMed] [Google Scholar]
- 86. Franchi L, Monteleone I, Hao L‐Y, Spahr MA, Zhao W, Liu X, Demock K, Kulkarni A, Lesch CA, Sanchez B et al (2017) Inhibiting oxidative phosphorylation in vivo restrains Th17 effector responses and ameliorates murine colitis. J Immunol 198, 2735–2746. [DOI] [PMC free article] [PubMed] [Google Scholar]
- 87. Huang SC‐C, Everts B, Ivanova Y, O'Sullivan D, Nascimento M, Smith AM, Beatty W, Love‐Gregory L, Lam WY, O'Neill CM et al (2014) Cell‐intrinsic lysosomal lipolysis is essential for alternative activation of macrophages. Nat Immunol 15, 846–855. [DOI] [PMC free article] [PubMed] [Google Scholar]
- 88. Vats D, Mukundan L, Odegaard JI, Zhang L, Smith KL, Morel CR, Wagner RA, Greaves DR, Murray PJ & Chawla A (2006) Oxidative metabolism and PGC‐1beta attenuate macrophage‐mediated inflammation. Cell Metab 4, 13–24. [DOI] [PMC free article] [PubMed] [Google Scholar]
- 89. Takeda N, O'Dea EL, Doedens A, Kim J, Weidemann A, Stockmann C, Asagiri M, Simon MC, Hoffmann A & Johnson RS (2010) Differential activation and antagonistic function of HIF‐{alpha} isoforms in macrophages are essential for NO homeostasis. Genes Dev 24, 491–501. [DOI] [PMC free article] [PubMed] [Google Scholar]
- 90. Covarrubias AJ, Aksoylar HI, Yu J, Snyder NW, Worth AJ, Iyer SS, Wang J, Ben‐Sahra I, Byles V, Polynne‐Stapornkul T et al (2016) Akt‐mTORC1 signaling regulates Acly to integrate metabolic input to control of macrophage activation. Elife 5, 1–19. [DOI] [PMC free article] [PubMed] [Google Scholar]
- 91. Wilson JL, Nägele T, Linke M, Demel F, Fritsch SD, Mayr HK, Cai Z, Katholnig K, Sun X, Fragner L et al (2020) Inverse data‐driven modeling and multiomics analysis reveals Phgdh as a metabolic checkpoint of macrophage polarization and proliferation. Cell Rep 30, 1542–1552.e7. [DOI] [PMC free article] [PubMed] [Google Scholar]
- 92. Jha AK, Huang SC‐C, Sergushichev A, Lampropoulou V, Ivanova Y, Loginicheva E, Chmielewski K, Stewart KM, Ashall J, Everts B et al (2015) Network integration of parallel metabolic and transcriptional data reveals metabolic modules that regulate macrophage polarization. Immunity 42, 419–430. [DOI] [PubMed] [Google Scholar]
- 93. Tan Z, Xie N, Cui H, Moellering DR, Abraham E, Thannickal VJ & Liu G (2015) Pyruvate dehydrogenase kinase 1 participates in macrophage polarization via regulating glucose metabolism. J Immunol 194, 6082–6089. [DOI] [PMC free article] [PubMed] [Google Scholar]
- 94. Huang SC‐C, Smith AM, Everts B, Colonna M, Pearce EL, Schilling JD & Pearce EJ (2016) Metabolic reprogramming mediated by the mTORC2‐IRF4 signaling axis is essential for macrophage alternative activation. Immunity 45, 817–830. [DOI] [PMC free article] [PubMed] [Google Scholar]
- 95. Desdín‐Micó G, Soto‐Heredero G & Mittelbrunn M (2018) Mitochondrial activity in T cells. Mitochondrion 41, 51–57. [DOI] [PubMed] [Google Scholar]
- 96. Weinberg SE, Singer BD, Steinert EM, Martinez CA, Mehta MM, Martínez‐Reyes I, Gao P, Helmin KA, Abdala‐Valencia H, Sena LA et al (2019) Mitochondrial complex III is essential for suppressive function of regulatory T cells. Nature 565, 495–499. [DOI] [PMC free article] [PubMed] [Google Scholar]
- 97. Fu Z, Ye J, Dean JW, Bostick JW, Weinberg SE, Xiong L, Oliff KN, Chen ZE, Avram D, Chandel NS et al (2019) Requirement of mitochondrial transcription factor A in tissue‐resident regulatory T cell maintenance and function. Cell Rep 28, 159–171.e4. [DOI] [PMC free article] [PubMed] [Google Scholar]
- 98. Pearce EL, Walsh MC, Cejas PJ, Harms GM, Shen H, Wang L‐S, Jones RG & Choi Y (2009) Enhancing CD8 T‐cell memory by modulating fatty acid metabolism. Nature 460, 103–107. [DOI] [PMC free article] [PubMed] [Google Scholar]
- 99. van der Windt GJW, Everts B, Chang C‐H, Curtis JD, Freitas TC, Amiel E, Pearce EJ & Pearce EL (2012) Mitochondrial respiratory capacity is a critical regulator of CD8+ T cell memory development. Immunity 36, 68–78. [DOI] [PMC free article] [PubMed] [Google Scholar]
- 100. Rolf J, Zarrouk M, Finlay DK, Foretz M, Viollet B & Cantrell DA (2013) AMPKα1: a glucose sensor that controls CD8 T‐cell memory. Eur J Immunol 43, 889–896. [DOI] [PMC free article] [PubMed] [Google Scholar]
- 101. O'Sullivan D, van der Windt GJW, Huang SC‐C, Curtis JD, Chang C‐H, Buck MDL, Qiu J, Smith AM, Lam WY, DiPlato LM et al (2014) Memory CD8(+) T cells use cell‐intrinsic lipolysis to support the metabolic programming necessary for development. Immunity 41, 75–88. [DOI] [PMC free article] [PubMed] [Google Scholar]
- 102. van der Windt GJW, O'Sullivan D, Everts B, Huang SC‐C, Buck MD, Curtis JD, Chang C‐H, Smith AM, Ai T, Faubert B et al (2013) CD8 memory T cells have a bioenergetic advantage that underlies their rapid recall ability. Proc Natl Acad Sci USA 110, 14336–14341. [DOI] [PMC free article] [PubMed] [Google Scholar]
- 103. Gubser PM, Bantug GR, Razik L, Fischer M, Dimeloe S, Hoenger G, Durovic B, Jauch A & Hess C (2013) Rapid effector function of memory CD8+ T cells requires an immediate‐early glycolytic switch. Nat Immunol 14, 1064–1072. [DOI] [PubMed] [Google Scholar]
- 104. Swamy M, Pathak S, Grzes KM, Damerow S, Sinclair LV, van Aalten DMF & Cantrell DA (2016) Glucose and glutamine fuel protein O‐GlcNAcylation to control T cell self‐renewal and malignancy. Nat Immunol 17, 712–720. [DOI] [PMC free article] [PubMed] [Google Scholar]
- 105. de Jesus T, Shukla S & Ramakrishnan P (2018) Too sweet to resist: control of immune cell function by O‐GlcNAcylation. Cell Immunol 333, 85–92. [DOI] [PMC free article] [PubMed] [Google Scholar]
- 106. Gustin A, Kirchmeyer M, Koncina E, Felten P, Losciuto S, Heurtaux T, Tardivel A, Heuschling P & Dostert C (2015) NLRP3 inflammasome is expressed and functional in mouse brain microglia but not in astrocytes. PLoS ONE 10, e0130624. [DOI] [PMC free article] [PubMed] [Google Scholar]
- 107. Gimeno‐Bayón J, López‐López A, Rodríguez MJ & Mahy N (2014) Glucose pathways adaptation supports acquisition of activated microglia phenotype. J Neurosci Res 92, 723–731. [DOI] [PubMed] [Google Scholar]
- 108. Wang L, Pavlou S, Du X, Bhuckory M, Xu H & Chen M (2019) Glucose transporter 1 critically controls microglial activation through facilitating glycolysis. Mol Neurodegener 14, 2. [DOI] [PMC free article] [PubMed] [Google Scholar]
- 109. Gabandé‐Rodríguez E, Keane L & Capasso M (2020) Microglial phagocytosis in aging and Alzheimer's disease. J Neurosci Res 98, 284–298. [DOI] [PubMed] [Google Scholar]
- 110. Chen J, Sun Z, Jin M, Tu Y, Wang S, Yang X, Chen Q, Zhang X, Han Y & Pi R (2017) Inhibition of AGEs/RAGE/Rho/ROCK pathway suppresses non‐specific neuroinflammation by regulating BV2 microglial M1/M2 polarization through the NF‐κB pathway. J Neuroimmunol 305, 108–114. [DOI] [PubMed] [Google Scholar]
- 111. Ghosh S, Castillo E, Frias ES & Swanson RA (2018) Bioenergetic regulation of microglia. Glia 66, 1200–1212. [DOI] [PMC free article] [PubMed] [Google Scholar]
- 112. Baik SH, Kang S, Lee W, Choi H, Chung S, Kim J‐I & Mook‐Jung I (2019) A breakdown in metabolic reprogramming causes microglia dysfunction in Alzheimer's disease. Cell Metab 30, 493–507.e6. [DOI] [PubMed] [Google Scholar]
- 113. Ulland TK, Song WM, Huang SC‐C, Ulrich JD, Sergushichev A, Beatty WL, Loboda AA, Zhou Y, Cairns NJ, Kambal A et al (2017) TREM2 maintains microglial metabolic fitness in Alzheimer's disease. Cell 170, 649–663.e13. [DOI] [PMC free article] [PubMed] [Google Scholar]
- 114. van der Poel M, Ulas T, Mizee MR, Hsiao C‐C, Miedema SSM, Adelia Schuurman KG, Helder B, Tas SW, Schultze JL, Hamann J et al (2019) Transcriptional profiling of human microglia reveals grey‐white matter heterogeneity and multiple sclerosis‐associated changes. Nat Commun 10, 1139. [DOI] [PMC free article] [PubMed] [Google Scholar]
- 115. Peruzzotti‐Jametti L & Pluchino S (2018) Targeting mitochondrial metabolism in neuroinflammation: towards a therapy for progressive multiple sclerosis. Trends Mol Med 24, 838–855. [DOI] [PubMed] [Google Scholar]
- 116. Pluchino S, Quattrini A, Brambilla E, Gritti A, Salani G, Dina G, Galli R, Del Carro U, Amadio S, Bergami A et al (2003) Injection of adult neurospheres induces recovery in a chronic model of multiple sclerosis. Nature 422, 688–694. [DOI] [PubMed] [Google Scholar]
- 117. Peruzzotti‐Jametti L, Bernstock JD, Vicario N, Costa ASH, Kwok CK, Leonardi T, Booty LM, Bicci I, Balzarotti B, Volpe G et al (2018) Macrophage‐derived extracellular succinate licenses neural stem cells to suppress chronic neuroinflammation. Cell Stem Cell 22, 355–368.e13. [DOI] [PMC free article] [PubMed] [Google Scholar]
- 118. Colombo E & Farina C (2016) Astrocytes: key regulators of neuroinflammation. Trends Immunol 37, 608–620. [DOI] [PubMed] [Google Scholar]
- 119. Iglesias J, Morales L & Barreto GE (2017) Metabolic and inflammatory adaptation of reactive astrocytes: role of PPARs. Mol Neurobiol 54, 2518–2538. [DOI] [PubMed] [Google Scholar]
- 120. Allaman I, Gavillet M, Bélanger M, Laroche T, Viertl D, Lashuel HA & Magistretti PJ (2010) Amyloid‐beta aggregates cause alterations of astrocytic metabolic phenotype: impact on neuronal viability. J Neurosci 30, 3326–3338. [DOI] [PMC free article] [PubMed] [Google Scholar]
- 121. Amaral AI, Teixeira AP, Martens S, Bernal V, Sousa MFQ & Alves PM (2010) Metabolic alterations induced by ischemia in primary cultures of astrocytes: merging 13C NMR spectroscopy and metabolic flux analysis. J Neurochem 113, 735–748. [DOI] [PubMed] [Google Scholar]
- 122. Suzuki A, Stern SA, Bozdagi O, Huntley GW, Walker RH, Magistretti PJ & Alberini CM (2011) Astrocyte‐neuron lactate transport is required for long‐term memory formation. Cell 144, 810–23. [DOI] [PMC free article] [PubMed] [Google Scholar]
- 123. Zamanian JL, Xu L, Foo LC, Nouri N, Zhou L, Giffard RG & Barres BA (2012) Genomic analysis of reactive astrogliosis. J Neurosci 32, 6391–6410. [DOI] [PMC free article] [PubMed] [Google Scholar]
- 124. Liddelow SA, Guttenplan KA, Clarke LE, Bennett FC, Bohlen CJ, Schirmer L, Bennett ML, Münch AE, Chung W‐S, Peterson TC et al (2017) Neurotoxic reactive astrocytes are induced by activated microglia. Nature 541, 481–487. [DOI] [PMC free article] [PubMed] [Google Scholar]
- 125. Clarke LE, Liddelow SA, Chakraborty C, Münch AE, Heiman M & Barres BA (2018) Normal aging induces A1‐like astrocyte reactivity. Proc Natl Acad Sci USA 115, E1896–E1905. [DOI] [PMC free article] [PubMed] [Google Scholar]
- 126. Vander Heiden MG, Locasale JW, Swanson KD, Sharfi H, Heffron GJ, Amador‐Noguez D, Christofk HR, Wagner G, Rabinowitz JD, Asara JM et al (2010) Evidence for an alternative glycolytic pathway in rapidly proliferating cells. Science 329, 1492–1499. [DOI] [PMC free article] [PubMed] [Google Scholar]
- 127. Ho P‐C, Bihuniak JD, Macintyre AN, Staron M, Liu X, Amezquita R, Tsui Y‐C, Cui G, Micevic G, Perales JC et al (2015) Phosphoenolpyruvate is a metabolic checkpoint of anti‐tumor T cell responses. Cell 162, 1217–1228. [DOI] [PMC free article] [PubMed] [Google Scholar]
- 128. Ko C‐W, Counihan D, Wu J, Hatzoglou M, Puchowicz MA & Croniger CM (2018) Macrophages with a deletion of the phosphoenolpyruvate carboxykinase 1 (Pck1) gene have a more proinflammatory phenotype. J Biol Chem 293, 3399–3409. [DOI] [PMC free article] [PubMed] [Google Scholar]
- 129. Brooks GA (2018) The science and translation of lactate shuttle theory. Cell Metab 27, 757–785. [DOI] [PubMed] [Google Scholar]
- 130. Pucino V, Bombardieri M, Pitzalis C & Mauro C (2017) Lactate at the crossroads of metabolism, inflammation, and autoimmunity. Eur J Immunol 47, 14–21. [DOI] [PubMed] [Google Scholar]
- 131. Collins LE & Troeberg L (2019) Lactate as a regulator of cancer inflammation and immunity. Immunometabolism 105, 81–92. [DOI] [PubMed] [Google Scholar]
- 132. Errea A, Cayet D, Marchetti P, Tang C, Kluza J, Offermanns S, Sirard J‐C & Rumbo M (2016) Lactate inhibits the pro‐inflammatory response and metabolic reprogramming in murine macrophages in a GPR81‐independent manner. PLoS ONE 11, e0163694. [DOI] [PMC free article] [PubMed] [Google Scholar]
- 133. Iraporda C, Romanin DE, Bengoa AA, Errea AJ, Cayet D, Foligné B, Sirard J‐C, Garrote GL, Abraham AG & Rumbo M (2016) Local treatment with lactate prevents intestinal inflammation in the TNBS‐induced colitis model. Front Immunol 7, 651. [DOI] [PMC free article] [PubMed] [Google Scholar]
- 134. Peter K, Rehli M, Singer K, Renner‐Sattler K & Kreutz M (2015) Lactic acid delays the inflammatory response of human monocytes. Biochem Biophys Res Commun 457, 412–418. [DOI] [PubMed] [Google Scholar]
- 135. Hoque R, Farooq A, Ghani A, Gorelick F & Mehal WZ (2014) Lactate reduces liver and pancreatic injury in toll‐like receptor‐ and inflammasome‐mediated inflammation via gpr81‐mediated suppression of innate immunity. Gastroenterology 146, 1763–1774. [DOI] [PMC free article] [PubMed] [Google Scholar]
- 136. Nasi A, Fekete T, Krishnamurthy A, Snowden S, Rajnavölgyi E, Catrina AI, Wheelock CE, Vivar N & Rethi B (2013) Dendritic cell reprogramming by endogenously produced lactic acid. J Immunol 191, 3090–3099. [DOI] [PubMed] [Google Scholar]
- 137. Haas R, Smith J, Rocher‐Ros V, Nadkarni S, Montero‐Melendez T, D'Acquisto F, Bland EJ, Bombardieri M, Pitzalis C, Perretti M et al (2015) Lactate regulates metabolic and pro‐inflammatory circuits in control of T cell migration and effector functions. PLoS Biol 13, e1002202. [DOI] [PMC free article] [PubMed] [Google Scholar]
- 138. Angelin A, Gil‐de‐Gómez L, Dahiya S, Jiao J, Guo L, Levine MH, Wang Z, Quinn WJ, Kopinski PK, Wang L et al (2017) Foxp3 reprograms T cell metabolism to function in low‐glucose, high‐lactate environments. Cell Metab 25, 1282–1293.e7. [DOI] [PMC free article] [PubMed] [Google Scholar]
- 139. Samuvel DJ, Sundararaj KP, Nareika A, Lopes‐Virella MF & Huang Y (2009) Lactate boosts TLR4 signaling and NF‐κB pathway‐mediated gene transcription in macrophages via monocarboxylate transporters and MD‐2 Up‐regulation. J Immunol 182, 2476–2484. [DOI] [PMC free article] [PubMed] [Google Scholar]
- 140. Végran F, Boidot R, Michiels C, Sonveaux P & Feron O (2011) Lactate influx through the endothelial cell monocarboxylate transporter MCT1 supports an NF‐κB/IL‐8 pathway that drives tumor angiogenesis. Cancer Res 71, 2550–2560. [DOI] [PubMed] [Google Scholar]
- 141. Hollander AP, Corke KP, Freemont AJ & Lewis CE (2001) Expression of hypoxia‐inducible factor 1alpha by macrophages in the rheumatoid synovium: implications for targeting of therapeutic genes to the inflamed joint. Arthritis Rheum 44, 1540–1544. [DOI] [PubMed] [Google Scholar]
- 142. Jiang S & Yan W (2017) Succinate in the cancer‐immune cycle. Cancer Lett 390, 45–47. [DOI] [PubMed] [Google Scholar]
- 143. Mills EL, Kelly B, Logan A, Costa ASH, Varma M, Bryant CE, Tourlomousis P, Däbritz JHM, Gottlieb E, Latorre I et al (2016) Succinate dehydrogenase supports metabolic repurposing of mitochondria to drive inflammatory macrophages. Cell 167, 457–470.e13. [DOI] [PMC free article] [PubMed] [Google Scholar]
- 144. Mills E & O'Neill LAJ (2014) Succinate: a metabolic signal in inflammation. Trends Cell Biol 24, 313–320. [DOI] [PubMed] [Google Scholar]
- 145. Keiran N, Ceperuelo‐Mallafré V, Calvo E, Hernández‐Alvarez MI, Ejarque M, Núñez‐Roa C, Horrillo D, Maymó‐Masip E, Rodríguez MM, Fradera R et al (2019) SUCNR1 controls an anti‐inflammatory program in macrophages to regulate the metabolic response to obesity. Nat Immunol 20, 581–592. [DOI] [PubMed] [Google Scholar]
- 146. Littlewood‐Evans A, Sarret S, Apfel V, Loesle P, Dawson J, Zhang J, Muller A, Tigani B, Kneuer R, Patel S et al (2016) GPR91 senses extracellular succinate released from inflammatory macrophages and exacerbates rheumatoid arthritis. J Exp Med 213, 1655–1662. [DOI] [PMC free article] [PubMed] [Google Scholar]
- 147. Rubic T, Lametschwandtner G, Jost S, Hinteregger S, Kund J, Carballido‐Perrig N, Schwärzler C, Junt T, Voshol H, Meingassner JG et al (2008) Triggering the succinate receptor GPR91 on dendritic cells enhances immunity. Nat Immunol 9, 1261–1269. [DOI] [PubMed] [Google Scholar]
- 148. Saraiva AL, Veras FP, Peres RS, Talbot J, de Lima KA, Luiz JP, Carballido JM, Cunha TM, Cunha FQ, Ryffel B et al (2018) Succinate receptor deficiency attenuates arthritis by reducing dendritic cell traffic and expansion of Th17 cells in the lymph nodes. FASEB J 32, fj201800285. [DOI] [PubMed] [Google Scholar]
- 149. Infantino V, Convertini P, Cucci L, Panaro MA, Di Noia MA, Calvello R, Palmieri F & Iacobazzi V (2011) The mitochondrial citrate carrier: a new player in inflammation. Biochem J 438, 433–436. [DOI] [PubMed] [Google Scholar]
- 150. Michelucci A, Cordes T, Ghelfi J, Pailot A, Reiling N, Goldmann O, Binz T, Wegner A, Tallam A, Rausell A et al (2013) Immune‐responsive gene 1 protein links metabolism to immunity by catalyzing itaconic acid production. Proc Natl Acad Sci USA 110, 7820–7825. [DOI] [PMC free article] [PubMed] [Google Scholar]
- 151. Williams NC & O'Neill LAJ (2018) A role for the Krebs cycle intermediate citrate in metabolic reprogramming in innate immunity and inflammation. Front Immunol 9, 141. [DOI] [PMC free article] [PubMed] [Google Scholar]
- 152. Cordes T, Wallace M, Michelucci A, Divakaruni AS, Sapcariu SC, Sousa C, Koseki H, Cabrales P, Murphy AN, Hiller K et al (2016) Immunoresponsive gene 1 and itaconate inhibit succinate dehydrogenase to modulate intracellular succinate levels. J Biol Chem 291, 14274–14284. [DOI] [PMC free article] [PubMed] [Google Scholar]
- 153. Lampropoulou V, Sergushichev A, Bambouskova M, Nair S, Vincent EE, Loginicheva E, Cervantes‐Barragan L, Ma X, Huang SCC, Griss T et al (2016) Itaconate links inhibition of succinate dehydrogenase with macrophage metabolic remodeling and regulation of inflammation. Cell Metab 24, 158–166. [DOI] [PMC free article] [PubMed] [Google Scholar]
- 154. Németh B, Doczi J, Csete D, Kacso G, Ravasz D, Adams D, Kiss G, Nagy AM, Horvath G, Tretter L et al (2016) Abolition of mitochondrial substrate‐level phosphorylation by itaconic acid produced by LPS‐induced Irg1 expression in cells of murine macrophage lineage. FASEB J 30, 286–300. [DOI] [PubMed] [Google Scholar]
- 155. Bambouskova M, Gorvel L, Lampropoulou V, Sergushichev A, Loginicheva E, Johnson K, Korenfeld D, Mathyer ME, Kim H, Huang L‐H et al (2018) Electrophilic properties of itaconate and derivatives regulate the IκBζ‐ATF3 inflammatory axis. Nature 556, 501–504. [DOI] [PMC free article] [PubMed] [Google Scholar]
- 156. Mills EL, Ryan DG, Prag HA, Dikovskaya D, Menon D, Zaslona Z, Jedrychowski MP, Costa ASH, Higgins M, Hams E et al (2018) Itaconate is an anti‐inflammatory metabolite that activates Nrf2 via alkylation of KEAP1. Nature 556, 113–117. [DOI] [PMC free article] [PubMed] [Google Scholar]
- 157. ElAzzouny M, Tom CTMB, Evans CR, Olson LL, Tanga MJ, Gallagher KA, Martin BR & Burant CF (2017) Dimethyl itaconate is not metabolized into itaconate intracellularly. J Biol Chem 292, 4766–4769. [DOI] [PMC free article] [PubMed] [Google Scholar]
- 158. Klysz D, Tai X, Robert PA, Craveiro M, Cretenet G, Oburoglu L, Mongellaz C, Floess S, Fritz V, Matias MI et al (2015) Glutamine‐dependent α‐ketoglutarate production regulates the balance between T helper 1 cell and regulatory T cell generation. Sci Signal 8, ra97. [DOI] [PubMed] [Google Scholar]
- 159. Millet P, Vachharajani V, McPhail L, Yoza B & McCall CE (2016) GAPDH binding to TNF‐α mRNA contributes to posttranscriptional repression in monocytes: a novel mechanism of communication between inflammation and metabolism. J Immunol 196, 2541–2551. [DOI] [PMC free article] [PubMed] [Google Scholar]
- 160. Castello A, Fischer B, Eichelbaum K, Horos R, Beckmann BM, Strein C, Davey NE, Humphreys DT, Preiss T, Steinmetz LM et al (2012) Insights into RNA biology from an atlas of mammalian mRNA‐binding proteins. Cell 149, 1393–1406. [DOI] [PubMed] [Google Scholar]
- 161. De Rosa V, Galgani M, Porcellini A, Colamatteo A, Santopaolo M, Zuchegna C, Romano A, De Simone S, Procaccini C, La Rocca C et al (2015) Glycolysis controls the induction of human regulatory T cells by modulating the expression of FOXP3 exon 2 splicing variants. Nat Immunol 16, 1174–1184. [DOI] [PMC free article] [PubMed] [Google Scholar]
- 162. Balmer ML, Ma EH, Bantug GR, Grählert J, Pfister S, Glatter T, Jauch A, Dimeloe S, Slack E, Dehio P et al (2016) Memory CD8(+) T cells require increased concentrations of acetate induced by stress for optimal function. Immunity 44, 1312–1324. [DOI] [PubMed] [Google Scholar]
- 163. Paraiso HC, Kuo P‐C, Curfman ET, Moon HJ, Sweazey RD, Yen J‐H, Chang F‐L & Yu I‐C (2018) Dimethyl fumarate attenuates reactive microglia and long‐term memory deficits following systemic immune challenge. J Neuroinflammation 15, 100. [DOI] [PMC free article] [PubMed] [Google Scholar]
- 164. Litjens NHR, Rademaker M, Ravensbergen B, Thio HB, van Dissel JT & Nibbering PH (2006) Effects of monomethylfumarate on dendritic cell differentiation. Br J Dermatol 154, 211–217. [DOI] [PubMed] [Google Scholar]
- 165. Peng H, Guerau‐de‐Arellano M, Mehta VB, Yang Y, Huss DJ, Papenfuss TL, Lovett‐Racke AE & Racke MK (2012) Dimethyl fumarate inhibits dendritic cell maturation via nuclear factor κB (NF‐κB) and extracellular signal‐regulated kinase 1 and 2 (ERK1/2) and mitogen stress‐activated kinase 1 (MSK1) signaling. J Biol Chem 287, 28017–28026. [DOI] [PMC free article] [PubMed] [Google Scholar]
- 166. Hammer A, Waschbisch A, Knippertz I, Zinser E, Berg J, Jörg S, Kuhbandner K, David C, Pi J, Bayas A et al (2017) Role of nuclear factor (erythroid‐derived 2)‐like 2 signaling for effects of fumaric acid esters on dendritic cells. Front Immunol 8, 1922. [DOI] [PMC free article] [PubMed] [Google Scholar]
- 167. Park J, Chen Y, Tishkoff DX, Peng C, Tan M, Dai L, Xie Z, Zhang Y, Zwaans BMM, Skinner ME et al (2013) SIRT5‐mediated lysine desuccinylation impacts diverse metabolic pathways. Mol Cell 50, 919–930. [DOI] [PMC free article] [PubMed] [Google Scholar]
- 168. Zhang Z, Tan M, Xie Z, Dai L, Chen Y & Zhao Y (2011) Identification of lysine succinylation as a new post‐translational modification. Nat Chem Biol 7, 58–63. [DOI] [PMC free article] [PubMed] [Google Scholar]
- 169. Wang F, Wang K, Xu W, Zhao S, Ye D, Wang Y, Xu Y, Zhou L, Chu Y, Zhang C et al (2017) SIRT5 desuccinylates and activates pyruvate kinase M2 to block macrophage IL‐1β production and to prevent DSS‐induced colitis in mice. Cell Rep 19, 2331–2344. [DOI] [PubMed] [Google Scholar]
- 170. Phan AT, Goldrath AW & Glass CK (2017) Metabolic and epigenetic coordination of T cell and macrophage immunity. Immunity 46, 714–729. [DOI] [PMC free article] [PubMed] [Google Scholar]
- 171. Chisolm DA & Weinmann AS (2018) Connections between metabolism and epigenetics in programming cellular differentiation. Annu Rev Immunol 36, 221–246. [DOI] [PubMed] [Google Scholar]
- 172. Katada S, Imhof A & Sassone‐Corsi P (2012) Connecting threads: epigenetics and metabolism. Cell 148, 24–28. [DOI] [PubMed] [Google Scholar]
- 173. Reid MA, Dai Z & Locasale JW (2017) The impact of cellular metabolism on chromatin dynamics and epigenetics. Nat Cell Biol 19, 1298–1306. [DOI] [PMC free article] [PubMed] [Google Scholar]
- 174. Schwer B & Verdin E (2008) Conserved metabolic regulatory functions of sirtuins. Cell Metab 7, 104–112. [DOI] [PubMed] [Google Scholar]
- 175. Finkel T, Deng C‐X & Mostoslavsky R (2009) Recent progress in the biology and physiology of sirtuins. Nature 460, 587–591. [DOI] [PMC free article] [PubMed] [Google Scholar]
- 176. Verdin E (2015) NAD+ in aging, metabolism, and neurodegeneration. Science 350, 1208–1213. [DOI] [PubMed] [Google Scholar]
- 177. Zhang D, Tang Z, Huang H, Zhou G, Cui C, Weng Y, Liu W, Kim S, Lee S, Perez‐Neut M et al (2019) Metabolic regulation of gene expression by histone lactylation. Nature 574, 575–580. [DOI] [PMC free article] [PubMed] [Google Scholar]
- 178. Peng M, Yin N, Chhangawala S, Xu K, Leslie CS & Li MO (2016) Aerobic glycolysis promotes T helper 1 cell differentiation through an epigenetic mechanism. Science 354, 481–484. [DOI] [PMC free article] [PubMed] [Google Scholar]
- 179. Kinnaird A, Zhao S, Wellen KE & Michelakis ED (2016) Metabolic control of epigenetics in cancer. Nat Rev Cancer 16, 694–707. [DOI] [PubMed] [Google Scholar]
- 180. Pietrocola F, Galluzzi L, Bravo‐San Pedro JM, Madeo F & Kroemer G (2015) Acetyl coenzyme A: a central metabolite and second messenger. Cell Metab 21, 805–821. [DOI] [PubMed] [Google Scholar]
- 181. Infantino V, Iacobazzi V, Palmieri F & Menga A (2013) ATP‐citrate lyase is essential for macrophage inflammatory response. Biochem Biophys Res Commun 440, 105–111. [DOI] [PubMed] [Google Scholar]
- 182. Wellen KE, Hatzivassiliou G, Sachdeva UM, Bui TV, Cross JR & Thompson CB (2009) ATP‐citrate lyase links cellular metabolism to histone acetylation. Science 324, 1076–1080. [DOI] [PMC free article] [PubMed] [Google Scholar]
- 183. Qiu J, Villa M, Sanin DE, Buck MD, O'Sullivan D, Ching R, Matsushita M, Grzes KM, Winkler F, Chang C‐H et al (2019) Acetate promotes T cell effector function during glucose restriction. Cell Rep 27, 2063–2074.e5. [DOI] [PMC free article] [PubMed] [Google Scholar]
- 184. Arts RJW, Novakovic B, Ter Horst R, Carvalho A, Bekkering S, Lachmandas E, Rodrigues F, Silvestre R, Cheng S‐C, Wang S‐Y et al (2016) Glutaminolysis and fumarate accumulation integrate immunometabolic and epigenetic programs in trained immunity. Cell Metab 24, 807–819. [DOI] [PMC free article] [PubMed] [Google Scholar]
- 185. Tsukada Y, Fang J, Erdjument‐Bromage H, Warren ME, Borchers CH, Tempst P & Zhang Y (2006) Histone demethylation by a family of JmjC domain‐containing proteins. Nature 439, 811–816. [DOI] [PubMed] [Google Scholar]
- 186. Liu P‐S, Wang H, Li X, Chao T, Teav T, Christen S, Di Conza G, Cheng W‐C, Chou C‐H, Vavakova M et al (2017) α‐ketoglutarate orchestrates macrophage activation through metabolic and epigenetic reprogramming. Nat Immunol 18, 985–994. [DOI] [PubMed] [Google Scholar]
- 187. Chisolm DA, Savic D, Moore AJ, Ballesteros‐Tato A, León B, Crossman DK, Murre C, Myers RM & Weinmann AS (2017) CCCTC‐binding factor translates interleukin 2‐ and α‐ketoglutarate‐sensitive metabolic changes in T cells into context‐dependent gene programs. Immunity 47, 251–267.e7. [DOI] [PMC free article] [PubMed] [Google Scholar]
- 188. Figueroa ME, Abdel‐Wahab O, Lu C, Ward PS, Patel J, Shih A, Li Y, Bhagwat N, Vasanthakumar A, Fernandez HF et al (2010) Leukemic IDH1 and IDH2 mutations result in a hypermethylation phenotype, disrupt TET2 function, and impair hematopoietic differentiation. Cancer Cell 18, 553–567. [DOI] [PMC free article] [PubMed] [Google Scholar]
- 189. Tyrakis PA, Palazon A, Macias D, Lee KL, Phan AT, Veliça P, You J, Chia GS, Sim J, Doedens A et al (2016) S‐2‐hydroxyglutarate regulates CD8+ T‐lymphocyte fate. Nature 540, 236–241. [DOI] [PMC free article] [PubMed] [Google Scholar]
- 190. Yu W, Wang Z, Zhang K, Chi Z, Xu T, Jiang D, Chen S, Li W, Yang X, Zhang X et al (2019) One‐carbon metabolism supports S‐adenosylmethionine and histone methylation to drive inflammatory macrophages. Mol Cell 75, 1147–1160.e5. [DOI] [PubMed] [Google Scholar]
- 191. Roy DG, Chen J, Mamane V, Ma EH, Muhire BM, Sheldon RD, Shorstova T, Koning R, Johnson RM, Esaulova E et al (2020) Methionine metabolism shapes T helper cell responses through regulation of epigenetic reprogramming. Cell Metab 31, 250–266.e9. [DOI] [PubMed] [Google Scholar]
- 192. Palmieri EM, Gonzalez‐Cotto M, Baseler WA, Davies LC, Ghesquière B, Maio N, Rice CM, Rouault TA, Cassel T, Higashi RM et al (2020) Nitric oxide orchestrates metabolic rewiring in M1 macrophages by targeting aconitase 2 and pyruvate dehydrogenase. Nat Commun 11, 698. [DOI] [PMC free article] [PubMed] [Google Scholar]