Abstract
Background
Gadolinium‐based contrast agents (GBCAs) are widely used in MRI, despite safety concerns regarding deposition in brain and other organs. In animal studies gadolinium was detected for weeks after administration in the kidneys, but this has not yet been demonstrated in humans.
Purpose
To find evidence for the prolonged presence of gadobutrol in the kidneys in healthy volunteers.
Study Type
Combined retrospective and prospective analysis of a repeatability study.
Population
Twenty‐three healthy volunteers with normal renal function (12 women, age range 40–76 years), of whom 21 were used for analysis.
Field Strength/Sequence
Inversion recovery‐based T1 map at 3T.
Assessment
T1 maps were obtained twice with a median interval of 7 (range: 4–16) days. The T1 difference (ΔT1) between both scans was compared between the gadolinium group (n = 16, 0.05 mmol/kg gadobutrol administered after T1 mapping during both scan sessions) and the control group (n = 5, no gadobutrol). T1 maps were analyzed separately for cortex and medulla.
Statistical Tests
Mann–Whitney U‐tests to detect differences in ΔT1 between groups and linear regression to relate time between scans and estimated glomerular filtration rate (eGFR) to ΔT1.
Results
ΔT1 differed significantly between the gadolinium and control group: median ΔT1 cortex –98 vs. 7 msec (P < 0.001) and medulla –68 msec vs. 19 msec (P = 0.001), respectively. The bias corresponds to renal gadobutrol concentrations of 8 nmol/g tissue (cortex) and 4 nmol/g tissue (medulla), ie, ~2.4 μmol for both kidneys (0.05% of original dose). ΔT1 correlated in the gadolinium group with duration between acquisitions for both cortex (regression coefficient (β) 16.5 msec/day, R2 0.50, P < 0.001) and medulla (β 11.5 msec/day, R2 0.32, P < 0.001). Medullary ΔT1 correlated with eGFR (β 1.13 msec/(ml/min) R2 0.25, P = 0.008).
Data Conclusion
We found evidence of delayed renal gadobutrol excretion after a single contrast agent administration in subjects with normal renal function. Even within this healthy population, elimination delay increased with decreasing kidney function.
Level of Evidence: 3
Technical Efficacy: Stage 3
J. Magn. Reson. Imaging 2020;52:622–631.
Keywords: contrast agent, T1 mapping, kidney, MRI, gadolinium, gadobutrol
GADOLINIUM‐BASED CONTRAST AGENTS (GBCAs) are widely used in magnetic resonance imaging (MRI). However, since an association between GBCAs and nephrogenic systemic fibrosis (NSF) was described in 2005–2006,1, 2 the use of GBCAs in subjects with severe renal disease has been avoided. NSF was mainly associated with linear GBCAs, with typically lower kinetic stability compared to macrocyclic GBCAs.3 Therefore, in Europe linear GBCAs have largely been abandoned in favor of macrocyclic GBCAs.3 These preventive measures were effective. Since 2008, NSF has been practically eliminated.4 However, in 2014, a report was published suggesting long‐term deposition of GBCAs in the dentate nucleus and globus pallidus,5 which was later confirmed by postmortem investigation of brains from patients (with median estimated glomerular filtration rate [eGFR] 88 mL/min/1.73 m2) who underwent repeated contrast‐enhanced MR exams.6 Other investigators have reported gadolinium deposition in bone7 and skin8 of subjects without renal damage after contrast‐enhanced MR exams. Thus far, the clinical importance of this deposition is unknown. Gadolinium deposition has never been linked to adverse effects in well‐controlled studies. Apart from NSF, for which the link to linear GBCAs is well established, some chronic nonallergic symptoms have been reported in a small number of patients in uncontrolled observational studies.3 Most evidence originates either from retrospective data9 or from studies focused on immediate adverse reactions with short follow‐up.10 Some large observational studies with longer follow‐up (4–20 months) have focused on the development of NSF, but did not include endpoints associated with gadolinium deposition in other organs, like neurotoxicity.11, 12, 13
Most GBCAs are cleared almost exclusively via the kidneys, with the exception of those agents specifically designed for liver imaging, which are partially cleared via the hepatobiliary system.14 In male, healthy subjects, 98% of gadobutrol was excreted within 12 hours.15 For extracellular contrast agents like gadobutrol, the plasma concentration was initially described by a two‐phase pharmacokinetic model. A distribution phase over the entire extracellular volume with a sharp decline in contrast agent is followed by a slower, exponential decay in the (renal) clearance phase.14 Extracellular GBCAs are typically freely filtered, with a clearance rate which equals the GFR.14 However, this model was not compatible with the above‐mentioned reports of long‐term deposition. Based on animal data and retrospective analysis of urine collections in humans, the existence of a so‐called deep compartment was proposed, possibly bone, from which GBCA is slowly released.16 However, "to date, no clinical study allows to assess the pharmacokinetics of the GBCAs in human bone" according to Lancelot.16 As far as the authors are aware, apart from case reports, indeed no additional studies have been published on long‐term GBCA pharmacokinetics in humans, so this model has yet to be confirmed.
Renal multiparametric MRI, including quantitative dynamic contrast‐enhanced (DCE) MRI, is increasingly being studied as a diagnostic method in renal parenchymal diseases. To validate this method, we recently performed a repeatability study in healthy volunteers using a comprehensive renal MRI protocol. The scan protocol included, among others, T1 mapping of the kidney before contrast media injection (native or precontrast T1) and DCE imaging. Unexpectedly, a systematic negative bias in the repeated T1 measurements of the kidney was observed. Since gadobutrol is designed to induce a T1 decrease, this difference might be explained by the presence of trace amounts of remaining contrast agent from gadobutrol (a macrocyclic GBCA) injection during the previous scan session. However, such a finding would be unexpected, since the plasma half‐life of gadobutrol is reported to be around 1.8 hour.17 Assuming an extracellular volume of 15L and an initial dose of 4 mmol, a plasma concentration of around 3*10‐23 nmol/mL would be expected after a week (~93 half‐lives), which is virtually nothing. The presence of trace amounts of gadobutrol after a week therefore would contradict the two‐phase pharmacokinetic model and support the hypothesis of higher‐order kinetics. Therefore, this study aims to find evidence for the presence of gadobutrol in the kidneys up to 1 week after administration in healthy volunteers.
Materials and Methods
The analyses were performed on two human datasets. The first dataset was acquired as part of the ReMaRK study (Repeatability of functional Magnetic Resonance imaging of the Kidneys) to assess interscan repeatability of a multiparametric renal MRI examination that included contrast agent administration and was used retrospectively in this analysis.18 The second control dataset was acquired prospectively, to provide repeatability T1 measurements in volunteers scanned without contrast agent. For acquisition of both datasets, permission from the local Institutional Review Board was obtained and all volunteers signed informed consent. Furthermore, phantom measurements were performed to assess the limit of detection of gadobutrol by MR‐based T1 mapping.
ReMaRK Dataset
The ReMaRK dataset consisted of 19 healthy volunteers, aged 40 years or older and without a history of kidney disease, who were included between March and November 2018 (Fig. 1). Data of insufficient image quality were excluded. All subjects were examined twice on the same 3T MR system (Ingenia, Philips Healthcare, Best, the Netherlands; software release 5.3.1) with a 4–16 day interval between sessions. Blood was sampled prior to the first scan session to determine kidney function (creatinine and cystatin C). eGFR was calculated using the CKD‐EPI equation (Chronic Kidney Disease EPIdemiology collaboration19) using both cystatin C and creatinine. For cystatin C levels, the average of two measurements from a single plasma sample were used. All scan sessions for each volunteer were performed at the same time of the day, usually in the late afternoon. Subjects were asked to drink two liters of nonalcoholic liquids spread out over the day of the scan and to avoid salt‐ and protein‐rich meals on the day of examination.
Figure 1.
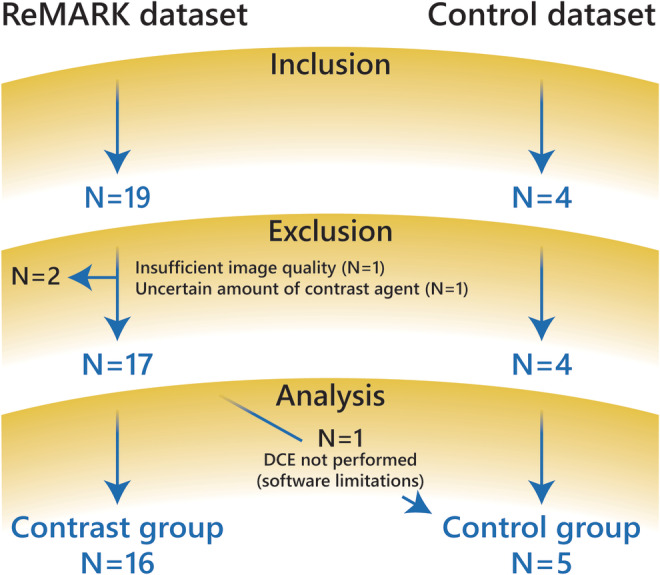
Flowchart of patient population for both datasets.
Control Dataset
The control dataset consisted of four healthy volunteers, aged 40 years or older and without a history of kidney disease, who were included in June and July 2019 (Fig. 1). Subjects were examined on the same 3T MR system as described above using the same protocol for T1 mapping, with a 7 or 8 day interval. Again, scan sessions were performed in the late afternoon and with identical dietary instructions as described above.
MRI Protocol and Processing
The ReMaRK dataset included, among other sequences, an initial survey, native T1 mapping, T1‐weighted anatomical Dixon imaging, and DCE renal perfusion imaging. The control dataset included only the survey and T1 mapping using the same protocol as the ReMaRK dataset.
The T1 map was acquired using an adiabatic spatially nonselective inversion pulse (hyperbolic secant) followed by a multislice readout, where the order of the slices was cycled after each repetition time to obtain multiple inversion time data for all slices.20, 21 The scan was performed under synchronized breathing, where the subjects breathe between the readouts. Detailed scan parameters of the survey, the T1 map, and the T1‐weighted anatomical Dixon are provided in Table 1. During DCE imaging, which was performed last, a half‐dose (0.05 mL/kg) of gadobutrol was injected at a rate of 1 mL/min followed by a 20‐mL saline flush at the same rate.
Table 1.
Scan Parameters
| Survey | T1‐weighted Dixon | T1 map | |
|---|---|---|---|
| Sequence | 2D balanced GE | 3D dual echo GE with Dixon reconstruction of water only images | Inversion recovery with 2D multislice GE readout |
| Fast imaging | NA | NA | EPI |
| Inversion pulse | NA | NA | Hyperbolic secant |
| Inversion times (msec) | NA | NA | 55; 253; 451; 649; 847; 1045; 1243; 1441; 1639; 1837; 2035a |
| TE (msec) | 1.4 | 3.5; 4.6 | 22 |
| TR (msec) | 2.8 | 7.5 | 6500 |
| Flip angle (degrees) | 25 | 8 | 90 |
| Orientation | Coronal | Coronal oblique | Coronal oblique |
| Slices | 10 | 35 | 11a |
| Voxel size (mm) | 2x1.56x10 | 1.5x1.5x3 | 3x3x6 |
| FOV (mm) | 450x450x145 | 320x400x70 | 244x244x76 |
| Slice gap (mm) | 5 | 0 | 1 |
| Acquisition time (sec) | 31 | 19 | 72 |
The first four subjects were scanned with seven slices and seven inversion times (105; 373; 641; 909; 1177; 1445; 1713 msec).
GE: gradient echo; EPI: echo planar imaging; TE: echo time; TR: repetition time; NA: not applicable.
Image processing was performed using in‐house developed software in MatLab (MathWorks, Natick, MA, v. 2015b). The center of both kidneys was identified manually. Next, a wide crop was made automatically around both kidneys such that each kidney could be processed separately. The remaining processing was performed independently for the left and right kidneys. To correct for respiratory motion, images were registered per slice in a group‐wise manner using Elastix.22, 23, 24 Registration was aimed to optimize alignment of the slices with varying inversion times in a region of interest (ROI) encompassing the entire kidney. These ROIs were generated by a semiautomated approach based on k‐means clustering of the source data.25 After registration, the entire cortex and medulla were segmented again using the clustering. Segmentations were checked, and corrected if necessary, by one observer (A.B.) with 5 years of experience in renal imaging. T1 relaxation times were calculated by a monoexponential nonlinear least squares fit on the magnitude data26:
| (1) |
Here, |S| denotes the magnitude of the MR signal, k is a scaling factor including proton density and system gain, and TI is the inversion time. The lowest datapoint acquired around the zero‐crossing was excluded from the fit because of a low signal‐to‐noise ratio. Apart from mean T1 values for cortical and medullary ROIs, also corticomedullary differentiation (CMD) was calculated as defined as medullary T1 minus cortical T1.
To approximate the contrast agent concentration C, the following equation was used27:
| (2) |
Here, r1 denotes the T1 relaxivity of gadobutrol (4.6 mL/mmol/msec28). To calculate the proportion of the original dose retained in the kidneys, the kidney volume was required. This was measured by manual segmentation on T1‐weighted anatomical Dixon scans by the same observer (A.B.). To be able to roughly compare the control and gadolinium group in terms of renal health, for both groups the kidney length was measured on the survey.
Phantom Study
The aim of the phantom study was to find the detection limit, or lowest gadobutrol concentration which could be detected using T1 mapping. The phantom is depicted in Fig. 2. An insulated cylindrical container was filled with 2L of 0.9% saline. Four different concentrations of gadobutrol (100, 10, 1, and 0.1 nmol/mL dissolved in 0.9% saline) were obtained by serial dilution. Four 50‐mL tubes containing these solutions were placed inside the container. The container was placed in the scanner parallel to the orientation of the B0 field. All parts of the phantom were placed in a 38°C stove 3 hours in advance and the phantom was taken out of the stove just before the MRI exam to assure it would be at ~37°C during acquisition. The same T1 mapping protocol was used as for the human studies, but the slice orientation was axial instead of coronal. The phantom study was performed on the same 3T MR system as described above.
Figure 2.
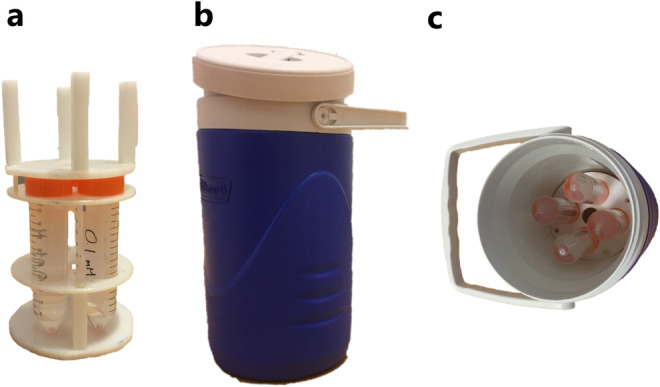
Setup of phantom experiment. (a) Four different solutions of gadobutrol were prepared in 50‐mL tubes placed in a holder. (b) The insulating container filled with 0.9% saline. (c) The holder inside the container.
Generally, a signal at the detection limit S det can be calculated as follows29:
| (3) |
where S blank is the mean blank (saline) T1 and sd blank and sd low are the standard deviation of the blank and the low concentration T1, respectively. In combination with Eq. (2) the detection limit can be calculated.
Statistical Analysis
Data are reported as mean ± standard deviation or median (interquartile range, IQR) where appropriate. To compare the T1 difference between the scan sessions (ΔT1) between the gadolinium and control group, a Mann–Whitney U‐test was used. Linear regression was performed to investigate the dependency of T1 difference on time between examinations and eGFR (not corrected for body surface area). Correlation between the T1 difference and eGFR was assessed only in the subgroup of volunteers scanned at an interval of precisely 7 days to avoid the influence of different washout periods. P < 0.05 was considered statistically significant. Statistical analyses were performed in R v. 3.4.4.30
Results
Clinical Study
A flow chart summarizing the study population for both the ReMaRK (n = 19) and control (n = 4) dataset is shown in Fig. 1. In the ReMaRK dataset, data of two subjects had to be excluded because of insufficient image quality (n = 1) and an uncertain amount of contrast agent due to problems with the intravenous access (n = 1). For analysis, a gadolinium and a control group were formed. The gadolinium group consisted solely of subjects of the ReMaRK dataset. The control group consisted of four subjects included in this group and one subject of the ReMaRK dataset who did not receive contrast agent. Therefore, the gadolinium and the control group consisted of 16 and 5 subjects, respectively (Fig. 1). All volunteers in the gadolinium group had an eGFR in the normal range. Baseline characteristics of both groups are provided in Table 2. Renal health in terms of kidney length and CMD was comparable in both groups. CMD in the T1 map was slightly lower in the control group but the difference was not statistically significant (P = 0.42). An example of a calculated T1 map including source data and segmentation of cortex and medulla is shown in Fig. 3.
Table 2.
Baseline Characteristics of Analyzed Study Population
| Gadolinium group | Control group | |
|---|---|---|
| N | 16 | 5 |
| Median age [year] | 50 (45–58) | 52 (48–59) |
| Median eGFR [mL/min/1.73m2] | 98 (88–102) | NA |
| Median scan interval [days] | 7 (7–7) | 7 (7–7) |
| Median cortical T1 | 1516 (1488–1548) | 1531 (1479–1555) |
| Median medullary T1 | 1862 (1837–1900) | 1864 (1810–1917) |
| Median CMD | 350 (332–376) | 334 (320–373) |
| Mean cortical volume | 103 ± 20 | NA |
| Mean medullary volume | 34 ± 6 | NA |
| Median kidney length* | 10.6 (10.1–11.0) | 10.5 (9.4–10.8) |
Data are reported as mean ± standard deviation or median (interquartile range).
Corrected for body length (kidney length / body length * 175 cm); NA: not available; CMD: corticomedullary differentiation, defined as medullary T1 minus cortical T1.
Figure 3.
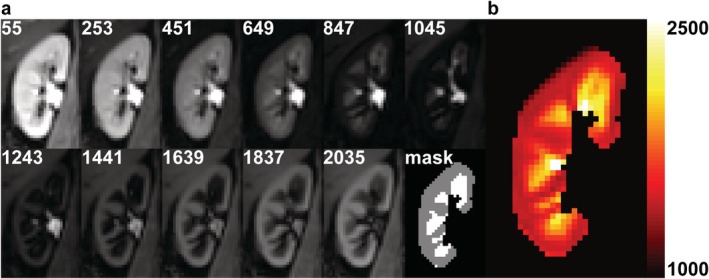
Example images of the right kidney from a healthy volunteer obtained at the first scan session. (a) T1 source images at multiple inversion times (in msec) after motion correction and the masks of the cortical and medullary segmentation. (b) Calculated corresponding T1 map. The color bar indicates T1 relaxation time in msec. Cortex and medulla can easily be discriminated thanks to the higher T1 in medulla compared to cortex.
The cortical and medullary T1 values at baseline and follow‐up are summarized in Fig. 4a, separately for the gadolinium and control group. The difference in T1 between baseline and follow‐up (ΔT1) differed significantly between the both groups (Fig. 4b). In the cortex, the median ΔT1 was –98 (IQR: –127 to –57) in the gadolinium group vs. 7 (IQR: –18 to 25) msec in the control group (P < 0.001). In the medulla, median ΔT1 in the gadolinium and control group were –68 (IQR: –94 to –27) msec vs. 19 (IQR: –34 to 53) msec, respectively (P = 0.001).
Figure 4.
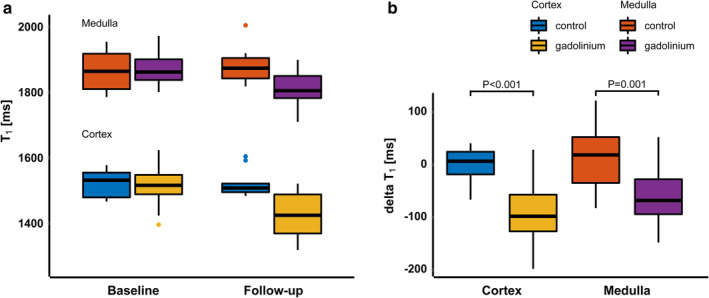
(a) Boxplots summarizing the T1 values in the gadolinium (n = 16) and control group (n = 5) at baseline and follow‐up. (b) boxplots of the ΔT1 for cortex and medulla and both for the gadolinium and control group. ΔT1 in the gadolinium group differed significantly from ΔT1 in the control group, both in cortex (P < 0.001) and medulla (P = 0.001).
Assuming the ΔT1 in the gadolinium group is caused by remaining contrast agent, the renal gadobutrol concentration can be estimated. For subjects scanned at a scan interval of 7 days (n = 12), a median ΔT1 of –98 (IQR: –120 to –66) msec and –69 (IQR: –94 to –46) msec was measured for cortex and medulla, respectively. This corresponds to a concentration of ~8 nmol/mL in the cortex and ~4 nmol/mL in the medulla, compared to an expected plasma concentration of 3*10‐23 nmol/mL in the conventional two‐phase pharmacokinetic model. Assuming a renal tissue density of 1 g/mL, this corresponds to a concentration of 8 nmol/g (cortex) and 4 nmol/g (medulla). Using the average cortical and medullary volumes of all 16 subjects in the gadolinium group (103 mL and 34 mL, respectively) and assuming a dose of 4 mmol (mean weight in this subgroup was 79 kg), we can calculate that ~0.05% of the original dose remained after 7 days in the kidneys (expected based on two‐phase pharmacokinetics 10‐26%).
It is expected that ΔT1 decreases and approaches zero with increasing scan interval if caused by slow elimination of gadobutrol. Therefore, ΔT1 dependence on the time interval between scan sessions (scan interval) was investigated in the gadolinium group. Four of the 16 subjects were scanned with intervals of 4, 5, 8, and 16 days for logistical reasons. Linear regression with the scan interval as predicting variable and ΔT1 as dependent variable (Fig. 5) yielded a regression coefficient of 16.5 msec/day (R2 0.49, P < 0.001) for the cortex and 11.5 msec/day (R2 0.30, P < 0.001) in the medulla.
Figure 5.
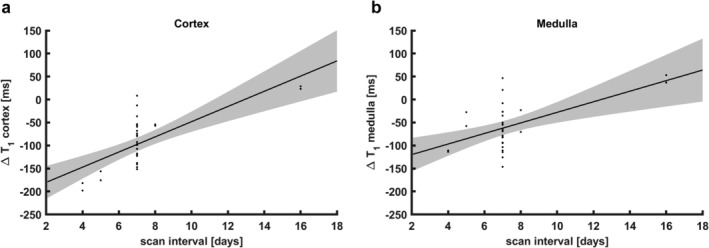
Regression analysis of the dependence of ΔT1 on scan interval in the gadolinium group (n = 16). Shaded areas denote the 95% confidence interval of the regression line. (a) Cortical ΔT1 values, R2 0.49, P < 0.001. (b) Medullary ΔT1 values, R2 0.30, P < 0.001.
Furthermore, in the subset of subjects in the gadolinium group scanned at an interval of 7 days (n = 12), ΔT1 correlated significantly with eGFR in the medulla (R2 0.25, P = 0.008, Fig. 6b), but not in the cortex (R2 0.11, P = 0.07, Fig. 6a).
Figure 6.
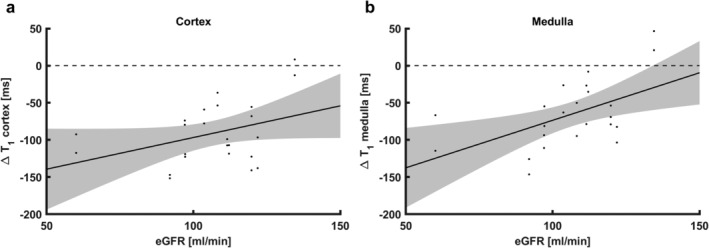
Scatterplots of ΔT1 vs. eGFR (not corrected for body surface area), for subjects in the gadolinium group scanned with a 7‐day interval only (n = 12). Shaded areas denote the 95% confidence interval of the regression line. (a) For cortical ΔT1, the correlation was not significant. (b) Medullary ΔT1 correlated significantly with eGFR (R2 0.25, P = 0.008). eGFR: estimated glomerular filtration rate.
Phantom Study
T1 maps of the two middle slices of the phantom are shown in Fig. 7a,b. Masks were drawn as shown in Fig. 7b, avoiding susceptibility artifacts caused by air bubbles and partial volume voxels. In Fig. 7c, the T1 distributions of the saline 0.9% and gadobutrol 0.1, 1, and 10 nmol/mL are shown. Fitting of an exponential model to these data yields a relaxivity of 3.1 mL/mmol/msec of gadobutrol in saline, which is slightly lower than the r1 in blood/plasma of 4.6 mL/mmol/msec.28 Mean T1 of the 100 nmol/mL solution was 1644 ± 19 msec (not shown in Fig. 7c). Using the mean and standard deviations of saline 0.9% (3311 ± 36 msec) and the 1 nmol/mL solution (3253 ± 14 msec), we find the T1 at the detection limit to be 3229 msec, which corresponds to a concentration of 2.5 nmol/ml (or 2.5 nmol/g assuming a tissue density of 1 g/mL) in saline. The detection limit in kidneys probably differs somewhat, given the difference in relaxivity and T1.
Figure 7.
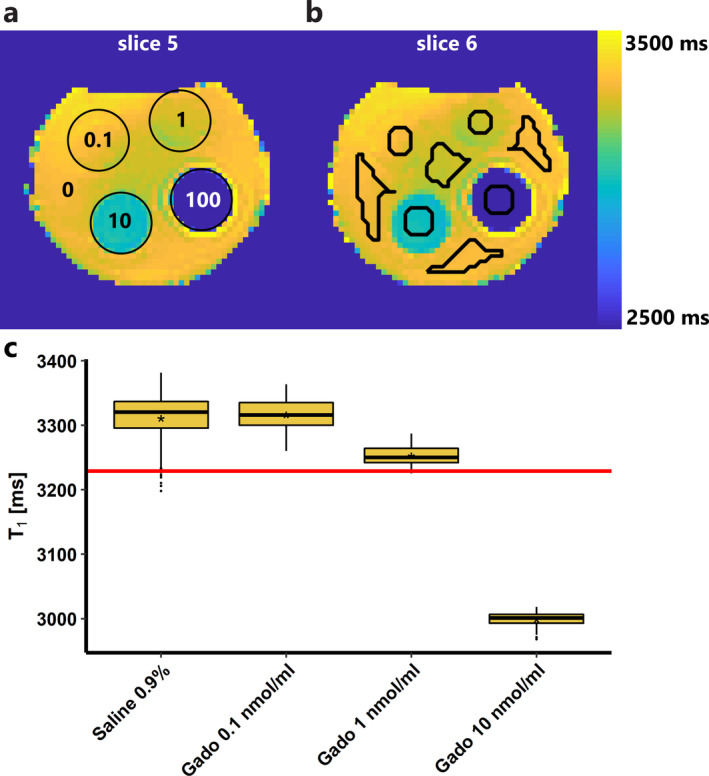
Results of phantom experiment. (a,b) T1 maps of the two middle slices of the phantom. T1 values across the phantom are not completely homogeneous due to inhomogeneity of the magnetic field. (a) The different tubes are denoted with circles and the gadobutrol concentrations are given in nmol/mL. The tubes are surrounded by saline 0.9%, denoted with a 0 (0 nmol/mL gadobutrol). (b) The ROIs (black lines) were drawn manually, carefully avoiding partial volume and susceptibility artifacts. (c) Boxplots of the T1 distribution inside each ROI. The mean is denoted with an asterisk (*). The red line denotes the detection limit; it corresponds to a concentration of 2.5 nmol/mL gadobutrol.
Discussion
In this study on renal T1 measurements before and ~7 days after gadobutrol administration in healthy volunteers, we observed a systematic negative bias in the second T1 measurement in the gadolinium group. Since this difference was absent in the control group, we consider the presence of traces of remaining contrast agent from the previous visit the only feasible explanation for this finding. Since the second scan was performed ~7 days after the first, this is not consistent with conventional two‐phase pharmacokinetics.17
The study was designed to rule out systematic differences between the first and second examination. All volunteers were scanned on the same scanner twice at the same time of the day. Physiological variation was minimized by roughly controlling diet and hydration. Moreover, if the observed differences were due to physiological variations, one would expect random and not systematic variation.
Apart from the absence of a T1 bias in the control group, the following reasons support the hypothesis of remaining contrast agent from the previous administration. First, GBCAs induce a decrease in T1 relaxation time, which we found. Second, a decrease of the T1 bias with time was demonstrated, possibly indicating gradual excretion. Third, it has been shown on retrospective data that GBCA elimination fits a three‐phase model.16 In this model, phases of distribution and elimination are followed by a slow residual elimination phase from a so‐called deep compartment, probably bone, with time constants ranging from 6–102 hours.16 Fourth, gadolinium deposition in the kidneys has been reported in animals (see below). Last, as a macrocyclic agent gadobutrol is relatively stable, and dissociation from its chelate is neither expected nor shown in either humans or animals. There is no clear evidence of cytotoxic changes induced by gadolinium deposits.31 Furthermore, with cytotoxicity, a T1 increase would be expected, due to edema of inflamed tissue. Therefore, we think that the negative ΔT1 can be attributed to small amounts of gadobutrol rather than to gadolinium‐induced cytotoxic tissue changes.
Renal deposition of gadobutrol has been shown in rats exposed to the equivalent of 80 human intravenous doses of various GBCAs over a 26‐day period.32 After one recovery week, GBCA‐exposed rats had elevated levels of gadolinium in renal, hepatic, splenic, and, to a lesser extent, neural tissue. This was more pronounced for linear than macrocyclic agents. Histological changes were only seen in the kidney, demonstrating diffuse epithelial vacuolization in the cortex with preserved glomerular architecture. For the (macrocyclic) agent gadoteridol; also signs of renal injury were seen despite lower tissue concentrations compared to gadobutrol and the linear agents. Another study exposed rats during a 5‐week period to the equivalent of 20 human doses of macrocyclic GBCAs.33 After a 4‐week recovery period, gadolinium was detected in kidneys, femur, and neural tissues but not in liver. Mean renal gadobutrol concentration was 139 nmol/g tissue. In comparison, the concentration of ~4–8 nmol/g tissue as found here seems reasonable given the 40‐fold lower dose. The phantom experiment indicates that gadobutrol concentrations in this range are detectable using MR‐based T1 mapping. In both kidneys combined, in the gadolinium group around ~2 μmol of gadobutrol remains after 7 days, while the prescribing information states that even in subjects with renal function impairment (eGFR 30–80 mL/min) the complete dose should be recovered in urine within 72 hours.17 Therefore, our findings support the existence of a slow residual elimination phase for gadobutrol.16
ΔT1was highest in the cortex. Although this is consistent with the report of cortical histological changes found mainly in the cortex of GBCA exposed rats,32 the gadobutrol dose we used was 160‐fold lower compared to this rodent study. Conversely, the lower medullary ΔT1 correlated strongly with eGFR, while this correlation was not significant in the cortex. Why this relation is more pronounced in the medulla is unclear.
A limitation of this study is that eGFR in the control group was not available. Since all subjects in this group were healthy, without any history of kidney disease, high blood pressure, or diabetes, their eGFR was assumed to be in the normal range. As a substitute measure for renal health, CMD in terms of T1 and kidney length as measured in the scout scans were reported. Kidney length was measured on the survey images and is likely an underestimation, since the survey was not necessarily aligned with the long axis of the kidney. Since the subjects in the control group did not receive gadobutrol it is unlikely that the repeated T1 measurements were influenced by their kidney function. Between the examinations, behavior of the subjects was neither restricted nor documented. Heavy exercise, for example, could potentially induce hematuria and consequently a decrease in T1. As the sample size of this study was limited, these preliminary results should be confirmed in a larger study, ideally also comparing multiple GBCAs. Furthermore, future work should include repeated T1 measurements in the same individual, possibly revealing a near‐exponential decay of T1, illustrating the gradual elimination of contrast agent. We chose not to perform an exponential analysis on our data because of the uneven distribution of timepoints and since only two measurements per subject were available. Longer‐term (≥2 weeks) follow‐up measurements can indicate when the contrast agent concentration drops below the detection limit. Ideally, plasma and urine collections should be available to detect and quantify gadolinium traces, possibly using inductively coupled plasma mass spectrometry. Without tissue samples, it cannot be ruled out that a process other than slow clearance of gadobutrol is responsible for the T1 difference. Last, the detection limit for gadobutrol in the phantom experiment likely differs somewhat from the actual detection limit in the kidney, due to the lower relaxivity of gadobutrol in saline and the long T1 of saline compared to renal tissue.
In conclusion, we found evidence of the prolonged presence of small amounts of gadobutrol in renal tissue after a single administration of GBCA in subjects with normal renal function, probably based on delayed elimination. Even in this healthy population, elimination delay increased with decreasing kidney function. This study adds to existing reports of gadolinium retention in brain, bone, and skin. However, it is important to underscore that to date there are no reports of adverse effects of macrocyclic contrast agents in subjects with normal renal function. Nevertheless, our data suggest that it would be wise to perform studies on long‐term safety. These studies should at least include renal endpoints, especially in patients with (mildly) decreased eGFR or patients receiving multiple GBCA administrations. Furthermore, little is known about the biodistribution and late pharmacokinetics of GBCAs in humans for the small fraction that remains after the initial phases of distribution and (renal) clearance. MRI‐based T1 mapping may prove to be a valuable tool to monitor GBCA biodistribution over time in vivo.
Acknowledgments
The authors thank Jeanine Prompers, Erik Huijing, and Katharina Milde for use of the phantom that they have developed. Anneloes de Boer was supported by an Alexandre Suerman stipend granted to MD‐PhD students by the University Medical Center Utrecht, the Netherlands. Clemens Bos and Anita A. Harteveld acknowledge funding from the Netherlands Organization for Scientific Research (14951).
References
- 1. Grobner T. Gadolinium—A specific trigger for the development of nephrogenic fibrosing dermopathy and nephrogenic systemic fibrosis? Nephrol Dial Transplant 2006;21:1104–1108. [DOI] [PubMed] [Google Scholar]
- 2. Marckmann P, Skov L, Rossen K, et al. Nephrogenic systemic fibrosis: Suspected causative role of gadodiamide used for contrast‐enhanced magnetic resonance imaging. J Am Soc Nephrol 2006;17:2359–2362. [DOI] [PubMed] [Google Scholar]
- 3. McDonald RJ, Levine D, Weinreb J, et al. Gadolinium retention: A research roadmap from the 2018 NIH/ACR/RSNA Workshop on Gadolinium Chelates. Radiology 2018;289:517–534. [DOI] [PMC free article] [PubMed] [Google Scholar]
- 4. Attari H, Cao Y, Elmholdt TR, Zhao Y, Prince MR. A systematic review of 639 patients with biopsy‐confirmed nephrogenic systemic fibrosis. Radiology 2019;292:376–386. [DOI] [PubMed] [Google Scholar]
- 5. Kanda T, Ishii K, Kawaguchi H, Kitajima K, Takenaka D. High signal intensity in the dentate nucleus and globus pallidus on unenhanced T1‐weighted MR images: Relationship with increasing cumulative dose of a gadolinium‐based contrast material. Radiology 2014;270:834–841. [DOI] [PubMed] [Google Scholar]
- 6. McDonald RJ, McDonald JS, Kallmes DF, et al. Intracranial gadolinium deposition after contrast‐enhanced MR imaging. Radiology 2015;275:772–782. [DOI] [PubMed] [Google Scholar]
- 7. Gibby WA, Gibby KA, Gibby WA. Comparison of Gd DTPA‐BMA (Omniscan) versus Gd HP‐DO3A (ProHance) retention in human bone tissue by inductively coupled plasma atomic emission spectroscopy. Invest Radiol 2004;39:138–142. [DOI] [PubMed] [Google Scholar]
- 8. Roberts DR, Lindhorst SM, Welsh CT, et al. High levels of gadolinium deposition in the skin of a patient with normal renal function. Invest Radiol 2016;51:280–289. [DOI] [PubMed] [Google Scholar]
- 9. Olchowy C, Cebulski K, Lasecki M, et al. The presence of the gadolinium‐based contrast agent depositions in the brain and symptoms of gadolinium neurotoxicity — A systematic review. PLoS One 2017;12:e0171704. [DOI] [PMC free article] [PubMed] [Google Scholar]
- 10. Behzadi AH, Zhao Y, Farooq Z, Prince MR. Immediate allergic reactions to gadolinium‐based contrast agents: A systematic review and meta‐analysis. Radiology 2018;286:471–482. [DOI] [PubMed] [Google Scholar]
- 11. Soyer P, Dohan A, Patkar D, Gottschalk A. Observational study on the safety profile of gadoterate meglumine in 35,499 patients: The SECURE study. J Magn Reson Imaging 2017;45:988–997. [DOI] [PMC free article] [PubMed] [Google Scholar]
- 12. Amet S, Launay‐Vacher V, Clement O, et al. Incidence of nephrogenic systemic fibrosis in patients undergoing dialysis after contrast‐enhanced magnetic resonance imaging with gadolinium‐based contrast agents: The Prospective Fibrose Nephrogenique Systemique study. Invest Radiol 2014;49:109–115. [DOI] [PubMed] [Google Scholar]
- 13. McWilliams RG, Frabizzio JV, De Backer AI, et al. Observational study on the incidence of nephrogenic systemic fibrosis in patients with renal impairment following gadoterate meglumine administration: The NSsaFe study. J Magn Reson Imaging 2019. [Epub ahead of print]. [DOI] [PubMed] [Google Scholar]
- 14. Aime S, Caravan P. Biodistribution of gadolinium‐based contrast agents, including gadolinium deposition. J Magn Reson Imaging 2009;30:1259–1267. [DOI] [PMC free article] [PubMed] [Google Scholar]
- 15. Staks T, Schuhmann‐Giampieri G, Frenzel T, Weinmann HJ, Lange L, Platzek J. Pharmacokinetics, dose proportionality, and tolerability of gadobutrol after single intravenous injection in healthy volunteers. Invest Radiol 1994;29:709–715. [DOI] [PubMed] [Google Scholar]
- 16. Lancelot E. Revisiting the pharmacokinetic profiles of gadolinium‐based contrast agents: Differences in long‐term biodistribution and excretion. Invest Radiol 2016;51:691–700. [DOI] [PubMed] [Google Scholar]
- 17. Bayer Healthcare Pharmaceuticals . Highlights of prescribing information. Vol. 2019: US Food and Drug Administration; 2011. [Google Scholar]
- 18. de Boer A, Harteveld AA, Blankestijn PJ, et al. Renal multi‐parametric MRI: Ready to launch? A reproducibility study. In: Proc 27th Annual Meeting ISMRM, Montréal; 2019 (abstract 1204).
- 19. Inker LA, Eckfeldt J, Levey AS, et al. Expressing the CKD‐EPI (Chronic Kidney Disease Epidemiology Collaboration) cystatin C equations for estimating GFR with standardized serum cystatin C values. Am J Kidney Dis 2011;58:682–684. [DOI] [PMC free article] [PubMed] [Google Scholar]
- 20. Ordidge RJ, Gibbs P, Chapman B, Stehling MK, Mansfield P. High‐speed multislice T1 mapping using inversion‐recovery echo‐planar imaging. Magn Reson Med 1990;16:238–245. [DOI] [PubMed] [Google Scholar]
- 21. Clare S, Jezzard P. Rapid T(1) mapping using multislice echo planar imaging. Magn Reson Med 2001;45:630–634. [DOI] [PubMed] [Google Scholar]
- 22. Klein S, Staring M, Murphy K, Viergever MA, Pluim JP. Elastix: A toolbox for intensity‐based medical image registration. IEEE Trans Med Imaging 2010;29:196–205. [DOI] [PubMed] [Google Scholar]
- 23. Shamonin DP, Bron EE, Lelieveldt BP, Smits M, Klein S, Staring M. Fast parallel image registration on CPU and GPU for diagnostic classification of Alzheimer's disease. Front Neuroinform 2013;7:50. [DOI] [PMC free article] [PubMed] [Google Scholar]
- 24. Huizinga W, Poot DH, Guyader JM, et al. PCA‐based groupwise image registration for quantitative MRI. Med Image Anal 2016;29:65–78. [DOI] [PubMed] [Google Scholar]
- 25. de Boer A, Leiner T, Vink EE, Blankestijn PJ, van den Berg CAT. Modified dixon‐based renal dynamic contrast‐enhanced MRI facilitates automated registration and perfusion analysis. Magn Reson Med 2018;80:66–76. [DOI] [PMC free article] [PubMed] [Google Scholar]
- 26. Brown RW, Cheng YCN, Haacke EM, Thompson MR, Venkatesan R. Introductory signal acquisition methods: Free induction decay, spin echoes, inversion recovery, and spectroscopy In: Magnetic Resonance Imaging Physical Principles and Sequence Design, 2nd ed. Hoboken, NJ: John Wiley & Sons; 2014. p 113–136. [Google Scholar]
- 27. Brown RW, Cheng YCN, Haacke EM, Thompson MR, Venkatesan R. Signal, contrast, and noise In: Magnetic Resonance Imaging Physical Principles and Sequence Design, 2nd ed. Hoboken, NJ: John Wiley & Sons; 2014. p 325–370. [Google Scholar]
- 28. Szomolanyi P, Rohrer M, Frenzel T, et al. Comparison of the relaxivities of macrocyclic gadolinium‐based contrast agents in human plasma at 1.5, 3, and 7 T, and blood at 3 T. Invest Radiol 2019;54:559–564. [DOI] [PMC free article] [PubMed] [Google Scholar]
- 29. Armbruster DA, Pry T. Limit of blank, limit of detection and limit of quantitation. Clin Biochem Rev 2008;29(Suppl 1):S49–52. [PMC free article] [PubMed] [Google Scholar]
- 30. R Development Core Team . R: A language and environment for statistical computing. R Foundation for Statistical Computing. Vienna, Austria: R Foundation for Statistical Computing; 2018. [Google Scholar]
- 31. Blumfield E, Swenson DW, Iyer RS, Stanescu AL. Gadolinium‐based contrast agents — Review of recent literature on magnetic resonance imaging signal intensity changes and tissue deposits, with emphasis on pediatric patients. Pediatr Radiol 2019;49:448–457. [DOI] [PubMed] [Google Scholar]
- 32. McDonald RJ, McDonald JS, Dai D, et al. Comparison of gadolinium concentrations within multiple rat organs after intravenous administration of linear versus macrocyclic gadolinium chelates. Radiology 2017;285:536–545. [DOI] [PubMed] [Google Scholar]
- 33. Bussi S, Coppo A, Botteron C, et al. Differences in gadolinium retention after repeated injections of macrocyclic MR contrast agents to rats. J Magn Reson Imaging 2018;47:746–752. [DOI] [PMC free article] [PubMed] [Google Scholar]


