

Abstract
The clinically successful adjuvant MF59 is used in seasonal influenza vaccines, which is proposed to enhance immunity by creating an immune‐competent microenvironment in the muscle that allows recruitment of immune cells that drive adaptive immune responses. Here, we examined whether the clinically successful adjuvants MF59/AddaVax could be used for subcutaneous use and how antigen delivery can be synergized with cellular dynamics at the vaccination site. Subcutaneous injection of AddaVax leads to thickening of the skin, characterized by a neutrophil‐monocyte recruitment sequence. Skin‐infiltrating CCR2+Ly6Chigh monocytes showed differentiation to CD11b+Ly6C+MHCII+CD11c+CD64+ monocyte‐derived DCs over time in the hypodermal layers of the skin, expressing high levels of CD209a/mDC‐SIGN. Surprisingly, skin thickening was accompanied with increased white adipose tissue highly enriched with monocytes. Analysis of the skin‐draining lymph nodes revealed early increases in neutrophils and moDCs at 12 hours after injection and later increases in migratory cDC2s. Subcutaneous vaccination with AddaVax enhanced antigen‐specific CD8+ and CD4+ T cell responses, while moDC targeting using antigen‐coupled CD209a antibody additionally boosted humoral responses. Hence, oil‐in‐water emulsions provide an attractive immune modulatory adjuvants aimed at increasing cellular responses, as well as antibody responses when combined with moDC targeting.
Keywords: adaptive immunity, dendritic cell, monocyte, vaccine
Abbreviations
- APC
antigen presenting cell
- cDC
conventional dendritic cell
- DC
dendritic cell
- Lin
lineage markers
- LN
lymph node
- LPS
lipopolysaccharide
- MoDC
monocyte‐derived dendritic cell
- tSNE
T‐distributed stochastic neighbor embedding
- WAT
white adipose tissue
1. INTRODUCTION
The adaptive immune system is critical for the success of both prophylactic and therapeutic vaccination. Our understanding of the specific processes needed to initiate protective immunity to pathogens has significantly increased and encouraged the development of specified synthetic vaccine components. 1 Rational vaccine design has evolved as a result of advances in genetics, chemistry, and biological readouts. For example, high throughput sequencing of microbial genomes for the discovery of novel antigens combined with structural biology, a process termed “reverse vaccinology,” allows precise determination of vaccine components. 2 , 3 For these antigens to be effective components of the immune response, dendritic cells (DCs) are needed to induce adaptive immunity. 4 Indeed, DC targeting strategies have been explored and have shown major preclinical promise in boosting both T cell and B cell responses. 5 , 6 , 7 , 8 Activation of DCs is additionally required for proper antigen processing and presentation to T‐ and B cells. 9 As such, synthetic adjuvants aimed at the activation of DCs has been a critical component of defined next‐generation vaccine formulations. 1 The clinical efficacy of many vaccines are thought to be mediated by adjuvants, which induce inflammation at the injection site, DC recruitment and subsequent T‐/B cell priming. 10 For example, vaccination against influenza has shown to be widely successful, in part due to the potent adjuvants MF59. 11 , 12 MF59 is an oil‐in‐water solution based on the self‐lipid squalene, resulting in an adjuvant with an excellent safety profile. 13 MF59 is typically injected in the muscle combined with a vaccine antigen, boosting antigen‐specific antibody titers. 14 , 15 In children vaccinated with an inactivated influenza vaccine, administered with or without MF59, showed that MF59 enhanced flu‐specific multifunctional CD4+ T cells and antibody titers. 16 More importantly, 1 day after the vaccination, as measured in blood, transcriptional responses showed MF59‐specific enrichment of the innate response, including dendritic cell‐ and monocyte‐related transcriptional profiles. 16 Mechanistic studies in mice have shown that MF59 leads to ATP‐release in muscle cells and subsequent DC recruitment, CD4+ T cell priming, and humoral responses. 17 MF59 induces monocyte recruitment via the CCR2/CCL2 axis, antigen uptake, and presentation in the muscle‐draining lymph node. 18 , 19 , 20 Similar findings were recently reported in rhesus macaques. 21 Hence, MF59‐adjuvanted vaccines seem to act by recruiting innate immune cells to the injection site, which are able induce T cell activation in the muscle‐draining lymph node. We have previously shown that the MF59‐based adjuvant AddaVax is highly efficient as an adjuvants in a subcutaneous preclinical immunization setting when combined with antigen‐loaded bacterial inclusion bodies, 22 protein or an antibody‐based DC targeting strategy. 23 However, how the skin reacts to AddaVax in terms of immune cell dynamics remains unknown.
In this study, we investigate the immunological effect of AddaVax on the skin and the skin‐draining lymph node. Also, we hypothesized that the spatiotemporal dynamics of AddaVax‐induced immune cell recruitment would allow manipulation to optimize antigen delivery, DC differentiation, and subsequent adaptive immunity. Our data suggest that the MF59‐equivalent AddaVax (InvivoGen) effectively recruits monocytes to the skin, resulting in differentiation to CD11b+Ly6C+MHCII+CD11c+CD64+ monocyte‐derived DCs (moDCs) expressing high levels of CD209a/mDC‐SIGN. Skin‐infiltrating monocytes and moDCs could be targeted in a time‐dependent manner using CD209a‐targeting antibody, resulting in intact T cell responses and enhanced antibody titers.
2. MATERIALS AND METHODS
2.1. Mice
Wild‐type C57BL/6 mice were bred at the animal facility of VU University (Amsterdam, Netherlands) under specific pathogen‐free conditions and used at 8‐16 weeks of age. Female and male mice were equally divided among groups, unless stated otherwise. All experiments were approved by the Animal Experiments Committee of the VU University and performed in accordance with national and international guidelines and regulations.
2.2. Flow cytometry facilities and reagents
All flow cytometry experiments were performed at the Microscopy Cytometry Core Facility Amsterdam UMC, location VU (Amsterdam, Netherlands) using an X20 Fortessa flow cytometer (BD Biosciences). All antibodies were purchased from Biolegend, Miltenyi and eBioscience (Thermo Fisher), specifically: anti‐CD4 (Clone GK1.5), anti‐CD8 (Clone H35‐17.2), anti‐CD11b (Clone M1/70), anti‐B220 (Clone RA3‐6B2), anti‐Ly6C (Clone HK1.4), anti‐CD11c (Clone N418), anti‐NK1.1 (Clone PK136), anti‐CD45 (Clone 30‐F11), anti‐CD3 (Clone 145‐2C11), anti‐CD19 (Clone 6D5), anti‐CCR2 (Clone SA203G11), anti‐GR1 (Clone RB6‐8C5), anti‐CD209a (Clone MMD3), anti‐MHCII (Clone M5/114.15.2), anti‐CD64 (Clone X54‐5/7.1), anti‐CD86 (Clone GL‐1), anti‐mouse Ly6G/Ly6C (clone GR‐1), anti‐CD16/32 (Clone 93), Fixable viability dye‐eFluor 780 (Thermo Fisher). OVA257‐264‐H2‐Kb‐PE tetramers were a kind gift from Dr JW Drijfhout at the LUMC, Leiden, Netherlands.
2.3. Mouse tissue collection, digestion, and FACS staining
Mice were sacrificed and skin‐draining lymph nodes (LNs), spleen, and skin were obtained for further analysis. Skin‐draining lymph nodes were verified by the presence of migratory DCs after 100 μL adjuvant (25 μg agonistic CD40 (in house 1C10) in 1:1 AddaVax (InvivoGen)) injection subcutaneously in the skin. Skin biopsies were taken using 8 mm sterile dermal biopsy punches (KAI Medical). LNs, spleen and skin were cut small using sterile scissors in 385 µg/mL liberase TL (2WU) and incubated at 37°C for 20 minutes. Enzymes were deactivated using ice‐cold RPMI 1640 complete (10% FCS, 1% 50 U/mL penicillin, 50 μg/mL streptomycin, HEPES/EDTA). After digestion, cells were run through a 100 µm cell strainer and extensively washed before FACS staining. Cells were stained for 30 minutes at 4°C using only directly labeled primary antibodies and in the presence of 1 µg/mL anti‐CD16/32 antibody. After extensive wash with PBS, labeled cells were fixed at with 1% of PFA at 4°C for 15 minutes, washed and measured on the flow cytometer.
2.4. Flow cytometry analyses
Flow cytometry data were analyzed first using FlowJo analysis software. First, files were compensated using UltraComp eBeads (Thermo Fisher) microspheres labeled with the appropriate antibodies. Compensation was additionally verified using fluorescence‐minus‐one (FMO) controls for every single fluorochrome for every tissue type (equally pooled per group) on experimental samples. Next, gating was performed on a stable flow (time vs cell count), subsequently on viability dye‐negative/CD45‐positive cells and finally on single cells (FSC‐A/FSC‐H). The resulting cells were concatenated and exported per experimental group into an FCS. file and uploaded to the Cytobank online analysis platform (https://www.cytobank.org/). Using the ViSNE module, we generated tSNE plots per tissue type based on the following input and analysis settings: all cells (concatenated) per condition used up to 300.000 total, number of iterations = 3000, Perplexity = 50, Theta = 0.5. Cells were clustered by MHCII, CD11b, CD11c, CD209a, CD64, Ly6C, GR‐1, CCR2 expression. Next, we identified and manually gated subpopulations, as represented by the tSNE clustering analysis, to generate the subpopulations as represented in the graphs. After defining gating strategies, the individual experimental samples were similarly gated in FlowJo and statistics were exported to GraphPad Prism 7 for visualization.
2.5. Microscopy and histocytometry analysis
For imaging of skin biopsies, both light microscopy and fluorescence confocal microscopy was used. Tissue sections were cut at 16‐20 μM Mikrom HM 560 cryostat, fixed in 100% of acetone, stained, and analyzed with a LEICA DM6000 or Leica TCS SP8 equipped with a pulsed white light laser and HyD hybrid detector equipped with temporal gating. LAS AF software was used for acquisition and ImageJ for image processing subsequent to data acquisition. Huygens professional deconvolution software was used for deconvolution.
2.6. Histocytometry
Skin tissue was cryosectioned at 16 μM, and sections were rehydrated in 0.1 M of Tris buffer for 30 minutes and blocked with blocking buffer (0.1 M Tris buffer, 0.02% Triton X‐100, 1% normal mouse serum, anti‐CD16/32 blocking Ab, 1% BSA) for 1 hour. Tissue sections were stained with directly labeled primary antibodies in blocking buffer for 16 hours at 4°C. After an extensive wash with 0.1 M of Tris buffer, sections were mounted in Fluoromount‐G (Thermo Fisher). Nuclei were counterstained with JOJO‐1 Iodide (Thermo Fisher). Whole skin cross‐sections were acquired (voxel size y‐x = 240 nm, z = 1 μm) on a Leica TCS SP8 confocal microscope with tunable pulsed white‐light laser, 405 nm violet laser, and Leica HyD hybrid detectors. After acquisition, the tiled images were merged and compensated using the LAS X Merge and Channel Dye Separation module, respectively. Next, 3D stacked and compensated images were analyzed using histocytometry in Imaris 7.4 (Bitplane) and FlowJo as previously described (Gerner et al, 2012). In short, the segmentation of myeloid cells was obtained by first creating a masking channel by selecting for SIRPα+CD209a+ voxels. The expression of SIRPa, CD209a, MHCII, and CD11b on this masking channel was used as “true” expression of these markers. Next, this masking channel was used to segment and split individual cells of interest using the Imaris Surface Module (Bitplane). Next, individual surfaces were exported to FlowJo and used for gating and figure representation. Data shown are representative of three individual skin biopsies derived from individual mice.
2.7. Generation of ovalbumin‐coupled antibody
Anti‐DC‐SIGN (clone MMD3) antibodies were conjugated to ovalbumin (OVA; Calbiochem, Darmstadt, Germany) using the cross‐linking agent sulfosuccinimidyl‐4‐(N‐maleimidomethyl)‐cyclohexane‐1‐carboxylate according to the manufacturer's protocol (Pierce). Antibody‐conjugates were separated from reaction‐reductants using PD‐10 desalting columns (Pierce, Rockford, USA). The concentration of OVA and antibody was determined using the bicinchoninic acid assay (Pierce) and ELISA. The products were tested for endotoxins using the Limulus Amebocyte Lysate assay and a level of <0.5 EU/mL was deemed acceptable.
2.8. Immunization
Mice were subcutaneously or intradermally injected with endotoxin‐free 25 µg anti‐mDC‐SIGN:OVA, 100 µg OVA with 25 μg agonistic CD40 antibody (in house, clone 1C10) in 1:1 PBS/AddaVax emulsion according to manufacturer's instructions (InvivoGen) using BD Microfine insulin needles. The experiment reported in Figure 1E‐F comparing subcutaneous and intradermal injections was performed with a total volume of 50 µL. Preconditioning and immunization experiments were performed with subcutaneous injections of 100 µL volume. For functional readouts, spleens and blood were collected 7 days after vaccination.
Figure 1.
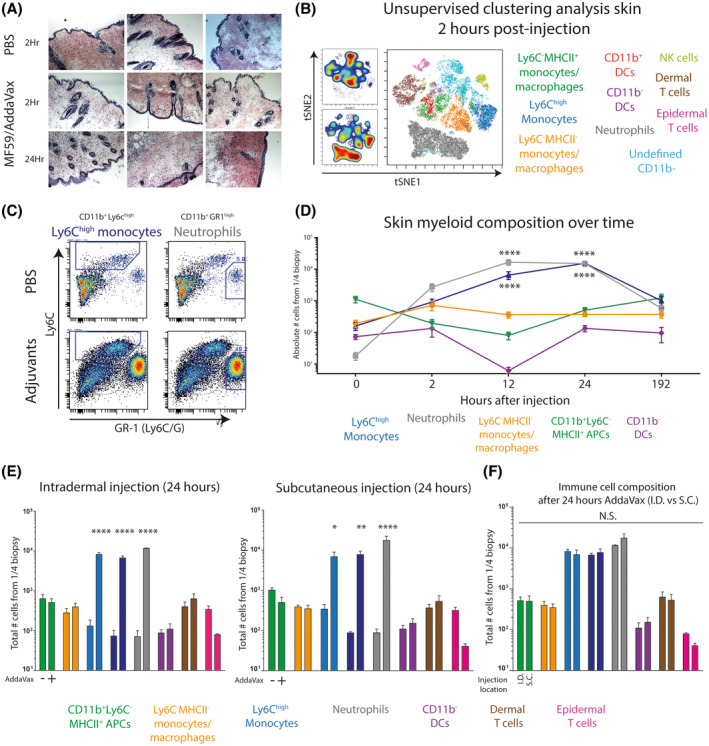
Injection of AddaVax in the skin of C57BL/6 mice results in skin thickening characterized by a neutrophil‐monocyte recruitment sequence A, Macroscopic thickening of the skin after subcutaneous AddaVax injection is caused by increased cell density and mass. B, Unsupervised flow cytometry analysis of single CD45+ immune cells derived from AddaVax‐treated skin 2 hours after injection C, Manual gating strategy of CD11b+ cells identifies Ly6Chigh monocytes and GR1high neutrophils D, Complete myeloid/APC skin composition over time after AddaVax injection. E, Immune composition of the skin 24 hours after subcutaneous or intradermal injection of AddaVax or PBS. F, Side by side comparison of the immune composition in the skin 24 hours after intradermal and subcutaneous injection of AddaVax. Data presented as mean ± SEM (N = 4/group) and representative of at least two individual experiments. Statistical analysis by two‐way ANOVA with Tukey post hoc multiple comparison
2.9. OVA‐specific antibody determination
To determine the antigen‐specific antibody response to the ovalbumin, NUNC MaxiSorp 96‐well plates (Thermo Fisher) were coated with 10 μg/ml purified ovalbumin (Sigma‐Aldrich) for 24 hours at 4°C in coating buffer in PBS. Next, plates were washed extensively with PBS/Tween 0.05% and additionally blocked with 1% of PBS/BSA. A dilution range of serum, obtained from vaccinated mice (on day 7 after vaccination) through a heart puncture, was incubated over night at 4°C. After washing, samples were incubated with anti‐mouse IgG‐biotin (and anti‐IgG1, 2, 3 isotypes) antibodies for 1 hour at RT and after wash incubated with HRP‐conjugated streptavidin for 1 hour at RT. Then, after washing, the ELISA plate was developed using TMB substrate buffer. Reaction was stopped when properly developed using 2N H2SO4 and extinction was measured at 450 nm using an iMark microplate reader (Bio‐Rad). Serum dilution of 1:400 showed the most consistent and reproducable signal to noise ratio. All samples were normalized with PBS as blanco. Secondary antibodies (1:2000) used: IgG1 115‐065‐205 (Jackson ImmunoResearch), IgG2a m32215 (Invitrogen), IgG2b ab97248 (Abcam), IgG3 1100‐08 (ITK), IgM 62‐6840 (Zymed), IgG 315‐065‐006 (Dianova), Streptavidin‐HRP p0397 (Dako).
2.10. Statistics
Statistics were performed using GraphPad Prism 7 software. For the comparison of two groups a student's t test was used. For more than two groups a two‐way analysis‐of‐variance (ANOVA) was used followed by a Tukey post hoc analysis to compare means between two groups. *P < .05, **P < .01, ***P < .001, ***P < .0001, data represented as mean ± SEM.
3. RESULTS
3.1. AddaVax sequentially induces neutrophil and monocyte recruitment to the skin
To investigate how the skin reacts to the MF59‐based oil‐in‐water emulsion AddaVax, we subcutaneously injected C57BL/6 mice with AddaVax:PBS (1:1) or PBS contralateral and collected skin biopsies for histochemistry and cytometry analysis. After 24 hours, macroscopic cellular thickening of the skin was observed, including redness of the skin, only in the AddaVax‐injected skin. Classical hematoxylin and eosin histochemical stain of cryosectioned skin biopsies from the injection site showed distinct increase in cellularity in the deeper layers of the skin (Figure 1A). In an effort to identify the cellular identity within the afflicted skin early in the process, we prepared single cell suspensions from skin biopsies 2 hours after injection. Unsupervised clustering analysis of multiplex flow cytometry data showed the increase of two populations in AddaVax‐treated skin (Figure 1B); neutrophils (in grey; Lin‐CD11b+GR1highSSChigh) and monocytes (in blue; Lin‐CD11b+Ly6Chigh). Classical Ly6C/Ly6G plots of CD11b‐positive myeloid cells confirmed the presence of neutrophils and monocytes in AddaVax‐treated skin (Figure 1C). Since the skin thickening was noticeably higher after 24 hours and myeloid cells were mainly attracted, we aimed to define the changes in myeloid cell and DC composition within the skin over time. Mice were subcutaneously injected with AddaVax emulsion and skin biopsies were collected 0, 2, 12, 24 hours and 7 days after injection for flow cytometry analysis. Interestingly, within 2 hours after injection neutrophils were highly abundant, followed by an increase of Ly6Chigh monocytes (Figure 1D). The increase of neutrophils and monocytes increased over time and peaked at 12 and 24 hours postinjection, respectively. The number of dendritic cells decreased between 2 and 12 hours, indicative of inflammation‐induced emigration from the skin to draining lymph nodes (Figure 1D). CD11b+ DCs were already emigrated within 2 hours, whereas emigration of CD11b− DCs occurred somewhat later, at 12 hours after injection. DCs were replenished in numbers in the AddaVax‐treated skin after 24 hours and returned to base line 7 days after injection (Figure 1D). It has been shown that intradermal injection of influenza vaccine could elicit similar responses to intramuscular injection while reducing the dose of vaccine. 24 Interestingly, intradermal injection elicited similar local immune infiltrates compared to subcutaneous injections with significantly increased neutrophils and monocytes 24 hours after injection (Figure 1E). No significant differences in immune cell number was observed between intradermal and subcutaneous injection (Figure 1F).
In summary, AddaVax induced early neutrophil recruitment in the skin, followed by infiltration of Ly6Chigh monocytes, marking a classical neutrophil‐monocyte sequence of epithelial inflammation. 25 DCs emigrate from the tissue upon AddaVax‐induced inflammation and are replenished after a day.
3.2. Skin‐infiltrating Ly6C+CCR2+ monocytes upregulate mDC‐SIGN/CD209a and differentiate to CD11c+MHCII+CD64+ moDCs expressing CD86
To characterize the myeloid and antigen presenting cell (APC) compartment in more detail, we performed additional multiplex FACS analysis at different time points (Figure 2A). Unsupervised clustering by tSNE of alive CD45+Lin‐CD11b+ cells identified several clusters, including the GR1high neutrophils and CD209a+CD64+Ly6Chigh monocytes (Figure 2B). Population density tSNE plots, show the emergence of neutrophils (red circle) and Ly6C+ monocytes over time (Figure 2C). A cluster of MHCII+ monocyte‐like cells could be observed in the tSNE cluster plot, prompting us to examine the CD11b+GR1high‐neg population in more detail. Ly6C/MHCII plots of the Lin‐CD11b+GR1high‐neg cells showed a characteristic monocyte‐to‐moDC "waterfall" differentiation trajectory, which increased over time (Figure 2D). Additional marker measurements showed increased CD86 and CD64 expression emerging around 12 hours after injection, indicative of monocyte‐derived dendritic cell (moDC) differentiation and activation. Absolute quantification of the differentiated moDCs showed a peak around 12 hours after injection which was sustained until at least 24 hours after injection (Figure 2E). Moreover, the differentiation of moDCs from monocytes at 12 hours after injection was characterized by a marked increase in CD209a (Figure 2F). Further manual gating on CD209a+CCR2+ cells confirmed Lin‐CD11b+Ly6C+CD209a+CCR2+ cells as infiltrating monocytes with moDC differentiation potential (Figure 2G). Of note, CD209a, CCR2, and CD64 show almost overlapping expression patterns (technical explanations were excluded), suggesting a common transcriptional driver of expression.
Figure 2.
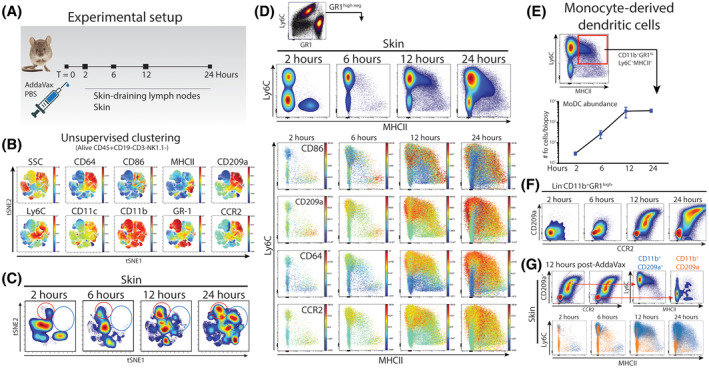
Skin‐infiltrating myeloid cell number and phenotype changes over time. A, To investigate changes in myeloid‐ and dendritic cell numbers and phenotypes, mice were subcutaneously injected with AddaVax and PBS on the contralateral side. At set time points after injection, skin and skin‐draining lymph nodes were isolated for further analysis B, Single cells analyzed using multiplex flow cytometry and tSNE unsupervised clustering on alive CD45+Lin− cells. C, Major differences in relative number of cell densities as defined by the tSNE algorithm in the AddaVax‐injected skin. D, Characterization of GR1high‐negative CD11b+ cells defines the dominance of monocytes and the differentiation to macrophages and DCs. E, Quantification of skin‐resident CD11b+Ly6C+MHCII+ moDCs over time after AddaVax injection F, Expression of CCR2 and CD209a on accumulating GR1high‐negative CD11b+ cells. G, CD209a defines infiltrating monocytes and moDCs (blue). Data presented as mean ± SEM (N = 4/group) and representative of two individual experiments
3.3. Skin‐infiltrating myeloid cells localize to the hypodermal layers of the skin and involves the local increase of white adipose tissue
Next, we aimed to localize the infiltrating myeloid cell populations within the skin by multiplex confocal microscopy and histocytometry analysis. 26 We stained snap‐frozen cryosections from AddaVax‐treated skin at 12 hours post‐injection with primary labeled antibodies for SIRPα (pan‐myeloid), CD11b, MHC class II, CD209a, and a nuclear counterstain. Using high resolution confocal microscopy, we generated multicolor three‐dimensional images and analyzed these by histocytometry. Using SIRPα/CD209a‐double positive voxels, we created “cells” that could be further differentiated through manual gating in flow cytometry analysis software like FlowJo (Figure 3A). Interestingly, distinguishing APC subsets among SIRPα/CD209a‐double positive cells using CD11b and MHCII expression showed localization of CD11b+SIRPα+CD209a+MHCII+ cells predominantly in the hypodermal layer where cellular accumulation occurs (Figure 3A). Within the hypodermal layers of the inflamed skin we observed enriched cellularity in the white adipose tissue. Indeed, 24 hours after AddaVax injection, a pronounced increase of white adipose tissue was observed in AddaVax‐injected skin compared to the contralaterally injected PBS of the same animal (Figure 3B). More detailed analysis of isolated adipose tissue showed highly increased immune infiltrates consisting of neutrophils and monocytes in a pattern similar to skin biopsies (Figure 3C). AddaVax induced the infiltration of monocytes differentiating into moDCs expressing CD209a, CCR2, CD64, and increasing levels of CD86 along the differentiation trajectory (Figure 3C). Quantification of cell numbers showed significant increases of neutrophils, monocytes, and differentiating moDCs in AddaVax conditions compared to PBS (Figure 3D). Hence, AddaVax induces the differentiation of monocytes to CD209a+ moDCs expressing the co‐stimulatory molecule CD86, as well as increased white adipose tissue characterized by infiltrating neutrophils and monocytes.
Figure 3.
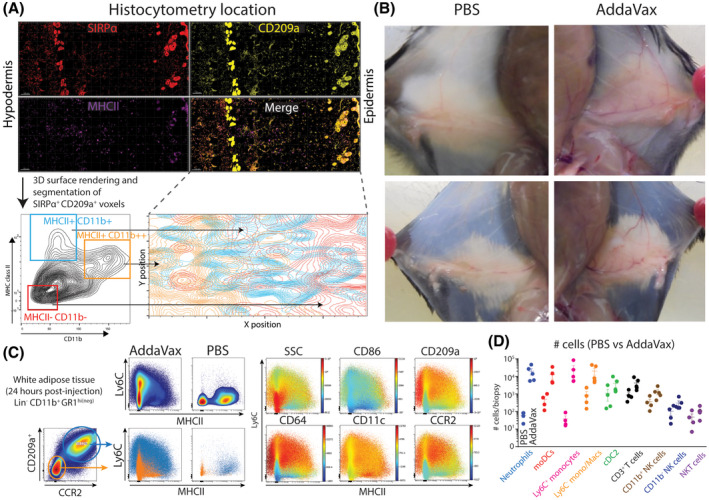
AddaVax‐induced skin thickening includes immune cell infiltration in white adipose tissue in the hypodermal layers. A, Multiplex confocal microscopy and histocytometry of AddaVax‐treated skin after 24 hours. B, Macroscopic changes in the skin shows increased vascularity and increased white adipose tissue 24 hours after subcutaneous injection of AddaVax (right side) compared to PBS (left side). C, Cell phenotype of accumulating myeloid cells in subcutaneous white adipose tissue at the site of AddaVax injection after 24 hours D, Quantification of cell types in subcutaneous white adipose tissue 24 hours after AddaVax or contralateral PBS injection. Data in D presented as mean ± SEM (N = 4/group) and representative of two individual experiments. Histocytometry analysis representative of skin biopsies from four individually analyzed mice
3.4. Neutrophils, moDCs, and cDC2s increase in the skin‐draining lymph nodes of AddaVax‐injected skin
Since AddaVax is used as an adjuvants with significant effects in the muscle‐draining lymph nodes, 21 we examined the myeloid cells and DCs in the skin‐draining lymph nodes by flow cytometry. Unsupervised clustering of Lin‐CD11b+ myeloid cells shows the dominance of cDC2s (expression of both CD11c and MHCII) and CD11b+Ly6C‐ monocytes/macrophages (Figure 4A). Density plots show little difference between PBS‐draining LNs and AddaVax‐draining LNs at 2 to 6 hours after injection (Figure 4B). Instead, between 12 and 24 hours, the contribution of cell populations within the myeloid compartment changed (Figure 4B). Ly6C/MHCII plots clarify these results, showing increased moDC presence at 12 hours post‐injection, as well as a marked increase in neutrophils (Figure 4C). Interestingly, this increase was highly time‐dependent, since the contribution of moDCs and neutrophils was returning to base line at 24 hours after injection (Figure 4C). Plotting expression of activation/lineage markers at 12 hours post‐injection shows the specific expression of CD64 on moDCs in the AddaVax‐draining LN (Figure 4D). CD86 is increased in moDCs further in the monocyte‐to‐DC differentiation trajectory, which is paralleled with an increase in granularity (SSC; Figure 4D). Hence, moDCs and neutrophils can be found in AddaVax‐draining LNs in a defined time window after AddaVax injection in the skin.
Figure 4.
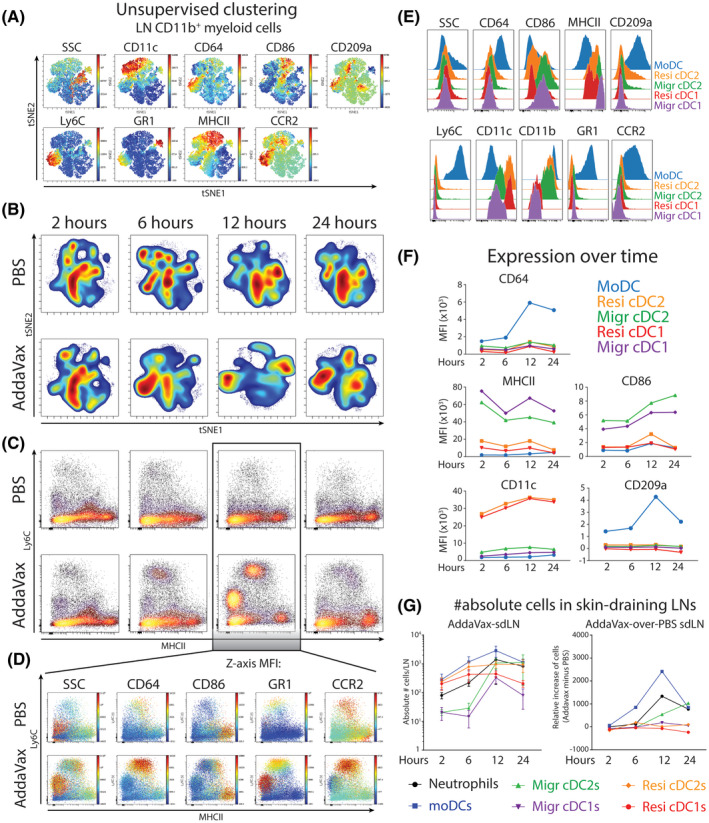
Neutrophils and MoDCs accumulate in the adjuvants‐draining lymph node in a time‐dependent manner. A, Single cells analyzed using multiplex flow cytometry and tSNE unsupervised clustering on alive CD45+Lin‐CD11b+ cells derived from skin‐draining inguinal lymph nodes (sdLN, data concatenated per experimental group). B, Cellular tSNE density plots of myeloid cells C, Ly6C/MHCII bimodal plots of LN‐resident myeloid cells. D, Phenotype of LN‐resident myeloid cells in the skin‐draining lymph node 12 hours after PBS or AddaVax injection. E, Expression of canonical markers on LN‐resident DC populations F, DC subset‐specific expression of markers over time after AddaVax injection. G, Absolute number of cells in the skin‐draining lymph node over time after AddaVax injection. N = 4 mice per group, data representative of two individual experiments
To examine the DC populations capable of stimulating T cells, we manually gated migratory cDC1s and cDC2s, resident cDC1s and cDC2s, and moDCs. Expression of CD64, CCR2, CD209a was most pronounced in moDCs as expected (Figure 4E), although some expression can be found on resident cDC2s, as previously reported. 23 Migratory cDC1s and cDC2s showed the highest potential to stimulate CD4+ T cells as evidenced by high expression of MHCII and CD86 (Figure 4E). Marker expression was regulated over time, since CD64 was clearly higher on moDCs at 12 hours after AddaVax injection (Figure 4F). CD86 was significantly increased on migratory cDCs in a time‐dependent manner and significantly higher expressed on migratory cDCs compared to moDCs. Importantly, the absolute number of DCs in the LN changed over time, specifically in AddaVax‐draining LNs (Figure 4G). More specifically, when contralateral PBS‐draining LNs were used as control, an increase in moDCs is evidenced at 6 and 12 hours after AddaVax injection (Figure 4G). Migratory cDC2s from the skin increased later, between 12 and 24 hours, in line with the emigration as measured in the skin (Figures 1D and 4G). In summary, between 6 and 12 hours moDCs increase in the AddaVax‐draining lymph node, upregulating CD209a, CD64, and CD86. Migratory cDC2 increase between 12 and 24 hours upregulating CD86.
3.5. AddaVax boosts T cell responses within a defined temporal window
Having precisely defined the cellular dynamics of skin and skin‐draining lymph nodes after AddaVax, we next hypothesized that skin/LN‐infiltrating moDCs could be targeted at a certain optimal time after AddaVax injection (ie, preconditioning of the vaccination site). We first preconditioned the vaccination site with AddaVax or PBS for 24 hours, before injecting either PBS, ovalbumin (OVA), OVA‐coupled antibody targeting CD209a (all in combination with αCD40 adjuvants; Figure 5A). This resulted in three vaccination conditions: 1. PBS preconditioning + vaccine, 2. PBS preconditioning + AddaVax/vaccine, and 3. AddaVax preconditioning + vaccine (Figure 5A). Seven days after the immunization, spleens were harvested, dissociated, and antigen‐specific CD8+ T cells were measured by OVA‐H2kb tetramer staining. Both OVA protein and CD209a‐targeting antibody vaccines‐induced antigen‐specific CD8+ T cells (condition 1; Figure 5B). The CD8+ T cell response was increased when AddaVax was directly combined with both OVA and CD209a‐targeting antibody (Condition 2; Figure 5B). Interestingly, the CD8+ T cell response was higher when the vaccination site was preconditioned for 24 hours with AddaVax (condition 3) compared to PBS preconditioning (condition 1), but not as pronounced as AddaVax as direct adjuvants (condition 2; Figure 5B). Splenocytes from immunized mice were restimulated with OVA‐derived short peptide and intracellular IFNγ was measured as a functional readout. CD8+ T cell responses to short peptide were similar to the tetramer staining (Figure 5C), and CD4+ restimulation showed similar responses compared to CD8 T cell responses (Figure 5D). Next, we measured OVA‐specific antibody responses in mice immunized under the same conditions. As previously shown, OVA‐specific IgG1, IgG2c, IgG3, and IgG2b antibody concentrations were highest when OVA was targeted to CD209a (red, condition 3; Figure 5E). 23 However, the timing of vaccine injection did not affect the OVA‐specific antibody response (Figure 5E). Hence, targeting CD209a+ moDCs induces both T and B cell responses with an increase in antibody production in a time‐dependent manner. In general, introducing the vaccine at the same time as AddaVax increased T cell responses, whereas preconditioning the vaccination site 24 hours before vaccine injection was less potent in inducing T cell responses.
Figure 5.
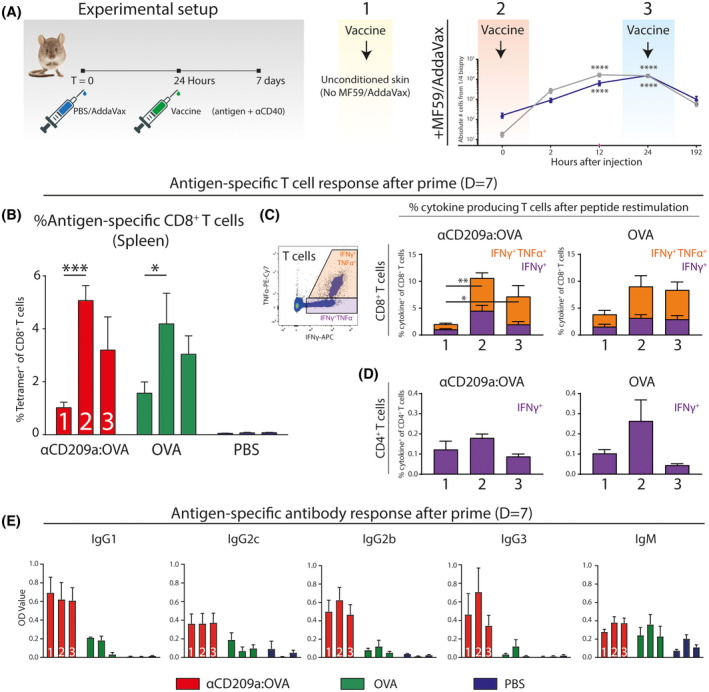
Increased T cell responses by AddaVax in combination with a DC targeting strategy has a critical time window. A, Mice (n = 5 per group) were locally preconditioned with PBS or AddaVax 24 hours prior to immunization with either ovalbumin‐coupled CD209a‐targeting antibody, ovalbumin, or PBS with agonistic CD40 adjuvants. B, Splenocytes of immunized mice stained with OVA‐H2‐kB tetramers and measured by flow cytometry. C, Splenocytes of immunized mice were restimulated with OVA‐derived CD8 epitope‐specific short peptide and subsequent intracellular cytokine staining for IFNγ and TNFα. D, Intracellular staining of IFNγ after restimulation with CD4 epitope‐specific short peptide. E, OVA‐specific antibody production in serum of immunized mice as measured by ELISA. N = 4‐5 mice per group, data presented as mean ± SEM and representative of two individual experiments (see also, Figure S1). Statistical analysis by two‐way ANOVA with Tukey post hoc multiple comparison within the 1‐3 conditions or one‐way ANOVA with Tukey post hoc multiple comparison
4. DISCUSSION
The successful seasonal and pandemic influenza vaccines are thought to mediate their function via monocyte‐derived APCs infiltrating the vaccination site in the muscle, taking up antigen and migrating to muscle‐draining lymph nodes for the activation of B‐ and T cells. 18 , 19 , 20 , 21 Whether a similar mode of action is possible in the more accessible skin and whether the immune‐competent microenvironment could be used and manipulated to aid rational vaccine design, is unexplored. We show that the clinically successful MF59‐derived oil‐in‐water emulsion AddaVax initiates a rapid neutrophil‐monocyte recruitment sequence in the skin. Whereas MF59 initiates the monocyte‐recruitment cycle via ATP‐release by muscle cells, 17 it remains to be determined which cell type initiates the neutrophil‐monocyte sequence in the skin. The expression of mDC‐SIGN/CD209a was defining for infiltrating CCR2+Ly6C+ classical monocytes and the differentiated moDCs. Similar local accumulation of CD209a+ monocyte‐derived APCs have been described in response to house dust mite, 27 systemic LPS, 28 colon inflammation, 29 and acutely inflamed skin. 30 The latter elegant study showed that epicutaneous application of the hapten 2,4‐dinitro‐1‐fluorobenzene (DNFB) led to acute infiltration of Ly6Chigh monocytes, differentiation to moDCs capable of migration to draining lymph nodes and activation of T cells. 30 The classification of moDCs remains a topic of debate, most likely because monocytes are highly plastic and often short‐lived cells with phenotypes largely determined by microenvironmental cues. 31 , 32 , 33 This has hampered the identification of DCs derived from monocytes in humans, 32 even though in vitro cultured moDCs are the most used DC type used in functional assays. 34 , 35 Segura and colleagues have described human moDCs isolated from ascites with DC transcriptional profiles and functionality, including antigen cross‐presentation to CD8+ T cells. 33 , 36 , 37 , 38 In terms of therapy, ex vivo cultured moDCs have been used as a cellular vaccination source for antitumor immunity. 39 , 40 While in situ targeting of dendritic cells has emerged as a promising vaccination strategy, 40 , 41 moDCs have been mostly neglected due to the lack of consensus in humans.
We show that monocytes infiltrating the AddaVax‐treated skin differentiate to moDCs expressing high levels of CD64 and CD209a within 12 hours after injection. It should be mentioned here that this acute differentiation into moDCs does not resemble the 6 to 7 day culture period of in vitro cultured moDCs. In parallel, the presence of moDCs in the LN peak around 12 hours after injection, whereas migratory cDC2s increase after 24 hours. Although moDCs increase in the skin‐draining lymph node, the skin and LN show similar increases over time, suggesting that accumulation in the skin does not necessarily precede accumulation in the LN due to active migration of moDC to the skin. Instead, monocytes are capable of entering the lymph node from the circulation and differentiate to moDCs able to activate CD8 T cells. 28 We have additionally explored the effect of moDC‐targeted and untargeted immunization (OVA‐coupled CD209a‐targeting antibody and OVA) at different times after monocyte/moDC recruitment. Boosting humoral responses has previously been shown to (partially) depend on moDCs by promoting the differentiation of follicular helper T cells. 42 Also, using elaborate human in vitro coculture systems, Gringhuis and colleagues have shown that targeting DC‐SIGN (CD209) on moDCs resulted in driving follicular helper T cell development and increased IgG production by B cells. 43 This is in line with our data showing that antigen targeted to skin‐ or LN‐infiltrating CD209a+ moDCs resulted in increased antibody responses. It is known that the time and location of dendritic cells within the lymph nodes are critical in generating adaptive immunity. 44 Interestingly, while moDCS have been shown to be poor stimulators of T cell proliferation (ie, the most common APC‐T cell readout), moDCs may be more potent in promoting T cell polarization, instead of T cell proliferation. 45 This may explain the relative decrease in T cell frequency and stable B cell responses when moDCs are targeted at the peak of abundancy in the skin. We have corroborated previously results showing CD209a expression on cDC2s in the lymph node 23 which may explain the intact T cell responses using CD209a‐targeting antibody (compared to untargeted approach) while increasing the humoral responses via moDCs. Finally, we have performed our functional immunization experiment including agonistic CD40 antibody (αCD40) as adjuvants accompanying the antigen (ie, vaccine). We have not considered the absence of αCD40, since this resulted in poor CD8+ T cell activation in combination with protein or peptide antigen (unpublished findings).
Of interest is the inflammation‐induced increase in white adipose tissue (WAT) around 24 hours after AddaVax injection. The inflamed WAT was highly enriched with neutrophils and monocytes, including differentiating moDCs. Infiltration of monocytes into tissue is mediated exclusively through local production of CCL2, attracting CCR2+ monocytes. 46 MF59 (AddaVax) has previous been shown to recruit monocytes in a CCR2‐dependent manner in the muscle. 20 In this regard, adipocytes in WAT have been shown to be major producers of CCL2, attracting Ly6Chigh monocytes upon inflammation. 47 , 48 It is likely that CCL2 is indispensable for monocyte recruitment after AddaVax injection in the skin and while it is tempting to hypothesize the WAT initiates the monocyte‐neutrophil recruitment sequence, both subcutaneous and intradermal injections led to similar immunological infiltrates. This suggests a different immediate target of AddaVax that initiates neutrophil‐monocyte recruitment within the first hours of AddaVax‐induced inflammation. It is possible endothelial cells produce CCL2 directly 49 or indirectly after smooth muscle cells in the larger arteries/venules are triggered to secrete ATP in a similar fashion to intramuscular injection of MF59. 17 WAT is additionally enriched with memory T cells crucial for the protection against infection. 50 While chronic inflammation in WAT is well described in obesity, little is known about the effect of acute inflammation, as induced by AddaVax. 51 We have shown that CD209a+ moDCs are preferentially located in the deeper layers of the skin where lymphatics are located partly in the presence of WAT. Hence, WAT may be directly involved in the late recruitment of monocytes, the differentiation to moDCs and the initiation of adaptive immune responses mediated by AddaVax.
In summary, we have reinforced the use of squalene‐based oil‐in‐water emulsions as a potent adjuvants in skin‐based immunizations aimed at increasing T cell responses and explored the immune cell composition in space and time upon AddaVax injection. Targeting moDCs and cDCs using antigen‐coupled CD209a‐targeting antibodies elicits robust cellular and humoral responses.
CONFLICT OF INTEREST
The authors declare no conflict of interest.
AUTHOR CONTRIBUTIONS
Conceptualization (S.S, YK), Formal Analysis (SS, LK), Investigation (SS, LK, MC), Methodology (SS, LK, JH YK), Project administration (SS, JH YK), Resources (LK, HK), Supervision (YK), Visualization (SS), Writing‐original draft (SS, YK), Writing‐review & editing (SS, JH, YK).
Supporting information
Fig S1
ACKNOWLEDGMENTS
STTS, LK, MC, HK, YK are supported by the European Research Council (ERC‐339977‐Glycotreat). MC is supported by the Hersen Tumor Fonds (20180625). JMM dH. is supported by the Dutch Cancer Society (VU2013‐5940 and VU2016‐10449). We thank the Microscopy and Cytometry Core Facility Amsterdam UMC, location VUmc (Amsterdam, Netherlands). In particular dr M. Popovic for expert technical microscopy support. We thank dr R. Germain, dr M. Gerner and dr A. Baptista (NIH/NIAID, Bethesda, US) for training and guidance in multiplex microscopy and histocytometry analysis. We thank dr J. Ochando (Mt. Sinai Hospital, New York, US) for providing materials.
Schetters STT, Kruijssen LJW, Crommentuijn MHW, Kalay H, den Haan JMM, van Kooyk Y. Immunological dynamics after subcutaneous immunization with a squalene‐based oil‐in‐water adjuvant. The FASEB Journal. 2020;34:12406–12418. 10.1096/fj.202000848R
DATA AVAILABILITY STATEMENT
Relevant data will be made available upon reasonable request to the authors.
REFERENCES
- 1. O’Hagan DT, Fox CB. New generation adjuvants—from empiricism to rational design. Vaccine. 2015;33:B14‐B20. [DOI] [PubMed] [Google Scholar]
- 2. Rappuoli R, Bottomley MJ, D’Oro U, Finco O, De Gregorio E. Reverse vaccinology 2.0: human immunology instructs vaccine antigen design. J Exp Med. 2016;213:469‐481. [DOI] [PMC free article] [PubMed] [Google Scholar]
- 3. Sette A, Rappuoli R. Reverse vaccinology: developing vaccines in the era of genomics. Immunity. 2010;33:530‐541. [DOI] [PMC free article] [PubMed] [Google Scholar]
- 4. Iwasaki A, Medzhitov R. Control of adaptive immunity by the innate immune system. Nat Immunol. 2015;16:343. [DOI] [PMC free article] [PubMed] [Google Scholar]
- 5. Caminschi I, Shortman K. Boosting antibody responses by targeting antigens to dendritic cells. Trends Immunol. 2012;33:71‐77. [DOI] [PubMed] [Google Scholar]
- 6. Palucka K, Banchereau J, Mellman I. Designing vaccines based on biology of human dendritic cell subsets. Immunity. 2010;33:464‐478. [DOI] [PMC free article] [PubMed] [Google Scholar]
- 7. Griffiths KL, Ahmed M, Das S, et al. Targeting dendritic cells to accelerate T‐cell activation overcomes a bottleneck in tuberculosis vaccine efficacy. Nat Commun. 2016;7:13894. [DOI] [PMC free article] [PubMed] [Google Scholar]
- 8. Bonifaz LC, Bonnyay DP, Charalambous A, et al. In vivo targeting of antigens to maturing dendritic cells via the DEC‐205 receptor improves T cell vaccination. J Exp Med. 2004;199:815‐824. [DOI] [PMC free article] [PubMed] [Google Scholar]
- 9. Dalod M, Chelbi R, Malissen B, Lawrence T. Dendritic cell maturation: functional specialization through signaling specificity and transcriptional programming. EMBO J. 2014;33:1104‐1116. [DOI] [PMC free article] [PubMed] [Google Scholar]
- 10. Lambrecht BN, Kool M, Willart MAM, Hammad H. Mechanism of action of clinically approved adjuvants. Curr Opin Immunol. 2009;21:23‐29. [DOI] [PubMed] [Google Scholar]
- 11. Krammer F, Palese P. Advances in the development of influenza virus vaccines. Nat Rev Drug Discov. 2015;14:167‐182. [DOI] [PubMed] [Google Scholar]
- 12. O’Hagan DT. MF59 is a safe and potent vaccine adjuvant that enhances protection against influenza virus infection. Expert Rev Vaccines. 2007;6:699‐710. [DOI] [PubMed] [Google Scholar]
- 13. O’Hagan DT, Ott GS, Nest GV, Rappuoli R, Giudice GD. The history of MF59® adjuvant: a phoenix that arose from the ashes. Expert Rev Vaccines. 2013;12:13‐30. [DOI] [PubMed] [Google Scholar]
- 14. Cruz‐Valdez A, Valdez‐Zapata G, Patel SS, et al. MF59‐adjuvanted influenza vaccine (FLUAD®) elicits higher immune responses than a non‐adjuvanted influenza vaccine (Fluzone®): a randomized, multicenter, Phase III pediatric trial in Mexico. Hum Vaccin Immunother. 2018;14:386‐395. [DOI] [PMC free article] [PubMed] [Google Scholar]
- 15. Belshe RB, Frey SE, Graham IL, et al. Immunogenicity of avian influenza A/Anhui/01/2005(H5N1) vaccine with MF59 adjuvant: a randomized clinical trial immunogenicity of an avian influenza vaccine immunogenicity of an avian influenza vaccine. JAMA. 2014;312:1420‐1428. [DOI] [PubMed] [Google Scholar]
- 16. Nakaya HI, Clutterbuck E, Kazmin D, et al. Systems biology of immunity to MF59‐adjuvanted versus nonadjuvanted trivalent seasonal influenza vaccines in early childhood. Proc Natl Acad Sci USA. 2016;113:1853‐1858. [DOI] [PMC free article] [PubMed] [Google Scholar]
- 17. Vono M, Taccone M, Caccin P, et al. The adjuvant MF59 induces ATP release from muscle that potentiates response to vaccination. Proc Natl Acad Sci USA. 2013;110:21095‐21100. [DOI] [PMC free article] [PubMed] [Google Scholar]
- 18. Seubert A, Monaci E, Pizza M, O’Hagan DT, Wack A. The adjuvants aluminum hydroxide and MF59 induce monocyte and granulocyte chemoattractants and enhance monocyte differentiation toward dendritic cells. J Immunol. 2008;180:5402‐5412. [DOI] [PubMed] [Google Scholar]
- 19. Calabro S, Tritto E, Pezzotti A, et al. The adjuvant effect of MF59 is due to the oil‐in‐water emulsion formulation, none of the individual components induce a comparable adjuvant effect. Vaccine. 2013;31:3363‐3369. [DOI] [PubMed] [Google Scholar]
- 20. Langlet C, Tamoutounour S, Henri S, et al. CD64 expression distinguishes monocyte‐derived and conventional dendritic cells and reveals their distinct role during intramuscular immunization. J Immunol. 2012;188:1751‐1760. [DOI] [PubMed] [Google Scholar]
- 21. Liang F, Lindgren G, Sandgren KJ, et al. Vaccine priming is restricted to draining lymph nodes and controlled by adjuvant‐mediated antigen uptake. Sci Transl Med. 2017:9:eaal2094. [DOI] [PubMed] [Google Scholar]
- 22. Schetters STT, Jong WSP, Kruijssen LJW, et al. Bacterial inclusion bodies function as vehicles for dendritic cell‐mediated T cell responses. Cell Mol Immunol. 2020;17:415‐417. [DOI] [PMC free article] [PubMed] [Google Scholar]
- 23. Schetters STT, Kruijssen LJW, Crommentuijn MHW, et al. Mouse DC‐SIGN/CD209a as target for antigen delivery and adaptive immunity. Front Immunol. 2018;9:e990. [DOI] [PMC free article] [PubMed] [Google Scholar]
- 24. Kenney RT, Frech SA, Muenz LR, Villar CP, Glenn GM. Dose sparing with intradermal injection of influenza vaccine. N Engl J Med. 2004;351:2295‐2301. [DOI] [PubMed] [Google Scholar]
- 25. Soehnlein O, Lindbom L, Weber C. Mechanisms underlying neutrophil‐mediated monocyte recruitment. Blood. 2009;114:4613‐4623. [DOI] [PubMed] [Google Scholar]
- 26. Gerner MY, Kastenmuller W, Ifrim I, Kabat J, Germain RN. Histo‐cytometry: a method for highly multiplex quantitative tissue imaging analysis applied to dendritic cell subset microanatomy in lymph nodes. Immunity. 2012;37:364‐376. [DOI] [PMC free article] [PubMed] [Google Scholar]
- 27. Plantinga M, Guilliams M, Vanheerswynghels M, et al. Conventional and monocyte‐derived CD11b+ dendritic cells initiate and maintain T helper 2 cell‐mediated immunity to house dust mite allergen. Immunity. 2013;38:322‐335. [DOI] [PubMed] [Google Scholar]
- 28. Cheong C, Matos I, Choi JH, et al. Microbial stimulation fully differentiates monocytes to DC‐SIGN/CD209 + dendritic cells for immune T cell areas. Cell. 2010;143:416‐429. [DOI] [PMC free article] [PubMed] [Google Scholar]
- 29. Zigmond E, Varol C, Farache J, et al. Ly6Chi monocytes in the inflamed colon give rise to proinflammatory effector cells and migratory antigen‐presenting cells. Immunity. 2012;37:1076‐1090. [DOI] [PubMed] [Google Scholar]
- 30. Tamoutounour S, Guilliams M, MontananaSanchis F, et al. Origins and functional specialization of macrophages and of conventional and monocyte‐derived dendritic cells in mouse skin. Immunity. 2013;39:925‐938. [DOI] [PubMed] [Google Scholar]
- 31. Schlitzer A, McGovern N, Ginhoux F. Dendritic cells and monocyte‐derived cells: two complementary and integrated functional systems. Semin Cell Dev Biol. 2015;41:9‐22. [DOI] [PubMed] [Google Scholar]
- 32. Schultze JL, Aschenbrenner AC. Systems immunology allows a new view on human dendritic cells. Semin Cell Dev Biol. 2019;86:15‐23. [DOI] [PubMed] [Google Scholar]
- 33. Segura E, Amigorena S. Inflammatory dendritic cells in mice and humans. Trends Immunol. 2013;34:440‐445. [DOI] [PubMed] [Google Scholar]
- 34. Goudot C, Coillard A, Villani A‐C, et al. Aryl hydrocarbon receptor controls monocyte differentiation into dendritic cells versus macrophages. Immunity. 2017;47:582‐596.e6. [DOI] [PubMed] [Google Scholar]
- 35. Sander J, Schmidt SV, Cirovic B, et al. Cellular differentiation of human monocytes is regulated by time‐dependent interleukin‐4 signaling and the transcriptional regulator NCOR2. Immunity. 2017;47:1051‐1066.e12. [DOI] [PMC free article] [PubMed] [Google Scholar]
- 36. Segura E, Touzot M, Bohineust A, et al. Human inflammatory dendritic cells induce Th17 cell differentiation. Immunity. 2013;38:336‐348. [DOI] [PubMed] [Google Scholar]
- 37. Tang‐Huau T‐L, Gueguen P, Goudot C, et al. Human in vivo‐generated monocyte‐derived dendritic cells and macrophages cross‐present antigens through a vacuolar pathway. Nat Commun. 2018;9:2570. [DOI] [PMC free article] [PubMed] [Google Scholar]
- 38. Segura E, Albiston AL, Wicks IP, Chai SY, Villadangos JA. Different cross‐presentation pathways in steady‐state and inflammatory dendritic cells. Proc Natl Acad Sci USA. 2009;106:20377‐20381. [DOI] [PMC free article] [PubMed] [Google Scholar]
- 39. Huber A, Dammeijer F, Aerts JGJV, Vroman H. Current state of dendritic cell‐based immunotherapy: opportunities for in vitro antigen loading of different DC subsets? Front Immunol. 2018;9:2804. [DOI] [PMC free article] [PubMed] [Google Scholar]
- 40. Palucka K, Banchereau J. Cancer immunotherapy via dendritic cells. Nat Rev Cancer. 2012;12:265‐277. [DOI] [PMC free article] [PubMed] [Google Scholar]
- 41. Unger WWJ, van Kooyk Y. ‘Dressed for success’ C‐type lectin receptors for the delivery of glyco‐vaccines to dendritic cells. Curr Opin Immunol. 2011;23:131‐137. [DOI] [PubMed] [Google Scholar]
- 42. Chakarov S, Fazilleau N. Monocyte‐derived dendritic cells promote T follicular helper cell differentiation. EMBO Mol Med. 2014;6:590‐603. [DOI] [PMC free article] [PubMed] [Google Scholar]
- 43. Gringhuis SI, Kaptein TM, Wevers BA, et al. Fucose‐based PAMPs prime dendritic cells for follicular T helper cell polarization via DC‐SIGN‐dependent IL‐27 production. Nat Commun. 2014;5:5074. [DOI] [PubMed] [Google Scholar]
- 44. Eisenbarth SC. Dendritic cell subsets in T cell programming: location dictates function. Nat Rev Immunol. 2019;19:89‐103. [DOI] [PMC free article] [PubMed] [Google Scholar]
- 45. Chow KV, Lew AM, Sutherland RM, Zhan Y. Monocyte‐derived dendritic cells promote Th polarization, whereas conventional dendritic cells promote Th proliferation. J Immunol. 2016;196:624‐636. [DOI] [PubMed] [Google Scholar]
- 46. Dyer DP, Medina‐Ruiz L, Bartolini R, et al. Chemokine receptor redundancy and specificity are context dependent. Immunity. 2019;50:378‐389.e5. [DOI] [PMC free article] [PubMed] [Google Scholar]
- 47. Kanda H, Tateya S, Tamori Y, et al. MCP‐1 contributes to macrophage infiltration into adipose tissue, insulin resistance, and hepatic steatosis in obesity. J Clin Invest. 2006;116:1494‐1505. [DOI] [PMC free article] [PubMed] [Google Scholar]
- 48. Juge‐Aubry CE, Henrichot E, Meier CA. Adipose tissue: a regulator of inflammation. Best Pract Res Clin Endocrinol Metab. 2005;19:547‐566. [DOI] [PubMed] [Google Scholar]
- 49. Lee HY, Lee SY, Kim SD, et al. Sphingosylphosphorylcholine stimulates CCL2 production from human umbilical vein endothelial cells. J Immunol. 2011;186:4347‐4353. [DOI] [PubMed] [Google Scholar]
- 50. Han S‐J, Glatman Zaretsky A, Andrade‐Oliveira V, et al. White adipose tissue is a reservoir for memory T cells and promotes protective memory responses to infection. Immunity. 2017;47:1154‐1168.e6. [DOI] [PMC free article] [PubMed] [Google Scholar]
- 51. Cox AR, Chernis N, Masschelin PM, Hartig SM. Immune cells gate white adipose tissue expansion. Endocrinology. 2019;160:1645‐1658. [DOI] [PMC free article] [PubMed] [Google Scholar]
Associated Data
This section collects any data citations, data availability statements, or supplementary materials included in this article.
Supplementary Materials
Fig S1
Data Availability Statement
Relevant data will be made available upon reasonable request to the authors.