

Abstract
Background
Difficulties with facial expression processing may be associated with the characteristic social impairments in individuals with autism spectrum disorder (ASD). Emotional face processing in ASD has been investigated in an abundance of behavioral and EEG studies, yielding, however, mixed and inconsistent results.
Methods
We combined fast periodic visual stimulation (FPVS) with EEG to assess the neural sensitivity to implicitly detect briefly presented facial expressions among a stream of neutral faces, in 23 boys with ASD and 23 matched typically developing (TD) boys. Neutral faces with different identities were presented at 6 Hz, periodically interleaved with an expressive face (angry, fearful, happy, sad in separate sequences) every fifth image (i.e., 1.2 Hz oddball frequency). These distinguishable frequency tags for neutral and expressive stimuli allowed direct and objective quantification of the expression‐categorization responses, needing only four sequences of 60 s of recording per condition.
Results
Both groups show equal neural synchronization to the general face stimulation and similar neural responses to happy and sad faces. However, the ASD group displays significantly reduced responses to angry and fearful faces, compared to TD boys. At the individual subject level, these neural responses allow to predict membership of the ASD group with an accuracy of 87%. Whereas TD participants show a significantly lower sensitivity to sad faces than to the other expressions, ASD participants show an equally low sensitivity to all the expressions.
Conclusions
Our results indicate an emotion‐specific processing deficit, instead of a general emotion‐processing problem: Boys with ASD are less sensitive than TD boys to rapidly and implicitly detect angry and fearful faces. The implicit, fast, and straightforward nature of FPVS‐EEG opens new perspectives for clinical diagnosis.
Keywords: Autism, electroencephalography, facial emotion processing, fast periodic visual stimulation, implicit expression detection
Introduction
Facial emotion processing in ASD
Quick and adequate facial emotion processing is important for successful everyday social interactions, which is a daily struggle for many individuals with autism spectrum disorder (ASD), who are characterized by impaired social communication and interaction, including deficits in nonverbal communicative behavior (American Psychiatric Association, 2014). As difficulties in recognizing others' emotions are thought to contribute (partially) to the social deficits typically encountered in ASD (Gaigg, 2012), facial emotion processing has been investigated in an abundance of studies using different research techniques. However, results from these studies do not allow drawing consistent conclusions.
The results of behavioral face processing studies are mixed in terms of group differences between children, adolescents, and adults with ASD versus typically developing (TD) individuals (Lozier, Vanmeter, & Marsh, 2014; Uljarevic & Hamilton, 2013), ranging from intact emotion processing in ASD groups (Lacroix, Guidetti, Rogé, & Reilly, 2014; Tracy, Robins, Schriber, & Solomon, 2011), over emotion‐specific impairments for negative (Whitaker, Simpson, & Roberson, 2017; Wingenbach, Ashwin, & Brosnan, 2017) or positive (Griffiths et al., 2017; Law Smith, Montagne, Perrett, Gill, & Gallagher, 2010) expressions, to a general emotion recognition deficit (Evers, Steyaert, Noens, & Wagemans, 2015; Xavier et al., 2015). These highly variable results may reflect the phenotypic heterogeneity in ASD but may also result from the variability and limited sensitivity of (certain) behavioral measures (Harms, Martin, & Wallace, 2010).
Electroencephalography (EEG) studies investigating the neural underpinnings of facial emotion processing in ASD also report inconsistent results. Some studies describe similar neural patterns in children and adolescents with ASD compared to typically developing controls (O'Connor, Hamm, & Kirk, 2005; Wong, Fung, Chua, & McAlonan, 2008). Others, however, have reported distinct neural responses in ASD groups, with smaller amplitudes and/or longer latencies for different ERP components, such as P100 (Batty, Meaux, Wittemeyer, Rogé, & Taylor, 2011), N170 (Batty et al., 2011; Hileman, Henderson, Mundy, Newell, & Jaime, 2011; Tye et al., 2014) or P200 (Dawson, Webb, Carver, Panagiotides, & Mcpartland, 2004). These neural group differences have been found for all six basic expressions, as well as for neutral faces (Black et al., 2017; Monteiro, Simões, Andrade, & Castelo Branco, 2017).
Fast periodic visual stimulation EEG
Recently, EEG has been combined with fast periodic visual stimulation (FPVS) to selectively capture implicit neural sensitivity to brief changes in facial expressions. FPVS‐EEG relies on the principle that brain activity synchronizes to a periodically flickering stimulus (Adrian & Matthews, 1934) and elicits a brain response at exactly the same frequency (Norcia, Appelbaum, Ales, Cottereau, & Rossion, 2015).
Similar to previous studies (Dzhelyova, Jacques, & Rossion, 2017; Poncet, Baudouin, Dzhelyova, Rossion, & Leleu, 2019), we applied this principle in a facial expression oddball paradigm, by periodically interleaving a rapidly presented stream of neutral faces with expressive faces. The periodic presentation at predefined frequency rates generates distinguishable frequency tags for the base and oddball stimuli, allowing direct quantification of the brain responses (Liu‐Shuang, Norcia, & Rossion, 2014). This makes FPVS‐EEG a highly objective measure. In addition, the rapid presentation enables a fast acquisition of many neural responses indexing expression discrimination in only a few minutes of recording. Furthermore, FPVS‐EEG allows the collection of reliable discriminative responses not only at a group level, but also at an individual level, allowing more insight in the heterogeneity within the autism spectrum.
Present study
With the present study, we consolidate and extend the findings of a lower neural sensitivity in school‐aged boys with ASD to rapidly detect fearful faces, as compared to matched TDs (Van der Donck et al., 2019). Here, by applying FPVS‐EEG with several facial emotions, we can broaden our understanding of the underlying neural nature of facial expression processing in ASD: Is this lower neural sensitivity emotion‐specific (e.g., only for fear) or general (i.e., generalizable to multiple expressions)?
We included angry, fearful, sad, and happy faces as oddball stimuli in rapidly presented streams of neutral faces. These neutral faces act as forward and backward masks for the expressive faces, allowing us to selectively isolate the sensitivity to the expressions by putting the emotional face processing system under tight temporal constraints (Dzhelyova et al., 2017), without the influences of mechanisms other than fast and automatic emotion extraction. Notwithstanding the inconsistencies in the ASD literature, group differences have most frequently been reported for negative expressions (Lozier et al., 2014; Uljarevic & Hamilton, 2013). Accordingly, and in line with the lower fear discrimination responses (Van der Donck et al., 2019), we mainly expect to observe lower neural sensitivity in the ASD group for fearful, angry, and sad faces.
Importantly, unlike our previous study (Van der Donck et al., 2019), we continuously changed the identity of the faces (i.e., every image). This impedes expression discrimination based on low‐level visual features, demanding higher‐level face processing. Therefore, we expect neural responses to be mostly visible over higher‐level occipito‐temporal regions.
Methods
Participants
Participants were identical to the sample included in Van der Donck et al. (2019): 23 boys with ASD and 23 TD boys without intellectual disability (full‐scale IQ (FSIQ) ≥ 70), group‐wise matched on chronological age and IQ. Intelligence was assessed using an abbreviated version (Sattler, 2001) of the Wechsler Intelligence Scale for Children, third edition (WISC‐III‐NL; Wechsler, 1992) with subscales Picture Completion, Block Design, Similarities, and Vocabulary. Combining Picture Completion with Block Design, and Similarities with Vocabulary gives reliable and valid estimates of performance IQ (PIQ) and verbal IQ (VIQ), respectively. Additional behavioral measures [Emotion Recognition Task (Montagne, Kessels, De Haan, & Perrett, 2007) and emotion‐matching task (Palermo, O'Connor, Davis, Irons, & McKone, 2013)] showed intact emotion labeling in the ASD group, yet, an impairment when matching facial expressions (for a detailed description of the assessment and the results of these behavioral tasks, see Van der Donck et al., 2019). See Table 1 for participant demographics and descriptive statistics.
Table 1.
Characteristics of the participant groups
| Measures |
ASD group (N = 23) Mean (SD) |
TD group (N = 23) Mean (SD) |
Statistical comparisona | p |
|---|---|---|---|---|
| Age (years) | 10.5 (1.4) | 10.5 (1.4) | t(44) = 0.11 | .91 |
| Verbal IQb | 107 (11) | 112 (11) | t(44) = −1.44 | .16 |
| Performance IQb | 104 (15) | 108 (10) | t(44) = −1.16 | .25 |
| Full‐scale IQb | 106 (9) | 110 (9) | t(44) = −1.68 | .10 |
|
Social Responsiveness Scale T‐score Total |
85.13 (11.7) | 41.65 (6) | z = 3.39 | .000*** |
|
Emotion Recognition Task (% correct) |
55.9 (32) | 56.8 (34) | F(1,43) = 0.11 | .74 |
|
Emotion‐matching task (% correct) |
63.1 (11) | 69.4 (6.8) | t(37) = −2.29 | .028* |
Statistical analyses using two‐sample t test or Kolmogorov–Smirnov Z test (based on assumptions of normality and equal variances) or linear mixed model.
Assessed via an abbreviated version (Sattler, 2001) of the Wechsler Intelligence Scale for Children, third edition (WISC‐III‐NL; Wechsler, 1992), with subscales Picture Completion, Block Design, Similarities, and Vocabulary.
p < .05.
p < .001.
Children with ASD were recruited via the Autism Expertise Centre at the university hospital and special need schools. TD participants were recruited via mainstream elementary schools and sport clubs. Exclusion criteria were the suspicion or presence of a psychiatric, neurological, learning, or developmental disorder (other than ASD or comorbid ADHD in ASD participants) in the participant or a first‐degree relative, based on information provided by the parents or provided in the multidisciplinary report. Children in the ASD group had a formal ASD diagnosis, established by a multidisciplinary team, according to DSM‐IV‐TR or DSM‐5 criteria (American Psychiatric Association, 2000, 2014), and scored above 60 (total T‐score) on the Social Responsiveness Scale [SRS, parent version (Roeyers, Thys, Druart, De Schryver, & Schittekatte, 2012)]. The SRS reliably measures quantitative ASD traits and comprises five subscales that capture Receptive, Cognitive, Expressive and Motivational facets of social behavior, and Autistic Preoccupations (Cronbach's α = .97; test–retest reliability = .81; Constantino, 2013; Constantino & Gruber, 2005). A higher score indicates more severe ASD symptoms. TD boys scored below 60 on the SRS to exclude the presence of substantial ASD symptoms.
Four children were left‐handed (2 TD), and three children reported color blindness (1 TD). As this did not affect their neural responses nor their ability to detect the color changes of the fixation cross, these participants were not excluded. All participants had normal or corrected‐to‐normal visual acuity. Among the participants with ASD, five had a comorbid diagnosis of ADHD and seven took medication (methylphenidate, aripiprazole).
The Medical Ethical Committee of the university hospital approved this study. Written informed consent according to the Declaration of Helsinki was obtained from the participants and their parents. Participants received a monetary compensation and a small present of their choice.
Stimuli
The stimuli comprised full front images of 14 individuals (seven males, seven females) from the Karolinska Directed Emotional Faces database (Lundqvist, Flykt, & Öhman, 1998), all displaying neutral, fearful, happy, sad, and angry expressions.
The colored images were set to a size of 300 × 450 pixels, equalizing 2.54° × 3.29° of visual angle at 80 cm viewing distance, and were placed against a gray background. Mean pixel luminance and contrast of the faces were equalized during stimulus presentation.
Design
The design was similar to previous studies (Dzhelyova et al., 2017; Poncet et al., 2019). Neutral faces from continuously changing identities (i.e., every image) were displayed through sinusoidal contrast modulation (0%–100%) at a 6 Hz base rate, periodically interleaved with an expressive oddball stimulus every fifth image (6 Hz/5 = 1.2 Hz oddball rate). At the beginning of each sequence, a blank screen appeared for a variable duration of 2–5 s. After two seconds of gradually fading in (0%–100%), the images were presented for 60 s, followed by two seconds of gradually fading out (100%–0%). Each of the four conditions (i.e., emotional expressions) was presented in a separate sequence and repeated four times, resulting in 16 sequences – all presented in a randomized order (Figure 1). The facial stimuli varied randomly in size between 80% and 120% of the original size.
Figure 1.

Fast periodic visual stimulation oddball paradigm: Neutral faces are presented sequentially at a fast 6 Hz base rate, periodically interleaved with an expressive face – anger, fear, happiness, sadness – every fifth image (1.2 Hz oddball rate). The identity of the faces changes every image. Stimuli shown here: AF02, AF07, AF13, AF15, AF22, AF27, AF29 (Lundqvist et al., 1998) [Colour figure can be viewed at wileyonlinelibrary.com]
Procedure
We conducted this study as part of a larger study on face processing in boys with ASD.
Participants were seated in a dimly lit room at 80 cm viewing distance of a LCD 24‐in. computer screen, placed at eye level. An orthogonal task was implemented to guarantee attentiveness of the participants. A fixation cross, presented on the nasion of the face, briefly (300 ms) changed color from black to red 10 times within every sequence. The participants had to respond as soon and accurately as possible when noticing the color changes.
EEG acquisition
We recorded EEG activity using a BIOSEMI Active‐Two amplifier system with 64 Ag/AgCl electrodes and two additional electrodes as reference and ground electrodes (Common Mode Sense active electrode and Driven Right Leg passive electrode). Vertical eye movements were recorded via one electrode above and one below the right eye. One electrode was placed at the corner of both eyes to record horizontal eye movements. We recorded EEG and electrooculogram at 512 Hz.
EEG analysis
Preprocessing
We processed all EEG data using Letswave 6 (http://www.nocions.org/letswave/) in Matlab R2017b (The Mathworks, Inc.). We cropped the data into segments of 70 s (4 s before and 6 s after each sequence), applied a fourth‐order Butterworth bandpass filter (0.1–100 Hz), and resampled the data to 256 Hz. For two participants (1 ASD, 1 TD) who blinked on average more than 2SD above the mean (average number of blinks per second across participants = .20, SD = 0.24), we applied independent component analysis via the runica algorithm (Makeig, Bell, Jung, & Sejnowski, 1995) and removed the component that accounted for most of the variance. We re‐estimated noisy or artifact‐ridden channels through linear interpolation of the three spatially nearest, neighboring electrodes; on average across all participants, one electrode was interpolated. All data segments were re‐referenced to a common average reference.
Frequency domain analysis
The preprocessed data segments were cropped to contain an integer number of 1.2 Hz cycles starting immediately after the fade‐in until approximately 59.2 s (71 cycles). After averaging the data in the time domain – per condition and for each participant individually – a fast fourier transformation (FFT) was applied, yielding a spectrum between 0 and 127.98 Hz with a spectral resolution of 0.017 (=1/60 s).
The recorded EEG contains signals at frequencies that are integer multiples (harmonics) of the base and oddball frequencies. Only the amplitudes at the oddball frequency and its harmonics (i.e., n*F/5 = 2.4 Hz and 3.6 Hz) are considered as an index of facial expression discrimination (Dzhelyova et al., 2017). We used two measures for these responses: (a) signal‐to‐noise ratio (SNR), being the amplitude value of a specific frequency bin divided by the average amplitude of the 20 surrounding frequency bins (Rossion, Prieto, Boremanse, Kuefner, & Van Belle, 2012), and (b) baseline‐corrected amplitudes, calculated by subtracting the average amplitude level of the 20 surrounding bins from the amplitude of the frequency bin of interest (Retter & Rossion, 2016). For both measures, these 20 surrounding bins are the 10 bins on each side of the target frequency bin, excluding the immediately neighboring bins and the two bins with the most extreme values. We used SNR spectra for visualization because responses at high frequency ranges may be of small amplitude, but with a high SNR. Baseline correction expresses responses in amplitudes (µV) that can be summed across significant harmonics to quantify the overall base and oddball response (Retter & Rossion, 2016).
To define the number of base and oddball harmonics to include in the analyses, we assessed the significance of the responses at different harmonics by calculating Z‐scores – using the mean and standard deviation of the 20 frequency bins surrounding the bin of interest (Liu‐Shuang et al., 2014) – on the FFT grand‐averaged data across all electrodes and across electrodes in the relevant regions of interest (ROIs; cf. infra). Harmonics were considered significant and relevant to include as long as the Z‐score for two consecutive harmonics was above 1.64 (p < .05, one‐tailed) across both groups and across all conditions (Retter & Rossion, 2016). Following this principle, we quantified the oddball response as the sum of the responses of four harmonics (i.e., until 4F/5 = 4.8 Hz) and the base response as the summed responses of the base rate and its following two harmonics (2F and 3F = 12 Hz and 18 Hz, respectively).
In addition, analyses were performed at the individual subject level. We averaged the raw FFT spectrum per ROI and cropped it into segments centered at the oddball frequency and its harmonics, surrounded by 20 neighboring bins on each side that represent the noise level. These spectra were summed across the significant harmonics and transformed into an individual Z‐score for each of the relevant ROIs.
Determination of ROIs
Visual inspection of the topographical maps and identification of the most responsive regions for emotional oddball and base rate stimulation (Dzhelyova et al., 2017) led to three ROIs. The left and right occipito‐temporal (LOT and ROT) ROIs were defined by averaging for each hemisphere the three channels with the highest summed baseline‐corrected oddball response for each of the expressions (i.e., channels P7, P9, and PO7 for LOT, and P8, P10, and PO8 for ROT). The medial‐occipital ROI (MO) was defined by averaging the two channels with the largest common response at 6 Hz (i.e., channels Iz and Oz).
Analyses
Quantification of physical stimulus characteristics
To assess to what extent neural discrimination responses are driven by low‐level stimulus characteristics, we calculated the image‐based difference between each of the emotional faces and each of the neutral faces in three manners. First, after aligning and cropping the faces to remove artifacts of hair and edges, a basic low‐level image comparison was accomplished by computing the pixel‐wise Euclidean distance (Op De Beeck, Wagemans, & Vogels, 2001) across the RGB levels for each pair of neutral and expressive images per gender. Second, we created an average face per expression and gender and, again, calculated the Euclidean distance between the neutral and expressive faces. Third, to obtain a more higher‐level image comparison, all face images were fed to a well‐established facial expression recognition deep learning neural network, which was pretrained on the FER2013 (Goodfellow et al., 2013) dataset consisting of around 36,000 labeled images (https://github.com/WuJie1010/Facial-Expression-Recognition.Pytorch). The output of the last fully connected layer of this network is a 512‐dimensional vector representing the most discriminating features in the input image. Hence, the mean pairwise Euclidean distance between these low dimensional representations of neutral faces and each of the four expression categories was calculated.
Statistical analyses
For statistical group‐level analyses of the baseline‐corrected amplitudes in each ROI, we applied a linear mixed model [function ‘lmer’ in R (Bates, Maechler, Bolker, & Walker, 2015)], fitted with restricted maximum likelihood. Separate models were fitted with either the base or the oddball rate response as the dependent variable. Expression (anger, fear, happiness, sadness) and ROI (LOT, ROT, MO, and LOT, ROT for base and oddball responses, respectively) were added as fixed within‐subject factors and Group (ASD vs. TD) as a fixed between‐subject factor. To account for the repeated testing, we included a random intercept per participant. Degrees of freedom were calculated using the Kenward–Roger method. Post hoc contrasts were tested for significance using a Bonferroni correction for multiple comparisons, by multiplying the p‐values by the number of comparisons. All assumptions in terms of linearity, normality, and constant variance of residuals were verified and met for all linear mixed models.
MO base rate data points of one participant were discarded due to extreme outliers (amplitude > 15 µV). All analyses were performed with and without inclusion of colorblind children, ASD children with comorbidities, and ASD children on medication. As inclusion/exclusion did not influence the results, we report the analyses with all children included.
We also evaluated the significance of the expression‐discrimination responses for all participants individually. Responses were considered significant if the z‐score of the oddball frequency bin in the LOT or ROT region exceeded 1.64 (i.e., p < .05; one‐tailed).
We performed a linear discriminant analysis (LDA) on the EEG data to classify participants as either belonging to the ASD or TD group. The input vectors comprised the most discriminative outcome measures, that is the response amplitudes to angry and fearful faces in the LOT and ROT regions. Assumptions of multivariate normal distribution and equal covariance matrices for both groups were checked and met. The competence of the classification model was assessed by means of permutation tests, which are robust for small sample sizes and possible over‐fitting.
For performance on the fixation cross change detection task, assumptions of normality and homoscedasticity were checked using a Shapiro–Wilk and Levene's test, respectively. The assumption of homogeneous variances was met. Due to non‐normal distribution of the data, we applied a Mann–Whitney U‐test. Due to equipment failure, data on this task are missing for two TD participants.
Results
Characterization of the stimulus properties
For each of the four emotional expressions, the (average) difference with the neutral facial expressions is depicted in Figure S1. Results of the raw pixel data show that the Euclidian distance toward the neutral faces is largely similar for all expressions (Figure S1a). However, the two higher‐level measures [average faces (Figure S1b) and the deep learning neural network face differentiation (Figure S1c)] reveal that especially the happy faces are the most distinctive from the neutral faces.
Fixation cross change detection task
Results suggest a similar level of attention to the screen throughout the experiment for both groups, with equal accuracies (M ASD = 90%, SD = 12; M TD = 95%, SD = 5; W = 209, p = .46) and response times (M ASD = 0.057 s, M TD = 0.54 s; W = 271, p = .50) on this orthogonal task.
General visual base rate responses
Robust brain responses were visible at 6 Hz base rate and harmonics, mostly distributed over medial‐occipital sites. Figure 2 shows the highly significant main effect of ROI (F(2, 481) = 547.49, p < .001), with highest responses in the MO region and lowest responses in the LOT region (t(481)LOT‐MO = −30.98, t(480)LOT‐ROT = −5.26, t(481)ROT‐MO = −25.76, all p Bonferroni < .001). The absence of any other significant main and/or interaction effect indicates a similar synchronization to the flickering stimuli in both groups (all p > .17).
Figure 2.

Similar general visual responses to faces in ASD and TD. Left: Scalp distribution of the base rate responses. The three most leftward and three most rightward open circles constitute left and right occipito‐temporal (LOT and ROT) regions, respectively. The two central open circles constitute the medial‐occipital region (MO). Right: Summed baseline‐subtracted amplitudes across the three harmonics of the base rate for each of the three ROIs, displaying a main effect of ROI. Error bars indicate standard errors of the mean [Colour figure can be viewed at wileyonlinelibrary.com]
Expression‐discrimination responses
All four expressions elicited clear expression‐discrimination responses at the oddball frequency and its harmonics (Figure 3), clearly distributed over lateral occipito‐temporal sites.
Figure 3.

SNR spectra visualizing the expression‐discrimination responses, averaged over LOT and ROT regions, for each of the expressions and both groups. The significant first four harmonics are displayed; the dashed line indicates the 6 Hz base rate response [Colour figure can be viewed at wileyonlinelibrary.com]
Statistical analysis of the expression‐discrimination responses revealed main effects of Group (F(1, 44) = 9.66, p = .003) and Expression (F(3, 308) = 10.29, p < .001), which were further qualified by a significant interaction between Group and Expression (F(3, 308) = 4.58, p = .004). Only angry (t(190)ASD‐TD = −3.86, p Bonferroni = .003) and fearful (t(190)ASD‐TD = −3.29, p Bonferroni < .05) faces elicited significantly higher responses in the TD compared with the ASD group. No group differences were found for happy and sad faces (all p Bonferroni > .98). Furthermore, the effect of expression only applied to the TD group, with significantly lower responses to sad faces, compared to the three other expressions (t(308)anger–sad = 6.15, p Bonferroni < .001; t(308)fear–sad = 4.01, p Bonferroni = .001; t(308)happy–sad = 3.34, p Bonferroni < .05). In addition, the main effect of ROI (F(1, 308) = 17.54, p < .001) revealed significantly higher responses in ROT compared with LOT region. See Figure 4 for all significant effects.
Figure 4.
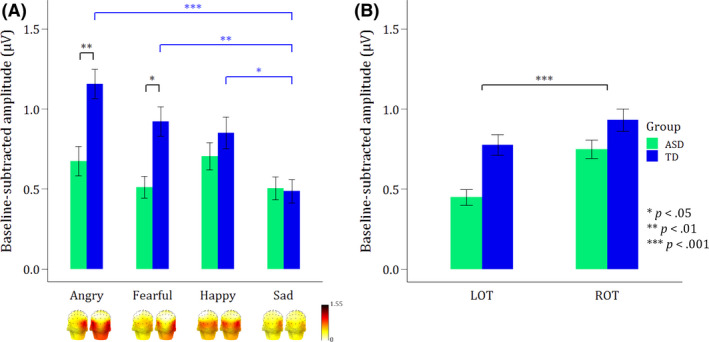
Bar graphs of the summed baseline‐subtracted amplitudes of both groups for the first four oddball harmonics (until 4.8 Hz) displaying mean expression‐discrimination responses. Error bars reflect standard errors of the mean. (A) Scalp topographies and bar graphs (averaged across LOT and ROT regions) displaying the mean responses per expression. The Group x Expression interaction shows significantly lower responses in the ASD versus TD group for angry and fearful faces (black asterisks), and an overall lower response to sad faces as compared to the other expressions in TDs (blue asterisks). (B) The main effect of ROI revealed a right hemisphere advantage, with significantly higher responses in ROT versus LOT region [Colour figure can be viewed at wileyonlinelibrary.com]
Although not the scope of this study, an additional analysis to specifically check for a threat bias showed significantly higher responses to threatening (anger and fear) versus nonthreatening (happiness and sadness) stimuli (F(1, 316) = 10.25, p = .002), but only in the TD group (F(1, 316) = 11.68, p < .001; t(316)threat–nonthreat = −4.68, p Bonferroni < .0001), not in the ASD group (t(316)threat–nonthreat = 0.153, p Bonferroni > .05).
Expression‐discrimination responses at the individual subject level are displayed in Table S1, revealing that the majority of participants did show robust individual responses.
Despite the abundance of studies investigating biomarkers for ASD, a clinically applicable biomarker, reliable at the individual level, has not yet been developed (McPartland, 2016, 2017). We analyzed how well neural expression‐discrimination responses for fearful and angry faces can predict group membership of our participants. By applying a leave‐one‐out cross validation, we assessed how well the LDA classification generalizes, revealing that 87% of the participants with ASD could be identified correctly. The overall accuracy of the LDA model to predict group membership was estimated at 76%. Figure 5 shows the linear differentiation between both groups, based on the full dataset. The robustness of the classification model was statistically assessed by carrying out 10,000 permutations, demonstrating a likelihood of obtaining the observed accuracy by chance of p = .002.
Figure 5.

Violin plot with the decision boundary of the LDA classifier (horizontal line) reflecting the differentiation between both participant groups. Based on the responses to facial anger and fear, the LDA classifies 20/23 participants with ASD and 17/23 TD participants correctly, when fitted to the full dataset. Mean ± 1 SD is shown in white [Colour figure can be viewed at wileyonlinelibrary.com]
Discussion
Using FPVS‐EEG, we assessed whether there is a difference in the neural sensitivity of school‐aged boys with and without ASD to implicitly detect briefly presented facial expressions in a stream of neutral faces, and whether this differential sensitivity would be general (all expressions) or emotion‐specific.
Our results indicate an equal neural synchronization to the general face stimulation and similar neural expression‐discrimination responses for happy and sad faces, yet, a lower implicit sensitivity to angry and fearful faces in boys with ASD, as compared to TD boys. For the TD boys, fearful, angry, and happy faces elicited stronger responses than sad faces. Given the equal performances of both groups on the orthogonal fixation cross task throughout all conditions, there is no evidence to attribute differences in neural responses across conditions or across groups to less motivation or attention of the participants.
Similar topographical maps in boys with and without ASD
The base and oddball stimuli elicited neural responses with similar topographical distributions in both groups. The base rate responses were mostly recorded over the middle occipital sites, suggesting the dominance of low‐level visual processing (Norcia et al., 2015). In addition, both groups displayed more lateralized topographical activity patterns for the expression‐discrimination responses, suggesting the use of a similar emotional face processing network in ASD and TD boys. However, considering the progressive development of typical facial expression processing capacities during childhood (Herba, Landau, Russell, Ecker, & Phillips, 2006; Mancini, Agnoli, Baldaro, Ricci Bitti, & Surcinelli, 2013), potential group differences in topography may still appear in adolescence or adulthood.
In our previous study, investigating fear discrimination responses within a stream of faces with a single identity, the neural oddball responses were equally distributed across medial‐occipital and occipito‐temporal sites (Van der Donck et al., 2019). Here, however, the expression‐discrimination responses are clearly distributed over occipito‐temporal sites, with a right hemisphere advantage, and thereby resemble the topographical patterns of adults (Dzhelyova et al., 2017). These responses reflect the larger involvement of higher‐level visual areas, probably induced by the continuously changing identities, which impedes low‐level discriminatory processing to detect rapid changes in expression. Yet, even though also the boys with ASD were forced to mobilize a high‐level processing approach with the current paradigm, this did not necessarily entail an equivalent high‐level processing performance, as evidenced by the reduced neural sensitivity to changes in fearful and angry faces.
In adult populations, similar EEG paradigms elicited distinct topographical maps for different facial expressions (Dzhelyova et al., 2017; Poncet et al., 2019), suggesting the activation of (partially) distinct neural populations. Unlike these adult findings, the children’s EEG responses did not show these separate spatial signatures for different expression changes. Again, this may point toward the ongoing developmental specialization and refinement of the neural systems involved in emotion processing (Leppänen & Nelson, 2009).
Reduced neural sensitivity to expressive faces in ASD is emotion‐specific
We included four basic expressions (anger, fear, happiness, and sadness) in our paradigm to assess the generalizability of the emotion‐processing impairment in ASD. Against a background of highly variable research findings (Black et al., 2017; Harms et al., 2010), we particularly expected a more pronounced impairment for discrimination of negative expressions.
The significant individual‐subject discrimination responses in a large majority of participants across both groups indicate that boys with and without ASD can process facial affect fast and unintentionally, while attending faces without specifically focusing on the emotional expressions (Vuilleumier & Righart, 2011), allowing implicit detection of rapid emotion changes. However, the response amplitudes indicate a substantially reduced emotion‐specific neural sensitivity in the ASD group: In contrast to studies describing a general emotion‐processing deficit in ASD, we only observed selectively lower responses to angry and fearful faces, as compared to TDs. These findings confirm and extend our previously reported results (Van der Donck et al., 2019).
A threat bias has often been reported in TD individuals and has been related to evolutionary survival strategies (Hedger, Gray, Garner, & Adams, 2016; Lyyra, Hietanen, & Astikainen, 2014). The highest responses to anger and fear discrimination in the TD group do suggest a threat‐detection advantage. The brain responses of the boys with ASD, however, do not point in that direction, despite reports of an anger‐detection effect in ASD populations as well (May, Cornish, & Rinehart, 2016; Rosset et al., 2011). The threat‐related content of the facial stimuli might selectively have boosted the oddball detection in the TD group only (Leung et al., 2019; Lyyra et al., 2014), resulting in the significant amplitude differences that allow a correct classification of 87% of the participants with ASD.
We found no group effect for the discrimination of sad faces. However, given the significantly lower detection responses in the TD group, possible floor effects may have masked potential group differences. Sadness has been found to be a difficult emotion to distinguish from neutrality (Gao & Maurer, 2010), possibly because it does not display very prominent, emotion‐characteristic facial features (Calvo & Nummenmaa, 2008). This, combined with the complexity of continuously changing identities of the faces, might make it harder for children with and without ASD to detect the rapid changes to sadness in the blink of an eye.
Also happy faces elicited similar responses in both groups. Although recent reviews report differences in neural responses to happy faces (Black et al., 2017; Monteiro et al., 2017), happiness is recognized the earliest and easiest, needing only minimal signals (Whitaker et al., 2017). Intact detection of rapidly presented happy emotional faces in boys with ASD should therefore not be surprising.
The emotional content of the faces drives the neural responses
One might argue that the neural expression‐discrimination responses simply reflect the low‐level perceptual stimulus‐based differences between base and oddball stimuli. Here, we present convincing evidence that these responses are determined by higher‐level socio‐affective processing abilities, at least in the TD participants. Indeed, if responses had been fully determined by stimulus properties, we would expect that the pattern of neural expression‐discrimination responses would mirror the pattern of stimulus‐based differences for each of these emotions relative to the neutral baseline. However, overall, the fine‐grained evaluation of the stimulus properties demonstrated that this is not the case, because here the happy faces are singled out as the most distinctive. Accordingly, pertaining to the oddball responses in the TD group, the pattern of the neural amplitudes for the facial expressions does not match the stimulus differences, as here the angry and fearful faces yielded the highest responses. This suggests that these amplitude differences are caused by higher‐level socio‐emotional relevance and saliency, possibly within the context of an evolutionary threat‐superiority effect. In the ASD participants, however, the brain responses seem to be more in line with the intrinsic stimulus characteristics (yet, without significant amplitude differences between the different emotions). Accordingly, contrary to the TD group, this might suggest a stronger reliance on the physical stimulus features instead of the emotional meaning of the stimulus. This observation resonates with previous accounts of atypical perceptual processing in ASD, such as the enhanced perceptual functioning (Mottron, Dawson, Soulières, Hubert, & Burack, 2006) and the weak central coherence (Happé & Frith, 2006) account, which propose that perceptual processing in ASD is more feature‐based and locally oriented, whereas in TD it is more globally driven and oriented toward integrating information into a meaningful whole (gestalt).
Limitations and future research
In the present study, we only included four basic expressions. As children will be confronted with a wider range of facial emotions in daily life, adding also surprise and disgust, and maybe even more complex or more subtle expressions, to the paradigm may increase the ecological validity and give us a broader understanding of the abilities of individuals with ASD to automatically and rapidly process socio‐affective details.
Since studies have revealed a female advantage for facial expression processing, also in children (McClure, 2000), it might be interesting to apply this paradigm in girls. Girls with ASD tend to be better at masking their social difficulties than boys with ASD (Hull, Mandy, & Petrides, 2017), possibly concealing facial expression processing differences between girls with ASD and TD girls on an explicit behavioral level. However, neural differences to rapidly detect facial emotions might be uncovered with this implicit paradigm.
Our results confirm that FPVS‐EEG is a highly sensitive and objective measure to detect and quantify even small responses at an individual level, in a short amount of time, thanks to the rapid, frequency‐tagged stimulus presentation. Only four sequences of 60 s are required to obtain reliable implicit neural expression‐discrimination responses. With all its advantages, FPVS‐EEG is a well‐suited technique to study populations that are otherwise difficult to include in research because of cognitive or verbal constraints. Furthermore, the promising classification results of the LDA demonstrate the potential of this approach to serve as a biomarker for sociocommunicative deficits. However, more research in (clinical) samples with a different IQ and/or age is needed to understand the full potential of FPVS‐EEG.
Conclusion
Our results indicate an emotion‐specific processing deficit instead of a general emotion‐processing problem in ASD. Boys with ASD are less sensitive to rapidly and implicitly detect angry and fearful faces among a stream of neutral faces. There is no evidence of a negative emotion‐processing deficit in ASD, as their discrimination responses to sad faces were similar to those of TD boys. However, the overall lower responses to sadness in the TD group, as compared to the other expressions, may have concealed possible group differences. Additionally, the responses elicited by happy faces were equal in both groups.
The implicit and straightforward nature of FPVS‐EEG, as well as the strength of the effects, paves the way to include populations that are often excluded from research due to cognitive or verbal constraints.
Supporting information
Table S1 . Number of individuals displaying significant emotion‐discrimination responses for each of the conditions, based on statistical analysis of the individual subject data [i.e., z‐scores> 1.64 (p < .05)].
Figure S1 . Physical characterization of the expressive versus neutral faces.
Acknowledgements
This work was supported by a grant of the Research Foundation Flanders (FWO; G0C7816N), an Excellence of Science (EOS) grant (G0E8718N; HUMVISCAT), and the Marguerite‐Marie Delacroix foundation. The authors would like to thank Bruno Rossion for his advice on designing this study and for helpful comments on the manuscript. The authors would also like to thank all the children and parents who contributed to this study. The authors have declared that they have no competing or potential conflicts of interest.
Key points.
Behavioral and ERP findings on facial emotion processing in autism reveal mixed results, ranging from intact processing, over emotion‐specific impairments, to a general deficit.
Fast periodic visual stimulation EEG allows to rapidly and robustly quantify an individual’s sensitivity for subtle sociocommunicative facial cues.
School‐aged boys with autism show a substantially reduced neural sensitivity, selectively for the rapid and implicit categorization of angry and fearful faces.
Neural responses to angry and fearful faces allow a correct prediction of group membership of 76%.
This fast, objective, and implicit neural measure allows assessing populations that are often excluded from research due to cognitive or verbal constraints and shows great potential to serve as a biomarker for sociocommunicative deficits.
Conflict of interest statement: No conflicts declared.
References
- Adrian, E.D. , & Matthews, B.H.C. (1934). The Berger Rhythm: Potential changes from the occipital lobes in man. Brain, 57, 355–385. [DOI] [PubMed] [Google Scholar]
- American Psychiatric Association (2000). Diagnostic and statistical manual of mental disorders ‐ TR (Dutch version) (4th edn). Amsterdam: Uitgeverij Boom. [Google Scholar]
- American Psychiatric Association (2014). Diagnostic and statistical manual of mental disorders (Dutch version) (5th edn). Amsterdam: Uitgeverij Boom. [Google Scholar]
- Bates, D. , Maechler, M. , Bolker, B. , & Walker, S. (2015). Package “lme4”. Journal of Statistical Software, 67, 1–48. [Google Scholar]
- Batty, M. , Meaux, E. , Wittemeyer, K. , Rogé, B. , & Taylor, M.J. (2011). Early processing of emotional faces in children with autism: An event‐related potential study. Journal of Experimental Child Psychology, 109(4), 430–444. [DOI] [PubMed] [Google Scholar]
- Black, M.H. , Chen, N.T.M. , Iyer, K.K. , Lipp, O.V. , Bölte, S. , Falkmer, M. , … & Girdler, S. (2017). Mechanisms of facial emotion recognition in autism spectrum disorders: Insights from eye tracking and electroencephalography. Neuroscience and Biobehavioral Reviews, 80, 488–515. [DOI] [PubMed] [Google Scholar]
- Calvo, M.G. , & Nummenmaa, L. (2008). Detection of emotional faces: salient physical features guide effective visual search. Journal of Experimental Psychology: General, 137(3), 471–494. [DOI] [PubMed] [Google Scholar]
- Constantino, J.N. (2013). Encyclopedia of autism spectrum disorders In Volkmar F.R. (Ed.), Encyclopedia of autism spectrum disorders (pp. 2919–2929). New York: Springer. [Google Scholar]
- Constantino, J.N. , & Gruber, C.P. (2005). Social Responsiveness Scale (SRS) manual. Los Angeles: Western Psychological Services. [Google Scholar]
- Dawson, G. , Webb, S.J. , Carver, L. , Panagiotides, H. , & Mcpartland, J. (2004). Young children with autism show atypical brain responses to fearful versus neutral facial expressions of emotion. Developmental Science, 7, 340–359. [DOI] [PubMed] [Google Scholar]
- Dzhelyova, M. , Jacques, C. , & Rossion, B. (2017). At a single glance: Fast periodic visual stimulation uncovers the spatio‐temporal dynamics of brief facial expression changes in the human brain. Cerebral Cortex, 27, 4106–4123. [DOI] [PubMed] [Google Scholar]
- Evers, K. , Steyaert, J. , Noens, I. , & Wagemans, J. (2015). Reduced recognition of dynamic facial emotional expressions and emotion‐specific response bias in children with an autism spectrum disorder. Journal of Autism and Developmental Disorders, 45, 1774–1784. [DOI] [PubMed] [Google Scholar]
- Gaigg, S.B. (2012). The Interplay between emotion and cognition in autism spectrum disorder: Implications for developmental theory. Frontiers in Integrative Neuroscience, 6, 113. [DOI] [PMC free article] [PubMed] [Google Scholar]
- Gao, X. , & Maurer, D. (2010). A happy story: Developmental changes in children's sensitivity to facial expressions of varying intensities. Journal of Experimental Child Psychology, 107, 67–86. [DOI] [PubMed] [Google Scholar]
- Goodfellow, I.J. , Erhan, D. , Carrier, P.L. , Courville, A. , Mirza, M. , Hamner, B. , … & Bengio, Y. (2013). Challenges in representation learning: A report on three machine learning contests In Lee M., Hirose A., Hou Z.‐G. & Man Kil R. (Eds.), Neural information processing. 20th International Conference (pp. 117–124). New York: Springer. [Google Scholar]
- Griffiths, S. , Jarrold, C. , Penton‐Voak, I.S. , Woods, A.T. , Skinner, A.L. , & Munafò, M.R. (2017). Impaired recognition of basic emotions from facial expressions in young people with autism spectrum disorder: Assessing the importance of expression intensity. Journal of Autism and Developmental Disorders, 49, 2768–2778. [DOI] [PMC free article] [PubMed] [Google Scholar]
- Happé, F. , & Frith, U. (2006). The weak coherence account: Detail‐focused cognitive style in autism spectrum disorders. Journal of Autism and Developmental Disorders, 36, 5–25. [DOI] [PubMed] [Google Scholar]
- Harms, M.B. , Martin, A. , & Wallace, G.L. (2010). Facial emotion recognition in autism spectrum disorders: A review of behavioral and neuroimaging studies. Neuropsychology Review, 20, 290–322. [DOI] [PubMed] [Google Scholar]
- Hedger, N. , Gray, K.L.H. , Garner, M. , & Adams, W.J. (2016). Are visual threats prioritized without awareness? A critical review and meta‐analysis involving 3 behavioral paradigms and 2696 observers. Psychological Bulletin, 142, 934–968. [DOI] [PubMed] [Google Scholar]
- Herba, C.M. , Landau, S. , Russell, T. , Ecker, C. , & Phillips, M.L. (2006). The development of emotion‐processing in children: Effects of age, emotion, and intensity. Journal of Child Psychology and Psychiatry and Allied Disciplines, 47, 1098–1106. [DOI] [PubMed] [Google Scholar]
- Hileman, C.M. , Henderson, H. , Mundy, P. , Newell, L. , & Jaime, M. (2011). Developmental and individual differences on the P1 and N170 ERP components in children with and without autism. Developmental Neuropsychology, 36, 214–236. [DOI] [PMC free article] [PubMed] [Google Scholar]
- Hull, L. , Mandy, W. , & Petrides, K.V. (2017). Behavioural and cognitive sex/gender differences in autism spectrum condition and typically developing males and females. Autism, 21, 706–727. [DOI] [PubMed] [Google Scholar]
- Lacroix, A. , Guidetti, M. , Rogé, B. , & Reilly, J. (2014). Facial emotion recognition in 4‐ to 8‐year‐olds with autism spectrum disorder: A developmental trajectory approach. Research in Autism Spectrum Disorders, 8, 1146–1154. [Google Scholar]
- Law Smith, M.J. , Montagne, B. , Perrett, D.I. , Gill, M. , & Gallagher, L. (2010). Detecting subtle facial emotion recognition deficits in high‐functioning Autism using dynamic stimuli of varying intensities. Neuropsychologia, 48, 2777–2781. [DOI] [PubMed] [Google Scholar]
- Leppänen, J.M. , & Nelson, C.A. (2009). Tuning the developing brain to social signals of emotions. Nature Reviews Neuroscience, 10, 37–47. [DOI] [PMC free article] [PubMed] [Google Scholar]
- Leung, R.C. , Pang, E.W. , Brian, J.A. , & Taylor, M.J. (2019). Happy and angry faces elicit atypical neural activation in children with Autism Spectrum Disorder. Biological Psychiatry: Cognitive Neuroscience and Neuroimaging, 4, 1021–1030. [DOI] [PubMed] [Google Scholar]
- Liu‐Shuang, J. , Norcia, A.M. , & Rossion, B. (2014). An objective index of individual face discrimination in the right occipito‐temporal cortex by means of fast periodic oddball stimulation. Neuropsychologia, 52, 57–72. [DOI] [PubMed] [Google Scholar]
- Lozier, L.M. , Vanmeter, J.W. , & Marsh, A.A. (2014). Impairments in facial affect recognition associated with autism spectrum disorders: A meta‐analysis. Development and Psychopathology, 26, 933–945. [DOI] [PubMed] [Google Scholar]
- Lundqvist, D. , Flykt, A. , & Öhman, A. (1998). The Karolinska directed emotional faces ‐ KDEF, CD ROM. Stockholm: Department of Clinical Neuroscience, Psychology section, Karolinska Institutet, ISBN 91-630-7164-9. [Google Scholar]
- Lyyra, P. , Hietanen, J.K. , & Astikainen, P. (2014). Anger superiority effect for change detection and change blindness. Consciousness and Cognition, 30, 1–12. [DOI] [PubMed] [Google Scholar]
- Makeig, S. , Bell, A.J. , Jung, T.‐P. , & Sejnowski, T.J. (1995). Independent component analysis of electroencephalographic data In Touretzky D.S., Mozer M.C. & Hasselmo M.E. (Eds.), Advances in neural information processing systems (vol. 8, pp. 145–151). Cambridge, MA: MIT Press. [Google Scholar]
- Mancini, G. , Agnoli, S. , Baldaro, B. , Ricci Bitti, P.E. , & Surcinelli, P. (2013). Facial expressions of emotions: Recognition accuracy and affective reactions during late childhood. Journal of Psychology: Interdisciplinary and Applied, 147, 599–617. [DOI] [PubMed] [Google Scholar]
- May, T. , Cornish, K. , & Rinehart, N.J. (2016). Exploring factors related to the anger superiority effect in children with Autism Spectrum Disorder. Brain and Cognition, 106, 65–71. [DOI] [PubMed] [Google Scholar]
- McClure, E. (2000). A meta‐analytic review of sex differences in facial expression processing and their development in infants, children, and adolescents. Psychological Bulletin, 126, 424–453. [DOI] [PubMed] [Google Scholar]
- Mcpartland, J.C. (2016). Considerations in biomarker development for neurodevelopmental disorders. Current Opinion in Neurology, 29, 118–122. [DOI] [PMC free article] [PubMed] [Google Scholar]
- McPartland, J.C. (2017). Developing clinically practicable biomarkers for autism spectrum disorder. Journal of Autism and Developmental Disorders, 47, 2935–2937. [DOI] [PMC free article] [PubMed] [Google Scholar]
- Montagne, B. , Kessels, R.P.C. , De Haan, E.H.F. , & Perrett, D.I. (2007). The emotion recognition task: A paradigm to measure the perception of facial emotional expressions at different intensities. Perceptual and Motor Skills, 104, 589–598. [DOI] [PubMed] [Google Scholar]
- Monteiro, R. , Simões, M. , Andrade, J. , & Castelo Branco, M. (2017). Processing of facial expressions in autism: A systematic review of EEG/ERP evidence. Review Journal of Autism and Developmental Disorders, 4, 255–276. [Google Scholar]
- Mottron, L. , Dawson, M. , Soulières, I. , Hubert, B. , & Burack, J. (2006). Enhanced perceptual functioning in autism: An update, and eight principles of autistic perception. Journal of Autism and Developmental Disorders, 36, 27–43. [DOI] [PubMed] [Google Scholar]
- Norcia, A.M. , Appelbaum, L.G. , Ales, J.M. , Cottereau, B.R. , & Rossion, B. (2015). The steady‐state visual evoked potential in vision research: a review. Journal of Vision, 15, 1–46. [DOI] [PMC free article] [PubMed] [Google Scholar]
- O'Connor, K. , Hamm, J.P. , & Kirk, I.J. (2005). The neurophysiological correlates of face processing in adults and children with Asperger’s syndrome. Brain and Cognition, 59, 82–95. [DOI] [PubMed] [Google Scholar]
- Op De Beeck, H. , Wagemans, J. , & Vogels, R. (2001). Inferotemporal neurons represent low‐dimensional configurations of parameterized shapes. Nature Neuroscience, 4, 1244–1252. [DOI] [PubMed] [Google Scholar]
- Palermo, R. , O'Connor, K.B. , Davis, J.M. , Irons, J. , & McKone, E. (2013). New tests to measure individual differences in matching and labelling facial expressions of emotion, and their association with ability to recognise vocal emotions and facial identity. PLoS ONE, 8, e68126. [DOI] [PMC free article] [PubMed] [Google Scholar]
- Poncet, F. , Baudouin, J.‐Y. , Dzhelyova, M. , Rossion, B. , & Leleu, A. (2019). Rapid and automatic discrimination between facial expressions in the human brain. Neuropsychologia, 129, 47–55. [DOI] [PubMed] [Google Scholar]
- Retter, T.L. , & Rossion, B. (2016). Uncovering the neural magnitude and spatio‐temporal dynamics of natural image categorization in a fast visual stream. Neuropsychologia, 91, 9–28. [DOI] [PubMed] [Google Scholar]
- Roeyers, H. , Thys, M. , Druart, C. , De Schryver, M. , & Schittekatte, M. (2012). SRS: Screeningslijst voor autismespectrumstoornissen. Amsterdam: Hogrefe. [Google Scholar]
- Rosset, D. , Santos, A. , Da Fonseca, D. , Rondan, C. , Poinso, F. , & Deruelle, C. (2011). More than just another face in the crowd: Evidence for an angry superiority effect in children with and without autism. Research in Autism Spectrum Disorders, 5, 949–956. [Google Scholar]
- Rossion, B. , Prieto, E.A. , Boremanse, A. , Kuefner, D. , & Van Belle, G. (2012). A steady‐state visual evoked potential approach to individual face perception: Effect of inversion, contrast‐reversal and temporal dynamics. NeuroImage, 63, 1585–1600. [DOI] [PubMed] [Google Scholar]
- Sattler, J.M. (2001). Assessment of children: Cognitive applications (4th edn). San Diego, CA: Jerome M Sattler. [Google Scholar]
- Tracy, J.L. , Robins, R.W. , Schriber, R.A. , & Solomon, M. (2011). Is emotion recognition impaired in individuals with autism spectrum disorders? Journal of Autism and Developmental Disorders, 41, 102–109. [DOI] [PMC free article] [PubMed] [Google Scholar]
- Tye, C. , Battaglia, M. , Bertoletti, E. , Ashwood, K.L. , Azadi, B. , Asherson, P. , … & McLoughlin, G. (2014). Altered neurophysiological responses to emotional faces discriminate children with ASD, ADHD and ASD + ADHD. Biological Psychology, 103, 125–134. [DOI] [PubMed] [Google Scholar]
- Uljarevic, M. , & Hamilton, A. (2013). Recognition of emotions in autism: A formal meta‐analysis. Journal of Autism and Developmental Disorders, 43, 1517–1526. [DOI] [PubMed] [Google Scholar]
- Van der Donck, S. , Dzhelyova, M. , Vettori, S. , Thielen, H. , Steyaert, J. , Rossion, B. , & Boets, B. (2019). Fast periodic visual stimulation EEG reveals reduced neural sensitivity to fearful faces in children with autism. Journal of Autism and Developmental Disorders, 49, 4658–4673. [DOI] [PMC free article] [PubMed] [Google Scholar]
- Vuilleumier, P. , & Righart, R. (2011). Attention and automaticity in processing facial expressions In Calder A.J., Rhodes G., Johnson M.H. & Haxby J.V. (Eds.), The Oxford Handbook of Face Perception (pp. 449–478). New York: Oxford University Press. [Google Scholar]
- Wechsler, D. (1992). Wechsler intelligence scale for children, 3rd ed. London: The Psychological Corporation. [Google Scholar]
- Whitaker, L.R. , Simpson, A. , & Roberson, D. (2017). Brief report: Is impaired classification of subtle facial expressions in children with autism spectrum disorders related to atypical emotion category boundaries? Journal of Autism and Developmental Disorders, 47, 2628–2634. [DOI] [PubMed] [Google Scholar]
- Wingenbach, T.S.H. , Ashwin, C. , & Brosnan, M. (2017). Diminished sensitivity and specificity at recognising facial emotional expressions of varying intensity underlie emotion‐specific recognition deficits in autism spectrum disorders. Research in Autism Spectrum Disorders, 34, 52–61. [Google Scholar]
- Wong, T.K.W. , Fung, P.C.W. , Chua, S.E. , & McAlonan, G.M. (2008). Abnormal spatiotemporal processing of emotional facial expressions in childhood autism: dipole source analysis of event‐related potentials. European Journal of Neuroscience, 28, 407–416. [DOI] [PubMed] [Google Scholar]
- Xavier, J. , Vignaud, V. , Ruggiero, R. , Bodeau, N. , Cohen, D. , & Chaby, L. (2015). A multidimensional approach to the study of emotion recognition in autism spectrum disorders. Frontiers in Psychology, 6, 1–9. [DOI] [PMC free article] [PubMed] [Google Scholar]
Associated Data
This section collects any data citations, data availability statements, or supplementary materials included in this article.
Supplementary Materials
Table S1 . Number of individuals displaying significant emotion‐discrimination responses for each of the conditions, based on statistical analysis of the individual subject data [i.e., z‐scores> 1.64 (p < .05)].
Figure S1 . Physical characterization of the expressive versus neutral faces.