

Abstract
This open label, parallel‐group study investigated the pharmacokinetics and safety of a single oral 2‐mg dose of the novel selective progesterone receptor modulator vilaprisan in participants with impaired renal function compared with age, weight, sex, and race matched controls with normal renal function. Systemic exposure (area under the plasma concentration–time curve [AUC]) and maximum observed concentrations (Cmax) were compared among 9 participants with moderate renal impairment and matched controls by ANOVA. An additional 4 participants, each with severe renal impairment or normal renal function, contributed to a linear regression analysis exploring any monotone relationship between individual variables and the estimated glomerular filtration rate. The geometric mean AUC was increased by a factor of 1.35 in renally impaired participants compared to normal controls (not statistically significant: least squares mean, 1.346; 90% confidence interval, 0.918‐1.973). Cmax was similar in participants with moderate renal impairment and normal renal function (least squares mean, 1.026; 90% confidence interval, 0.779‐1.351). Considering the overall variability, there was no correlation between renal function (estimated glomerular filtration rate) and Cmax or AUC of vilaprisan. Single oral administration of vilaprisan 2 mg was well tolerated by all participants, both men and women and irrespective of renal function. The incidence of treatment‐emergent adverse events was similar across all groups. Results from this study do not indicate that a dose adjustment will be necessary for vilaprisan when treating patients up to moderate renal impairment.
Keywords: pharmacokinetics, renal impairment, safety, selective progesterone receptor modulator, vilaprisan
Vilaprisan is a highly potent selective progesterone receptor modulator under investigation for the treatment of symptomatic uterine fibroids (UFs) and endometriosis. UFs (leiomyomas or myomas) are the most common benign smooth muscle tumors of the myometrium. The prevalence of clinically relevant UF is close to 40% in premenopausal women aged 35 to 40 years. 1 Among the most prominent symptoms associated with UFs are heavy menstrual bleeding and pelvic pain. The pharmacokinetics (PK) and safety of vilaprisan have been investigated in healthy postmenopausal women following daily oral administrations of 1 up to 30 mg over 28 days. Vilaprisan showed dose‐linear PK and was well tolerated at systemic exposures that are ∼6‐ to 30‐fold above the therapeutic dose. 2 Previous phase 2 studies showed that a dose of 2 mg/day resulted in effective bleeding control and reductions in fibroid volume and demonstrated a favorable safety profile. 3 , 4 Based on these promising results, vilaprisan is currently being investigated in phase 3 studies. 5 Vilaprisan is predominantly cleared from plasma by hepatic cytochrome P450 (CYP) 3A metabolism and only marginally excreted unchanged with urine, 6 suggesting a minor effect of renal function on the PK of vilaprisan. Furthermore, no major metabolites are formed in plasma exceeding 10% of drug‐related area under the plasma concentration–time curve (AUC), and they are not contributing to the pharmacological efficacy. However, in line with pertinent regulatory guidelines by the US Food and Drug Administration 7 and European Medicines Agency 8 on the conduct of renal impairment studies, even drugs primarily cleared by hepatic metabolism should be investigated in patients with renal impairment because renal impairment can inhibit some pathways of hepatic and gut drug metabolism and transport. Therefore, the current phase 1 study aimed to investigate the pharmacokinetics and safety of vilaprisan in participants with moderately impaired renal function and to collect explorative data in participants with severely impaired renal function.
Methods
The study was performed at 2 clinical pharmacology units located in Miami and Orlando, Florida, between February and October 2018. The study protocol (ClinicalTrials.gov identifier: NCT 03411980) was reviewed and approved by the IntegReview Institutional Review Board (Austin, Texas), and the study was conducted in compliance with the protocol, the Guideline for Good Clinical Practice E6; the US Code of Federal Regulations pertaining to conduct and reporting of clinical studies, and the Declaration of Helsinki. All participants gave their written informed consent before entry into the study.
Participants
Although the target population for vilaprisan is women with UFs or endometriosis, the study was conducted in both male and female participants because the PK of vilaprisan are similar between both sexes, as previously shown in a clinical study that included female and male participants with hepatic impairment. 9 Eligible participants were 18 to 79 years old with a body mass index of 18 to 40 kg m−2 (inclusive). Participants were excluded from study participation if they had a clinically significant medical abnormality other than renal impairment or its underlying causes, in particular, gastrointestinal, cerebrovascular, cardiovascular, or pulmonary disorders. Full participant selection criteria are provided in the Supplemental Information.
Study Design and Conduct of the Study
This was a parallel‐group, open‐label, single‐dose study to assess the effects of renal impairment on the pharmacokinetics and safety of vilaprisan. Study participants were randomly assigned to 1 of the 4 groups according to renal disease status as measured by the estimated glomerular filtration rate (eGFR) calculated by the Chronic Kidney Disease Epidemiology Collaboration formula. 10 For participants with renal impairment, eGFR had to be confirmed 2 to 10 days before test drug administration if the screening value was obtained >10 days before dosing. For subjects with normal renal function who did not qualify with eGFR ≥90 mL/min/1.73 m2, a creatinine clearance was determined from a 24‐hour urine collection for confirmatory purposes. Group A consisted of participants with moderately decreased renal function (eGFR of 30‐59 mL/min/1.73 m2). Group C consisted of participants with severely decreased renal function up to end‐stage renal disease but not on dialysis (eGFR <30 mL/min/1.73 m2). Groups B and D included participants with normal renal function (eGFR: ≥90 mL/min/1.73 m2) matched to Group A and Group C, respectively, with regard to sex, age, race and weight (Table 1). Prohibited medications included drugs expected to interfere with the PK of vilaprisan such as preparations containing sex hormones and medicines or substances that could interfere with CYP3A‐mediated metabolism (CYP3A inhibitors and inducers). Regular concomitant medications were withheld until 4 hours after test drug intake to the extent medically justifiable.
Table 1.
Demographic and Baseline Characteristics (Safety Analysis Set = 26)
| Variable | Group A Moderate Renal Impairment(n = 9) | Group B Normal Renal Function(n = 9) | Group C Severe Renal Impairment(n = 4) | Group D Normal Renal Function(n = 4) | Total(n = 26) |
|---|---|---|---|---|---|
| Sex | |||||
| Male, n (%) | 6 (66.7) | 6 (66.7) | 4 (100.0) | 4 (100.0) | 20 (76.9) |
| Female, n (%) | 3 (33.3) | 3 (33.3) | 0 | 0 | 6 (23.1) |
| Race | |||||
| White, n (%) | 2 (22.2) | 2 (22.2) | 1 (25.0) | 1 (25.0) | 6 (23.1) |
| Black, n (%) | 7 (77.8) | 7 (77.8) | 3 (75.0) | 3 (75.0) | 20 (76.9) |
| Age, y, mean ± SD | 58.2 ± 9.8 | 56.6 ± 7.8 | 55.0 ± 20.4 | 51.0 ± 19.4 | 56.0 ± 12.3 |
| Weight, a kg, mean ± SD | 89.86 ± 16.20 | 89.32 ± 15.59 | 76.55 ± 16.91 | 78.85 ± 17.30 | 85.93 ± 16.24 |
| Height, a cm, mean ± SD | 171.39 ± 7.35 | 170.49 ± 10.58 | 166.48 ± 5.21 | 173.48 ± 8.14 | 170.64 ± 8.28 |
| BMI, a kg m−1, mean ± SD | 30.54 ± 4.90 | 30.58 ± 3.48 | 27.48 ± 4.95 | 26.04 ± 4.38 | 26.39 ± 4.49 |
| Smoking history | |||||
| Never, n (%) | 7 (77.8) | 7 (77.8) | 2 (50.0) | 4 (100.0) | 20 (76.9) |
| Former, n (%) | 1 (11.1) | 1 (11.1) | 2 (50.0) | 0 | 4 (15.4) |
| Current, n (%) | 1 (11.1) | 1 (11.1) | 0 | 0 | 2 (7.7) |
| Other tobacco | |||||
| Never, n (%) | 9 (100.0) | 9 (100.0) | 4 (100.0) | 4 (100.0) | 26 (100.0) |
| Alcohol use | |||||
| Abstinent, n (%) | 8 (88.9) | 6 (66.7) | 2 (50.0) | 2 (50.0) | 18 (69.2) |
| Light, n (%) | 1 (11.1) | 3 (33.3) | 2 (50.0) | 2 (50.0) | 8 (30.8) |
| Laboratory parameters, eGFR, mL/min/1.73 m2, mean ± SD b | 42.7 ± 8.47 | 98.4 ± 10.5 | 16.3 ± 9.29 | 110 ± 23.6 | … |
BMI, body mass index; eGFR, estimated glomerular filtration rate; SD, standard deviation.
aAt screening.
bValues calculated for all control participants (pooled matched control participants with moderate and severe renal impairment, n = 13).
After successful confirmation of eligibility, participants were admitted on the predose day to the clinical pharmacology unit. PK samples were taken for 14 days after dosing. Participants with normal renal function stayed at the clinical pharmacology unit until the first postdose days, participants with impaired renal functions stayed for 4 days after dosing (Figure 1).
Figure 1.
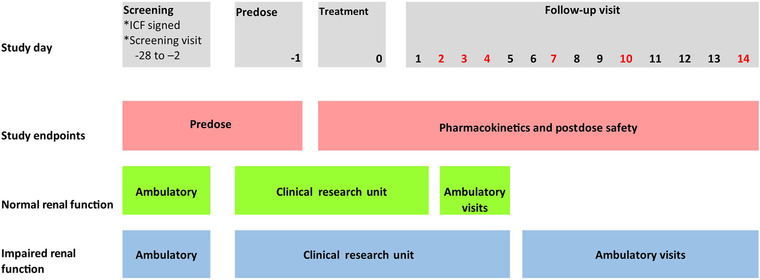
Study design overview. Red text denotes the days of the ambulatory follow‐up visits. ICF, informed consent form.
Treatments
All participants received a single oral dose of 2‐mg vilaprisan administered as an immediate release tablet, which is the therapeutic dose investigated in phase 3 clinical trials, and which has been shown to be well tolerated up to 6 months as daily oral treatment in patients.
Measurements and Collection of Samples
Plasma concentrations were analyzed from blood samples taken 1.0 hour before vilaprisan dosing and at 0.5, 1.0, 1.5, 2.0, 2.5, 3.0, 4.0, 6.0, 8.0, 12.0, and 16.0 hours after dosing and also 1, 2, 3, 4, 7, 10, and 14 days after dosing. Urine concentrations were measured (urine collected before vilaprisan dosing and continuously until 6 hours after dosing, then continuously until day 1 after dosing). Vilaprisan was determined in plasma and urine after addition of [13C6]vilaprisan as an internal standard followed by separation employing liquid chromatography and tandem mass spectrometric detection, for which an Agilent System 1200 was used (Agilent, Santa Clara, California). Vilaprisan was determined in individual urine and plasma samples using a 150 × 4.6 mm Prodigy ODS3, 5‐μm analytical column (00F‐4097‐E0, Phenomenex, Torrance, California) following elution with an acetonitril/ammonium acetate buffer gradient system. The fraction of free (unbound) vilaprisan in plasma (fu) was determined ex vivo in plasma samples collected at 2, 24, and 48 hours after dosing for each participant using the Transil method. 11 Transil is a widely used rapid dialysis method using immobilized plasma proteins on membrane beads. Plasma samples were spiked with carbon 14–labeled vilaprisan at a nominal concentration of 750 μg/L, enabling reliable detection of vilaprisan in plasma. The detection limits were within the concentration range up to 2537 μg/L, for which linear protein binding has been demonstrated for vilaprisan. PK parameters were calculated based on the actual concentration‐time data by a noncompartmental approach using WinNonlin PK Software (version 5.3; Certara, Princeton, New Jersey) in conjunction with the Automation Extension WinAE 2.90 (Bayer AG, Leverkusen, Germany). Two main PK parameters were defined for this study: AUC in plasma from zero to infinity for total drug, and maximum observed drug concentration (Cmax). Further PK parameters specified for this study were unbound AUC and unbound Cmax, time to reach Cmax, terminal half‐life, total and unbound apparent oral vilaprisan clearance, apparent total and unbound volume of distribution during the terminal phase, urinary excretion of vilaprisan during 24 hours after dosing, renal clearance from plasma, and fu.
Safety assessments included recording of adverse events (AEs), reasons for study discontinuation, vital signs, electrocardiogram, and clinical laboratory tests (blood and urine, hematology, and biochemistry).
Statistical Analysis
The statistical evaluation was performed by using the software package SAS release 9.2 (SAS Institute Inc., Cary, North Carolina). All statistical analyses were explorative; a confirmatory statistical analysis was not intended. All data were summarized according to their type using descriptive statistics and frequency tables. All participants treated with vilaprisan were included in the PK analyses. Analyses of variance, including fixed renal group effects, were used for the comparison of the PK parameters AUC and Cmax between study groups. Log‐transformed parameter values were used, as the parameters were assumed to be log‐normally distributed. The point estimates and 90% confidence intervals (CIs) of the ratios of the groups were derived by retransforming the point estimates (least squares means) and the 90%CIs of the corresponding models to the original scale. Relationship between PK parameters and fu and the eGFR at screening were explored using pairwise scatter plots and Spearman's rank correlation coefficients with corresponding 95%CIs. The PK parameters of vilaprisan in urine were summarized using descriptive statistics.
No formal statistical sample size estimation had been performed for this study due to the exploratory character of the study. Sample size was based on recommendations from the Food and Drug Administration's Guidance for Industry, “Pharmacokinetics in Patients With Impaired Renal Function” stating that PK profiles of the investigational drug should be based on subject numbers that are sufficient to detect the level of impairment at which the PK may be changed sufficiently to warrant dose adjustment. A number of N = 8 valid participants was selected assuming conservatively a geometric coefficient of variation of 60% for Cmax and AUC based on previous clinical data. Considering this variability, PK ratios between moderate and control participants can be estimated with a precision up to a factor of <1.578 (upper limit of 90% range). To reach a number of N = 8 valid participants in the group of moderately renally impaired and matched control participants, 9 participants were recruited in both groups. The number of 4 participants with severe renal function and of 4 matched controls was chosen to collect orientating PK data in participants with severe renal impairment.
Results
Disposition of Participants
A total of 26 participants were assigned to treatment and completed the study: 9 participants with moderately impaired renal function (Group A), four participants with severely impaired renal function (Group C) and 9 and 4 participants with normal renal function (Control Groups B and D), respectively. One of the 4 participants in the severe renal impairment group had to be excluded from the PK evaluation because all vilaprisan concentrations were below the limit of quantification and had to be classified as noncompliant.
Plasma Pharmacokinetics
Mean vilaprisan plasma concentration‐time profiles following a single oral dose of 2 mg vilaprisan were similar between moderate renal impairment and its matched control group and also similar between severe renal impairment and normal‐severe group. Higher mean concentration‐time profiles were observed in the moderate impairment groups (moderate and normal‐moderate) compared to the severe impairment groups (severe and normal), and this difference was more pronounced at later time points (Figure 2). Geometric mean Cmax of vilaprisan was similar between all 4 groups: Group A (moderate impairment) vs Group B (normal function): 9.14 versus 8.91 μg/L; Group C (severe impairment) vs Group D (normal function): 9.02 vs 7.93 μg/L (Figure 3A). The geometric mean AUC was also similar in all 4 groups 216 vs 160 μg · h/L (moderate vs normal) and 162 vs 146 μg · h/L (severe vs normal) (Figure 3B). The variability in AUC was generally higher in the renal impairment groups (coefficient of variation, 62.1% vs 31.9%, moderate vs normal and 63.5% vs 47.1% (severe vs normal) (Table 2). The point estimates of the geometric mean ratios and its associated 90%CI of AUC and Cmax in participants with moderate renal impairment compared to with those in participants who exhibited normal renal function were 1.35 (90%CI, 0.918‐1.973) and 1.026 (90%CI, 0.779‐1.351), respectively, indicating no difference.
Figure 2.
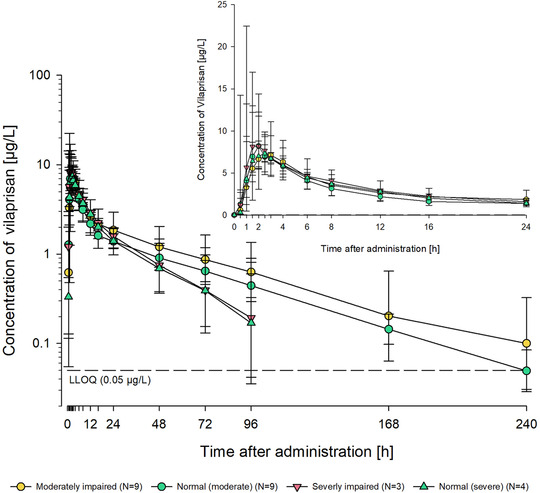
Total vilaprisan plasma concentrations (μg/L) over time after a single oral 2‐mg dose administered under fasting conditions in participants with moderate renal impairment (Group A) or severe impairment (Group C) and matched control participants with normal renal function (Group B, moderate‐normal; Group D, severe‐normal). Semilogarithmic scale (error bars are standard deviations). Inset: Linear scale for the first 24 h after dosing. Planned sampling times used. Predose sample was set to 0 hours. Lower limit of quantification = 0.05 μg/L.
Figure 3.
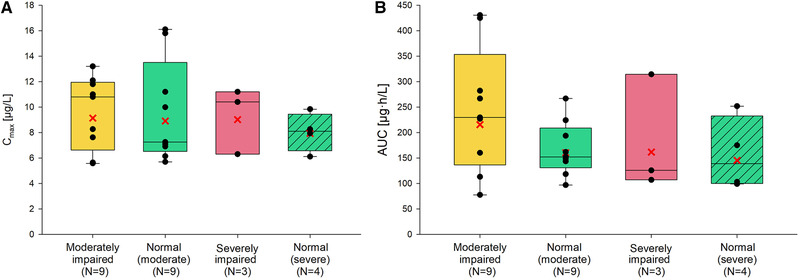
Vilaprisan total plasma exposure by group: (A) maximum observed plasma concentration Cmax; (B) area under the concentration‐time curve (AUC). Box, 25th to 75th percentile; horizontal line, median; cross, geometric means; vertical lines (whiskers), 10th and 90th percentiles. Any value more extreme is plotted separately.
Table 2.
Summary Statistics of PK Parameters of Vilaprisan in Plasma
| Parameter (Unit) | Group | n | Geom Mean | Geom CV (%) | Min | Median | Max |
|---|---|---|---|---|---|---|---|
| AUC, | Moderately impaired | 9 | 216 | 62.1 | 77.6 | 230 | 431 |
| μg · h/L | Normal (moderate) | 9 | 160 | 31.9 | 96.8 | 152 | 267 |
| Severely impaired | 3 | 162 | 63.5 | 107 | 126 | 314 | |
| Normal (severe) | 4 | 146 | 47.1 | 99.0 | 139 | 252 | |
| AUC(0‐tlast), μg · h/L | Moderately impaired | 9 | 206 | 63.8 | 69.4 | 225 | 411 |
| Normal (moderate) | 9 | 154 | 33.3 | 90.8 | 147 | 260 | |
| Severely impaired | 3 | 157 | 61.6 | 106 | 122 | 300 | |
| Normal (severe) | 4 | 141 | 46.8 | 95.8 | 134 | 243 | |
| Cmax, μg/L | Moderately impaired | 9 | 9.14 | 33.7 | 5.58 | 10.8 | 13.2 |
| Normal (moderate) | 9 | 8.91 | 41.0 | 5.70 | 7.25 | 16.1 | |
| Severely impaired | 3 | 9.02 | 32.1 | 6.30 | 10.4 | 11.2 | |
| Normal (severe) | 4 | 7.93 | 19.9 | 6.11 | 8.11 | 9.84 | |
| t1/2, h | Moderately impaired | 9 | 52.7 | 40.1 | 33.1 | 45.5 | 89.1 |
| Normal (moderate) | 9 | 47.4 | 11.8 | 38.1 | 49.3 | 55.3 | |
| Severely impaired | 3 | 29.9 | 101 | 16.3 | 21.1 | 77.8 | |
| Normal (severe) | 4 | 35.8 | 92.8 | 15.2 | 42.6 | 76.9 | |
| CL/F, L/h | Moderately impaired | 9 | 9.27 | 62.1 | 4.65 | 8.71 | 25.8 |
| Normal (moderate) | 9 | 12.5 | 31.9 | 7.50 | 13.2 | 20.7 | |
| Severely impaired | 3 | 12.4 | 63.5 | 6.36 | 15.9 | 18.7 | |
| Normal (severe) | 4 | 13.7 | 47.1 | 7.94 | 15.4 | 20.2 | |
| CLR(0‐24), L/h | Moderately impaired | 9 | 0.0226 | 72.9 | 0.0050 | 0.0244 | 0.0512 |
| Normal (moderate) | 9 | 0.0319 | 61.1 | 0.0102 | 0.0325 | 0.0612 | |
| Severely impaired | 3 | 0.0239 | 28.3 | 0.0185 | 0.0228 | 0.0321 | |
| Normal (severe) | 4 | 0.0375 | 16.2 | 0.0307 | 0.03804 | 0.0444 | |
| VZ/F, L | Moderately impaired | 9 | 705 | 34.8 | 426 | 695 | 1230 |
| Normal (moderate) | 9 | 853 | 29.7 | 534 | 928 | 1310 | |
| Severely impaired | 3 | 534 | 26.0 | 441 | 484 | 714 | |
| Normal (severe) | 4 | 709 | 40.8 | 426 | 765 | 1040 | |
| tmax, h | Moderately impaired | 9 | 1.50 | 2.00 | 6.00 | ||
| Normal (moderate) | 9 | 0.50 | 2.00 | 2.52 | |||
| Severely impaired | 3 | 1.50 | 2.00 | 3.00 | |||
| Normal (severe) | 4 | 1.50 | 2.25 | 2.50 | |||
| tlast, h | Moderately impaired | 9 | 96.0 | 240 | 336 | ||
| Normal (moderate) | 9 | 168 | 239 | 240 | |||
| Severely impaired | 3 | 96.0 | 96.0 | 337 | |||
| Normal (severe) | 4 | 72.0 | 168 | 336 | |||
| fu | Moderately impaired | 9 | 0.0292 | 19.1 | 2.14 | 3.12 | 3.81 |
| Normal (moderate) | 9 | 0.0338 | 15.1 | 2.52 | 3.64 | 3.95 | |
| Severely impaired | 3 | 0.0357 | 8.99 | 3.23 | 3.67 | 3.84 | |
| Normal (severe) | 4 | 0.0346 | 19.0 | 2.63 | 3.71 | 3.97 |
AUC, area under the plasma concentration–time curve; AUC(0‐tlast), area under the plasma concentration‐time curve from time zero until last data point above LLOQ; Cmax, maximum concentration; CL/F, apparent oral clearance; CLR(0‐24), renal clearance determined from urine collected over 24 hours; fu, fraction of free (unbound) vilaprisan in plasma; CV, coefficient of variation; PK, pharmacokinetic; t1/2, terminal half‐life; tlast, time of last concentration above LLOQ; tmax, time to maximum concentration; VZ/F, apparent oral volume of distribution during the terminal phase.
Moderately impaired: moderate renal function; normal (moderate): normal renal function (control for moderate renal impairment); severely impaired: severe renal function; normal (severe): normal renal function (control for severe renal impairment).
Displayed values are based on 3 valid digits.
The apparent oral volume of distribution during the terminal phase (Vz/F) was lower in renally impaired participants as compared to their respective controls and decreased from moderate to severe renal impaired participants: 705 vs 853 L (moderate vs normal) and severely renally impaired vs normal (534 vs 709 L), see Table 2. The geometric mean apparent oral clearance (CL/F) was only slightly different between moderate impairment and normal function (9.27 vs 12.5 L/h) and severe vs normal (12.4 vs 13.7 L/h). Also, geometric mean terminal half‐lives were similar in participants with moderate impairment (52.7 hours) compared to control (47.4 hours) and between severe impairment (29.9 hours) and control (35.8 hours). The renal clearance (CLR) of vilaprisan determined from urine collected over 24 hours (CLR(0‐24)) was very low in all groups. Between the groups, the renal clearance was lower in participants with renal impairment compared to participants with normal renal function as indicated by geometric mean CLR(0‐24) values of 0.0226, 0.0239, 0.0319, and 0.0375 L/h in the groups with moderate and severe impairment and control groups, respectively (Table 2).
Fraction Unbound
The fu in plasma (average, 2, 24, 48 hours postdosing) was similar in all 4 groups: 2.92% in participants with moderate renal impairment (normal‐moderate, 3.38%) and 3.57% participants with severely renal impairment (normal‐severe, 3.46%); see Table 2.
Relationship Between PK Parameters and eGFR
The relationship of the primary PK parameters AUC or Cmax vs eGFR values at screening is shown in Figure 4A and Figure 4B, respectively. Spearman's coefficient of correlation (95%CI) of –0.3712 (–0.7360 to –0.0065) and of –0.2049 (–0.5904 to 0.1806) for AUC and Cmax, respectively, were determined, indicating no correlation between eGFR and AUC or eGFR and Cmax, respectively. Also, no relationship between the PK parameters AUC, area under the unbound plasma concentration‐time curve (AUCu), Cmax, maximum observed unbound drug concentration (Cmax,u), CL/F, apparent oral unbound clearance (CLu/F), terminal half‐life, CLR, and eGFR at screening and for fu of vilaprisan and albumin concentration were observed (data not shown).
Figure 4.
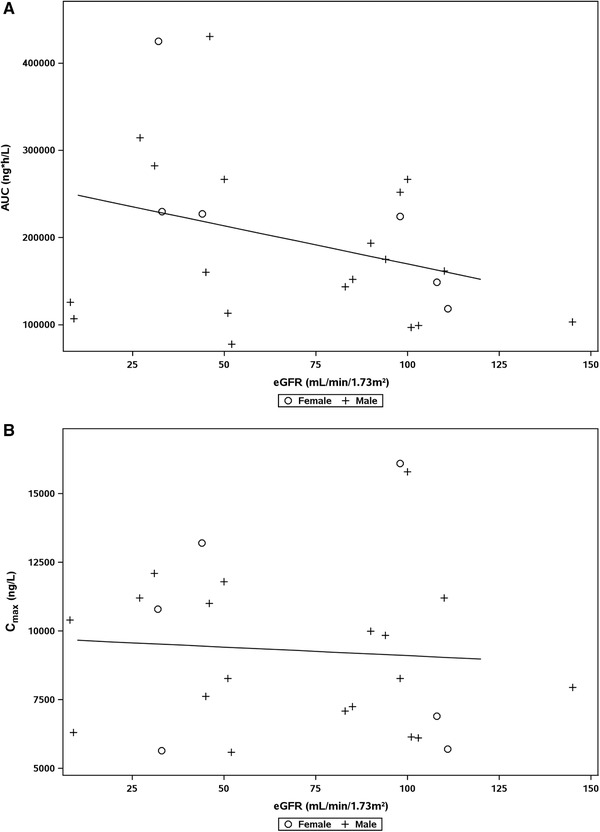
Relationship between area under the concentration‐time curve (AUC) (A) and maximum concentration (Cmax) (B) of vilaprisan in plasma and estimated glomerular filtration rate (eGFR) at screening. (A) Spearman's correlation coefficient, –0.3712 with 95% confidence interval [CI], –0.7360 to –0.0065. Overall linear regression: AUC = 257207 – 8760611*eGFR (R2 = 0.1137). (B) Spearman's correlation coefficient, –0.2049 with 95%CI, –0.5904 to 0.1806. Overall linear regression: Cmax = 9727.2 – 6.2372*eGFR (R2 = 0.0057).
Safety
All 26 participants (100%) who received vilaprisan were included in the safety analysis. In 3 moderately impaired participants (11.5%), 5 AEs of mild intensity were reported: abdominal discomfort, constipation, diarrhea, pyrexia, and headache. The observed types of adverse events are frequently observed in participants involved in clinical phase 1 trials. Therefore, they were not considered to indicate any specific risk, even though all of these AEs occurred in the cohort of participants with moderately impaired renal function. All of the AEs were resolved at the end of the study. No participant experienced a serious AE or death, and there were no study discontinuations due to AEs.
Discussion and Conclusions
This study showed that Cmax and AUC of vilaprisan are very similar in participants with moderately impaired renal function compared to participants with normal renal function. Furthermore, explorative analyses indicated no difference of Cmax and AUC in participants with severely impaired renal function, not on dialysis compared to participants with normal function. In addition, no obvious correlation between eGFR at screening and any of the primary and secondary PK parameters were observed. These results are consistent for a drug that is almost completely eliminated from plasma by hepatic metabolism and only marginally excreted unchanged with urine, for example, with no contribution of renal clearance on overall clearance. Based on the results of this study, no dose adjustment is required in patients with moderate renal impairment, and the same dose of 2 mg/day can be used in this patient population. In this study, a reduced design was applied comprising a moderate impaired group of 9 participants and an explorative group of 4 participants with severe renal impairment. The approach was guided by the assumption that a potential change in vilaprisan exposure of <2‐fold in patients with renal impairment would not require a dose adjustment considering the good safety profile of vilaprisan observed in patients. The obtained data allowed giving a clear dose recommendation for the moderate impairment group. In addition, by including a limited number of participants with severe renal impairment and using a regression analysis over all study participants, evaluation could be extended to participants with up to severe renal impairment. The results indicate that even in patients with severe renal impaired function (<30 mL/min/1.73 m2), not on dialysis, PK of vilaprisan are not relevantly changed. In this study, a single oral dose of vilaprisan 2 mg was well tolerated by participants of both sexes with moderate or severe renal impairment, and in participants with normal renal function. Safety findings in this study were comparable with observations from previous phase 1 2 , 12 , 13 and phase 2 3 , 4 studies in which vilaprisan was well tolerated, with no drug‐related serious AEs even at the maximal daily doses used in females. Here, the most frequently observed treatment‐emergent AEs were abdominal discomfort, constipation, diarrhea, pyrexia, headache, and nausea. The observed types of AEs are frequently observed in participants involved in clinical phase 1 trials. Therefore, they were not considered to indicate any specific risk, even though all these treatment‐emergent AEs occurred in the cohort of participants with moderately impaired renal function. All the AEs were mild in intensity and were resolved at the end of the study. In conclusion, the available results support a recommendation that no dose adjustment is required in patients with moderate renal impairment.
Conflicts of Interest
All authors are employees of or work(ed) for Bayer AG.
Funding
This study was funded by Bayer AG.
Data Sharing
The data sets used and/or analyzed during the current study are available from the corresponding author on reasonable request.
Supporting information
Patient Selection Criteria
Acknowledgments
The clinical part of the study was conducted at CPMI, Miami, USA and at OCRC, Orlando USA. Clinical lab analyses including hormone measurements were carried out locally. For CPMI, the local laboratories were at Reliable Research Laboratory, Orlando, Florida, until June 22, 2018, and subsequently at Eccolab Group Miami, Florida. For OCRC, the local laboratory was Eccolab Group Tampa, Florida. K.L. was the principal investigator of the study. Vilaprisan concentrations were analyzed at Syneos Health, Quebéc, Canada. The authors thank Antonia Kohnke, Bayer AG, Berlin Germany, for support with data analysis and figures.
References
- 1. Baird D, Dunson D, Hill M, Cousins D, Schectman J. High cumulative incidence of uterine leiomyoma in black and white women: ultrasound evidence. Am J Obstet Gynecol. 2003;188:100‐107. [DOI] [PubMed] [Google Scholar]
- 2. Schultze‐Mosgau MH, Schuett B, Hafner FT et al. Pharmacokinetics and safety of the selective progesterone receptor modulator vilaprisan in healthy postmonopausal women. Int J Clin Pharmacol Ther. 2017;55:16‐24. [DOI] [PubMed] [Google Scholar]
- 3. Bradley L, Singh S, Simon J, et al. Vilaprisan in women with uterine fibroids: randomized phase 2b ASTEROID 1 study. Fertil Steril. 2019;111:240‐248. [DOI] [PubMed] [Google Scholar]
- 4. Gemzell‐Danielsson K, Ramirez K, Petersdorf K, Faustmann T, Seitz C. Efficacy and safety of the selective progesterone receptor modulator (PRM) vilaprisan: data from the phase 2 ASTEROID 2 study. ESG Congress; 2017..
- 5. Seitz C, Al‐Hendy A, Bradley L, et al. The clinical development of vilaprisan: the ASTEROID phase 3 program. SEUD, Florence, Italy; 2018. [Google Scholar]
- 6. Schultze‐Mosgau MH, Hochel J, Prien O, et al. Characterization of the pharmacokinetics of vilaprisan: bioavailability, excretion, biotransformation, and drug‐drug interaction potential. Clin Pharmacokinet. 2018;57:1001‐1015. [DOI] [PMC free article] [PubMed] [Google Scholar]
- 7. US Food and Drug Administration . Guidance for Industry: Pharmacokinetics in patients with impaired renal function—study, design, data analysis, and impact on dosing and labeling. https://www.fda.gov/regulatory-information/search-fda-guidance-documents/pharmacokinetics-patients-impaired-renal-function-study-design-data-analysis-and-impact-dosing-and. Published 2010. Accessed February 2020.
- 8.European Medicines Agency. Guideline on the evaluation of the pharmacokinetics of medicianl products in patients with decreased renal function. https://www.ema.europa.eu/en/documents/scientific-guideline/guideline-evaluation-pharmacokinetics-medicinal-products-patients-decreased-renal-function_en.pdf. Published 2016. Accessed February 2020.
- 9. Chattopadhyay N, Riecke K, Ligges S, Zimmermann T, Halabi A, Schultze‐Mosgau MH. Effect of hepatic impairment on the pharmacokinetics of vilaprisan: an open‐label, single‐dose, parallel‐group study. Br J Clin Pharmacol. 2019;85:2011‐2021. [DOI] [PMC free article] [PubMed] [Google Scholar]
- 10. Outcomes Kidney Disease Improving Global. KDIGO 2012 clinical practice guideline for the evaluation and management of chronic kidney disease. Kidney Int Suppl. 2013;3:1‐150. [DOI] [PubMed] [Google Scholar]
- 11. Schuhmacher J, Kohlsdorfer C, Buhner K, Brandenburger T, Kruk R. High‐throughput determination of the free fraction of drugs strongly bound to plasma proteins. J Pharm Sci. 2004;93:816‐830. [DOI] [PubMed] [Google Scholar]
- 12. Schuett B, Kaiser A, Schultze‐Mosgau MH, et al. Pharmacodynamics and safety of the novel selective progesterone receptor modulator vilaprisan: a double‐blind, randomized, placebo‐controlled phase 1 trial in healthy women. Hum Reprod. 2016;31:1703‐1712. [DOI] [PubMed] [Google Scholar]
- 13. Schuett B, Schultze‐Mosgau MH, Draeger C, et al. Effect of the novel selective progesterone receptor modulator vilaprisan on ovarian activity in healthy women. J Clin Pharmacol. 2018;58:228‐239. [DOI] [PMC free article] [PubMed] [Google Scholar]
Associated Data
This section collects any data citations, data availability statements, or supplementary materials included in this article.
Supplementary Materials
Patient Selection Criteria