

Abstract
Having physiological correct flow waveforms is a key feature for experimental studies of blood flow, especially in the process of developing and testing a new medical device such as stent, mechanical heart valve, or any implantable medical device that involves circulation of blood through the device. It is also a critical part of a perfusion system for cardiopulmonary bypass and extracorporeal membrane oxygenation procedures. This study investigated the feasibility of a novel roller pump for use in experimental flow phantoms. Flow rates of carotid flow profile measured directly with the ultrasonic flow meter matched well with the reference flow rates programmed into the machine with similarity index of 0.97 and measured versus programmed flow rates at specific time‐points of peak systolic velocity (PSV): 0.894 vs 0.880, end systolic velocity (ESV): 0.333 vs 0.319, and peak diastolic velocity (PDV): 0.514 vs 0.520 L/min. Flow rates derived from video analysis of the pump motion for carotid, suprarenal, and infrarenal flows also matched well with references with similarity indices of 0.99, 0.99, and 0.96, respectively. Measured flow rates (mean/standard deviation) at PSV, ESV, and PDV time‐points for carotid: 0.883/0.016 vs 0.880, 0.342/0.007 vs 0.319, and 0.485/0.009 vs 0.520; suprarenal: 3.497/0.014 vs 3.500, 0.004/0.003 vs 0, and 1.656/0.073 vs 1.453; infrarenal: 4.179/0.024 vs 4.250, −1.147/0.015 vs −1.213, and 0.339/0.017 vs 0.391 L/min, respectively. The novel roller pump is suitable for benchtop testing of physiological flow.
Keywords: blood pump, cardiopulmonary bypass , experimental study, extracorporeal membrane oxygenation, flow phantom, in vivo, physiological flow, pulsatile flow, roller pump, triphasic flow
1. INTRODUCTION
Experimental flow phantoms for blood flow simulation are used by researchers to carry out experiments without subjecting living subjects to potential risk of injuries or damage to living organs. It is an indispensable tool for in vitro studies, especially in relation to the study of stenosis, aneurysms, and failing heart valves. Furthermore, it has been successfully used by researchers to study and validate new treatment methods such as minimally invasive endovascular stent treatments.1, 2 In addition, computational fluid dynamics (CFD) numerical method was validated by running particle imaging velocimetry (PIV) experiments with flow phantoms.3, 4, 5 The requirements of flow setups to reproduce realistic arterial flow waveforms were reviewed extensively by Law et al,6 Holdsworth et al,7 and Hoskins et al.8 The basic requirement is that it must be capable of reproducing pulsatile flow mimicking human arterial flow physiology and that it is easy to program. These authors have also provided thorough reviews of previous work. Previous devices can be classified according to the type of pumps used in the setup that is, gear, piston, or roller/peristaltic. Gear pumps have been used by Groot Jebbink et al,1 Boersen et al,2 and Hoskins8 to generate the pulsatile waveforms. However, the disadvantage of gear pumps is that suspended particles are easily damaged and it is sensitive to cavitation produced by the hydrodynamic action of the gears. Holdswoth et al,7 Rudenick et al,9 and Poot et al10 simulated the peripheral arterial flow with piston pumps. This class of pumps shares the general disadvantage of difficulty in programming. Standard peristaltic pumps were modified by Law et al6 and Douville et al11 to generate the physiological flow waveforms based on mechanical manipulation of the actuating back plate and computer control of the roller. This technique allows the generation of a limited number of waveforms; however, it is difficult to program new waveforms and even harder to produce reverse flow which is physiologically relevant to simulate. More recently Shkolnikov et al12 and Neto et al13 developed a roller‐free peristaltic pump using actuators to produce pulsatile waveforms. However, these pumps were developed for use in microfluidic applications at low flow rates and are not suitable for larger arteries. The main limitation of the standard roller pump is that it generates approximately a sinusoidal waveform at low speed in rotations per minute (RPM) and approaches continuous flow at higher RPM to generate higher stroke volume which does not conform to human blood flow physiology. The reciprocating roller pump proposed here is an improved version, which circumvents the limitation of the standard roller pump with a unique mechanical design, combined with precision digital motion control technology. Three types of vascular flow namely carotid, suprarenal, and infrarenal flows were generated from a proof of concept prototype and the measured flow profiles were compared against the reference flow profiles.
2. MATERIALS AND METHODS
2.1. Experimental flow circuit
A novel, reciprocating roller pump was developed based on the principle of reciprocating peristaltic movements on two parallel straight tracks as outlined in Figure 1. The main pumping chamber consisted of two occluding rollers driven by two sets of 2 Nm hybrid servo stepper motors (NEMA23, model number 57J1880EC‐1000) and closed loop hybrid servo drives (2HSS57, Just Motion Control, Shenzhen, China) and two roller carriers driven by a further two sets of stepper motors and drives. Each occluding roller was mounted offset from the shaft of the stepper motor whereby the tubing can be occluded by rotating the shaft in one direction and released by rotating the shaft in the opposite direction. Each roller carrier was mounted on a linear guide and attached to a toothed belt (ZLW‐0630 drylin linear guide, Igus, Cologne, Germany) driven by a stepper motor. An Arduino compatible, high speed microcontroller Teensy 4.0 (PJRC.com, LLC, Sherwood, OR,USA) with a 600 MHz processor was used to generate control signals that drive the movement of the stepper motors. Smooth motion and low noise were achieved by means of micro stepping. Masterflex platinum‐cured silicone tubing I/P82 (Cole‐Parmer, Vernon Hills, IL, USA) with tubing internal diameter of 12.5 mm was used to contain carotid, suprarenal and infrarenal flows in this study. The tubing connected to a port located at the lower section of the reservoir to the pumping chamber is the inlet tubing, whereas the tubing connected to the pumping chamber to a high precision ultrasound flow meter ES‐Flow 1131 (Bronkhorst High‐Tech B.V., AK Ruurlo, The Netherlands) is the outlet tubing. A blood mimicking fluid (BMF) comprising of 40% by volume of glycerine (Sanofi Consumer Healthcare, Virginia QLD, Australia) and 60% water by volume was used as a working fluid in the flow circuit as its density and viscosity approximates that of the human blood. A flow loop was created by circulating the BMF from the reservoir to the pumping chamber via the inlet tubing and then to the flow meter via the outlet tubing and finally discharging the BMF back into the reservoir to complete the flow circuit. The circulation was achieved by occluding the roller located near the inlet tubing in the initial position as shown in Figure 1 but not the roller located near the outlet tubing then moving the roller carriers away from the reservoir hence creating the first cardiac cycle. The next cardiac cycle is achieved by occluding the roller near the outlet tubing but not the roller near the inlet tubing and subsequently moving the roller carriers toward the reservoir. A continuous cycle is then created by alternating movement of the roller carrier between the two tracks of the pumping chamber.
Figure 1.
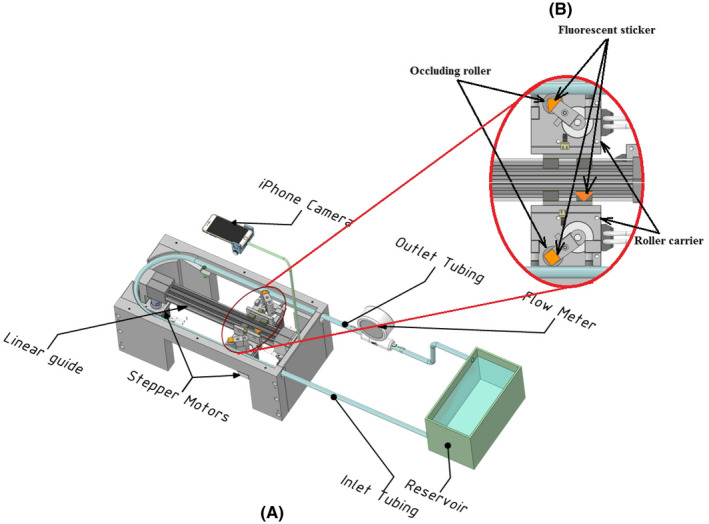
A, Experimental flow circuit with ultrasonic flow meter and camera motion analysis set‐up. B, Details of tubing occlusion mechanism and locations of fluorescent stickers [Color figure can be viewed at wileyonlinelibrary.com]
2.2. Flow profiles
The flow rates at 10 ms intervals of a carotid flow profile based on Sousa et al were digitized manually by placing a tracing graph paper on top of an enlarged copy of a periodic cycle obtained from a clinical Doppler ultrasound scanner as shown in Figure 2.14 The flow rate at each time‐point was calculated by multiplying the cross‐sectional area of the common carotid artery (CCA) by the average velocity. Assuming fully developed flow in CCA therefore, average velocity is half of center line velocity. Based on CCA diameter of 0.7 cm and peak systolic velocity (PSV) of 76.43 cm/s,14 the flow rate at PSV time‐point was determined to be 0.88 L/min. A look‐up table with 100 pairs of flow rate versus time values was then created for use by the inhouse developed motion control software to drive the reciprocating roller pump.
Figure 2.
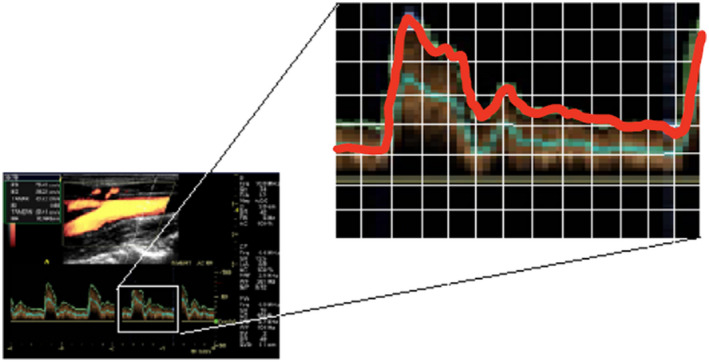
Manual digitization of flow profile [Color figure can be viewed at wileyonlinelibrary.com]
The suprarenal flow profile used in this study was based on Lee et al15 where the flow rate Q in L/min was represented by a trigonometric formula as shown in Equation (1).
| (1) |
where C 1 = 1.281, C 2 = 0.064, C 3 = −1.03, C 4 = 0.885, C 5 = −0.166, and t is the time in second. The period T and coefficient C 1 were modified from 0.83 and 2.891 to produce zero end systolic velocity (ESV) and 60 beats per minute or 1 Hz (T = 1 seconds), resting heart rate to match the suprarenal profile used by Groot Jebbink et al1 Infrarenal flow profile based on Fraser et al16 was digitized manually with 100 time points at 10 ms intervals. The effective flow rate was adjusted from 13.3 to 12.5 mL and heart rate was adjusted from 64.5 to 60 beats/minute. Table 1 shows the flow rate values at PSV, ESV, and Peak Diastolic Velocity (PDV) time‐points for carotid, suprarenal, and infrarenal flows. The flow profiles as shown in Figure 3 were loaded into the roller pump Arduino sketch (Arduino IDE, Arduino Holdings, Somerville, MA, USA).
Table 1.
Reference flow rates at PSV, ESV, and PDV time‐points for carotid, suprarenal, and infrarenal flow
| Flow type | Programmed flow rate at specific time‐point (L/min) | ||
|---|---|---|---|
| PSV | ESV | PDV | |
| Carotid | 0.880 | 0.319 | 0.520 |
| Suprarenal | 3.500 | 0 | 1.453 |
| Infrarenal | 4.250 | −1.213 | 0.391 |
Figure 3.
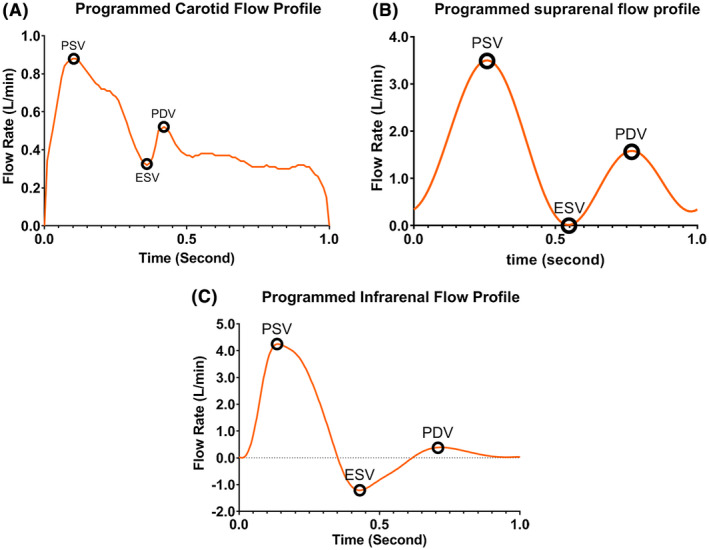
Reference flow profiles (A) carotid (B) suprarenal, and (C) infrarenal flow [Color figure can be viewed at wileyonlinelibrary.com]
2.3. Flow profile generation
Flow profiles were generated based on human physiological resting conditions with effective volumetric flow rates of 0.36, 1.5, and 0.75 L/min or stroke volumes of 6, 25, and 12.5 mL for carotid, suprarenal, and infrarenal flows, respectively. A stop watch was used to count the number of strokes per minute and the desired 60 beats/minute heart rate was achieved by adjusting the Heart Beat control knob on the user interface panel. The volume of BMF from 10 strokes was collected into a 400 mL graduated glass beaker (Pyrex No.1000, Corning Inc., NY, USA) from the outlet tubing and the stroke volume was then calculated by dividing the content in the beaker by 10. The desired stroke volume was achieved by adjusting the Stroke Volume control knob on the user interface panel.
2.4. Flow profile measurements
An ultrasonic flow meter (Bronkhorst ES‐Flow 1131) with a minimum polling time of 10 ms was used to provide fast response and a real time display of the flow profile. In addition, 12 periodic cycles of a carotid flow profile were captured, stored, and later retrieved for further analysis. Since the maximum flow rate for the Bronkhorst ES‐Flow 1131 was 1.5 L/min, it was only suitable for carotid flow profile with a PSV flow rate of 0.88 L/min. For flows with a PSV flow rate higher than 1.5 L/min, an indirect method based on motion analysis was developed to determine its suitability. A Cynergy3 ultrasonic flow sensor (Type UF8B; Cynergy3 Components Ltd, Wimborne, Dorset, UK) was used to guide the set‐up of the desired flow rate for suprarenal and infrarenal flows as it is able to measure flow rates up to 10 L/min with a 100 ms response time. An Apple iPhone 7 (Apple Computer Inc., Cupertino, CA, USA) mounted on top of the roller pump as shown in Figure 1 was used to capture images with 1280 × 720 pixel resolution at 240 frames per second and an inhouse developed Matlab (MathWorks, Natick, MA, USA) script was used to analyze the movement of fluorescent stickers. The clarity of the fluorescent stickers was enhanced by illuminating ultraviolet light in a dark room during the recording as shown in Figure 4A. Segmentation of the images to extract the centroid position of the fluorescent sticker was achieved based on thresholding of the image as shown in Figure 4B. A 200 × 10 mm reflective tape (Scotchlite, 3M Company, Maplewood, MN, USA) was used to calibrate the camera pixel dimensions in the captured image. The velocity of the centroid was calculated based on displacement of the centroid between two successive frames. Smoothing was applied by averaging five adjacent displacements to remove vibrations and lighting artifacts . The volumetric flow was determined by multiplying velocity and internal cross‐sectional area of the tubing. For each flow type, 12 profiles were averaged for statistical and similarity analyses.
Figure 4.
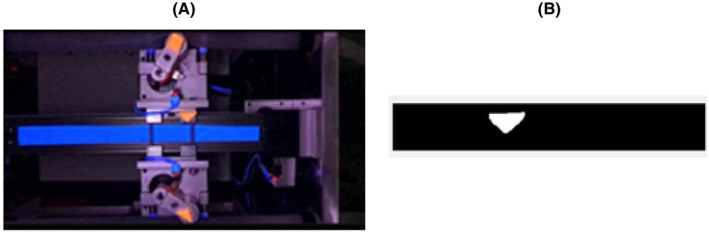
(A) Recording of fluorescent stickers with ultraviolet light and (B) Segmentation of a fluorescent sticker recording [Color figure can be viewed at wileyonlinelibrary.com]
Specific time points at PSV, ESV, and PDV in each flow profile as described were used to compare how well a flow profile generated by the reciprocating roller pump matched the reference profile that was programmed into the machine. In addition, cosine similarity was used to compare measured versus programmed profile, where the similarity index is defined as given in Equation (2).
| (2) |
where is the dot product of two vectors: vector A contains the programmed values and vector B contains the measured values of the flow profiles. ||A|| and ||B|| are the magnitudes of the vectors A and B, respectively. The resulting similarity index ranges from zero to one.
3. RESULTS
Table 2 summarizes the test results comparing measured versus programmed flow profiles. Flow profiles measured directly from the ultrasonic flow meter and indirectly through motion analysis of the fluorescent stickers attached to pump roller matched well for the carotid profile with similarity indices of 0.97 and 0.99. Therefore, the motion analysis was deemed as a quantitative measurement method. In addition, similarity indices between measured and programmed profiles based on the motion analysis method for suprarenal and infrarenal flow profiles were 0.99 and 0.96, respectively.
Table 2.
Test results of comparison between measured and programmed flow profiles
| Flow type (measurement method) | Programmed PSV (L/min) | Measured flow rate at PSV time‐point (L/min) | Programmed ESV (L/min) | Measured flow rate at ESV time‐point (L/min) | Programmed PDV (L/min) | Measured flow rate at PDV time‐point (L/min) | Similarity index | |||
|---|---|---|---|---|---|---|---|---|---|---|
| Mean | Std Dev | Mean | Std Dev | Mean | Std Dev | |||||
| Carotid (ultrasound flow meter) | 0.880 | 0.894 | 0.021 | 0.319 | 0.333 | 0.016 | 0.520 | 0.514 | 0.013 | 0.97 |
| Carotid (motion analysis) | 0.880 | 0.883 | 0.016 | 0.319 | 0.342 | 0.007 | 0.520 | 0.485 | 0.009 | 0.99 |
| Suprarenal (motion analysis) | 3.500 | 3.497 | 0.014 | 0 | 0.004 | 0.003 | 1.453 | 1.656 | 0.073 | 0.99 |
| Infrarenal (motion analysis) | 4.250 | 4.179 | 0.024 | −1.213 | −1.147 | 0.015 | 0.391 | 0.339 | 0.017 | 0.96 |
3.1. Carotid flow
About 12 cycles of carotid flow profile measured with ultrasonic flow meter method and motion analysis method are as shown in Figure 5A,B. There was a small difference for flow rates at PSV time‐point between even and odd cycles indicating a slight systematic difference between the two tracks of the pumping chamber. Figure 6 shows the plots of mean flow rate with ± one standard deviation (SD) for measured flow profile against the programmed profile. The measured carotid flow profiles for direct and indirect methods matched well with reference profile except, the PSV time‐point for measured profile occurred about 0.1 and 0.05 second later as compared with programmed profile for direct and indirect method, respectively. Measured mean flow rate and SD versus programmed flow rate at PSV, ESV, and PDV time‐points were: 0.894/0.021 and 0.883/0.016 vs 0.880; 0.333/0.016 and 0.342/0.007 vs 0.319; 0.514/0.013 and 0.485/0.009 vs −0.520 L/min for ultrasonic flow meter and motion analysis method, respectively.
Figure 5.
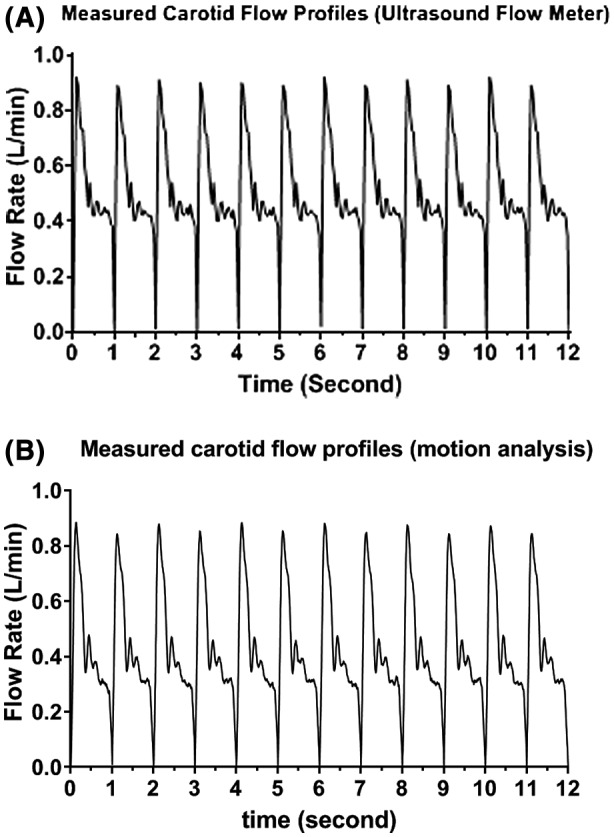
Carotid flow profile measured with (A) ultrasonic flow meter and (B) motion analysis method
Figure 6.
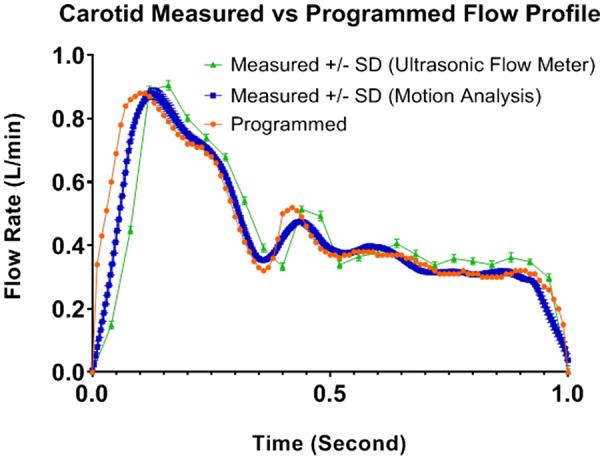
Carotid flow profile measured versus reference [Color figure can be viewed at wileyonlinelibrary.com]
3.2. Suprarenal flow
From Figure 7A, flow rate at PSV time‐point was consistent from cycle to cycle, however at PDV time‐point, the flow rate from odd cycles were slightly lower than those from even cycles indicating a slight systematic difference between the alternating tracks. Figure 7B shows the plot of mean with ± one SD for the measured flow profile based on motion analysis method against the programmed profile. Measured suprarenal mean and SD versus programmed flow rate at PSV, ESV, and PDV time‐points were: 3.497/0.014 vs 3.500, 0.004/0.003 vs 0, and 1.656/0.073 vs 1.453 L/min, respectively. In addition, PSV time‐point from motion analysis method was about 0.05 second sooner than the reference, whereas PDV time‐point was about 0.05 second later than the reference.
Figure 7.
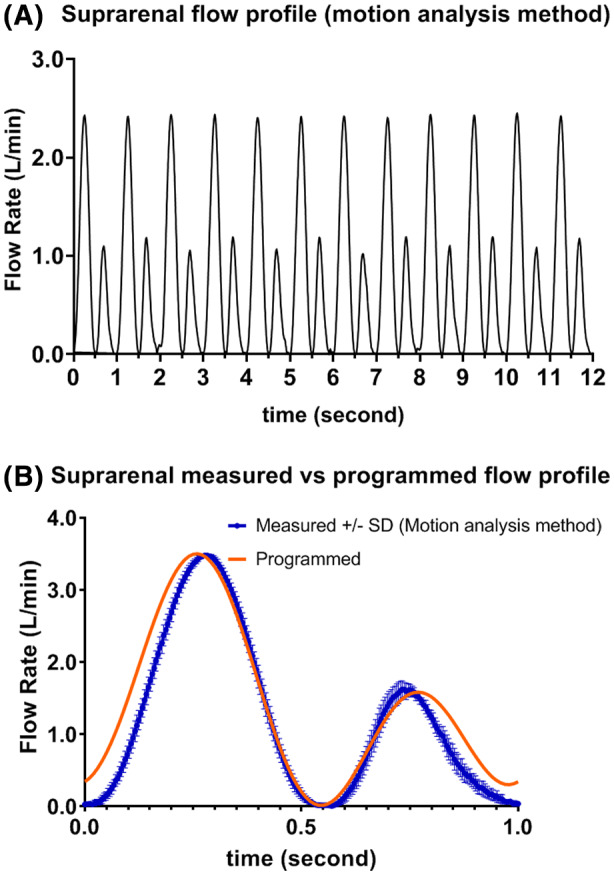
(A) Measured suprarenal flow profile (12 cycle) (B) Measured versus programmed suprarenal flow profile [Color figure can be viewed at wileyonlinelibrary.com]
3.3. Infrarenal flow
Figure 8A shows a plot of 12 cycles when the pump was selected to generate infrarenal flow. The measured flow rate at PSV time‐point based on the motion analysis method matched well with reference. In contrast, the measured flow rates at ESV and PDV time‐points were slightly lower as compared with reference. In addition, these time‐points also occurred about 150 ms later in the cycle compared with the programmed ESV and PDV time‐points. The delay might be caused by backlash when the roller carrier was changing direction. Measured infrarenal mean and SD versus programmed flow rate at PSV, ESV, and PDV time‐points were: 4.179/0.024 vs 4.250, −1.147/0.015 vs −1.213, and 0.339/0.017 vs 0.391 L/min, respectively.
Figure 8.
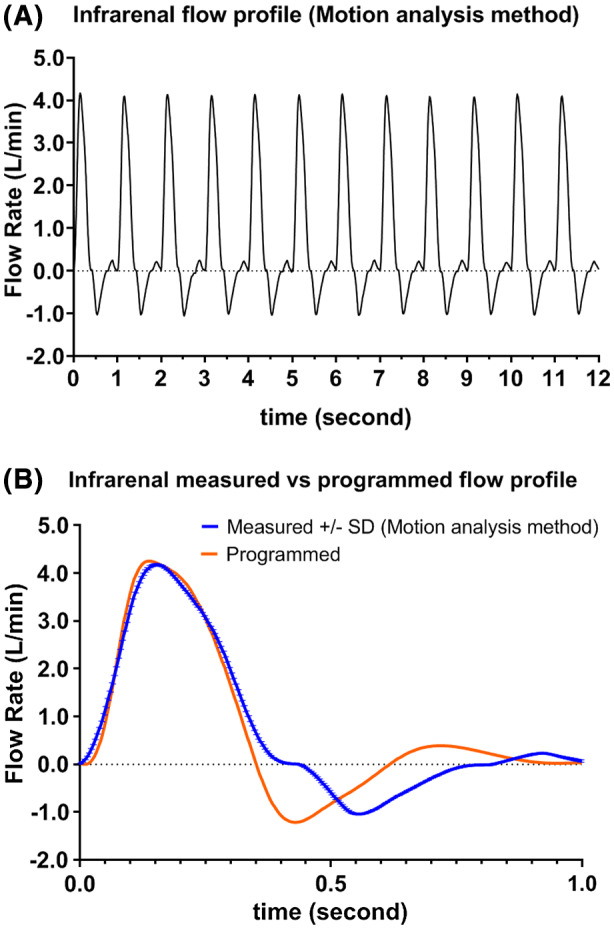
(A) Measured infrarenal flow profile (12 cycles) (B) Measured versus programmed infrarenal flow profile [Color figure can be viewed at wileyonlinelibrary.com]
4. DISCUSSION
In this study, it was demonstrated that the flow profile generated by the reciprocating roller pump and measured with a high precision ultrasound flow meter matched well with programmed profile with a similarity index of 0.98. In addition, the magnitude of the measured flow rates at PSV, ESV, and PDV time‐points also matched well against reference. Moreover, it was also demonstrated that the indirect method based on motion analysis produced good results with a similarity index of 0.99 and well matched flow rates at PSV, ESV, and PDV time‐points therefore suitable as a surrogate flow measurement method. The main advantage of this novel pump compared with other commercially available pumps is its simplicity in generating the peripheral flow profiles. Traditionally, two needle valves located at renal artery outlets, an air chamber and a needle valve in series located at the combined common iliac artery outlets representing a two‐element Windkessel were used1, 2, 17, 18 to simulate the vessel resistance and peripheral compliance in order to generate flow profile with reverse flow in the early diastolic phase. With the reciprocating roller pump design, it can produce back flow in the peripheral artery without the use of renal artery flow in the circuit, therefore it simplifies the flow circuit for in vitro studies involving infrarenal aorta, iliac, femoral, and other peripheral arteries. In this study only flow profiles were measured and no resistance was applied at the outflow apart from the resistance created by the inline ultrasonic flow meter. Future work to accurately simulate in vivo blood pressure is required. In a real‐time programmable pulsatile flow pump for in vitro cardiovascular experimentation, Mechoor et al19 reported that a feedback algorithm could reduce normalized RMS error by 5.5% in six iteration. A similar algorithm is being considered for the reciprocating roller pump where it might improve the accuracy of the desired flow rates at each time point. Tubing material used in the roller pump was found to have different performance and durability, as investigated by Peek et al,20 therefore, it might be beneficial to conduct future studies to compare performance and durability of various biocompatible tubing and to identify an optimum tubing for the reciprocating roller pump. Another issue that may be of interest is to study the flow patterns after the pump. A noninvasive occluding roller may be added at either the inlet or the outlet of the roller pump to act as a pressure regulating or one‐way check valve. In particular when looking at the valve at the inlet, this may be interesting to investigate swirling flow in the aortic arch. One of the limitations of the current study is that two ultrasonic flow meters were used. The high precision, fast response Bronkhorst ES1311 was used to guide set‐up as well as measure flow profile with a flow rate of less than 1.5 L/min and to validate the indirect motion analysis method. The slower response Cynergy3 UF8B with a maximum sampling rate of 10 Hz was used to guide the flow set‐up with flow rates up to 10 L/min. A fast response ultrasonic flow meter with sampling rate higher than 25 Hz, accuracy better than ±1% and maximum flow rate >5 L/min or a Coriolis flow meter such as Bronkhorst M55 can be useful to validate the suprarenal and infrarenal flow profiles. The roller pump is a proven technology which has been widely used in cardiopulmonary bypass (CPB) and extracorporeal membrane oxygenation (ECMO) procedures.21, 22 Its main advantage is the fact that there is no contact between the pump driving components and the liquid. In addition, the pumping chamber, that is, the tubing, is disposable,23 which ensures the sterility and avoids cross‐contamination.24, 25 The reciprocating roller pump can be programmed to ensure nontotal occlusion of tubing; therefore, it has the potential to reduce the damage to blood cells in these procedures.
5. CONCLUSIONS
The reciprocating roller pump was capable of generating waveforms conforming to human physiology and closely matched the reference profiles therefore, it is deemed suitable for use in experimental studies of vascular blood flow. It might also have the potential to be used in CPB and ECMO procedures due to its simplicity in design and low cost of disposable tubing.
CONFLICT OF INTEREST
The authors declare that they have no conflicts of interest with the contents of this article.
AUTHOR CONTRIBUTIONS
Conception and design: Chong
Analysis and interpretations: Chong, Groot Jebbink
Data collection: Chong, Groot Jebbink, van de Velde
Writing the article: Chong, Groot Jebbink
Critical revision of the article: Chong, Sun, Jansen, Groot Jebbink, van de Velde, Versluis, Reijnen
Statistical analysis: Chong
Overall responsibility: Chong
ACKNOWLEDGMENT
The authors thank Curtin University and Triphasic Cardiac Pump Pvt Ltd for funding the field trip and Henny Kuipers at University of Twente for his assistance in experimental set‐up.
Chong A, Sun Z, van de Velde L, et al. A novel roller pump for physiological flow. Artif Organs. 2020;44:818–826. 10.1111/aor.13670
REFERENCES
- 1. Groot Jebbink E, Mathai V, Boersen JT, Sun, CH , Slump PCJM, Goverde M, et al. Hemodynamic comparison of stent configurations used for aortoiliac occlusive disease. J Vasc Surg. 2017;66:251–60. [DOI] [PubMed] [Google Scholar]
- 2. Boersen JT, Groot Jebbink E, Versluis M, Slump CH, Ku DN, de Vries J‐PPM, et al. Flow and wall shear stress characterization after endovascular aneurysm repair and endovascular aneurysm sealing in an infrarenal aneurysm model. J Vasc Surg. 2017;66:1844–53. [DOI] [PubMed] [Google Scholar]
- 3. Ford MD, Nikolov HN, Milner JS, Lownie SP, DeMont EM, Kalata W, et al. PIV‐measured versus CFD‐predicted flow dynamics in anatomically realistic cerebral aneurysm models. J Biomech Eng. 2008;130:021015. [DOI] [PubMed] [Google Scholar]
- 4. Soudah E, Rudenick P, Bordone M, Bijnens D, García‐Dorado A, Evangelista EO. Validation of numerical flow simulations against in vitro phantom measurements in different type B aortic dissection scenarios. Comput Methods Biomech Biomed Eng. 2013;18:1–11. [DOI] [PubMed] [Google Scholar]
- 5. Hariharan P, Giarra M, Reddy V, Day SW, Manning KB, Deutsch S, et al. Multilaboratory particle image velocimetry analysis of the FDA benchmark nozzle model to support validation of computational fluid dynamics simulations . J Biomech Eng‐Trans ASME. 2011;133:041002. [DOI] [PubMed] [Google Scholar]
- 6. Law YF, Cobbold RSC, Johnston KW, Bascom PAJ. Computer‐controlled pulsatile pump system for physiological flow simulation. Med Biol Eng Comput . 1987;25:590–5. [DOI] [PubMed] [Google Scholar]
- 7. Holdsworth D, Rickey D, Drangova M, Miller D, Fenster A. Computer‐controlled positive displacement pump for physiological flow simulation. Med Biol Eng Comput . 1991;29:565–70. [DOI] [PubMed] [Google Scholar]
- 8. Hoskins PR. Simulation and validation of arterial ultrasound imaging and blood flow. Ultrasound Med Biol. 2008;34:693–717. [DOI] [PubMed] [Google Scholar]
- 9. Rudenick PA, Bijnens BH, García‐Dorado D, Evangelista A. An in vitro phantom study on the influence of tear size and configuration on the hemodynamics of the lumina in chronic type B aortic dissections. J Vasc Surg. 2013;57:464–74.e465. [DOI] [PubMed] [Google Scholar]
- 10. Poots K, Cobbold R, Johnston K, Appugliese R, Kassam M, Zuech P, et al. A new pulsatile flow visualization method using a photochromic dye with application to Doppler ultrasound. Ann Biomed Eng. 1986;14:203–18. [DOI] [PubMed] [Google Scholar]
- 11. Douville Y, Johnston KW, Kassam M, Zuech P, Cobbold RSC, Jares A. An in vitro model and its application for the study of carotid doppler spectral broadening. Ultrasound Med Biol. 1983;9:347–56. [DOI] [PubMed] [Google Scholar]
- 12. Shkolnikov V, Ramunas J, Santiago JG. A self‐priming, roller‐free, miniature, peristaltic pump operable with a single, reciprocating actuator. Sens Actuators A: Phys. 2010;160:141–6. [DOI] [PMC free article] [PubMed] [Google Scholar]
- 13. Neto AGSB, Lima AMN, Neff H, Gomes CL, Moreira C. Linear peristaltic pump driven by three magnetic actuators: Simulation and experimental results. In: 2011 IEEE International Instrumentation and Measurement Technology Conference; 2011; Binjiang, China. IEEE; p.1–6. [Google Scholar]
- 14. Sousa LC, Castro CF, António CC, Santos AMF, dos Santos RM, Castro PMAC, et al. Toward hemodynamic diagnosis of carotid artery stenosis based on ultrasound image data and computational modeling. Med Biol Eng Comput . 2014;52:971–983. [DOI] [PubMed] [Google Scholar]
- 15. Lee D, Chen JY. Pulsatile flow fields in a model of abdominal aorta with its peripheral branches. Biomed Eng: Appl Basis Commun . 2003;15:170–8. [Google Scholar]
- 16. Fraser KH, Meagher S, Blake JR, Easson WJ, Hoskins PR. Characterization of an abdominal aortic velocity waveform in patients with abdominal aortic aneurysm. Ultrasound Med Biol. 2008;34(1):73–80. [DOI] [PubMed] [Google Scholar]
- 17. Boersen JT, Donselaar EJ, Groot Jebbink E, Starreveld R, Overeem SP, Slump CH, et al. Benchtop quantification of gutter formation and compression of chimney stent grafts in relation to renal flow in chimney endovascular aneurysm repair and endovascular aneurysm sealing configurations. J Vasc Surg. 2016;66:1565–73. [DOI] [PubMed] [Google Scholar]
- 18. Boersen JT, Groot Jebbink E, Van de Velde L, Versluis M, Lajoinie G, Slump CH, et al. The influence of positioning of the nellix endovascular aneurysm sealing system on suprarenal and renal flow: an in vitro study. J Endovasc Ther. 2017;5:677–687. [DOI] [PubMed] [Google Scholar]
- 19. Mechoor RR, Schmidt T, Kung E. A real‐time programmable pulsatile flow pump for in vitro cardiovascular experimentation. J Biomech Eng. 2016;138:111002. [DOI] [PubMed] [Google Scholar]
- 20. Peek GJ, Wong K, Morrison C, Killer HM, Firmin RK. Tubing failure during prolonged roller pump use: a laboratory study. Perfusion. 1999;14:443–52. [DOI] [PubMed] [Google Scholar]
- 21. Passaroni AC, Silva MA, Yoshida WB. Cacardiopulmonary bypassy bypass: development of John Gibbon's heart‐lung machine. Rev Bras Cir Cardiovasc. 2015;30(2):235–45. [DOI] [PMC free article] [PubMed] [Google Scholar]
- 22. Sievert AN, Shackelford AG, McCall MM. Trends and emerging technologies in extracorporeal life support: results of the 2006 ECLS survey. J Extra‐Corporeal Technol. 2009;41(2):73–8. [PMC free article] [PubMed] [Google Scholar]
- 23. Graf NJ, Bowser MT. A soft‐polymer piezoelectric bimorph cantilever‐actuated peristaltic micropump. Lab Chip. 2008;8:1664–70. [DOI] [PMC free article] [PubMed] [Google Scholar]
- 24. Laser DJ, Santiago JG. A review of micropumps. J Micromech Microeng. 2004;R35–64. [Google Scholar]
- 25. Iverson B, Garimella S. Recent advances in microscale pumping technologies: a review and evaluation. Microfluid Nanofluid. 2008;5:145–74. [Google Scholar]