

SUMMARY
Brachypodium distachyon is an annual C3 grass used as a monocot model system in functional genomics research. Insertional mutagenesis is a powerful tool for both forward and reverse genetics studies. In this study, we explored the possibility of using the tobacco retrotransposon Tnt1 to create a transposon‐based insertion mutant population in B. distachyon. We developed transgenic B. distachyon plants expressing Tnt1 (R0) and in the subsequent regenerants (R1) we observed that Tnt1 actively transposed during somatic embryogenesis, generating an average of 6.37 insertions per line in a population of 19 independent R1 regenerant plants analyzed. In seed‐derived progeny of R1 plants, Tnt1 segregated in a Mendelian ratio of 3:1 and no new Tnt1 transposition was observed. A total of 126 flanking sequence tags (FSTs) were recovered from the analyzed R0 and R1 lines. Analysis of the FSTs showed a uniform pattern of insertion in all the chromosomes (1–5) without any preference for a particular chromosome region. Considering the average length of a gene transcript to be 3.37 kb, we estimated that 29 613 lines are required to achieve a 90% possibility of tagging a given gene in the B. distachyon genome using the Tnt1‐based mutagenesis approach. Our results show the possibility of using Tnt1 to achieve near‐saturation mutagenesis in B. distachyon, which will aid in functional genomics studies of other C3 grasses.
Keywords: insertional mutagenesis, Tnt1, Brachypodium, retrotransposons, sequence capture, flanking sequence tag, technical advance
Significance Statement
Retrotransposable elements transpose from one position in the DNA to another during embryogenesis, causing mutations at the genomic landing site. Here we show that Tnt1, a retrotransposable element from tobacco, can transpose in a monocot plant, Brachypodium distachyon. Based on the analyses of Tnt1 insertions in B. distachyon, we estimated that 29 613 lines would be needed to achieve a 90% probability of tagging every gene in the B. distachyon genome.
INTRODUCTION
Brachypodium distachyon (L.) P. Beauv. is an annual grass that has been proposed as a model system in monocots due to its small genome (about 270–280 Mbp), short life cycle, simple growth requirements, small size and amenability to transformation (Draper et al., 2001; Uren et al., 2009). The recent B. distachyon genome sequencing project has allowed whole‐genome comparisons between members of the three most economically important grass subfamilies and B. distachyon, enabling reconstruction of chromosome evolution across a broad diversity of grasses (International Brachypodium Initiative, 2010). In recent years, considerable progress has been made in increasing the genomic and genetic resources available for grass research. Brachypodium distachyon has been considered as a model for the study of C3 grasses. Several resources such as the whole genome sequence (International Brachypodium Initiative, 2010), T‐DNA insertion mutants (Vain et al., 2008; Thole et al., 2012), inbred lines (Vogel et al., 2009) and mapping populations have been developed for B. distachyon.
Generating a mutant collection is an important step in studying gene function in any plant species. Different methods of insertional mutagenesis have been developed in many plant species and the use of transposable elements (TEs) has been considered to be efficient. Transposable elements are grouped in two classes depending on the intermediates used for transposition. Thus, DNA transposons (class 2) such as maize Ac/Ds elements have been popularly used in plant species such as tomato (Carter et al., 2013), Arabidopsis (Long et al., 1993) and, more recently, in B. distachyon (Wu et al., 2019). The maize Disassociation (Ds) transposon tagging system was used to screen 241 B. distachyon T0 lines that resulted in the identification of 710 independent Ds flanking sequences (Wu et al., 2019). On the other hand, class 1 elements that use a RNA intermediate are divided into non‐long terminal repeat (LTR) retrotransposons and LTR retrotransposons. A genome‐wide mutagenesis approach using LTR retrotransposons has been used in Lotus japonicus (Urbanski et al., 2012), Medicago truncatula (Tadege et al., 2008) and rice (Miyao et al., 2003). In addition, LTR transposon‐based gene tagging has had demonstrated success in lettuce (Mazier et al., 2007b), soybean (Cui et al., 2013) and potato (Duangpan et al., 2013).
Insertion mutagenesis based on T‐DNA is also popularly used in plants such as Arabidopsis (Alonso et al., 2003), rice (Jeon et al., 2000) and, more recently, B. distachyon (An et al., 2016; Hsia et al., 2017). A total of 21 165 B. distachyon T‐DNA lines were sequenced as part of the Joint Genome Institute sequencing efforts, bringing the total of unique insertion sites to 26 112 (Hsia et al., 2017). However, the T‐DNA‐based mutagenesis approach requires the creation of a large insertion population for saturation or near‐saturation mutagenesis since T‐DNA produces an average of about 1.5 insertions per plant. In contrast, retrotransposon mutagenesis allows multiple insertions per plant. For example, it has been reported that there is an average of 80 insertions per line in M. truncatula (Tadege et al., 2008; Sun et al., 2019), from 4 to 19 insertions per line in soybean (Cui et al., 2013) and 24 insertions per line in potato (Duangpan et al., 2013). The high efficiency of transposition of class 1 elements is due in part to its ‘copy and paste’ mechanism (Kumar and Bennetzen, 1999), while class 2 elements have a ‘cut and paste’ mechanism (Wessler, 2006).
The Tnt1 element (Grandbastien et al., 1989), a LTR retrotransposon isolated from Nicotiana tabacum, has been used to generate a mutant population in various plant species. Tnt1 actively transposes during somatic embryogenesis in plant species such as M. truncatula, soybean, lettuce and potato, and is stable during sexual reproduction where no additional insertions were observed in new progeny derived from seeds (Mazier et al., 2007a; Tadege et al., 2008; Cui et al., 2013; Duangpan et al., 2013). A T‐DNA tagging collection of B. distachyon with a limited number of lines (about 23 000) has been generated (Thole et al., 2012). Similarly, in a different study, about 7000 T‐DNA lines of B. distachyon were generated to study their effective role as a non‐host to wheat stripe rust pathogen (An et al., 2016). However, the number of lines required to achieve saturation or near‐saturation mutagenesis using T‐DNA is considerably higher than using Tnt1. Therefore, Tnt1‐based insertion mutagenesis is more attractive for achieving saturation or near‐saturation mutagenesis in B. distachyon and will complement the existing T‐DNA insertion mutant collection.
In this paper we report that Tnt1 can successfully transpose in B. distachyon during somatic embryogenesis. Tnt1 transposition occurred in the first regenerant (mother plants) and increased its copy number in subsequent regenerants derived by somatic embryogenesis. Recovery of Tnt1 flanking sequence tags (FSTs) revealed insertion in several protein‐coding genes. We propose that Tnt1 can be used as an efficient tool for genome‐wide mutagenesis of B. distachyon, which will be useful for grass genomics research in general.
RESULTS
Generation of Tnt1 insertion lines in B. distachyon
The complete Tnt1 element from tobacco was cloned into the pCambia1381xc vector (Iantcheva et al., 2009) that carries the Hygromycin phosphotransferase (hptII) selectable marker gene in the T‐DNA region (Figure S3 in the online Supporting Information). Brachypodium distachyon (Bd21‐3) calli were developed from whole caryopsis instead of isolated embryos after removing the palea and lemma of the individual florets. These calli were transformed with disarmed Agrobacterium tumefaciens containing the binary vector pCambia1381xc with the Tnt1 element (Vogel and Hill, 2008). Several transgenic plants (R0) of B. distachyon containing the Tnt1 element were obtained.
We used two different R0 mother plants (MP2 and MP15) for further generation of individual lines. Several plants were regenerated (R1) from the mother plants through somatic embryogenesis (Gill et al., 2018). Briefly, embryos of mother plants were collected and the progeny plants were regenerated. To avoid redundancy of the insertions in the same site, only one plant per callus was chosen for regeneration. The exact timing of the transposition is unknown, but it could occur during the first few days of callus initiation and/or during embryogenesis. In total, we regenerated 25 lines of B. distachyon, eight lines from MP2 and 17 lines from MP15 (Table 1).
Table 1.
Tnt1 insertion numbers in Brachypodium distachyon using different methods

genic association: Tnt1 insertions that are associated with B. distachyon genes.; nr, non‐redundant.
1The insertions identified from TAIL‐PCR and sequence capture are marked in green‐colored brackets; insertions common to TAIL‐PCR and WGS are marked in blue‐colored brackets and those in common between sequence capture and WGS are marked in red‐colored brackets.
The presence of the Tnt1 element in the transgenic R0 lines and the subsequent regenerants (R1) was confirmed by PCR by amplifying a 701 bp coding region of Tnt1. In addition, an internal region (414 bp) of the plant selection marker (hptII) was amplified to confirm the presence of the transgene construct in R0 (Figure S4). Several lines showed a positive amplification for both primer sets, and some of these were further analyzed (Figure S4).
Tnt1 transposes actively in B. distachyon
In order to verify the active transposition of Tnt1 in B. distachyon R1 lines, we used three different methods to identify the transposition events: thermal asymmetric interlaced‐PCR (TAIL‐PCR), whole‐genome sequencing (WGS) and sequence capture (Sun et al., 2019). We used TAIL‐PCR to amplify the PCR products using Tnt1 LTR specific primers and arbitrary degenerate primers as described previously (Singer and Burke, 2003; Cheng et al., 2011; Cheng et al., 2014; Cheng et al., 2017). Following the PCR amplification, PCR products were cloned and sequenced using Sanger sequencing to recover the Tnt1 FSTs. Based on the sequencing quality, the minimum length considered was 500 bp. The maximum length of FST obtained was 1227 bp and the average length was 890 bp. The FSTs from 12 R1 lines were recovered from TAIL‐PCR (Table S1) and DNA from wild‐type B. distachyon and Tnt1 insertion lines of M. truncatula was used as controls (Tadege et al., 2008) for FST recovery and analyses. We identified 36 FSTs using TAIL‐PCR (Table 1). All the TAIL‐PCR products were Sanger sequenced and the product sequences were used for BLAST search against the B. distachyon genome sequence (Table S1). The average number of insertions per line based on TAIL‐PCR was identified to be 2.83 insertions in the R1 generation with a range between one and nine insertions (Table 1). The FSTs were further verified by PCR to confirm that the products were in fact from the corresponding B. distachyon lines (Table S1, Figure S5a). Some of the insertions were found in the coding regions of B. distachyon genes (Table S1). From our previous analyses of FSTs in M. truncatula Tnt1 insertion lines we know that TAIL‐PCR can recover <50% of total FSTs in any given line (Sun et al., 2019). Encouraged by the TAIL‐PCR results for B. distachyon, we sought to identify most of the insertions in all the R1 lines by taking advantage of two methodologies, sequence capture (Sun et al., 2019) and WGS (Veerappan et al., 2016).
For WGS, DNA samples were extracted from the whole leaves of B. distachyon R0 mother plants (MP2 and MP15) and R1 (nc15‐006, nc15‐007 and nc15‐008) plants using the Qiagen DNA extraction kit according to the manufacturer's instructions. In addition to the original T‐DNA that contains Tnt1, one additional Tnt1 insertion in MP2 and three additional Tnt1 insertions in MP15 were identified. This was not surprising, because Tnt1 within the T‐DNA can transpose during transformation and somatic embryogenesis resulting in additional Tnt1 insertions in R0 plants. This was also observed in M. truncatula Tnt1 insertion lines (d'Erfurth et al., 2003). Three insertions each in daughter regenerant plants of nc15‐006 and nc15‐008 were identified. Five Tnt1 insertions were identified in the nc15‐007 line (Table 1). In total, we were able to identify 11 non‐redundant Tnt1 transposition events in all three R1 lines combined using the WGS method, with an average insertion rate of 3.67 per line (Table S1). Overall, using WGS, 14 insertions were identified in all five lines tested (including two MP lines) (Table 1). Eight overlapping insertions were identified between WGS and TAIL‐PCR in the R1 lines (Table 1). The additional Tnt1 insertions identified in the MP lines using WGS were also recovered from R1 plants (nc15‐006, nc15‐007 and nc15‐008) (Table S1).
Since WGS is expensive and time‐consuming, we decided to use the sequence capture method (Sun et al., 2019) to isolate most FSTs in a given line. We identified a total of 76 Tnt1 transposition events in 16 R1 lines tested, with an average insertion of 4.75. Additionally, using Roche Nimblegen probes, two insertions were identified from MP15 and one from MP2 R0‐1 plants (Table S1). R0‐1 plants are plants grown from the seeds of R0 mother plants. Sixteen overlapping insertions were identified from nine lines between sequence capture and TAIL‐PCR. Additionally, six insertions identified by sequence capture were in common with WGS (Table 1). Original Tnt1 insertions identified in parents were recovered in the R1 lines of B. distachyon in one or a combination of methods used for the identification of Tnt1 insertions. The highest number of Tnt1 insertions was identified using the sequence capture method compared with WGS and TAIL‐PCR.
Identification and validation of Tnt1 insertions in B. distachyon
Among 19 B. distachyon R1 lines that had Tnt1 insertions, we identified a total of 121 non‐redundant Tnt1 insertions, with an average of 6.37 insertions per line. Out of 126 insertions identified in R0 and R1 lines, 34 were identified from 13 lines using TAIL‐PCR, 78 were identified from 17 lines using sequence capture and 14 were identified from five lines using WGS (Table 1). A list of all insertions in different lines along the progeny is presented in Table S1. As shown in Table 1, not all lines have the same number of Tnt1 insertional events. This is similar to what was observed in other plant species where Tnt1 was used as an insertional mutagen. R1 plants generated from the MP15 mother plant had an average of 6.92 insertions/line compared with an average of 5.17 insertions per line from the MP2 mother plant. This difference can be attributed to the number of additional Tnt1 insertions in the MP lines. The MP15 line has a total of four Tnt1 insertions while MP2 line has one Tnt1 insertion. Some R1 plants had no Tnt1 insertions, probably because the embryos of R0 plants are still segregating for original Tnt1 insertions (Table 1; Table S1) and we might have picked an embryo that had no Tnt1 insertions. Another possibility is that the sequence capture reaction may have failed in these lines.
To further validate the Tnt1 insertions, all the lines were chosen to test the presence of Tnt1 using flanking primers (Tnt1 LTR primers and B. distachyon gene‐specific primers as shown in Table S2) at the site of insertion (Figure S5a). A range between 300 and about 500 bp was expected and all the amplifications were in that range (Figure S5a). All the 34 FSTs identified by TAIL‐PCR were confirmed by PCR amplification followed by a second round of Sanger sequencing of the PCR product (Figure S5a). Tnt1 insertions from R0 and R1 lines obtained from WGS and the sequence capture method were also validated in a similar fashion. All 14 insertions identified from WGS were validated by PCR (Figure S5b). We were also able to confirm some of the insertions obtained through the sequence capture method. A total of 72 Tnt1 insertions were validated from 126 Tnt1 insertions identified (Table S2). An additional 34 sets of primers failed to amplify insertions so were not included in the final dataset. The PCR amplification may have failed in some cases due to lack of optimization conditions. In addition, PCR verification may sometimes not have worked because Tnt1 element copies can be lost in a non‐specific manner by deletion and/or recombination events generated by interaction between repetitive elements (Morot‐Gaudry et al., 2007). Thus, it is possible to have truncated elements (Bennetzen, 2005). Nevertheless, our PCR analysis confirmed most Tnt1 insertions identified by TAIL‐PCR, WGS and sequence capture.
Tnt1 insertions follow a Mendelian ratio for genetic inheritance in B. distachyon and they do not transpose in seed‐propagated progeny
To check if Tnt1 insertions segregate following Mendelian laws of inheritance, we selected two R1 lines, nc15‐007 and nc15‐010, to test the segregation ratio. The seeds of the two selfed R1 lines nc15‐007 and nc15‐010 were planted and tested for the segregation of one Tnt1 insertion identified in the R1 generation for each line. In nc15‐007 line, 22 progeny seeds were germinated and the resulting plants were tested for a Tnt1 insertion previously identified on chromosome 4. Out of 22 plants tested, 16 tested positive (73%) for Tnt1 insertion using a gene‐specific primer and Tnt1‐specific primer (Table S3). Similarly, out of 27 progeny tested from nc15‐010, 20 tested positive (74%) for a Tnt1 insertion previously identified and verified (Table S3). The segregation of Tnt1 insertions in the progeny of R1 lines nc15‐007 and nc15‐010 confirms the Mendelian segregation ratio of 3:1 based on a chi‐square test of independence for goodness of fit (Table S3).
In M. truncatula and Arabidopsis it has been shown that only Tnt1 transposes during somatic embryogenesis and not during seed propagation (Lucas et al., 1995; d'Erfurth et al., 2003). To verify if Tnt1 in B. distachyon behaves in the same way, we recovered FSTs by sequence capture (as described earlier) from the seed‐propagated R1 progeny of nc2‐001 and nc2‐005 lines. As expected, the FST analyses did not identify any new insertions in the progeny grown from the seeds of the above‐mentioned lines. We therefore conclude that Tnt1 transposition in B. distachyon is active during somatic embryogenesis (tissue culture) and not in seed‐derived progeny plants.
Tnt1 insertion has no target specificity in B. distachyon
It has been reported that some LTR transposons, such as Tos17 (Miyao et al., 2003), have target specificity so they prefer to integrate in determined sequences. To investigate if Tnt1 has any special affinity for a determined nucleobase composition (hotspot) in B. distachyon, we analyzed 126 non‐redundant FSTs (mapped reads) from all chromosomes, and studied a 100 bp region on each side of the Tnt1 insertion. Adenosine (A) + thymine (T) against guanine (G) + cytosine (C) across the 100 bp region on either side of Tnt1 insertion were analyzed (Figure 1). Interestingly, a pattern of low G + C regions in the flanking sequences (up to 100 bp) of Tnt1 insertions (Figure 1) was found. The lowest of G + C was at positions 20–40, where the preference for G + C (30%) was greater by 10% than the expected average in the genome. However, when all the nucleobases (A, G, C, T) at the insertion site were analyzed we did not see a strong pattern or affinity to any specific nucleotide or recognition site. We therefore concluded that the Tnt1 insertions in B. distachyon genome are random without any target specificity. These results correlate with the finding from the M. truncatula genome where no specific target‐site specificity of Tnt1 insertion was observed (Tadege et al., 2008; Sun et al., 2019).
Figure 1.

Nucleobase composition at the site of insertion of Tnt1.
The plot displays 100 base pairs flanking both sides of the Tnt1 insertion, labeled as [−100, (0), +100]. Bases are shown in colors: A + T in red and G + C in blue. A strong pattern of a low GC percentage along the insertion site is observed. One hundred base pairs on either side of the 5 bp target site duplication (TSD) and within the TSD itself showed G + C preference 100 bp immediately downstream of the TSD. The lowest of these was at positions 20–40, where the preference for G + C (30%) was greater by 10% than the expected average in the genome. The whole‐genome GC% is represented as a thin line.
Tnt1 insertions are distributed uniformly on the chromosomes
For genome‐wide mutagenesis it is important to address how the insertions are distributed in the genome. The insertions must be uniformly distributed along the chromosomes for complete genome coverage. The distribution of Tnt1 insertions in all B. distachyon lines analyzed was determined (Table S4). Analysis of 126 FSTs showed that 51 (40.48%) of the insertions were in genic regions, of which 20 (15.87%) were in exons, 34 in introns (26.98%) and 8 (6.34%) in untranslated regions (UTRs). Among the insertions that were genic, four insertions were at an exon–intron junction and seven insertions at exon–UTR junctions and were counted in both categories (Table S1). A total of 75 Tnt1 insertions (59.52%) were in intergenic regions (Table S1). As shown in Table 2, genic insertions account for 40.48% of the target preference in B. distachyon, while other non‐coding regions account for 59.52%. There was no higher tendency to target either exons or introns, suggesting that the Tnt1 retrotransposon can insert either in genic or intergenic regions in a similar proportion.
Table 2.
Distribution of Tnt1 insertions in Brachypodium distachyon
| Line no. | Exon (CDS) | 5′‐UTR | 3′‐UTR | Intron | Genic | Intergenic |
|---|---|---|---|---|---|---|
| MP15 | 2 | 2 | 2 | |||
| MP2 | 1 | |||||
| nc15‐001 | 7 | 1 | 2 | 5 | 12 | 22 |
| nc15‐002 | 2 | |||||
| nc15‐003 | 4 | 4 | 4 | |||
| nc15‐004 | 3 | 1 | 1 | 3 | 7 | |
| nc15‐006 | 1 | 2 | 3 | 3 | ||
| nc15‐007 | 1 | 4 | 4 | 4 | ||
| nc15‐008 | 1 | 4 | 4 | 2 | ||
| nc15‐009 | 1 | 1 | 1 | |||
| nc15‐010 | 1 | 1 | 1 | 1 | ||
| nc15‐011 | 1 | 1 | ||||
| nc15‐013 | 1 | 2 | 2 | 6 | ||
| nc15‐014 | 1 | 1 | 1 | |||
| nc15‐015 | 1 | |||||
| nc2‐001 | 1 | 2 | 3 | 1 | ||
| nc2‐002 | 2 | |||||
| nc2‐003 | 1 | 1 | ||||
| nc2‐004 | 2 | 1 | 4 | 6 | 9 | |
| nc2‐005 | 2 | 1 | 1 | 3 | 4 | |
| nc2‐006 | 2 | |||||
| Total | 20 | 3 | 5 | 34 | 51 | 75 |
CDS, coding sequence; UTR, untranslated region; genic region, exon + 5′‐UTR + 3′‐UTR + intron.
In addition, all the Tnt1 FSTs identified were mapped to the B. distachyon chromosomes. A uniform distribution of insertions was found across all five chromosomes (i.e. Chr 1–Chr 5): 30 in Chr 1, 30 in Chr 2, 23 in Chr 3, 25 in Chr 4, 12 in Chr 5 with 6 in Chr 0 (contigs not assigned to any chromosome) (Figure S6, Table S4). Although the number of insertions appears to be low in Chr 5, the relative size of Chr 5 is smaller and that could account for the smaller number of Tnt1 insertions relative to others. Overall, there was no specific preference for Tnt1 to be inserted in a particular region of a chromosome, even though there was a preference for low G + C regions around the insertion site (Figure 1). The distribution of Tnt1 insertions in B. distachyon chromosomes did not correlate with the overall GC content of the chromosomes (Figure S6b). Additionally, we mapped all the Tnt1 insertions to the chromosomes and also mapped genes and GC% of the chromosomes on to the physical chromosome location through the use of Circos genomic plots (Zhang et al., 2013) (Figure 2). In the circular genomic map presented, all the chromosomes were mapped on the outer track with centromeres pointed in the red color marked as ‘c’ and GC% of the chromosomes is plotted in the second track. Each of the chromosomes is divided into 500 kb block windows and GC% was calculated. The GC% of the genome is mapped against B. distachyon chromosomes. All the identified Tnt1 insertions were mapped in the third inner track (Figure 2). The FST lengths are plotted as histograms in the third track at their genomic location (Figure 2). All the B. distachyon genes were mapped in the fourth track with cyan colored histogram lines. Unlike in M. truncatula (Sun et al., 2019), a specific pattern could not be found from mapping of FSTs against chromosomes, or their GC% or AT%, asserting the assumption that Tnt1 transposition is a random event that can most likely target any region (Figure 2).
Figure 2.

Circular genomic visualization of Tnt1 insertions in Brachypodium distachyon genome.
The figure was generated using the Circos package in the R statistical platform. The first band of the circle (outer circle) represents chromosomes (Chr 1–5 and 0). Centromeric positions are marked on each of the chromosomes with a red letter ‘c’. The second band is plotted with GC% of the chromosomes in 500 kb window bins. The third band is plotted with flanking sequence tags (FSTs; total length of the FST at the site of insertion) plotted on to B. distachyon genome. The fourth, innermost, band represents the gene lengths of B. distachyon (total length of the gene at that particular location, thus showing a genic location).
Estimation of Tnt1 insertions needed for saturation or near‐saturation mutagenesis in B. distachyon
Because Tnt1 insertions in chromosomes are random, we established the probability of tagging any given gene with Tnt1 to estimate the Tnt1 insertions needed for saturation mutagenesis in B. distachyon (Figure 3). Using the formula described in Krysan et al. (1999) (see Experimental Procedures) and considering a B. distachyon genome size of 280 Mbp, we estimated the number of insertion lines required to mutate the whole B. distachyon genome as shown in Table 3 and Figure 3. We then calculated the correlation between the number of Tnt1 lines needed and the percentage chance of mutating a particular gene. For a 50–90% probability of finding a Tnt1 insertion in a B. distachyon gene, 8915–29 613 Tnt1 insertion lines, respectively, are required (Table 3). As we increase the probability to mutate a given gene to saturation (99%), more lines are required (59 227) with an estimated average gene size of 3.3 kb (Figure 3). Based on our estimates (Figure 3), the probability of gene tagging is higher than the average with an increased gene size, and a lower with a smaller gene size. The number of lines required to saturate the genome increases drastically with a higher probability of tagging a gene. Based on this equation, and the fact that we identified 121 inserts in 19 lines (121/19 = 6.37 inserts per line), we estimated that approximately 29 613 Tnt1 insertion lines would be sufficient for a 90% probability of tagging any given gene in B. distachyon (Table 3). This is relatively easy to develop in a mutagenesis program similar to other model species such as Medicago, where 21 700 lines are required to cover 85–90% of the genome (Cheng et al., 2014), or potato, where 42 000 lines to cover 95% of the genome (Duangpan et al., 2013).
Figure 3.
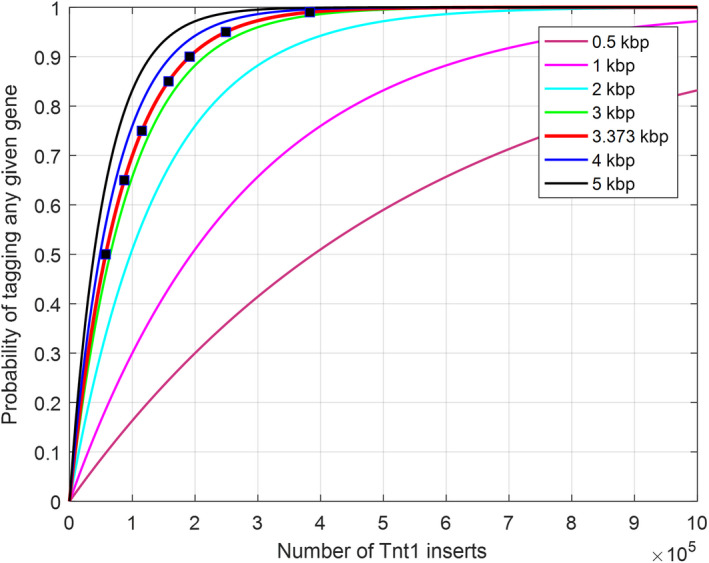
Genome coverage estimate for Tnt1 inserts.
The estimation assumes that 96.71% of the Brachypodium distachyon genome is sequenced. The probability of insertion into a transcription region within the sequenced gene space is 42.15%. The probability of tagging any given gene with Tnt1 is a function of gene size and is derived from the equation (where p is the probability of finding one Tnt1 insert within a given gene, x is the average length of a gene transcript, y is the total length of transcribed genes, R tr is the probability of insertion into a transcription region within the sequenced gene space R gs and N is the total number of Tnt1 inserts required). The most likely estimate, which assumes 3.373 kb as the average gene length, is shown in red. The blue points on the red curve show the corresponding numbers of Tnt1 inserts required to achieve 50%, 65%, 75%, 85%, 90%, 95% or 99% genome coverage, respectively.
Table 3.
Estimation of insertion lines required to mutate the Brachypodium distachyon genome
| Percentage chance of mutating a particular gene (%) | Tnt1 inserts required (N) a | Insertion lines required (IL) a |
|---|---|---|
| 50 | 56 771 | 8915 |
| 65 | 85 984 | 13 502 |
| 75 | 113 543 | 17 829 |
| 85 | 155 381 | 24 399 |
| 90 | 188 590 | 29 613 |
| 95 | 245 362 | 38 528 |
| 99 | 377 181 | 59 227 |
Given an average gene length of 3.37 kb, the percentage chance of mutating a particular gene would require (N) Tnt1 inserts with a 99.39% chance of insertion into a sequenced gene space and a 42.15% chance of insertion into the gene transcript region. The number of insertion lines (IL) required is based on an insertion rate of 6.37 insertions per line (IL = N/6.37).
DISCUSSION
Insertional mutagenesis is one of the most effective methods for creating a large‐scale mutant population for gene function analysis in different species. Insertional mutagenesis has the added advantage that it identifies the mutated genes by forward genetics following the mutant phenotypes, unlike mutants generated by chemicals (using ethyl methane sulfonate) and ionizing radiation (using fast neutrons, γ‐rays and X‐rays) (Tadege et al., 2005). Different approaches have been taken to generate mutants in B. distachyon (Vain et al., 2008; Dalmais et al., 2013), along with transposon tagging (Wu et al., 2019). Currently, there is only a limited availability of cloning friendly mutants in B. distachyon. A recent report on sequencing and validation of B. distachyon T‐DNA collection showed 26 112 publicly available T‐DNA lines (Hsia et al., 2017). Although there are over 25 000 T‐DNA lines, only 31% of the genes (about 8000) were reportedly tagged (Hsia et al., 2017). Additionally, a separate T‐DNA collection of 7000 B. distachyon lines was developed to identify mutants that compromise non‐host resistance against wheat stripe rust pathogen (An et al., 2016). Here we report that the tobacco retrotransposon Tnt1 can transpose in B. distachyon during somatic embryogenesis and can be used as a mutagen to achieve saturation or near‐saturation mutagenesis. Based on the FST analyses of 23 Tnt1 insertion lines in R0 and R1 generations, the target specificity, distribution and stability of Tnt1 insertions were evaluated. Plants with fewer FSTs (less than the average) were chosen as mother plants for regeneration since it would be easy to follow the transposition event. The average number of insertions for all lines in the R1 generation was 6.37 (Table 1). The Tnt1 transposition rate of 6.37 with a genic insertion rate of 2.57 in the B. distachyon genome is comparatively smaller than for M. truncatula (Tadege et al., 2008; Sun et al., 2019). However, if needed, we can use a B. distachyon line with multiple inserts as a mother plant and therefore significantly increase the Tnt1 insertions in subsequent regenerants. This will reduce the number of lines needed to achieve saturation mutagenesis but will make analyses of individual mutants more complicated due to multiple gene mutations.
The average number of insertions in each generation (R0 and R1) differed. However, in line with what was expected, in most cases the average number of insertions increased from R0 to R1 generations. The number of insertions we observed in the R1 generation could be an underestimation. As reviewed by Morot‐Gaudry et al. (2007), it is possible that copies of the transposon could be lost due to deletion and/or recombination events that take place due to the presence of repetitive elements. In fact, it is known that plants have different mechanisms that can increase or reduce their genome sizes through evolution, and the integration of transposable elements is associated with this mechanism (Bennetzen, 2002). Some advances have been made to elucidate the integration and/or deletion of retrotransposons, and some mechanisms are still unknown. It has been reported that the expression of retrotransposons can be located in specific tissues and that this expression can be mediated by element‐specific regulatory sequences where host transcriptional factors play a role (Grandbastien, 1998). Moreover, the LTR regions can have specific elements that influence the host sequence. In general, the transcriptional regulation depends on sequence features in the LTR and epigenetic factors (Grandbastien, 2014). The expression of Tnt1 involves several U3 cis‐acting elements similar to other motifs, such as the E/G box, W box and H box involved in activation of defense responses (Anca et al., 2014). On the other hand, LTR retrotransposons are frequently concentrated in hyper‐methylated regions such as the intergenic heterochromatic clusters and there is evidence of epigenetic mechanisms of targeting transposable elements (Rigal and Mathieu, 2011). Thus, when the Tto1 (Hirochika et al., 2000) and Tnt1 (Lucas et al., 1995) were introduced in Arabidopsis they were active, but methylated and silenced as their copy number increased. With this complexity, the transposition, integration and/or degradation and silencing of transposable elements can be associated with either biotic or abiotic factors that affect the outcome of the events in plant species. In addition, solo, rearranged and truncated LTRs (Bennetzen, 2002; Attard et al., 2005; Oyama et al., 2010) can be identified by the WGS and sequence capture as we use the whole Tnt1 sequence to analyze insertions against just the LTR regions. In contrast, FST recovery by TAIL‐PCR uses specific primers at the very end of the LTRs, making it feasible and effective for identifying the LTR–plant junction despite truncation. This could be one reason why we didn’t always see an overlap in the FSTs identified in a given line by different methods. All the methods complemented each other to identify unique FSTs. It is important to clarify that even though a transposon is truncated; the insertion causes a mutation and can be identified by forward or reverse genetics studies. Homologous recombination between LTRs of a single retrotransposon can result in recombinant or solo LTRs (Vicient and Casacuberta, 2017). Truncated elements and solo LTRs are often present in different plant species (Bennetzen, 2002; Attard et al., 2005; Oyama et al., 2010). A recombination between LTRs of two transposable elements can change the genomic landscape via chromosomal rearrangements, through translocations, duplications and inversions (Vicient and Casacuberta, 2017). This recombination rate between LTRs was found to be highly variable among plant genomes including rice, grasses and other gymnosperms (Bennetzen and Wang, 2014). Unlike in M. truncatula, more optimization is needed for sequence capture and WGS methods/analyses in B. distachyon to identify most of the FSTs. The goal of this study was to show that Tnt1 is transposing in B. distachyon and not necessarily to identify all the FSTs.
Plant retrotransposons, including Tnt1, are known to be activated during severe stress conditions such as somatic embryogenesis (Grandbastien, 1998; Melayah et al., 2001; d'Erfurth et al., 2003). In addition, both biotic and abiotic stress conditions induce the expression of retrotransposons (Mhiri et al., 1997; Melayah et al., 2001). In addition, plant stresses such as wounding, fungal elicitors, viral inoculation, hormone treatment, etc. have been shown to induce the expression of retrotransposons (Grandbastien, 2014). However, the expression of retrotransposons does not always correlate with transposition. The embryogenesis protocol in the case of B. distachyon uses calli derived from immature embryos as an explant. Calli are subject to hormone treatment and other chemicals that can generate stress. It is not known when exactly the transposition event occurs, but it is clear that it occurs during embryogenesis. In M. truncatula it has been shown that plant regeneration by embryogenesis but not organogenesis will induce transposition of Tnt1 (Tadege et al., 2005). Interestingly, in M. truncatula the osmotic treatment to explants (leaves) was able to improve transposition frequency (Iantcheva et al., 2009). More work is necessary to establish the effect of stress on Tnt1 transposition in B. distachyon.
It has been reported that transposons use different strategies for targeted integration (Bushman, 2003). For example, in yeast most retrotransposons show target specificity (Sandmeyer, 2003), such as Ty3 that targets specific nucleotides upstream of RNA polymerase III (Pol III) transcription initiation sites. In plants, Tos17 of rice revealed a palindromic consensus sequence, ANGTT–TSD–AACNT, flanking the 5‐bp target site duplication (TSD) (Miyao et al., 2003). In contrast, the Tnt1 element in M. truncatula (Tadege et al., 2008) or tobacco (Hernandez‐Pinzon et al., 2012) is reported not to have target specificity. Brachypodium distachyon Tnt1 transposition and insertion was similar to M. truncatula (Figure 2) and appears to be a random event. A low G + C base composition was observed at the flanking sites of insertions with sequences up to 100 bp (Figure 1). Further, unlike in M. truncatula (Sun et al., 2019), negative correlation with GC% was not observed in B. distachyon. Our observations of random insertional events might be later strengthened with further characterization of additional Tnt1 mutants.
The Tnt1 element is reported to target gene‐rich regions (Mazier et al., 2007b; Tadege et al., 2008; Cui et al., 2013) and preferentially exons (Tadege et al., 2008; Duangpan et al., 2013). As shown in Table 2, approximately 40% of Tnt1 insertions associated with genes in B. distachyon from among the total of 126 Tnt1 insertions; the rest of the Tnt1 insertions (about 60%) were identified in intergenic regions. Extensive gene content variation studies in the B. distachyon pangenome identified the gene‐rich region in B. distachyon to be about 45% (Gordon et al., 2017). Therefore, Tnt1 insertion in B. distachyon appears to be random without any preference for coding or non‐coding regions. These results are in contrast to M. truncatula, where Tnt1 insertion is shown to have a slight preference for gene coding regions (Tadege et al., 2008; Sun et al., 2019). Similar to Tnt1 insertions in B. distachyon, using T‐DNA mutagenesis in B. distachyon 37% of the insertion sites were identified within the genes (Hsia et al., 2017). Insertion preference varies for every species. For example, in maize, Mutator inserts preferentially in promoters (Kloeckener‐Gruissem et al., 1992) and Ac inserts preferentially at sites linked to the location of the starting element (Dooner and Belachew, 1989). Since a small number of FSTs were analyzed in B. distachyon this may not be a true representation of the Tnt1 insertion preference. More FSTs should be analyzed in the future to exactly determine the Tnt1 insertion preference in B. distachyon.
The distribution of the 126 Tnt1 insertions along the B. distachyon chromosomes did not show preference for a particular region on the chromosome and the insertions were distributed uniformly (Figure 2). These results are in accordance with Tnt1 insertion in others species such as M. truncatula (Tadege et al., 2008), soybean (Cui et al., 2013) and potato (Duangpan et al., 2013). The chromosomal location of transposons has been a subject of study for a long time. Distribution of retroelements in the plant genome can vary according to the plant species and the type of transposable element. For example, the Ty1‐copia retrotransposon is dispersed throughout the euchromatin in many plant species (Brandes et al., 1997; Heslop‐Harrison et al., 1997). In contrast, this LTR retrotransposon has also been reported to be enriched in terminal heterochromatic regions of Allium cepa (Pearce et al., 1996) and in paracentromeric heterochromatic regions of Arabidopsis and Cicer arietinum (Pearce et al., 1996; Heslop‐Harrison et al., 1997). Even though LTR retrotransposons can be enriched in some regions of a chromosome, they are generally present in all chromosomes. In this study, we show that the Tnt1 retrotransposon is evenly distributed along the five chromosomes of B. distachyon, making Tnt1 an efficient insertion element to achieve genome‐wide mutagenesis.
Another advantage of using the Tnt1 retrotransposon for mutagenesis is its ability to insert in multiple locations. This facilitates saturation or near‐saturation mutagenesis with a relatively smaller collection of insertion lines than that required for other mutagenesis approaches. For example, to achieve 90% saturation level in mutagenesis of the M. truncatula genome (Tadege et al., 2008), about 21 700 regenerated lines were required using Tnt1 (Cheng et al., 2014) compared with over 450 000 transformation events required in T‐DNA tagging, assuming 1.5 insertions per line (Alonso et al., 2003). We calculated that to have 90% probability of finding a Tnt1 insertion in a B. distachyon gene, 29 613 Tnt1 insertion lines are required (Table 3). A limited number of T‐DNA mutants (about 26 000) are now available for B. distachyon (Hsia et al., 2017). It is predicted that over 100 000 lines are required to tag most of the genes (Thole et al., 2010). Based on the formula of Krysan et al. (1999) we believe that about 250 000 T‐DNA tagged lines will be required to achieve a 99% probability of tagging a gene in B. distachyon. This will be a daunting task because B. distachyon transformation is time‐consuming. In contrast, a 99% probability of tagging a gene would require only about 59 227 lines using the Tnt1 retrotransposon (Table 3). In addition, T‐DNA tagging is known to cause many unlinked mutations in Arabidopsis (Budziszewski et al., 2001; McElver et al., 2001) probably due to Agrobacterium‐mediated transformation, which can be a mutagenic process on its own (Marton et al., 1994). In summary, Tnt1‐based insertion mutagenesis has the potential to achieve near‐saturation mutagenesis of B. distachyon and such a resource would complement the existing T‐DNA‐tagged B. distachyon mutants. These resources will enhance functional genomics research in B. distachyon and C3 grasses in general.
EXPERIMENTAL PROCEDURE
Plant material and growth conditions
We used seeds if the B. distachyon diploid inbred line Bd21‐3 (Vogel and Hill, 2008) as the starting material. Calli were developed from immature embryos under the following conditions: 16‐h light:8‐h dark photoperiod and a constant temperature of 28°C. Regenerated plantlets had the same photoperiod but a constant temperature of 24°C was used. Wild‐type and transgenic plants at the greenhouse were grown at 24/22°C day/night and supplemented with 140 μE of photosynthetically active radiation for 16 h/day when required.
Plant transformation and development
We used A. tumefaciens strain EHA105 containing a pCambia1381xc vector with the complete Tnt1 element (d'Erfurth et al., 2003) to transform calli as described in Vogel and Hill (2008). Palea and lemma were manually removed from florets and whole caryopses were sterilized in 50% ethanol for 1 min, 10% bleach for 10 min and sterile water (4×) for 1 min. Callus induction medium (CIM) was used for callus regeneration. After 4 weeks, calli were transformed and subcultured in CIM every 2 weeks for six consecutive weeks. Calli then were transferred to regeneration medium for 2 weeks and growing plantlets were transferred to Murashige and Skoog growing medium (Vogel and Hill, 2008). Hygromycin selection (50 mg ml−1) was present in the medium during development of calli after transformation. Well‐developed plants were transplanted to half‐gallon pots containing Metro‐Mix 830 substrate. Young green caryopses produced by plants were used for callus development. This tissue culture‐based approach to generate Tnt1 insertional mutant population was described recently (Gill et al., 2018).
Recovery of FSTs
We recovered FSTs adjacent to Tnt1 insertion sites using TAIL‐PCR as previously described (Cheng et al., 2011; Liu and Chu, 2015; Cheng et al., 2017). Two rounds of TAIL‐PCR using previously described Tnt1 LTR primers and arbitrary degenerate primers were used to amplify specific amplicons (Cheng et al., 2017). All resulting PCR products were individually cloned for each Tnt1 line, purified with the PCR purification kit (Qiagen, https://www.qiagen.com/), and ligated into the pGEMT‐Easy cloning vector for sequencing. Sequenced products were further analyzed for sequence matches to the B. distachyon genome.
The FST sequence analysis
To accurately identify Tnt1 insertion sites in the B. distachyon genome, all FST sequences with a length shorter than 50 bp or without the Tnt1 signature sequence (‘CCCAACA’, ‘CATCATCA’ or ‘TGATGATGTCC’) or the Tnt1 signature sequence not within 28 bp of the beginning or at the end of FST sequences were discarded. The pre‐processed reliable FST sequences were aligned to the B. distachyon Bd21‐3 reference genome using BLASTn with an E‐value threshold ≤1.00 × 10⁻⁵. The FST sequences with the best hit from BLAST analyses were further processed to filter incorrect alignments if the similarity score was less than 90% (Altschul et al., 1997; Johnson et al., 2008).
Whole‐genome sequencing to identify Tnt1 insertions
We performed WGS of Tnt1 insertion lines using leaves from two mother plants (R0 generation) and four regenerant daughter plants (R1 generation). High‐molecular‐weight genomic DNA was isolated using the Qiagen DNeasy Plant Mini Kit (Qiagen). Genomic DNA was fragmented by Covaris (https://covaris.com/) for fragment sizes of 150 bp and Illumina DNA libraries were prepared according to the standard Illumina protocol. Paired‐end sequencing of all the genomic libraries was performed on an Illumina HiSeq 2000 system with 150 bp paired ends. Recently, WGS methodology was applied in M. truncatula to identify Tnt1 insertions (Veerappan et al., 2016). All Illumina sequences were trimmed by Trimmomatic (Bolger et al., 2014; LEADING:3 TRAILING:3 SLIDINGWINDOW:4:20 MINLEN:30). Tnt1 insertions were identified by itis (Jiang et al., 2015) and RelocaTE (Robb et al., 2013).
Sequence capture to identify Tnt1 insertions
In this method, following DNA extraction, DNA was fragmented and Illumina genomic libraries were prepared per the manufacturer's recommendations. For Tnt1‐capture sequencing, a total of four 5′‐biotinylated xGen Lockdown Probes [Integrated DNA Technologies, Inc. (IDT), https://idtdna.com/] of 120 bp were synthesized using the end sequence of the Tnt1‐LTR region (Sun et al., 2019). Bar‐coded Illumina libraries were prepared individually for 27 B. distachyon Tnt1 insertion lines. Illumina genomic DNA libraries were pooled before hybridization‐based capture of Tnt1‐specific fragments. For hybridization capture, protocol instructions and reagents provided by IDT were used with modifications for a blocking agent (Sun et al., 2019; Figure S1). We used 10 µl of SeqCap EZ Developer Reagent (Roche Sequencing, https://sequencing.roche.com/) instead of 5 µg of human Cot‐1 DNA as a blocking reagent. We used a similar capture method with probes designed from Roche‐Nimblegen for Tnt1 to sequence two mother plants (R0 generation); MP2 and MP15. After hybridization capture, Tnt1 fragment‐enriched‐libraries were evaluated for enrichment efficiency by quantitative PCR prior to sequencing (Figure S2). The pre‐hybridized pool and post‐hybridization capture pool DNA were tested with the LTR primers. Captured DNA fragments were sequenced using Illumina NextSeq (Figure S1). All Illumina sequences were trimmed by Trimmomatic (Bolger et al., 2014; LEADING:3 TRAILING:3 SLIDINGWINDOW:4:20 MINLEN:30). Tnt1 insertions were identified by itis (Jiang et al., 2015) and RelocaTE (Robb et al., 2013). All the raw data are deposited at NCBI under the accession/bioproject ‘PRJNA565798’ with biosample accessions (SAMN12769012–SAMN12769077).
Analysis of Tnt1 flanking regions
We used Trimmomatic software (Bolger et al., 2014) to clean adapters and Tnt1 contaminant sequences and to set the minimum read length (25 nucleotides). After cleaning, results were mapped to the B. distachyon genome using NCBI BLASTn with an E‐value cutoff of ≤1 × 10⁻⁶ and length of identical region ≥25 bp. Finally, reference to coordinates of these locations was made using the B. distachyon annotation (BdistachyonBd21_3_378_v1). The proximate 100 nucleotides on the 5′‐side (−100 to −1 bp) and 3′‐side (1–100 bp) of each insertion site were extracted from the chromosome and further counted for the base composition. Figure 1 shows the percentage (y‐axis) of each kind of base in 123 insertion sites in terms of offset (x‐axis, negative means the 5′‐side and positive means the 3′‐side) to the insertion site.
Visualization and statistics of Tnt1 insertion frequency
The GC content was calculated as follows: GC content = (G + C)/(A + T + G + C) × 100%. Circos was used to visualize the GC content and Tnt1 insertion frequencies (Krzywinski et al., 2009; Zhang et al., 2013). Centromere positions and locations were identified from a recently published report on centromeric DNA characterization in B. distachyon (Li et al., 2018).
Genome coverage estimate for Tnt1 inserts
The genome coverage estimation is derived from the equation (Krysan et al., 1999), where p is the probability of finding one Tnt1 insert (Tadege et al., 2008) within a given gene, x is the average length of a gene transcript (3370 bases/1000 = 3.37 kb), y is the total length of transcribed genes [115 735 410 bp/(1000 × 1000) = 115.735 Mb], R tr is the probability of insertion into a transcription region within the sequenced gene space R gs and N is the total number of Tnt1 inserts required. Since 121 insertion sites were associated with 49 genes (R1 lines), R tr is equal to 49/121 = 40.5% and the speculated full genome size is 280 Mbp (http://www.phytozome.net/brachy.php). The B. distachyon genome (version 1. 2) contains 278 300 300 bases; therefore, the coverage of sequenced gene space R gs = 278 300 300/(280 × 1000 × 1000) = 99.39%. Based on the equation, and given that there are 121/19 = 6.37 inserts per line, we estimated that approximately 29 613 lines will be sufficient for a 90% probability of tagging any given gene in B. distachyon.
CONFLICT OF INTEREST
All authors declare no conflicts of interest.
AUTHOR CONTRIBUTIONS
RSN, JCY, USG and KSM contributed to the conception and design of the experiment. RSN and USG contributed to the acquisition of the data. USG, KHL, JCY contributed to the mutant sample generation, RSN, XD, WZ, NK, PXZ and KSM contributed to data analysis and interpretation. RSN, JCY, KSM, PXZ drafted the manuscript, and all the authors critically revised and approved the final version of the manuscript for publication.
Supporting information
Figure S1. Sequence capture workflow.
Figure S2. Sequence capture validation using real time PCR.
Figure S3. The T‐DNA region of the transposition construct.
Figure S4. The PCR analysis of transgenic lines.
Figure S5. Validation of Tnt1 insertions.
Figure S6. Distribution of Tnt1 flanking sequence tags on different chromosomes and the GC content of the chromosomes.
Table S1. A list of all Tnt1 insertions in Brachypodium distachyon.
Table S2. A list of all primers to validate Tnt1 insertions in Brachypodium distachyon.
Table S3. Mendelian segregation of Tnt1 insertions.
Table S4. Distribution of Tnt1 insertions in Brachypodium distachyon in different chromosomes.
ACKNOWLEDGEMENTS
We thank Janie Gallaway for her excellent work in plant maintenance. We also thank the genomics core facility at the Noble Research Institute for their help with Illumina Library generation and sequencing. We further thank Dr Liang Sun at the Noble Research Institute for help with data analysis. This work was supported by the Noble Research Institute, LLC.
DATA AVAILABILITY STATEMENT
All the raw data are deposited at NCBI under the accession/bioproject ‘PRJNA565798’ with biosample accessions (SAMN12769012–SAMN12769077).
REFERENCES
- Alonso, J.M. , Stepanova, A.N. , Leisse, T.J. et al (2003) Genome‐wide insertional mutagenesis of Arabidopsis thaliana . Science, 301, 653–657. [DOI] [PubMed] [Google Scholar]
- Altschul, S.F. , Madden, T.L. , Schaffer, A.A. , Zhang, J. , Zhang, Z. , Miller, W. and Lipman, D.J. (1997) Gapped BLAST and PSI‐BLAST: a new generation of protein database search programs. Nucleic Acids Res. 25, 3389–3402. [DOI] [PMC free article] [PubMed] [Google Scholar]
- An, T. , Cai, Y. , Zhao, S. , Zhou, J. , Song, B. , Bux, H. and Qi, X. (2016) Brachypodium distachyon T‐DNA insertion lines: a model pathosystem to study nonhost resistance to wheat stripe rust. Sci. Rep. 6, 25510. [DOI] [PMC free article] [PubMed] [Google Scholar]
- Anca, I.A. , Fromentin, J. , Bui, Q.T. , Mhiri, C. , Grandbastien, M.A. and Simon‐Plas, F. (2014) Different tobacco retrotransposons are specifically modulated by the elicitor cryptogein and reactive oxygen species. J. Plant Physiol. 171, 1533–1540. [DOI] [PubMed] [Google Scholar]
- Attard, A. , Gout, L. , Ross, S. , Parlange, F. , Cattolico, L. , Balesdent, M.H. and Rouxel, T. (2005) Truncated and RIP‐degenerated copies of the LTR retrotransposon Pholy are clustered in a pericentromeric region of the Leptosphaeria maculans genome. Fungal Genet. Biol. 42, 30–41. [DOI] [PubMed] [Google Scholar]
- Bennetzen, J.L. (2002) Mechanisms and rates of genome expansion and contraction in flowering plants. Genetica, 115, 29–36. [DOI] [PubMed] [Google Scholar]
- Bennetzen, J.L. (2005) Transposable elements, gene creation and genome rearrangement in flowering plants. Curr. Opin. Genet. Dev. 15, 621–627. [DOI] [PubMed] [Google Scholar]
- Bennetzen, J.L. and Wang, H. (2014) The contributions of transposable elements to the structure, function, and evolution of plant genomes. Annu. Rev. Plant Biol. 65, 505–530. [DOI] [PubMed] [Google Scholar]
- Bolger, A.M. , Lohse, M. and Usadel, B. (2014) Trimmomatic: a flexible trimmer for Illumina sequence data. Bioinformatics, 30, 2114–2120. [DOI] [PMC free article] [PubMed] [Google Scholar]
- Brandes, A. , Heslop‐Harrison, J.S. , Kamm, A. , Kubis, S. , Doudrick, R.L. and Schmidt, T. (1997) Comparative analysis of the chromosomal and genomic organization of Ty1‐copia‐like retrotransposons in pteridophytes, gymnosperms and angiosperms. Plant Mol. Biol. 33, 11–21. [DOI] [PubMed] [Google Scholar]
- Budziszewski, G.J. , Lewis, S.P. , Glover, L.W. et al (2001) Arabidopsis genes essential for seedling viability: isolation of insertional mutants and molecular cloning. Genetics, 159, 1765–1778. [DOI] [PMC free article] [PubMed] [Google Scholar]
- Bushman, F.D. (2003) Targeting survival: integration site selection by retroviruses and LTR‐retrotransposons. Cell, 115, 135–138. [DOI] [PubMed] [Google Scholar]
- Carter, J.D. , Pereira, A. , Dickerman, A.W. and Veilleux, R.E. (2013) An active ac/ds transposon system for activation tagging in tomato cultivar m82 using clonal propagation. Plant Physiol. 162, 145–156. [DOI] [PMC free article] [PubMed] [Google Scholar]
- Cheng, X. , Krom, N. , Zhang, S. , Mysore, K.S. , Udvardi, M. and Wen, J. (2017) Enabling reverse genetics in Medicago truncatula using high‐throughput sequencing for Tnt1 flanking sequence recovery. Methods Mol. Biol. 1610, 25–37. [DOI] [PubMed] [Google Scholar]
- Cheng, X. , Wang, M. , Lee, H.K. , Tadege, M. , Ratet, P. , Udvardi, M. , Mysore, K.S. and Wen, J. (2014) An efficient reverse genetics platform in the model legume Medicago truncatula . New Phytol. 201, 1065–1076. [DOI] [PubMed] [Google Scholar]
- Cheng, X. , Wen, J. , Tadege, M. , Ratet, P. and Mysore, K.S. (2011) Reverse genetics in Medicago truncatula using Tnt1 insertion mutants. Methods Mol. Biol. 678, 179–190. [DOI] [PubMed] [Google Scholar]
- Cui, Y. , Barampuram, S. , Stacey, M.G. , Hancock, C.N. , Findley, S. , Mathieu, M. , Zhang, Z. , Parrott, W.A. and Stacey, G. (2013) Tnt1 retrotransposon mutagenesis: a tool for soybean functional genomics. Plant Physiol. 161, 36–47. [DOI] [PMC free article] [PubMed] [Google Scholar]
- d'Erfurth, I. , Cosson, V. , Eschstruth, A. , Lucas, H. , Kondorosi, A. and Ratet, P. (2003) Efficient transposition of the Tnt1 tobacco retrotransposon in the model legume Medicago truncatula . Plant J. 34, 95–106. [DOI] [PubMed] [Google Scholar]
- Dalmais, M. , Antelme, S. , Ho‐Yue‐Kuang, S. et al (2013) A TILLING platform for functional genomics in. PLoS One, 8, e65503. [DOI] [PMC free article] [PubMed] [Google Scholar]
- Dooner, H.K. and Belachew, A. (1989) Transposition pattern of the maize element Ac from the Bz‐M2(ac) allele. Genetics, 122, 447–457. [DOI] [PMC free article] [PubMed] [Google Scholar]
- Draper, J. , Mur, L.A. , Jenkins, G. , Ghosh‐Biswas, G.C. , Bablak, P. , Hasterok, R. and Routledge, A.P. (2001) Brachypodium distachyon. A new model system for functional genomics in grasses. Plant Physiol. 127, 1539–1555. [PMC free article] [PubMed] [Google Scholar]
- Duangpan, S. , Zhang, W. , Wu, Y. , Jansky, S.H. and Jiang, J. (2013) Insertional mutagenesis using Tnt1 retrotransposon in potato. Plant Physiol. 163, 21–29. [DOI] [PMC free article] [PubMed] [Google Scholar]
- Gill, U.S. , Serrani‐Yarce, J.C. , Lee, H.K. and Mysore, K.S. (2018) Tissue culture (somatic embryogenesis)‐induced Tnt1 retrotransposon‐based mutagenesis in Brachypodium distachyon . Methods Mol. Biol. 1667, 57–63. [DOI] [PubMed] [Google Scholar]
- Gordon, S.P. , Contreras‐Moreira, B. , Woods, D.P. et al (2017) Extensive gene content variation in the Brachypodium distachyon pan‐genome correlates with population structure. Nat. Commun. 8, 2184. [DOI] [PMC free article] [PubMed] [Google Scholar]
- Grandbastien, M.A. (1998) Activation of plant retrotransposons under stress conditions. Trends Plant Sci. 3, 181–187. [Google Scholar]
- Grandbastien, M.A. (2014) LTR retrotransposons, handy hitchhikers of plant regulation and stress response. Biochim. Biophys. Acta, 1849, 403–416. [DOI] [PubMed] [Google Scholar]
- Grandbastien, M.A. , Spielmann, A. and Caboche, M. (1989) Tnt1, a mobile retroviral‐like transposable element of tobacco isolated by plant cell genetics. Nature, 337, 376–380. [DOI] [PubMed] [Google Scholar]
- Hernandez‐Pinzon, I. , Cifuentes, M. , Henaff, E. , Santiago, N. , Espinas, M.L. and Casacuberta, J.M. (2012) The Tnt1 retrotransposon escapes silencing in tobacco, its natural host. PLoS One, 7, e33816. [DOI] [PMC free article] [PubMed] [Google Scholar]
- Heslop‐Harrison, J.S. , Brandes, A. , Taketa, S. et al (1997) The chromosomal distributions of Ty1‐copia group retrotransposable elements in higher plants and their implications for genome evolution. Genetica, 100, 197–204. [PubMed] [Google Scholar]
- Hirochika, H. , Okamoto, H. and Kakutani, T. (2000) Silencing of retrotransposons in Arabidopsis and reactivation by the ddm1 mutation. Plant Cell, 12, 357–368. [DOI] [PMC free article] [PubMed] [Google Scholar]
- Hsia, M.M. , O'Malley, R. , Cartwright, A. et al (2017) Sequencing and functional validation of the JGI Brachypodium distachyon T‐DNA collection. Plant J. 91, 361–370. [DOI] [PubMed] [Google Scholar]
- Iantcheva, A. , Chabaud, M. , Cosson, V. , Barascud, M. , Schutz, B. , Primard‐Brisset, C. , Durand, P. , Barker, D.G. , Vlahova, M. and Ratet, P. (2009) Osmotic shock improves Tnt1 transposition frequency in Medicago truncatula cv Jemalong during in vitro regeneration. Plant Cell Rep. 28, 1563–1572. [DOI] [PubMed] [Google Scholar]
- International Brachypodium I (2010) Genome sequencing and analysis of the model grass Brachypodium distachyon . Nature, 463, 763–768. [DOI] [PubMed] [Google Scholar]
- Jeon, J.S. , Lee, S. , Jung, K.H. et al (2000) T‐DNA insertional mutagenesis for functional genomics in rice. Plant J. 22, 561–570. [DOI] [PubMed] [Google Scholar]
- Jiang, C. , Chen, C. , Huang, Z. , Liu, R. and Verdier, J. (2015) ITIS, a bioinformatics tool for accurate identification of transposon insertion sites using next‐generation sequencing data. BMC Bioinformatics, 16, 72. [DOI] [PMC free article] [PubMed] [Google Scholar]
- Johnson, M. , Zaretskaya, I. , Raytselis, Y. , Merezhuk, Y. , McGinnis, S. and Madden, T.L. (2008) NCBI BLAST: a better web interface. Nucleic Acids Res. 36, W5–W9. [DOI] [PMC free article] [PubMed] [Google Scholar]
- Kloeckener‐Gruissem, B. , Vogel, J.M. and Freeling, M. (1992) The TATA box promoter region of maize Adh1 affects its organ‐specific expression. EMBO J. 11, 157–166. [DOI] [PMC free article] [PubMed] [Google Scholar]
- Krysan, P.J. , Young, J.C. and Sussman, M.R. (1999) T‐DNA as an insertional mutagen in Arabidopsis. Plant Cell, 11, 2283–2290. [DOI] [PMC free article] [PubMed] [Google Scholar]
- Krzywinski, M. , Schein, J. , Birol, I. , Connors, J. , Gascoyne, R. , Horsman, D. , Jones, S.J. and Marra, M.A. (2009) Circos: an information aesthetic for comparative genomics. Genome Res. 19, 1639–1645. [DOI] [PMC free article] [PubMed] [Google Scholar]
- Kumar, A. and Bennetzen, J.L. (1999) Plant retrotransposons. Annu. Rev. Genet. 33, 479–532. [DOI] [PubMed] [Google Scholar]
- Li, Y. , Zuo, S. , Zhang, Z. , Li, Z. , Han, J. , Chu, Z. , Hasterok, R. and Wang, K. (2018) Centromeric DNA characterization in the model grass Brachypodium distachyon provides insights on the evolution of the genus. Plant J. 93, 1088–1101. [DOI] [PubMed] [Google Scholar]
- Liu, X. and Chu, Z. (2015) Genome‐wide evolutionary characterization and analysis of bZIP transcription factors and their expression profiles in response to multiple abiotic stresses in Brachypodium distachyon . BMC Genom., 16, 227. [DOI] [PMC free article] [PubMed] [Google Scholar]
- Long, D. , Martin, M. , Sundberg, E. , Swinburne, J. , Puangsomlee, P. and Coupland, G. (1993) The maize transposable element system Ac/Ds as a mutagen in Arabidopsis: identification of an albino mutation induced by Ds insertion. Proc. Natl Acad. Sci. USA, 90, 10370–10374. [DOI] [PMC free article] [PubMed] [Google Scholar]
- Lucas, H. , Feuerbach, F. , Kunert, K. , Grandbastien, M.A. and Caboche, M. (1995) Rna‐mediated transposition of the tobacco retrotransposon Tnt1 in Arabidopsis thaliana . EMBO J. 14, 2364–2373. [DOI] [PMC free article] [PubMed] [Google Scholar]
- Marton, L. , Hrouda, M. , Pecsvaradi, A. and Czako, M. (1994) T‐DNA‐insert‐independent mutations induced in transformed plant cells during Agrobacterium co‐cultivation. Transgenic Res. 3, 317–325. [DOI] [PubMed] [Google Scholar]
- Mazier, M. , Botton, E. , Flamain, F. , Blouchet, J.P. , Courtial, B. , Chupeau, M.C. , Chupeau, Y. , Maisonneuve, B. and Lucas, H. (2007a) Successful gene tagging in lettuce using the Tnt1 retrotransposon from tobacco. Plant Physiol. 144, 18–31.17351058 [Google Scholar]
- Mazier, M. , Botton, E. , Flamain, F. , Bouchet, J.P. , Courtial, B. , Chupeau, M.C. , Chupeau, Y. , Maisonneuve, B. and Lucas, H. (2007b) Successful gene tagging in lettuce using the Tnt1 retrotransposon from tobacco. Plant Physiol. 144, 18–31.17351058 [Google Scholar]
- McElver, J. , Tzafrir, I. , Aux, G. et al (2001) Insertional mutagenesis of genes required for seed development in Arabidopsis thaliana . Genetics, 159, 1751–1763. [DOI] [PMC free article] [PubMed] [Google Scholar]
- Melayah, D. , Bonnivard, E. , Chalhoub, B. , Audeon, C. and Grandbastien, M.A. (2001) The mobility of the tobacco Tnt1 retrotransposon correlates with its transcriptional activation by fungal factors. Plant J. 28, 159–168. [DOI] [PubMed] [Google Scholar]
- Mhiri, C. , Morel, J.B. , Vernhettes, S. , Casacuberta, J.M. , Lucas, H and Grandbastien, M.A. (1997) The promoter of the tobacco Tnt1 retrotransposon is induced by wounding and by abiotic stress. Plant Mol Biol. 33(2), 257–266. [DOI] [PubMed] [Google Scholar]
- Miyao, A. , Tanaka, K. , Murata, K. , Sawaki, H. , Takeda, S. , Abe, K. , Shinozuka, Y. , Onosato, K. and Hirochika, H. (2003) Target site specificity of the Tos17 retrotransposon shows a preference for insertion within genes and against insertion in retrotransposon‐rich regions of the genome. Plant Cell, 15, 1771–1780. [DOI] [PMC free article] [PubMed] [Google Scholar]
- Morot‐Gaudry, J.‐F. , Lea, P. and Briat, J.F. (2007) Functional Plant Genomics. Enfield, NH: Science Publishers. [Google Scholar]
- Oyama, R.K. , Silber, M.V. and Renner, S.S. (2010) A specific insertion of a solo‐LTR characterizes the Y‐chromosome of Bryonia dioica (Cucurbitaceae). BMC Res. Notes, 3, 166. [DOI] [PMC free article] [PubMed] [Google Scholar]
- Pearce, S.R. , Pich, U. , Harrison, G. , Flavell, A.J. , Heslop‐Harrison, J.S. , Schubert, I. and Kumar, A. (1996) The Ty1‐copia group retrotransposons of Allium cepa are distributed throughout the chromosomes but are enriched in the terminal heterochromatin. Chromosome Res. 4, 357–364. [DOI] [PubMed] [Google Scholar]
- Rigal, M. and Mathieu, O. (2011) A "mille‐feuille" of silencing: epigenetic control of transposable elements. Biochim. Biophys. Acta, 1809, 452–458. [DOI] [PubMed] [Google Scholar]
- Robb, S.M. , Lu, L. , Valencia, E. , Burnette, J.M. 3rd , Okumoto, Y. , Wessler, S.R. and Stajich, J.E. (2013) The use of RelocaTE and unassembled short reads to produce high‐resolution snapshots of transposable element generated diversity in rice. G3: Genes ‐ Genomes ‐ Genetics, 3, 949–957. [DOI] [PMC free article] [PubMed] [Google Scholar]
- Sandmeyer, S. (2003) Integration by design. Proc. Natl Acad. Sci. USA, 100, 5586–5588. [DOI] [PMC free article] [PubMed] [Google Scholar]
- Singer, T. and Burke, E. (2003) High‐throughput TAIL‐PCR as a tool to identify DNA flanking insertions. Methods Mol. Biol. 236, 241–272. [DOI] [PubMed] [Google Scholar]
- Sun, L. , Gill, U.S. , Nandety, R.S. , Kwon, S. , Mehta, P. , Dickstein, R. , Udvardi, M.K. , Mysore, K.S. and Wen, J. (2019) Genome‐wide analysis of flanking sequences reveals that Tnt1 insertion is positively correlated with gene methylation in Medicago truncatula . Plant J. 98, 1106–1119. [DOI] [PubMed] [Google Scholar]
- Tadege, M. , Ratet, P. and Mysore, K.S. (2005) Insertional mutagenesis: a Swiss Army knife for functional genomics of Medicago truncatula . Trends Plant Sci. 10, 229–235. [DOI] [PubMed] [Google Scholar]
- Tadege, M. , Wen, J. , He, J. et al (2008) Large‐scale insertional mutagenesis using the Tnt1 retrotransposon in the model legume Medicago truncatula . Plant J. 54, 335–347. [DOI] [PubMed] [Google Scholar]
- Thole, V. , Peraldi, A. , Worland, B. , Nicholson, P. , Doonan, J.H. and Vain, P. (2012) T‐DNA mutagenesis in Brachypodium distachyon . J. Exp. Bot. 63, 567–576. [DOI] [PubMed] [Google Scholar]
- Thole, V. , Worland, B. , Wright, J. , Bevan, M.W. and Vain, P. (2010) Distribution and characterization of more than 1000 T‐DNA tags in the genome of Brachypodium distachyon community standard line Bd21. Plant Biotechnol. J. 8, 734–747. [DOI] [PubMed] [Google Scholar]
- Urbanski, D.F. , Malolepszy, A. , Stougaard, J. and Andersen, S.U. (2012) Genome‐wide LORE1 retrotransposon mutagenesis and high‐throughput insertion detection in Lotus japonicus . Plant J. 69, 731–741. [DOI] [PubMed] [Google Scholar]
- Uren, A.G. , Mikkers, H. , Kool, J. et al (2009) A high‐throughput splinkerette‐PCR method for the isolation and sequencing of retroviral insertion sites. Nat. Protoc. 4, 789–798. [DOI] [PMC free article] [PubMed] [Google Scholar]
- Vain, P. , Worland, B. , Thole, V. , McKenzie, N. , Alves, S.C. , Opanowicz, M. , Fish, L.J. , Bevan, M.W. and Snape, J.W. (2008) Agrobacterium‐mediated transformation of the temperate grass Brachypodium distachyon (genotype Bd21) for T‐DNA insertional mutagenesis. Plant Biotechnol. J. 6, 236–245. [DOI] [PubMed] [Google Scholar]
- Veerappan, V. , Jani, M. , Kadel, K. et al (2016) Rapid identification of causative insertions underlying Medicago truncatula Tnt1 mutants defective in symbiotic nitrogen fixation from a forward genetic screen by whole genome sequencing. BMC Genom. 17, 141. [DOI] [PMC free article] [PubMed] [Google Scholar]
- Vicient, C.M. and Casacuberta, J.M. (2017) Impact of transposable elements on polyploid plant genomes. Ann. Bot. 120, 195–207. [DOI] [PMC free article] [PubMed] [Google Scholar]
- Vogel, J. and Hill, T. (2008) High‐efficiency Agrobacterium‐mediated transformation of Brachypodium distachyon inbred line Bd21‐3. Plant Cell Rep. 27, 471–478. [DOI] [PubMed] [Google Scholar]
- Vogel, J.P. , Tuna, M. , Budak, H. , Huo, N. , Gu, Y.Q. and Steinwand, M.A. (2009) Development of SSR markers and analysis of diversity in Turkish populations of Brachypodium distachyon . BMC Plant Biol. 9, 88. [DOI] [PMC free article] [PubMed] [Google Scholar]
- Wessler, S.R. (2006) Transposable elements and the evolution of eukaryotic genomes. Proc. Natl Acad. Sci. USA, 103, 17600–17601. [DOI] [PMC free article] [PubMed] [Google Scholar]
- Wu, H. , Xue, X. , Qin, C. et al (2019) An efficient system for Ds transposon tagging in Brachypodium distachyon . Plant Physiol. 180, 56–65. [DOI] [PMC free article] [PubMed] [Google Scholar]
- Zhang, H. , Meltzer, P. and Davis, S. (2013) RCircos: an R package for Circos 2D track plots. BMC Bioinformatics, 14, 244. [DOI] [PMC free article] [PubMed] [Google Scholar]
Associated Data
This section collects any data citations, data availability statements, or supplementary materials included in this article.
Supplementary Materials
Figure S1. Sequence capture workflow.
Figure S2. Sequence capture validation using real time PCR.
Figure S3. The T‐DNA region of the transposition construct.
Figure S4. The PCR analysis of transgenic lines.
Figure S5. Validation of Tnt1 insertions.
Figure S6. Distribution of Tnt1 flanking sequence tags on different chromosomes and the GC content of the chromosomes.
Table S1. A list of all Tnt1 insertions in Brachypodium distachyon.
Table S2. A list of all primers to validate Tnt1 insertions in Brachypodium distachyon.
Table S3. Mendelian segregation of Tnt1 insertions.
Table S4. Distribution of Tnt1 insertions in Brachypodium distachyon in different chromosomes.
Data Availability Statement
All the raw data are deposited at NCBI under the accession/bioproject ‘PRJNA565798’ with biosample accessions (SAMN12769012–SAMN12769077).