Abstract
Self‐assembly of fluorenylmethoxycarbonyl‐protected diphenylalanine (FmocFF) in water is widely known to produce hydrogels. Typically, confocal microscopy is used to visualize such hydrogels under wet conditions, that is, without freezing or drying. However, key aspects of hydrogels like fiber diameter, network morphology and mesh size are sub‐diffraction limited features and cannot be visualized effectively using this approach. In this work, we show that it is possible to image FmocFF hydrogels by Points Accumulation for Imaging in Nanoscale Topography (PAINT) in native conditions and without direct gel labelling. We demonstrate that the fiber network can be visualized with improved resolution (≈50 nm) both in 2D and 3D. Quantitative information is extracted such as mesh size and fiber diameter. This method can complement the existing characterization tools for hydrogels and provide useful information supporting the design of new materials.
Keywords: FmocFF, hydrogels, Mesh size, PAINT, super-resolution
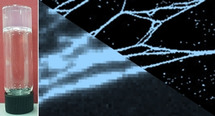
Key aspects of hydrogels like fiber diameter, network morphology and mesh size are sub‐diffraction limited features and cannot be visualized effectively using confocal microscopy. In this work, we show that it is possible to image fluorenylmethoxycarbonyl‐protected diphenylalanine (FmocFF) hydrogels by points accumulation for imaging in nanoscale topography (PAINT) in native conditions and without direct gel labelling (see figure).
Gels formed by the self‐assembly of small molecules are of considerable interest in a range of fields.1 Such gels are formed by the self‐assembly of the gelator molecules into nanostructures such as fibres, nanotubes or helical fibres.1a At a suitable concentration, these structures entangle or otherwise cross‐link to form a network. In practice, assuming the gelator is stable, it is relatively easy to prepare gels using approaches such as heating and cooling, adjusting the pH of the solution or the addition of a salt. In all cases, these methods work by providing one regime where the gelator is solubilised or dispersed and then a second regime where the solubility is much lower and hence the self‐assembly is favoured.
The mechanical and chemical properties of the gels that are formed depend on many parameters of the underlining network structure such as fibre persistence length, type and number of crosslinks and the network geometry.2 Being able to measure these parameters is crucial in understanding gel formation and it is key for the rational design of improved structures.
Typically, many aspects of these gels are determined by microscopy techniques such as transmission electron microscopy (TEM), scanning electron microscopy (SEM) or atomic force microscopy (AFM). Whilst powerful, there are some limitations related to these techniques. Drying of the gels is needed in most cases, which typically means that at best a 2D representation of the 3D network is imaged. On top of this, it is known that drying the gels can lead to changes to the self‐assembled structures and networks, meaning that the images do not represent the native gels.1e, 3 Methods such as freeze‐drying have been used to remove the solvent(s) in a less invasive manner, but still result in the perturbation of the native structure. Cryo‐TEM can be used without the need for drying, but sample preparation requires that thin films are used (typically 300 nm or less),4 which again means that it is hard to be sure that the 3D structure of the gel has not been perturbed.
Spectroscopic techniques such as small angle X‐ray scattering (SAXS) and small angle neutron scattering (SANS) can be used to probe the self‐assembled structures without the need for drying.5 These methods allow the structures that underpin the gels to be determined, typically by fitting the scattering profile to a model. Whilst effective, the length scale probed (typically <100 nm) represents a limitation in obtaining a full picture of the gel structure. Longer length scales can be accessed by moving to ultra‐small angle scattering (USAXS or USANS), but there is little information available currently and limited models to understand how the observed scattering links to a particular type of network.
Moreover, these techniques are ensemble methods and fail to provide information about structure spatial heterogeneity.
Confocal microscopy can overcome several of these issues.6 This technique allows the microstructure to be determined, and it can show how the properties of different gels correlate with how the self‐assembled nanofibers are organized in space (the microstructure).7 One of the main issues here is the spatial resolution that hampers the observations of features below 250–300 nm. Super‐resolution microscopy techniques are becoming progressively accessible and allow an increase in resolution whilst maintaining some of the advantages of confocal imaging. Recently, several reports show the potential of super‐resolution imaging to unveil the nanoscale structural and functional features of materials.8 In the hydrogels field, these techniques are very appealing allowing to measure gel nanostructure in the solvated state.8a For example, Hamachi and co‐workers used Stimulated Emission Depletion (STED) microscopy for in situ visualization of self‐sorted supramolecular fibres.9 STED allows for fast and multicolour imaging; however, structures must be pre‐labelled which potentially affects the supramolecular structure and the very high illumination power needed can create artefacts due to local heating or photo‐crosslinking.
In the present article, we develop a single molecule localization microscopy (SMLM) method based on Points Accumulation for Imaging in Nanoscale Topography (PAINT) for hydrogels imaging. Our method allows us to image hydrogels with a resolution down to tens of nanometres without the need of direct labelling (e.g. without needing to synthesize a dye‐modified hydrogelator). We show here the potential to measure the geometry and organization in 2D and 3D of the hydrogels and to obtain key parameters such as mesh size and fibre diameter. As a first proof‐of‐principle, we applied PAINT to a widely used family of hydrogelators, Fmoc‐protected short peptides.
Gels formed by the self‐assembly of short peptides are a thriving field.10 Hydrogels can be formed from a wide range of different oligopeptides, including dipeptides.10b, 11 Perhaps the most widely known dipeptide can form hydrogels is diphenylalanine protected at the N‐terminus with the fluorenylmethoxycarbonyl group (FmocFF, Figure 1 a).12 Gels can be formed from FmocFF in a variety of ways, including adding water to a solution of FmocFF in a solvent such as DMSO or hexafluoroisopropanol,12b adjusting the pH of a solution from around 10 to around 4,13 or adding a calcium salt to a solution at pH 10.14 Gels formed from FmocFF have been used for many applications including 3D cell culturing,13, 15 controlled release,12b in biocatalysis16 and for biomineralization.17 Despite the interest in this material, there is a limited understanding as to how the gel properties are related to the underlying network. Here, we report the first super‐resolution microscopy study of this important material. Gels were prepared by adding water to a solution of FmocFF in DMSO.12b, 18 Using this approach, gels were prepared at final ratios of DMSO to water of 20:80 (i.e. 20 % DMSO), 30:70 (30 % DMSO) and 40:60 (40 % DMSO) and a final concentration of FmocFF of 1‐1.5 mg mL−1 (Figure 1 b). These gels showed rheological data typical of such low molecular weight gels. The storage modulus (G’) and the loss modulus (G′′) are relatively independent of frequency. The gels break at <10 % strain as is typical, with the gels formed at 20 % DMSO being slightly stiffer than those formed at 40 % DMSO (Figure 1 c).
Figure 1.
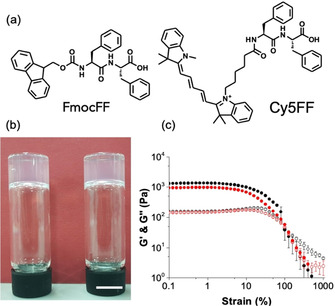
(a) Chemical structures of (left) FmocFF and (right) Cy5FF; (b) Photographs of gels formed at (left) 20 % DMSO and (right) 40 % DMSO. The scale bar is 1 cm; (c) Strain sweeps for gels formed in 20 % DMSO (black data) and 40 % DMSO (red data). In both cases, G’ is shown by full symbols and G′′ by empty symbols. Error bars calculated from standard deviation of three measurements at 25 °C.
Next, gels were imaged by confocal microscopy by incorporating Nile Blue as a staining agent as previously described (Figure 2 a and 2b).18 The gels are formed by domains of fibrous structures as can qualitatively visualised by diffraction‐limited microscopy. Such spherulitic domains are expected from previous data.18, 19
Figure 2.
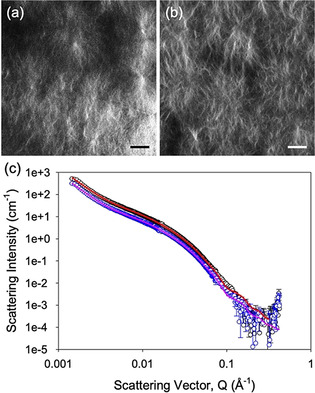
(a) Confocal microscope image of a gel formed at 20 % DMSO; (b) Confocal microscope image of a gel formed at 40 % DMSO; (c) Scattering pattern (open circles) and fit (solid lines) for gels formed at 20 % DMSO (black and red data) and 40 % DMSO (blue and pink data). For (a) and (b), the scale bar represents 20 μm.
Moreover, the nature of the fibrous structures making up the domains was probed using small angle neutron scattering (Figure 2 c). The scattering data fit best to a flexible elliptical cylinder model combined with a power law to take into account the scattering at low Q (see Supporting Information for full fitting parameters). The scattering from gels at both ratios of DMSO:water give very similar parameters from the fits to the data, implying that the underlying structures are the same in both cases. The fits imply that the flexible elliptical cylinders have a radius of 3.3 nm, an axis ratio of 2.2, a Kuhn length of 8.9 nm, and lengths of >100 nm. The scattering at low Q can be interpreted as being due to the scattering from the network. The data can also be fitted to a flexible cylinder with a power law, but in this case, it is necessary to include a significant polydispersity in the radius (0.3) to access a reasonable fit and, even then, the fit is not as good as to the flexible elliptical cylinder model.
The SANS data are informative as to the primary underlying structures that lead to the gel network. However, it is very difficult to understand the network from these data, with there simply being a contribution from the network that we take into account using a power law. To better understand the network, we turned to super‐resolution microscopy. Here, we used PAINT, a single molecule localization technique where free probes bind reversibly to the structure of study, allowing for the precise localization of the binding events (Figure 3 a).20 We chose Cy5FF (Figure 1 a) as a PAINT probe as it had been reported to reversibly bind and unbind from the FF assemblies.21 By this means, we avoided labelling permanently the monomers, eliminating a potential impact in the final network structure as well as avoiding photobleaching effects during acquisition. Notably the choice of a PAINT probe is crucial as the binding and unbinding kinetic constant have to be finely tuned to allow the probe to bind long enough to accumulate significant signal but to achieve individual emitters localization without signal overload. Figure 3 b shows a representative image of the FmocFF gel structure imaged by PAINT.
Figure 3.
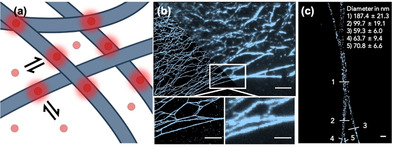
(a) A cartoon showing how PAINT works. The probe (red circle) can reversibly bind to the fibres (blue shapes). When they are bound, they fluoresce and can be imaged; (b) low resolution (right) vs. PAINT image (left). Scale bar top image represents 5 μm. Scale bar bottom image represents 2.5 μm; (c) Magnification of a crossed fibre. Scale bar represents 200 nm. Image correspond to FmocFF 1.5 mg mL−1, 40 % DMSO, 20 nm Cy5FF representing the 1.78×10⁻⁴ mol %. The numbers represent the different points at which the diameter of the fibre was measured.
In Figure 3 b, we compare a low‐resolution image where the gel features remain unresolved with a PAINT image of the same field. The improved resolution allows for a better direct visualization of the fibre network, showing the potential of this technique to study some key features of gels. The thinner fibres observed by PAINT have a diameter of ≈50 nm, that is close to the limit of resolution of this technique in ideal cases (≈10 nm). The drift during the imaging process (movement of imaging stage or sample holder) and the movement of gel scaffold (vibration) are the most challenging concerns lowering the resolution. We applied a drift correction to minimize the first effect, while it is not possible to correct inner movements of the gel. This explains the larger diameter observed in comparison with SANS measurements. Figure 3 c shows a zoom in of three separated fibres converging together and separating again after. The diameter of the fibres 3, 4 and 5 is 59.3±6.0, 63.7±9.4 and 70.8±6.6 nm in diameter while the cross‐link or entanglement diameter of 1 is 187.4±21.3 nm. Interestingly, the sum of the three diameters (3+4+5), 193.8 nm, is very close to the measured value of the cross‐link/entanglement. This may indicate that the fibres entangle or bundle together, summing the diameters of the fibres. If instead we had a single fibre branching, the diameter should remain essentially constant. Fibers bundling and separating again is a feature that only microscopy can discriminate, although a better fitting of small angle scattering techniques could complement it.
Another parameter that can be obtained with our method is the mesh size, one of the factors affecting the physical properties of the gel. Indirect methods have been developed to determine mesh size, for example using diffusion measurements by Fluorescence Recovery After Photobleaching (FRAP),22 NMR spectroscopy23 or diffusion measurements.24 The mesh size can also be determined from rheological properties assuming key information such as fibre persistence length are known.25 However, in all of these cases, it is common to assume that the mesh size is relatively uniform. PAINT is the only technique able to directly image hole units of the network. In Figure 4 a, we show how PAINT images can be processed to obtain the size distribution of the mesh holes. With a partially automated image analysis routine (see Supporting Information), we measured the areas between the fibres, summing a total of 5,608 meshes, and plotting a histogram (see Figure 4 c). The histogram shows two populations, one more frequent of very small mesh sizes (between 20–40 nm2), and another one very broad representing larger areas. Interestingly, the small size population has been reported before by other techniques like micro‐rheology,22, 23, 26 however it is not the case for the big size population. Generally, a single mesh size is assumed for hydrogels, although in such entangled fibre systems it would be expected that the mesh size is polydisperse.
Figure 4.
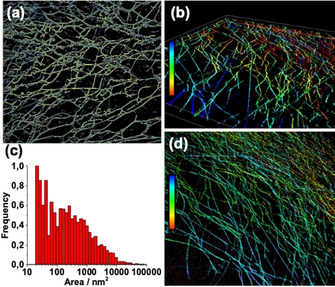
(a) Mesh size identification of FmocFF hydrogel (1.5 mg mL−1, 40 % DMSO); (b) 3D imaging of hydrogels (1 mg mL−1, 30 % DMSO, 20 nm Cy5FF representing the 2.67×10⁻⁴ mol %. Imaged in layers of 120 nm from the glass (red) up to 1.85 μm (blue). The x−y region corresponds to 41 μm x 41 μm; (c) histogram of mesh size; (d) Further 3D imaging of hydrogels (conditions as per (b)).
As a bulk material, it is of real interest not only to study the 2D characteristics, but also the 3D properties. For these reasons, we performed 3D super‐resolution images of these networks using astigmatism Point Spread Function (PSF) shaping. In Figures 4 b and 4d, 3D images of the hydrogel surface can be observed. Fibres in different planes can be perfectly observed in a region of 41 μm×41 μm×1.85 μm. Notably imaging the bulk of the gel in depth is difficult with this method. First, imaging in depth is limited with HiLo illumination to few microns. Moreover, the limited diffusion of the Cy5FF makes very slow the imaging of the less accessible areas of the gel. Improved optics solutions (e.g. adaptive optics) and more efficient probes (that better balance gel diffusion with binding) represents future improvements of the technique.
In conclusion, we have developed a PAINT method to image hydrogels in native conditions both in 2D and 3D. Due to the improvement in resolution of this method, we were able to quantify fibre diameter, distribution and the mesh size of the hydrogels network. This work paves the way towards the use of super‐resolution imaging for gel characterization offering a powerful tool to complement the existing analysis methods. In particular we envision super‐resolution microscopy to be very useful in combination with scattering methods. Where the ensemble scattering techniques can obtain quantitative data on the gel features, methods like PAINT will offer a direct visualization of the network and provide information of the spatial heterogeneity of important feature such as mesh size. The combination of multiple techniques, with their own advantages and disadvantages, will be key to achieve a complete understanding of hydrogels networks and formation and their impact in their mechanical properties.
Conflict of interest
The authors declare no conflict of interest.
Biographical Information
Lorenzo Albertazzi received a MSc in Chemistry (2007) from University of Pisa and a PhD in Biophysics from Scuola Normale Superiore in Pisa (2011). After a visiting period at the University of California Santa Barbara he moved to the Eindhoven University of Technology as Postdoctoral Fellow in the group of Bert Meijer. From 2015 he is Junior Group Leader at IBEC where he leads the group of Nanoscopy for Nanomedicine and from 2018 he is associate professor at the Eindhoven University of Technology. His research interests focus on the understanding of nano‐bio‐materials using advanced optical microscopy techniques such as super resolution microscopy.

Supporting information
As a service to our authors and readers, this journal provides supporting information supplied by the authors. Such materials are peer reviewed and may be re‐organized for online delivery, but are not copy‐edited or typeset. Technical support issues arising from supporting information (other than missing files) should be addressed to the authors.
Supplementary
Acknowledgements
This work was financially supported by the EURONANOMED (NANOVAX: PCIN‐2016‐025), MINECO‐FPI (BES‐2017–080188), TARGESTORM (SAF2016‐75241‐R) and the Generalitat de Catalunya (2017 SGR 01536) to E.F., S.P. and L.A. L.A. and S.P. thank the European Research Council (ERC‐StG‐757397). A.M.F.C. thanks the University of Glasgow for funding a studentship. DA thanks the EPSRC for a Fellowship (EP/L021978/1). ERD thanks the Leverhulme Trust for funding (ECF‐2017‐223) and the University of Glasgow for an LKAS Leadership Fellowship. The experiment at the Institut Laue‐Langevin was allocated beam time under experiment number 9‐11‐1905 (https://doi.org/10.5291/ILL‐DATA.9‐11‐1905). This work benefitted from SasView software, originally developed by the DANSE project under NSF award DMR‐0520547.
E. Fuentes, K. Boháčová, A. M. Fuentes-Caparrós, R. Schweins, E. R. Draper, D. J. Adams, S. Pujals, L. Albertazzi, Chem. Eur. J. 2020, 26, 9869.
Contributor Information
Dr. Dave J. Adams, Email: dave.adams@glasgow.ac.uk.
Dr. Silvia Pujals, Email: spujals@ibecbarcelona.eu.
Dr. Lorenzo Albertazzi, Email: l.albertazzi@ibecbarcelona.eu.
References
- 1.
- 1a. Terech P., Weiss R. G., Chem. Rev. 1997, 97, 3133–3160; [DOI] [PubMed] [Google Scholar]
- 1b. Hirst A. R., Escuder B., Miravet J. F., Smith D. K., Angew. Chem. Int. Ed. 2008, 47, 8002–8018; [DOI] [PubMed] [Google Scholar]; Angew. Chem. 2008, 120, 8122–8139; [Google Scholar]
- 1c. Estroff L. A., Hamilton A. D., Chem. Rev. 2004, 104, 1201–1218; [DOI] [PubMed] [Google Scholar]
- 1d. Weiss R. G., J. Am. Chem. Soc. 2014, 136, 7519–7530; [DOI] [PubMed] [Google Scholar]
- 1e. Weiss R. G., Gels 2018, 4, 25. [Google Scholar]
- 2.
- 2a. Yan C., Pochan D. J., Chem. Soc. Rev. 2010, 39, 3528–3540; [DOI] [PMC free article] [PubMed] [Google Scholar]
- 2b. Sathaye S., Mbi A., Sonmez C., Chen Y., Blair D. L., Schneider J. P., Pochan D. J., Wiley Interdiscip. Rev. Nanomed. Nanobiotechnol. 2015, 7, 34–68. [DOI] [PubMed] [Google Scholar]
- 3. Mears L. L. E., Draper E. R., Castilla A. M., Su H., Zhuola, Dietrich B., Nolan M. C., Smith G. N., Doutch J., Rogers S., Akhtar R., Cui H., Adams D. J., Biomacromolecules 2017, 18, 3531–3540. [DOI] [PMC free article] [PubMed] [Google Scholar]
- 4. Zhong S., Pochan D. J., Polymer Rev. 2010, 50, 287–320. [Google Scholar]
- 5. Guilbaud J.-B., Saiani A., Chem. Soc. Rev. 2011, 40, 1200–1210. [DOI] [PubMed] [Google Scholar]
- 6. Kubota R., Nakamura K., Torigoe S., Hamachi I., ChemistryOpen 2020, 9, 67–79. [DOI] [PMC free article] [PubMed] [Google Scholar]
- 7. Colquhoun C., Draper E. R., Schweins R., Marcello M., Vadukul D., Serpell L. C., Adams D. J., Soft Matter 2017, 13, 1914–1919. [DOI] [PubMed] [Google Scholar]
- 8.
- 8a. Pujals S., Feiner-Gracia N., Delcanale P., Voets I., Albertazzi L., Nat. Rev. Chem. 2019, 3, 68–84; [Google Scholar]
- 8b. Wöll D., Flors C., Small Methods 2017, 1, 1700191; [Google Scholar]
- 8c. Post R. A. J., van der Zwaag D., Bet G., Wijnands S. P. W., Albertazzi L., Meijer E. W., van der Hofstad R. W., Nat. Commun. 2019, 10, 1663; [DOI] [PMC free article] [PubMed] [Google Scholar]
- 8d. Delcanale P., Miret-Ontiveros B., Arista-Romero M., Pujals S., Albertazzi L., ACS Nano 2018, 12, 7629–7637; [DOI] [PubMed] [Google Scholar]
- 8e. Feiner-Gracia N., Beck M., Pujals S., Tosi S., Mandal T., Buske C., Linden M., Albertazzi L., Small 2017, 13, 1701631; [DOI] [PubMed] [Google Scholar]
- 8f. Habuchi S., Front. Bioeng. Biotechnol. 2014, 2, 20. [DOI] [PMC free article] [PubMed] [Google Scholar]
- 9. Onogi S., Shigemitsu H., Yoshii T., Tanida T., Ikeda M., Kubota R., Hamachi I., Nat. Chem. 2016, 8, 743–752. [DOI] [PubMed] [Google Scholar]
- 10.
- 10a. Hu X., Liao M., Gong H., Zhang L., Cox H., Waigh T. A., Lu J. R., Curr. Op. Coll. Int. Sci. 2020, 45, 1–13; [Google Scholar]
- 10b. Du X., Zhou J., Shi J., Xu B., Chem. Rev. 2015, 115, 13165–13307. [DOI] [PMC free article] [PubMed] [Google Scholar]
- 11.
- 11a. Draper E. R., Adams D. J., Langmuir 2019, 35, 6506–6521; [DOI] [PubMed] [Google Scholar]
- 11b. Martin A. D., Thordarson P., J. Mater. Chem. B 2020, 8, 863–877. [DOI] [PubMed] [Google Scholar]
- 12.
- 12a. Makam P., Gazit E., Chem. Soc. Rev. 2018, 47, 3406–3420; [DOI] [PMC free article] [PubMed] [Google Scholar]
- 12b. Mahler A., Reches M., Rechter M., Cohen S., Gazit E., Adv. Mater. 2006, 18, 1365–1370; [Google Scholar]
- 12c. Diaferia C., Morelli G., Accardo A., J. Mater. Chem. B 2019, 7, 5142–5155. [DOI] [PubMed] [Google Scholar]
- 13. Jayawarna V., Richardson S. M., Hirst A. R., Hodson N. W., Saiani A., Gough J. E., Ulijn R. V., Acta Biomater. 2009, 5, 934–943. [DOI] [PubMed] [Google Scholar]
- 14. Chen L., Pont G., Morris K., Lotze G., Squires A., Serpell L. C., Adams D. J., Chem. Commun. 2011, 47, 12071–12073. [DOI] [PubMed] [Google Scholar]
- 15.
- 15a. Jayawarna V., Ali M., Jowitt T. A., Miller A. F., Saiani A., Gough J. E., Ulijn R. V., Adv. Mater. 2006, 18, 611–614; [Google Scholar]
- 15b. Ryan D. M., Nilsson B. L., Poly. Chem. 2012, 3, 18–33. [Google Scholar]
- 16. Scott G., Roy S., Abul-Haija Y. M., Fleming S., Bai S., Ulijn R. V., Langmuir 2013, 29, 14321–14327. [DOI] [PubMed] [Google Scholar]
- 17. Ryu J., Kim S.-W., Kang K., Park C. B., Adv. Mater. 2010, 22, 5537–5541. [DOI] [PubMed] [Google Scholar]
- 18. Raeburn J., Mendoza-Cuenca C., Cattoz B. N., Little M. A., Terry A. E., Zamith Cardoso A., Griffiths P. C., Adams D. J., Soft Matter 2015, 11, 927–935. [DOI] [PubMed] [Google Scholar]
- 19. Dudukovic N. A., Zukoski C. F., Langmuir 2014, 30, 4493–4500. [DOI] [PubMed] [Google Scholar]
- 20. Sharonov A., Hochstrasser R. M., Proc. Natl. Acad. Sci. USA 2006, 103, 18911. [DOI] [PMC free article] [PubMed] [Google Scholar]
- 21. Pujals S., Tao K., Terradellas A., Gazit E., Albertazzi L., Chem. Commun. 2017, 53, 7294–7297. [DOI] [PMC free article] [PubMed] [Google Scholar]
- 22. Branco M. C., Pochan D. J., Wagner N. J., Schneider J. P., Biomaterials 2009, 30, 1339–1347. [DOI] [PMC free article] [PubMed] [Google Scholar]
- 23. Wallace M., Adams D. J., Iggo J. A., Soft Matter 2013, 9, 5483–5491. [Google Scholar]
- 24. Sutton S., Campbell N. L., Cooper A. I., Kirkland M., Frith W. J., Adams D. J., Langmuir 2009, 25, 10285–10291. [DOI] [PubMed] [Google Scholar]
- 25. Ozbas B., Rajagopal K., Schneider J. P., Pochan D. J., Phys. Rev. Lett. 2004, 93, 268106. [DOI] [PubMed] [Google Scholar]
- 26.
- 26a. Aufderhorst-Roberts A., Frith W. J., Kirkland M., Donald A. M., Langmuir 2014, 30, 4483–4492; [DOI] [PubMed] [Google Scholar]
- 26b. Ozbas B., Rajagopal K., Schneider J. P., Pochan D. J., Phys. Rev. Lett. 2004, 93, 268106. [DOI] [PubMed] [Google Scholar]
Associated Data
This section collects any data citations, data availability statements, or supplementary materials included in this article.
Supplementary Materials
As a service to our authors and readers, this journal provides supporting information supplied by the authors. Such materials are peer reviewed and may be re‐organized for online delivery, but are not copy‐edited or typeset. Technical support issues arising from supporting information (other than missing files) should be addressed to the authors.
Supplementary


