

Abstract
In this study, we investigated whether local intramyocardial GATA4 overexpression affects the left ventricular (LV) remodelling process and the importance of phosphorylation at serine 105 (S105) for the actions of GATA4 in an angiotensin II (AngII)‐induced hypertension rat model. Adenoviral constructs overexpressing wild‐type GATA4 or GATA4 mutated at S105 were delivered into the anterior LV free wall. AngII (33.3 µg/kg/h) was administered via subcutaneously implanted minipumps. Cardiac function and structure were examined by echocardiography, followed by histological immunostainings of LV sections and gene expression measurements by RT‐qPCR. The effects of GATA4 on cultured neonatal rat ventricular fibroblasts were evaluated. In AngII‐induced hypertension, GATA4 overexpression repressed fibrotic gene expression, reversed the hypertrophic adult‐to‐foetal isoform switch of myofibrillar genes and prevented apoptosis, whereas histological fibrosis was not affected. Overexpression of GATA4 mutated at S105 resulted in LV chamber dilatation, cardiac dysfunction and had minor effects on expression of myocardial remodelling genes. Fibrotic gene expression in cardiac fibroblasts was differently affected by overexpression of wild‐type or mutated GATA4. Our results indicate that GATA4 reduces AngII‐induced responses by interfering with pro‐fibrotic and hypertrophic gene expressions. GATA4 actions on LV remodelling and fibroblasts are dependent on phosphorylation site S105.
Keywords: angiotensin II, fibrosis, hypertension, myocardial remodelling, transcription factor
1. INTRODUCTION
Cardiovascular diseases are the prevalent cause of mortality in Europe 1 and the United States, 2 and high blood pressure is the strongest risk factor for cardiovascular diseases and heart failure. 1 , 2 Cardiac remodelling secondary to pressure overload and ischaemic injury is attributed to mechanical stress and to neuroendocrine and local factors, such as angiotensin II (AngII), catecholamines, aldosterone and transforming growth factor‐β (TGFβ). 3 , 4 , 5 , 6 Pathological myocardial remodelling is characterized by excessive extracellular matrix (ECM) deposition along with hypertrophic growth of cardiomyocytes (CMs). 7 , 8 , 9 , 10 Cardiac fibroblasts (CFs) maintain a quiescent phenotype under physiological conditions and can be activated in response to various types of cardiac stress, becoming the drivers of ECM remodelling and the fibrotic response. 6 , 9 Initially, ECM remodelling acts to preserve heart function and integrity, although it can gradually become excessive and maladaptive, progressing into cardiac dysfunction and heart failure. 7 , 8 , 9 , 10
A hallmark of hypertension is overstimulation of the renin‐angiotensin system (RAS) through AngII/AngII type 1 receptor (AT1‐R) axis, resulting in augmented blood pressure and elevated vascular/interstitial fibrosis. AngII induces hypertrophic growth in CMs and hyperplasia in CFs through distinct AT1‐R‐associated pathway activation. 3 , 11 It is now well‐established that AngII/AT1‐R activation mediates organ fibrosis and promotes TGFβ1 expression. 3 , 4 , 5 , 12 In agreement with this view, studies conducted in animal models of hypertension have shown that AngII/AT1‐R‐elicited fibrosis is suppressed by treatment with AT1‐R blockers. 13 , 14 , 15 Moreover, AT1‐R blockers losartan and telmisartan have been demonstrated to reduce macrophage infiltration and CF transdifferentiation to myofibroblasts (MF) through inhibiting AngII‐ and TGFβ‐induced phosphorylation of extracellular signal‐regulated kinase‐1/2 (ERK1/2). 12 , 16 Pharmacological interventions with angiotensin converting enzyme (ACE) inhibitors or AT1‐R blockers have also been shown to efficiently limit the progression of heart failure through regressing fibrosis, underscoring the relevance of AngII in the development of cardiac fibrosis. Even though the pro‐fibrotic effects of AngII have been extensively reported, the molecular mechanisms for AngII‐induced myocardial remodelling and fibrosis have not been fully elucidated.
The zinc finger transcription factor GATA4 is essential for cardiac development and plays a critical role in the growth and survival response of CMs. 17 , 18 , 19 Interestingly, GATA4 activity is enhanced under cardiac stress 20 , 21 , 22 through phosphorylation at serine 105 (S105) residue by ERK1/2 and p38 mitogen‐activated protein kinases (MAPKs) acting downstream of AT1‐R. 17 , 19 , 23 , 24 Studies on loss of GATA4 activity have highlighted its importance for cardiac remodelling, including the hypertrophic and fibrotic responses to stress in the adult hearts. 25 , 26 Most of the studies involving the actions of GATA4 in adult heart have focused on hypertrophic cell growth and survival pathways in CMs, even though GATA4 is expressed also in CFs and pericytes, 27 and has been suggested to repress fibrosis through down‐regulation of transcriptional regulator Snai1. 28 However, the role of GATA4 in mediating the fibrotic response to cardiac stress and its function in cardiac fibroblasts remain poorly understood. In the present study, we investigated whether GATA4 overexpression influences the left ventricular (LV) remodelling process and fibrosis in response to AngII. Furthermore, we studied the role of phosphorylation site S105 for the actions of GATA4 in the adult heart during the cardiac stress in experimental models of AngII‐induced hypertension and myocardial infarction (MI) in rats.
2. MATERIALS AND METHODS
2.1. Animal models
Male 2‐month‐old Sprague Dawley rats (250 to 300 g) were obtained from the colony of the Center of Experimental Animals at the University of Oulu, Finland. All animal procedures were approved by the Animal Use and Care Committee of the University of Oulu and the Provincial Government of Southern Finland Department of Social Affairs and Health and conform to the guidelines from Directive 2010/63/EU of the European Parliament on the protection of animals used for scientific purposes. The study was conducted in accordance with the Basic & Clinical Pharmacology & Toxicology policy for experimental and clinical studies. 29
2.2. Angiotensin II‐induced hypertension, myocardial infarction and adenoviral gene transfer
The rats were anaesthetized, and operations were performed as previously described. 30 , 31 AngII (33.3 µg/kg/h) was administered via the subcutaneously implanted minipumps (Alzet model 2002, DURECT Corporation, Cupertino, CA, USA) for one and two weeks. 31 , 32 In this model of experimental hypertension, administration of AngII increases mean arterial pressure within 3 hour and remains significantly elevated throughout the two‐week follow‐up period. 31 In addition to the increased ventricular wall loading subsequent to hypertension, AngII infusion also induces CM hypertrophic growth via direct AT1‐R activation. 3 , 4
In a separate series of experiments, the left anterior descending coronary artery (LAD) was permanently ligated to generate experimental MI following adenoviral gene transfer into rat hearts. 30 The sham‐operated rats underwent the same surgical procedure without LAD ligation. The animals were followed for three days, and one and two weeks after the intervention.
For gain‐of‐function studies, adenovirus type 1 (Ad1) containing the GATA4 coding region 17 or recombinant replication‐deficient type 5 adenovirus (Ad5) containing GATA4‐S105A mutated construct 18 (1 × 10⁹ pfu and 2 × 10⁹ pfu, respectively, in 100 µL) were injected directly into the LV anterior wall following AngII minipump implantation or sham/LAD ligation intervention within the same surgical procedure. A precision Hamilton syringe was inserted intramurally (apex to base direction) at one site and slowly withdrawn while releasing the adenovirus solution. 33 Ad5 expressing nuclear localization signal (nls)—β‐lactosidase LacZ, was used as control constructs (at Ad1‐GATA4 or Ad5‐GATA4‐S105A experiments in matched doses) and underwent the same administration procedure. After the operations, anaesthesia was partially antagonized with atipamezole hydrochloride (Antisedan, 1.5 mg/kg, intraperitoneal (i.p.)) and rats were hydrated with physiological saline solution (5 mL, subcutaneous (s.c.)). For postoperative analgesia, buprenorphine hydrochloride (Vetergesic, 0.05‐0.2 mg/kg, s.c.) was administered. Figure 1 depicts the timelines for the different treatments and measurements performed in both experimental animal models here used.
FIGURE 1.

Timeline for the in vivo experiments. (A) Angiotensin II‐induced hypertension. Rats were implanted with osmotic minipumps loaded with AngII (33.3 µg/kg/h) and adenoviral constructs overexpressing GATA4 or GATA4‐S105A (1 × 10⁹ pfu and 2 × 10⁹ pfu, respectively, in 100 µL) or dose‐matched LacZ adenoviral constructs were injected into the LV anterior free wall, generating four adenovirus treatment groups followed for 7 and 14 d. (b) Myocardial infarction. LAD ligation or a sham intervention was performed in rats at day 0, followed by injection of adenoviral constructs overexpressing GATA4‐S105A (2 × 10⁹ pfu in 100 µL) or dose‐matched LacZ adenoviral constructs within the same surgical procedure. Due to different virus dose, the control LacZ groups are not comparable to each other. The groups were studied at 3, 7 or 14 d. At the end of experiments, the cardiac function and structure were analysed by echocardiography and the hearts were excised and processed for further histological and biochemical analyses
2.3. Echocardiography
At the end of the experiments, transthoracic echocardiography was performed with the Vevo2100 high‐frequency high‐resolution linear array ultrasound system (FujiFilm VisualSonics Inc, Toronto, Canada) and MS‐250 transducer (13‐24 MHz, axial resolution 75 µm, lateral resolution 165 µm) under ketamine (50 mg/kg, i.p.) and xylazine (10 mg/kg, i.p.) anaesthesia, as described previously. 33 Morphology of the LV, and systolic and diastolic functions were measured from the two‐dimensional imaging M‐mode recordings. After echocardiography, the animals were killed and the hearts were excised and processed for histologic and biochemical analysis.
2.4. Histology
The apical transversal mid‐section of the heart was fixed in 10% buffered formalin solution and then embedded in paraffin. Five µm sections were deparaffinized in xylene and dehydrated in graded ethanol series and specifically stained as described below. The fibrotic tissue in the LVs was stained by Masson's trichrome technique allowing for quantification of infarct size in MI model and total fibrosis. 34 The amount of apoptotic cells was determined by terminal deoxynucleotidyl transferase‐mediated dUTP nick end labelling (TUNEL) method, according to the manufacturer's protocol (ApopTag Red in situ apoptosis detection kit, Chemicon International, CA, USA). 30 Primary antibodies were used to label proliferating cells (anti‐Ki‐67, M7248, Millipore, Darmstadt, Germany), angiogenesis (von Willebrand factor, vWF, AB7356, Abcam, Cambridge, UK) and c‐kit positive cells (anti‐c‐kit, sc‐168, Santa Cruz, CA, USA). The immunohistochemical detections were visualized with AT2 Aperio scanner (Leica Biosystems, CA, USA) at the Northern Finland Borealis Biobank (Oulu University Hospital, Finland). For double staining, epitope retrieval was done by heating the sections in a microwave oven in tri‐sodium citrate solution (pH 6.0) for 15 minutes and allowed to cool down at room temperature for 30 minutes. Sections were blocked in 0.2% horse serum, 2% bovine serum albumin and 0.2% Triton in PBS for 30 minutes and incubated with primary antibodies in a humidified chamber at RT for 30 minutes and at 4°C overnight. 34 The sections were co‐incubated with primary antibodies for GATA4 (sc‐9053, Santa Cruz), P4H (prolyl‐4‐hydroxylase, MAB2073, Millipore), αAct (sarcomeric α‐actinin, A7811, Sigma‐Aldrich, MO, USA) or Acta2 (smooth muscle actin, AB5694, Abcam). For visualization anti‐rabbit CY3 (611‐104‐122, Rockland, PA, USA), biotinylated antimouse (BA‐2001, Vector laboratories, CA, USA) and DAPI, for nuclei (D9542, Sigma‐Aldrich), were used. Images were generated with the digital slide scanner 3DHISTECH Pannoramic 250 FLASH II at the Genome Biology Unit (Research Programs Unit, Faculty of Medicine, University of Helsinki, Biocenter Finland, Finland) and the Institute of Biotechnology (University of Helsinki, Finland).
2.5. Primary neonatal rat ventricular fibroblasts culture
Neonatal rat ventricular fibroblasts (NRVFs) were isolated from 2‐ to 4‐day‐old Sprague Dawley rats using the collagenase dissociation method, as described previously. 22 The animals were killed by decapitation, the hearts were excised, and the ventricle chambers were separated and processed towards NRVFs isolation. Myocyte and non‐myocyte cells were separated by differential attachment preplating, where the attached fraction is enriched with fibroblasts. NRVFs were passaged once and seeded for the experiment into multi‐well plates at density 0.75‐1 × 10⁵ cell/cm2. The cells were maintained 18‐24 hour in Dulbecco's modified Eagle's medium (DMEM)/F‐12 supplemented with 10% foetal bovine serum and 100 IU/mL penicillin‐streptomycin. The next day, NRVFs were transfected with Ad1‐GATA4 or Ad5‐GATA4‐S105A and Ad5‐nls‐LacZ in serum‐free conditions. Briefly, the cells were washed and switched to culture serum‐free media (CSFM), containing DMEM/F‐12 supplemented with 2.5 mg/mL bovine serum albumin, 1 μM insulin, 2.8 mM sodium pyruvate, 5.64 μg/mL transferrin, 1 nM T3 and 100 IU/mL penicillin‐streptomycin (all the cell culture medium components were purchased from Sigma‐Aldrich). Adenoviruses were added to the cells at the appropriate concentrations to achieve 2 and 4 multiplicity of infection units (MOI) and incubated at 37°C and 5% CO2. The NRVFs were maintained in CSFM, which was replaced every 24 hour. After 48 hour, the cells were washed twice with ice‐cold PBS and quickly frozen at −70°C.
2.6. Real‐time quantitative PCR
The basal transversal mid‐section of the LV was dissected and snap frozen in liquid nitrogen. Next, the tissues were processed for total RNA isolation by the guanidine thiocyanate‐CsCl method. 33 The cDNA was synthesized using the RNA isolated from the tissue homogenates as template, using Transcriptor First‐Strand cDNA Synthesis Kit (Roche Diagnostics, Mannheim, Germany) according to the manufacturer's instructions. Isolation of RNA from NRVFs was achieved by using the EZNA® Total RNA Kit I (Omega Bio‐Tek, Norcross, GA, USA) according to the manufacturer's instructions. Real‐time quantitative polymerase chain reaction (RT‐qPCR) with FastStart Universal Probe Master (Roche, Basel, Switzerland) was used for RNA expression analysis on an ABI 7300 sequence detection system (Applied Biosystems, Life Technologies, MA, USA), as previously described. 35 The primers and fluorogenic probes used for RT‐qPCR were all purchased for Sigma‐Aldrich and are listed in Table S1. The results were normalized to GAPDH mRNA quantified from the same samples and then normalized to the LacZ control group.
2.7. Western blotting
The basal transversal mid‐section of the LV was dissected and snap frozen in liquid nitrogen. Next, the tissues were processed for total and nuclear protein extractions, as previously described. 30 , 33 Equal amounts of protein were loaded onto 10% SDS‐PAGE and transferred to nitrocellulose membranes. Primary antibodies against total GATA4 (sc‐9053, Santa Cruz), phosphorylated GATA4 at S105 (44‐948, Invitrogen, CA, USA) and Lamin B (sc‐6216, Santa Cruz) were used according to the manufacturers’ instructions and detected with fluorescent secondary antibodies: anti‐rabbit and antimouse IgG Alexa Fluor 680 (A21076 and A21058, Invitrogen), anti‐rabbit IgG IRDye 800 (926‐32211, LI‐COR Biosciences, Lincoln, NE, USA) and anti‐goat IRDye 700 (605‐730‐125, Rockland). Protein levels were visualized with Odyssey Fc imaging system (LI‐COR Biosciences).
2.8. Statistics
The values are represented as mean and standard deviation. Student's t test was used to compare GATA4 or GATA4‐S105A groups to its dose‐matched LacZ control. The different LacZ control groups are not comparable to each other due to the different doses. Welch's corrected t test was used when the variances were unequal between the groups. If the values were not normally distributed, the data were represented as median and interquartile range, and Mann‐Whitney U test was used to comparisons between two groups. For multiple comparisons, statistical significance was evaluated by one‐way ANOVA followed by a least significant difference (LSD) post hoc test. Alternatively, Kruskal‐Wallis test was used for multiple comparisons when the variances were unequal between groups. Data were analysed using GraphPad Prism v.7.02 (GraphPad Software Inc, CA, USA). A P‐value < .05 was accepted as statistically significant.
3. RESULTS
3.1. GATA4 is localized into cardiac myocytes, fibroblasts and myofibroblasts by intramyocardial adenoviral gene delivery in vivo
To study the effect of GATA4 overexpression on AngII‐induced adaptive stress response, we used a gain‐of‐function approach by which adenoviral constructs were locally injected into the LV. To confirm GATA4 overexpression in LVs, we measured the mRNA levels by RT‐qPCR. As shown in Figure 2A, GATA4 mRNA levels were significantly increased at one week (4.7‐fold, P = .017) and remained elevated at two weeks. The protein levels of both total GATA4 and GATA4 phosphorylated at S105 were also increased at one week (Figure 2B). The efficiency and localization of GATA4 gene delivery was further determined by immunofluorescence double staining with αAct marker for CMs, whereas P4H and Acta2 were used to detect fibroblasts and activated fibroblasts, respectively. GATA4 co‐localized mostly with αAct (Figure 2C) but was also detected in cells expressing P4H (Figure 2D) and Acta2 (Figure 2E): approximately 87% of GATA4‐positive cells were myocytes, 12% fibroblasts and 10% activated fibroblasts.
FIGURE 2.

GATA4 overexpression by intramyocardial adenoviral gene delivery into the LV in AngII‐induced hypertension in rats. (A) RT‐qPCR was used to quantify the mRNA levels of GATA4 at 1 and 2 wks. The bars represent average values + SD (n = 6‐8/group). * P ≤ .05, ** P ≤ .01. (B) Protein levels were examined by immunoblotting for GATA4, GATA4 phosphorylation at S105 (GATA4‐pS105) and Lamin B. Figure shows a representative Western blot at 2 wks (full blot images in Fig. S1). (C‐E) Immunofluorescent study of GATA4 (red) for cellular localization using specific cell markers for myocytes (αAct, C), fibroblasts (P4H, D) and myofibroblasts (Acta2, E). Representative LV histological sections are shown, white arrows indicate co‐localization with the specific cell markers (LacZ control group representative images are shown in Fig. S2). The scale bars represent 25 µm
3.2. GATA4 modulates the AngII‐induced fibrotic response
To evaluate the potential role of GATA4 in modulating AngII‐induced fibrotic response, we quantified Masson's trichrome staining of LV transversal slices. The degree of fibrosis analysed by Masson's trichrome staining was not significantly altered (Figure 3A, B). Next, the effect of GATA4 overexpression on AngII‐induced activation of fibrotic genes was measured by RT‐qPCR (Figure 3C‐K). At two weeks, we detected significant changes in the expression of pro‐fibrotic genes: fibronectin (FN) 1, collagens (Col) 1a1 and 3a1, TGFβ1, metalloproteinase (MMP) 2 and MMP9 expressions were all significantly reduced more than 50% (Figure 3C‐H). Furthermore, the expression of tissue inhibitor metalloproteinase type 1 (TIMP1) was strongly repressed (80%, P = .021; Figure 3I). Also, fibroblast growth factor type 2 (FGF2), a promoter of cardiac hypertrophy and fibrosis through MAPK signalling, 36 was down‐regulated (Figure 3J). The phenylephrine‐induced complex‐1 (PEX1) transcription factor has been demonstrated to collaborate with GATA4 to promote the hypertrophic response in CMs 37 , 38 and to possess pro‐fibrotic actions through promoting MMP9 expression. 34 Interestingly, PEX1 mRNA levels were significantly down‐regulated (39.7%, P < .000; Figure 3K) in left ventricles of AngII‐induced hypertensive rats overexpressing GATA4 when compared to the LacZ group.
FIGURE 3.

The effect of GATA4 overexpression on AngII‐induced fibrosis. (A and B) Masson's trichrome staining was used to quantify the percentage of fibrosis in LVs at 2 wks (A, n = 7‐8/group). The results are average values ± SD. Representative images (B) are shown where the collagenous fibres are stained blue. The scale bars represent 75 µm. (C‐K) The mRNA levels of fibrosis‐associated genes FN1, Col1a1, Col3a1, TGFβ, MMP2, MMP9, TIMP1, FGF2 and PEX1 at 1 and 2 wks were quantified by RT‐qPCR. The values were normalized to GAPDH and are expressed as relative to LacZ control groups (n = 6‐8/group). The results are represented as average + SD or median + interquartile range [FN1, 2 wks]. * P ≤ .05, ** P ≤ .01, *** P ≤ .005
3.3. GATA4 overexpression and AngII‐induced cardiac hypertrophic response
There is evidence demonstrating the role for GATA4 transcriptional control in CM hypertrophic growth. 18 , 20 , 22 , 39 , 40 , 41 , 42 Therefore, we measured the expression of genes associated with cardiac hypertrophy (Figure 4A‐I). In response to AngII, atrial natriuretic peptide (ANP) mRNA levels were significantly decreased (53.8%, P = .024, Figure 4A) by intramyocardial adenoviral GATA4 gene transfer. In addition, the α‐myosin heavy chain (MHC) to foetal isoform β‐MHC ratio was significantly increased (1.8‐fold, P = .044) at two weeks (Figure 4D‐F) by GATA4 overexpression, whereas cardiac α‐actin (Actc1) adult isoform expression was up‐regulated and cardiac‐to‐skeletal α‐actin ratio (Actc1/Acta1) was significantly higher (1.6‐fold, P = .015) at one week (Figure 4G‐I), thus showing that overexpression of GATA4 prevented the AngII‐induced adult‐to‐foetal isoform switch of these proteins.
FIGURE 4.

Analysis of hypertrophy‐associated genes in LVs at 1 and 2 wks after intramyocardial adenoviral GATA4 gene delivery. (A‐I) ANP, BNP, FGF1, αMHC, βMHC, Actc1 and Acta1 mRNA levels were quantified by RT‐qPCR. The mRNA values were normalized to GAPDH and are expressed as relative to LacZ control groups (n = 6‐8/group). The results are represented as average + SD or median + interquartile range [Actc1/Acta1 ratio, 1 wk]. *P ≤ .05, **P ≤ .01
3.4. GATA4 overexpression decreases apoptosis and prevents cell proliferation in the AngII‐induced hypertension
GATA4 is also a prosurvival factor 33 and has been reported to regulate cell survival through promoting the expression of anti‐apoptotic factor Bcl2. 27 , 43 Therefore, we examined histological sections from GATA4 overexpressed LVs in AngII‐induced hypertension for apoptotic cells using the terminal deoxynucleotidyl transferase‐mediated dUTP nick end labelling (TUNEL) method or proliferating cells with Ki‐67 cell cycle marker. A significantly lower number of TUNEL‐positive cells (Figure 5A, B) and Ki‐67 positive cells (Figure 5C, D) were observed in GATA4 overexpressing hearts compared to the LacZ control group at one week of starting AngII infusion. Although we did not address in detail the cell specificity, based on the cellular morphology observed in the histological stainings, the apoptotic and proliferating cells were mostly non‐myocytes, as reported also previously. 33 The cardioprotective role of GATA4 in adult rat heart after MI has been associated with angiogenesis, 33 but in AngII‐induced hypertension we did not detect any changes in the number of capillaries in GATA4 overexpressed LVs (Figure 5F).
FIGURE 5.

Effect of GATA4 overexpression on apoptosis, cell proliferation, stem cell‐like cells and angiogenesis in LVs of 2 wks AngII‐induced hypertension. Immunohistochemical staining for TUNEL‐positive cells was used to determine the number of apoptotic cells in LVs (A). Representative images are shown (B). Immunohistochemical staining against Ki‐67 was used to determine the effect on cellular proliferation (C), representative images are shown (D). (E) c‐kit antibody was used to quantify stem cell‐like cells. (F) Histological sections were stained with vWF to determine the number of capillaries. The whole LV was scanned, and positive cells were counted from high power fields (40×) selecting 6‐8 hotspots. The scale bars represent 100 µm. The results are represented as average + SD (n = 7‐8/group). * P ≤ .05
3.5. Overexpression of GATA4‐S105A was deleterious for cardiac structure and function
Echocardiography assessment showed that adenovirus‐mediated overexpression of GATA4 caused no change in the LV dimensions or function when compared to the LacZ control group in AngII‐induced hypertension within two weeks (Figure 6 and Table S2). In contrast, overexpressing GATA4 with a mutation at serine 105 to alanine (GATA4‐S105A) produced LV dysfunction, this being strongest at one week after the interventions (Figure 6 and Table S2). The dimension of the LV chamber was significantly enlarged in GATA4‐S105A overexpressing hearts compared to the LacZ group, as demonstrated by augmented LV internal diameter (Figure 6A) and thinner LV posterior wall in diastole (Figure 6B) and systole. Furthermore, the endocardial fractional area change (FAC), which provides an estimate of the area change within the LV between diastole and systole, was significantly decreased (Figure 6D). These structural changes were translated into impairment of the LV function, as shown by an increase of the LV volume (Figure 6E), and significantly worsened LV ejection fraction (EF, −25%, P = .009) and fractional shortening (FS, −30%, P = .009; Figure 6F, G). At 2 weeks, similar alterations in structural and functional parameters were still evident, even though the differences were more moderate (Table S2). Of note, the adenoviral dose required for GATA4 and GATA4‐S105A overexpressions (1 × 10⁹ pfu and 2 × 10⁹ pfu, respectively) to achieve the matched‐dose LacZ controls resulted in differences in baseline levels of echocardiographic parameters between LacZ control groups.
FIGURE 6.

Effect of GATA4 and GATA4‐S105A overexpression on cardiac function and structure in AngII‐induced hypertension in rats. (A‐G) Structural and functional parameters were analysed at 1 wk by echocardiography in rats overexpressing GATA4 or GATA4‐S105A and their dose‐matched LacZ control groups. Due to different virus dose, the control LacZ groups are not comparable to each other. The results are represented as average + SD or median + interquartile range [LVPW, GATA4‐S105 and LacZ control] (n = 7‐10/group). LVID = left ventricular internal diameter; LVPW = left ventricular posterior wall thickness; IVS = interventricular septum; FAC = fractional area change; LV vol. = left ventricular volume; LVEF = left ventricular ejection fraction; LVFS = left ventricular fractional shortening. * P ≤ .05, ** P ≤ .01, *** P ≤ .005
3.6. Effects of overexpression of GATA4‐S105A on cardiac gene expression in AngII‐induced hypertension
Since the functional effects of GATA4‐S105A overexpression in response to AngII were deleterious, we proceeded to evaluate the possible underlying cellular and genetic mechanisms. When mutated GATA4‐S105A adenoviral construct was locally injected into the heart, GATA4 mRNA levels were significantly augmented at one week (5.5‐fold, P < .001) and two weeks (2.0‐fold, P = .015; Figure 7A). Moreover, as anticipated, the amount of GATA4 phosphorylated at S105 did not increase after intramyocardial adenoviral delivery (Figure 7B). Quantification of TUNEL, Ki‐67 or Masson's trichrome stainings of LVs overexpressing GATA4‐S105A revealed no differences when compared to the LacZ control group (Figure 7C‐F). Furthermore, when the changes in gene expression were assessed by RT‐qPCR analysis, GATA4‐S105A overexpression provoked a different fibrotic gene expression pattern (Figure 8A‐I) from that induced with GATA4 overexpression (Figure 3C‐K). FN1 mRNA expression was significantly up‐regulated (2.3‐fold, P = .006) at one week of AngII infusion (Figure 8A), and slightly decreased mRNA levels were observed for Col1a1, Col3a1, TGFβ1, MMP2, MMP9 and PEX1 but these changes were not statistically significant (Figure 8B‐G). TIMP1 gene expression was significantly down‐regulated at one and two weeks (66%, P = .022; 55%, P = .015, respectively; Figure 8H), and FGF2 mRNA levels were also down‐regulated at one week (Figure 8I), similarly to GATA4 overexpressing animals (Figure 3I, J). Altogether, these results suggest that the expression of pro‐fibrotic genes depends on GATA4 S105 phosphorylation. The genes involved in the cardiac hypertrophic response, such as ANP, BNP and FGF1, were significantly up‐regulated at one week (Figure 8J‐L) as well as the mRNA levels of both adult and foetal isoforms of contractile proteins (Figure 8M‐R).
FIGURE 7.

Effect of GATA4‐S105A overexpression on fibrosis, apoptosis and cell proliferation in LVs of 1 wk AngII‐induced hypertension. Overexpression of GATA4 by local adenoviral gene transfer at 1 and 2 wks was confirmed by RT‐qPCR (A) and Western blotting (B). Representative blot of 1 wk samples is shown (full blot images in Fig. S3). Fibrosis was quantified by Masson's trichrome staining (C), representative images from LV histological sections are shown (D). The scale bar represents 75 µm. (E) The number of apoptotic cells was quantified from TUNEL staining. (F) Immunohistochemical staining against Ki‐67 was used to determine number of proliferating cells in LV histological sections. The results are represented as average ± SD (n = 6‐7/group). * P ≤ .05, *** P ≤ .005
FIGURE 8.

Analysis of gene expression in LVs at 1 and 2 wks after GATA4‐S105A gene delivery in AngII‐induced hypertension. The mRNA levels of fibrosis‐associated genes (A‐I) and hypertrophic‐associated genes (J–R) were quantified by RT‐qPCR. The expression values were normalized to GAPDH and are expressed as relative to LacZ control groups (n = 6‐8/group). The results are represented as average + SD or median + interquartile range [Col1a1, MMP9, FGF2, βMHC, Acta1 and Actc1/Acta1 ratio, 1 wk]. * P ≤ .05, ** P ≤ .01, *** P ≤ .005
3.7. Differential effects of GATA4 and GATA4‐S105A overexpression on isolated cardiac fibroblast
Since in vivo findings indicated that GATA4 S105 phosphorylation plays a role particularly in the modulation of the fibrotic response to Ang II, we next used isolated NRVFs to conduct gain‐of‐function studies by transfecting cells with wild‐type GATA4 and S105A mutated GATA4 adenoviral constructs as well as LacZ control. In these experiments, two different multiplicity infectious units (MOI) were used (2 MOI and 4 MOI). All NRVFs experiments were categorized into three groups based on the level of GATA4 overexpression achieved with GATA4 wild‐type construct. Transfections for 48 hours with the wild‐type GATA4 adenovirus construct resulted in 6‐fold and 16‐fold increase of GATA4 mRNA levels at 2 MOI and 73‐fold increase at 4 MOI (P < .001 in all; Figure 9A), the different expression levels with 2 MOI likely being related to the variability of cell density between experiments. Overexpression with mutated GATA4‐S105A construct increased GATA4 mRNA significantly at 4 MOI (39‐fold, P < .001; Figure 9A). Overexpression of GATA4 adenovirus for 48 hours resulted in small increases in FN1, Col1a1 and MMP2 mRNA levels (Figure 9B, C and F), while the mRNA levels of MMP9 decreased significantly (Figure 9G). No changes in mRNA levels of Col3a1, TGFβ1, TIMP, FGF2 and PEX1 were noted with wild‐type GATA4 overexpression (Figure 9D, E, H‐J). Interestingly, GATA4‐S105A overexpression provoked significantly lower mRNA levels of FN1, Col1a1, Col3a1, MMP2, TIMP1, FGF2 and PEX1 when compared to the wild‐type GATA4 adenovirus construct or the LacZ control group (Figure 9B‐D, F and H‐J). Taken together, these results show that the pro‐fibrotic gene expression also in isolated cardiac fibroblasts depends on GATA4 S105 phosphorylation.
FIGURE 9.

Assessment of fibrosis‐associated genes expressions in NRVFs after GATA4 and GATA4‐S105A adenovirus‐mediated overexpression for 48 hrs. The experiments are grouped into 3 sets according to the adenovirus concentration: 2 MOI (+; ++) and 4 MOI (+++). GATA4 overexpression (A) and the mRNA levels of fibrotic genes FN1, Col1a1, Col3a1, TGFβ1, MMP2, MMP9, TIMP1, FGF2 and PEX1 (B‐J) were quantified by RT‐qPCR. The expression values were normalized to GAPDH and are expressed as relative to LacZ control groups (n = 3‐4/group). The results are represented as average + SD. * P ≤ .05, ** P ≤ .01, *** P ≤ .005 vs LacZ. # P ≤ .05, ## P ≤ .01, ### P ≤ .005 vs GATA4
3.8. GATA4‐S105A overexpression by intramyocardial adenoviral gene delivery failed to rescue the infarcted heart
Previously, we have reported that GATA4 adenoviral gene delivery restores cardiac function, as shown by improved LV EF and FS, in the LAD ligation experimental model of MI through reduced infarct size, increased number of capillaries and stem‐like cells, and reduced apoptosis. 33 Therefore, in separate series of experiments, we also explored the effects of GATA4‐S105A overexpression on cardiac function and structure after MI in rats. Overexpression of mutated GATA4‐S105A at three days, one week and two weeks after local LV gene transfer in the sham‐operated animals resulted in significantly elevated GATA4 mRNA levels throughout the follow‐up period (at three days, 14.8‐fold, P = .005; Figure 10A). In LVs of infarcted hearts, GATA4 mRNA levels were elevated at three days compared to the LacZ controls (11.8‐fold, P = .074), while no significant changes were seen at one and two weeks (Figure 10B). Echocardiography evaluation revealed no effects of GATA4‐S105A overexpression on cardiac structure and function neither in sham nor in infarcted hearts (Figure 10B‐E and Table S3). Accordingly, immunohistological examinations showed no changes in GATA4‐S105A‐treated hearts regarding the number of capillaries, and c‐kit‐, Ki‐67‐, TUNEL‐positive cells or Masson's staining quantification of fibrosis (Figure 10F‐I). Importantly, the infarct size was not significantly different in infarcted hearts overexpressing GATA4‐S105A when compared to the LacZ control group (Figure 10J).
FIGURE 10.

The effects of GATA4‐S105A overexpression by intramyocardial gene delivery after myocardial infarction in rats. (A) RT‐qPCR quantification of GATA4 mRNA levels in LVs of sham‐operated and MI animals at 3 d, 1 and 2 wks. The values were normalized to GAPDH and are expressed as relative to sham LacZ control groups at each time point. The bars represent average values + SD (n = 5‐8/group). * P ≤ .05, ** P ≤ .01, *** P ≤ .005 Sham GATA4‐S105A compared to LacZ group and # P ≤ .05 MI GATA4‐S105A compared to LacZ. (B‐E) Echocardiographic measurements were performed at 2 wks after infarction and gene transfer. LVEF = left ventricular ejection fraction; LVFS = left ventricular fractional shortening; LVPW = left ventricular posterior wall thickness; LVID = left ventricular internal diameter. (F‐I) Immunohistochemistry studies for apoptosis (TUNEL, F), c‐kit‐positive cells (G), fibrosis (Masson's trichrome, H) and angiogenesis (vWF, I) from LV histological sections at 2 wks after MI and injection of the adenoviral constructs. (J) The infarct area was measured from 3 d and 2 wks histological LV sections stained with Masson's trichrome. The results are represented as average ± SD (n = 5‐8/group)
4. DISCUSSION
In this study, we showed that GATA4 gain‐of‐function in AngII‐induced hypertension in rats modulates the left ventricular remodelling by altering the expression of pro‐fibrotic and hypertrophic genes as well as by decreasing apoptosis and cell proliferation. Myocardial GATA4 overexpression alone did not have any effects on cardiac function or structure, but loss of GATA4 S105 phosphorylation in AngII‐induced hypertension caused LV dilatation and thinning of the walls, resulting in eccentric LV hypertrophy and decompensated heart function. Furthermore, GATA4‐S105A overexpression had minor or no effect on the pro‐fibrotic gene expression, apoptosis or cell proliferation in LVs in response to AngII‐induced pressure overload. Interestingly, GATA4 overexpression had also almost no effect on expression of fibrotic genes in isolated cardiac fibroblasts, but loss of S105 phosphorylation site decreased the expression of ECM genes essential for left ventricular remodelling. Finally, we observed that intramyocardial adenovirus‐mediated gene transfer of GATA4‐S105A in rats did not reproduce the cardioprotective effects of GATA4 after MI, as reported earlier. 33 Collectively, our findings highlight the importance of phosphorylation site S105 for GATA4 transcriptional activity and cardioprotective effects in experimental models of hypertension and MI in the adult rat heart (Figure 11).
FIGURE 11.
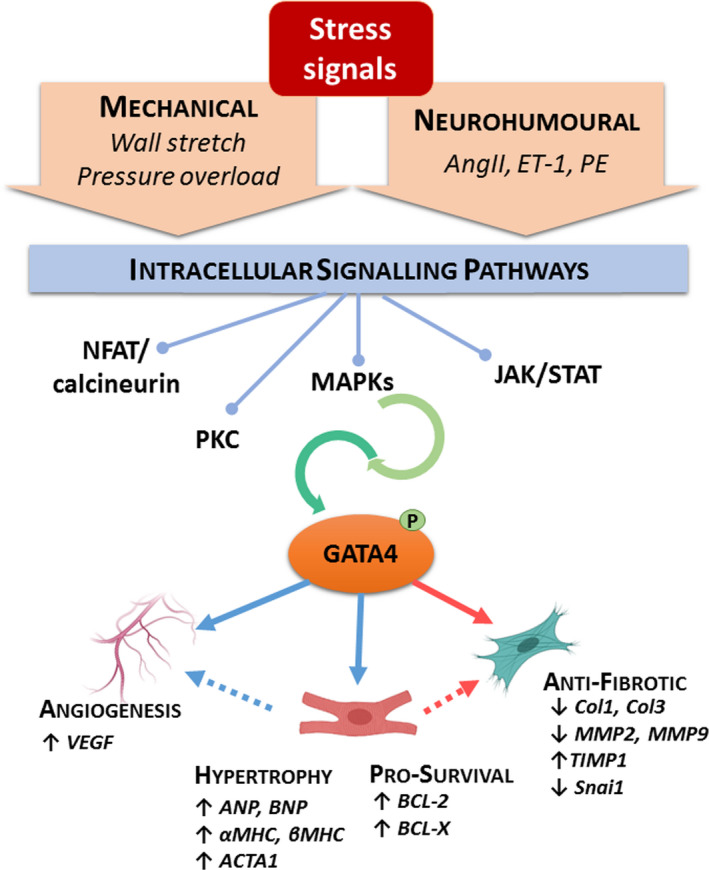
Schematic illustration of GATA4 actions induced upon cardiac stress. Stress signals activate intracellular signalling cascades that lead to activation of GATA4 through post‐translational modifications, such as phosphorylation at serine 105. GATA4 then contributes to the adaptive response of the myocardium through modulation of genes involved in angiogenesis, hypertrophic growth, cell survival and the fibrotic process. ACTA1 = Skeletal muscle actin, alpha 1; AngII = angiotensin II; ANP = atrial natriuretic peptide; BCL = B‐cell lymphoma; BNP = B‐type natriuretic peptide; Col = collagen; ET‐1 = endothelin‐1; JAK/STAT = janus kinase/signal transducer and activator of transcription; MAPKs = mitogen‐activated protein kinases; MHC = myosin heavy chain; MMP = metalloproteinase; NFAT = nuclear factor of activated T cells; PE = phenylephrine; PKC = protein kinase C; TIMP = tissue inhibitor metalloproteinase; Snai1 = Snail family transcriptional repressor 1; VEGF = vascular endothelial growth factor
The direct local injection of adenovirus constructs into the LV used in this study has previously been documented as an efficient cardiac‐specific approach of gene delivery. 30 , 32 , 33 , 34 , 35 , 44 , 45 , 46 This protocol targets elevated expression of the transgene into the LV without affecting other organs and thereby provides a precise approach to study the short‐term effects of the selected transgene, thereby mimicking pharmacotherapy approaches. Delivery of adenoviral constructs by LV intramyocardial injection, however, also limits the amount of the exogenous gene expression to a portion of cells surrounding the injections area in the myocardium. 30 , 32 , 33 , 34 , 35 , 44 , 45 , 46 Moreover, since we analysed gene expression of total LV RNA, the effects observed by overexpressing GATA4 and S105 mutated GATA4 reflect changes both in infected and non‐infected cells as well as direct and indirect effects of gene delivery in multiple cardiac cell types. Consequently, since GATA4 was mostly overexpressed in CMs in the adult heart, the changes in cardiac gene expression may also be due to the paracrine effect of GATA4 overexpression in cardiomyocytes.
Previous studies have demonstrated increased cardiac fibrosis consequent to loss of GATA4, along with elevated apoptosis and compromised hypertrophic response to transverse aortic constriction (TAC)‐induced pressure overload. 25 , 39 Furthermore, van Berlo and colleagues 47 reported LV dilatation in S105 mutant mice after TAC, along with increased fibrosis. In the present study, the local and short‐term effects of GATA4 or GATA4‐S105A overexpression on the LVs were studied during the initial response to AngII‐induced hypertension. GATA4 overexpression in LVs of normal adult rats blunted AngII‐induced fibrotic gene response through down‐regulation of ECM structural and matricellular proteins such as Col1a1, Col3a1, FN1 and TGFβ1, as well as metalloproteases MMP2 and MMP9, and their inhibitor TIMP1. Moreover, loss of S105 phosphorylation mostly prevented GATA4‐mediated down‐regulation of pro‐fibrotic genes. However, the extent of fibrosis was not altered by histological analysis. This might be related to the progressive increase in interstitial fibrosis typically observed in pressure overload type of cardiac stress, 48 and thus, changes in its composition might be observable later than within two weeks. When TAC was performed on S105 mutant mice, the expression of ECM associated genes was hindered although fibrosis percentage was increased. 47 When compared to TAC, AngII infusion more specifically activates signalling pathways that bring GATA4 activation through S105 phosphorylation. 17 , 19 , 23 , 24 AngII activates distinct MAPK signalling pathways in CMs and CFs by interaction with AT1‐R, and activation of ERK1/2 and p38 MAPKs in CMs have been indicated as upstream regulators of GATA4 DNA binding ability and transcriptional potency through phosphorylation of S105. 17 , 19 , 21 In addition, GATA4‐S105A knock‐in mice can no longer phosphorylate S105 and GATA4 transcriptional activity dependent on S105 is completely abolished from embryonic development to adulthood, 47 whereas in our present experiments, the GATA4‐S105 phosphorylation is only partly inhibited in GATA4‐S105A overexpressed hearts as baseline S105 phosphorylation of endogenous GATA4 can still exist. Therefore, loss of baseline effects of GATA4 transcription activity in GATA4‐S105A knock‐in mice might have exacerbated the impaired pressure overload response. However, it is noteworthy that in our in vivo experimental animal model of hypertension, it is not possible to distinguish between the direct AngII‐induced and the pressure load‐induced responses.
The studies conducted in isolated cardiac fibroblasts showed that overexpression of GATA4 had only a modest effect on the expression of pro‐fibrotic genes. In contrast, GATA4‐S105A overexpression in NRVFs provoked a strong down‐regulation of FN1, Col1a1, Col3a1, MMP2, MMP9, TIMP1, FGF2 and PEX1 gene expressions. These results clearly show the differential effects of GATA4 on fibrotic gene expression due to GATA4 loss of S105 phosphorylation, suggesting a regulatory role for GATA4 in ECM gene expression in cardiac fibroblasts. However, it must be noted that isolated cell experiments cannot fully reproduce the intact myocardium environment, where cell‐to‐cell and the ECM cells communications are present. Nevertheless, the importance of phosphorylation at S105 for GATA4 modulation of pro‐fibrotic gene expression was observed both in vivo in the adult rat heart and in the isolated neonatal rat cardiac fibroblasts.
The most prominent actions of GATA4 during LV remodelling involve modulation of CM growth. GATA4 directly activates the expression of hypertrophic gene response such as ANP, BNP, β‐MHC, α‐MHC and Acta1. 24 , 41 , 49 , 50 The hypertrophic programme drives CM growth predominantly in width, resulting in LV concentric hypertrophy. In our present study, GATA4 did not promote the hypertrophic gene programme in the AngII‐induced hypertension. It is likely that existing high levels of GATA4 activity in response to AngII infusion 24 might be accountable for the negligible effect of further increasing GATA4. Intriguingly, GATA4‐S105A overexpression steered AngII‐induced concentric hypertrophy towards deleterious eccentric LV hypertrophy, which led to impaired cardiac function. LV dilatation has been linked to elevated MMPs in the late stages of post‐MI and pressure overload remodelling. 7 Likewise, increased MMP9 activity has been associated to the transitional phase from compensatory response to heart failure in hypertensive patients. 51 Since TIMP1 expression was strongly suppressed both in isolated CFs and in AngII‐induced hypertension in vivo by GATA4‐S105A overexpression, it may have contributed to eccentric hypertrophy and LV dilatation, and also suggest that GATA4 by lowering the MMP9‐to‐TIMP1 ratio may attenuate the fibrotic process. Furthermore, we speculate that the structural changes occurring in CMs during eccentric hypertrophy might be accountable for the strong induction of FN1 expression observed in GATA4‐S105A hypertensive hearts. Fibronectin is anchored to the cell surface of CMs, and it binds to integrins and triggers signalling pathways involved in migration, proliferation, survival, cell growth, and actin cytoskeleton reorganization. 7
Our results indicate that GATA4 inhibits AngII‐induced apoptosis and diminishes the number of proliferating cells. These findings agree with the previous studies on the anti‐apoptotic actions of GATA4 during myocardial remodelling. GATA4 overexpression has been shown to reduce post‐MI apoptosis, 25 whereas CM‐specific loss of GATA4 led to increased apoptosis and cell loss in TAC‐induced pressure overload. 25 , 39 At tissue level, these processes are tightly linked; therefore, reduced cell death might be accountable for diminished cell proliferation. Previously, we have reported cardioprotective actions for GATA4 by using adenoviral gene delivery in experimental rat model of MI. 33 Interestingly, in the present study, overexpression of mutant GATA4‐S105A had no effects on cardiac function and structure post‐infarction, whereas it was deleterious in Ang II‐induced pressure overload, precipitating the development of eccentric hypertrophy and dysfunctional LV dilatation. It is likely that these different actions of GATA4 in specific pathological contexts might be explained by the aetiology of the stimuli, hypertension vs MI, and their distinctive remodelling and fibrotic processes. The pressure overload response is characterized by myocardial hypertrophy and diffuse reactive fibrosis triggered by neurohumoural factors and increased haemodynamic load whereas post‐MI remodelling is driven by the ischaemic injury, mechanical stress and cell damage. 9 , 52 , 53
Besides MAPK‐mediated phosphorylation of S105, other post‐translational modifications (PTMs) and protein‐protein interactions are also known to regulate GATA4 activity. 23 , 54 Activation of GATA4 by AngII is partly mediated by protein kinase C (PKC)‐mediated phosphorylation at S419/420 of GATA4 by glycogen synthase kinase 3‐beta (GSK3β) signals for nuclear export and, therefore, decreases GATA4 transcriptional activity in cardiomyocytes. 55 In contrast, K366 SUMOylation promotes nuclear localization and enhances GATA4 activity. 56 The phosphorylation of S261 by ERK1/2, ribosomal s6 kinase (RSK) or protein kinase A (PKA) promotes the association of GATA4 with p300, while K299 methylation by polycomb repressive complex 2 (PRC2) attenuates it. Histone acetyltransferase p300, in turn, induces CM hypertrophy through acetylation of 4 lysine residues in the C‐terminus of GATA4. 57 Regulation of GATA4‐dependent gene transcription in cardiac stress response is intricately modulated by co‐ordinated PTMs and physically interacting partners. Further, GATA4 and GATA6 are co‐expressed in CM and have been shown to act in synergy to promote the expression of hypertrophic genes in CM, but also to be independently sufficient. 50 , 58 They also distinctly regulate sets of genes required for the adaptive response to pressure overload, such as angiogenesis. 59 Thus far, the possibility that GATA6 and other PTMs could be used as strategies to, at least partly, compensate for the lack of S105 phosphorylation‐associated GATA4 activity cannot be excluded. Therefore, further studies are needed to address the precise molecular actions of GATA4 in the adult heart.
5. CONCLUSION
In summary, we show by using local adenoviral gene transfers that the cardioprotective effects of GATA4 during AngII‐induced hypertension require activation through GATA4 phosphorylation at S105. Furthermore, we observed that GATA4 actions are tightly associated with down‐regulation of pro‐fibrotic genes in adaptive response to AngII. In addition, the GATA4 actions on cardiac fibroblasts are dependent on phosphorylation site S105. Taking together, these findings underscore the importance of phosphorylation site S105 for GATA4 transcriptional activity and cardioprotective effects in AngII‐induced experimental model of hypertension. Although the role of GATA4 in fibrosis might have been previously considered subsequent to the effects on cardiomyocyte hypertrophy and survival, recent findings support a more direct role of GATA4 in modulating fibrotic gene expressions. 28 , 33 For example, Mathison and colleagues 28 reported the direct involvement of GATA4 in the fibrotic response post‐MI via repression of snai1 expression, a pro‐fibrotic factor. In agreement with these findings, our current work in Ang II‐induced hypertension underscores the role of GATA4 in modulation of myocardial fibrogenesis, in addition to hypertrophic remodelling.
CONFLICT OF INTEREST
The authors declare that they have no conflict of interest.
AUTHOR CONTRIBUTIONS
AJA, JR and HR designed the experiments; AJA and JR performed research; HR contributed new reagents or analytic tools; AJA, ZS, A‐MM and RS analysed data; and AJA, JR and HR wrote the paper.
Supporting information
Supplementary Material
ACKNOWLEDGEMENTS
We thank Marja Arbelius, Sirpa Rutanen, Kirsi Salo, Kati Lampinen, the Biomedicum Functional Genomics Unit and the Northern Finland Borealis Biobank for their expert technical assistance. We thank Professor Mona Nemer (University of Ottawa, Canada) for generous gift of GATA4 and GATA4‐S105 adenoviral constructs, and Professor Olli Vuolteenaho (Research Unit of Biomedicine, University of Oulu, Finland) for kindly providing AngII. This work was supported by the Academy of Finland (grants 266661 and 276747), the Finnish Foundation of Cardiovascular Research, the Finnish Funding Agency for Innovation (Tekes, Project 40395/13), the Jenny and Antti Wihuri Foundation and the Sigrid Juselius Foundation.
Jurado Acosta A, Rysä J, Szabo Z, Moilanen A‐M, Serpi R, Ruskoaho H. Phosphorylation of GATA4 at serine 105 is required for left ventricular remodelling process in angiotensin II‐induced hypertension in rats. Basic Clin Pharmacol Toxicol. 2020;127:178–195. 10.1111/bcpt.13398
REFERENCES
- 1. Townsend N, Wilson L, Bhatnagar P, Wickramasinghe K, Rayner M, Nichols M. Cardiovascular disease in Europe: epidemiological update 2016. Eur Heart J 2016;37:3232‐3245. [DOI] [PubMed] [Google Scholar]
- 2. Benjamin EJ, Blaha MJ, Chiuve SE, et al. Heart disease and stroke statistics—2017 update: a report from the American Heart Association. Circulation 2017;135:e146‐603. [DOI] [PMC free article] [PubMed] [Google Scholar]
- 3. Sadoshima J, Izumo S. Molecular characterization of angiotensin II–induced hypertrophy of cardiac myocytes and hyperplasia of cardiac fibroblasts. Critical role of the AT1 receptor subtype. Circ Res 1993;73:413‐423. [DOI] [PubMed] [Google Scholar]
- 4. Campbell SE, Katwa LC. Angiotensin II stimulated expression of transforming growth factor‐β1in cardiac fibroblasts and myofibroblasts. J Mol Cell Cardiol 1997;29:1947‐1958. [DOI] [PubMed] [Google Scholar]
- 5. Schultz JEJ, Witt SA, Glascock BJ, et al. TGF‐β1 mediates the hypertrophic cardiomyocyte growth induced by angiotensin II. J Clin Invest 2002;109:787‐796. [DOI] [PMC free article] [PubMed] [Google Scholar]
- 6. Shinde AV, Frangogiannis NG. Fibroblasts in myocardial infarction: a role in inflammation and repair. J Mol Cell Cardiol 2014;70:74‐82. [DOI] [PMC free article] [PubMed] [Google Scholar]
- 7. Valiente‐Alandi I, Schafer AE, Blaxall BC. Extracellular matrix‐mediated cellular communication in the heart. J Mol Cell Cardiol 2016;91:228‐237. [DOI] [PMC free article] [PubMed] [Google Scholar]
- 8. van Nieuwenhoven FA, Turner NA. The role of cardiac fibroblasts in the transition from inflammation to fibrosis following myocardial infarction. Vascul Pharmacol 2013;58:182‐188. [DOI] [PubMed] [Google Scholar]
- 9. Turner NA. Inflammatory and fibrotic responses of cardiac fibroblasts to myocardial damage associated molecular patterns (DAMPs). J Mol Cell Cardiol 2016;94:189‐200. [DOI] [PubMed] [Google Scholar]
- 10. Talman V, Ruskoaho H. Cardiac fibrosis in myocardial infarction—from repair and remodeling to regeneration. Cell Tissue Res 2016;365:563‐581. [DOI] [PMC free article] [PubMed] [Google Scholar]
- 11. Zou Y, Komuro I, Yamazaki T, et al. Cell type specific Angiotensin II evoked signal transduction pathways: critical roles of G Subunit, Src Family, and Ras in Cardiac Fibroblasts. Circ Res 1998;82:337‐345. [DOI] [PubMed] [Google Scholar]
- 12. Bai F, Pang X‐F, Zhang L‐H, et al. Angiotensin II AT1 receptor alters ACE2 activity, eNOS expression and CD44‐hyaluronan interaction in rats with hypertension and myocardial fibrosis. Life Sci 2016;153:141‐152. [DOI] [PubMed] [Google Scholar]
- 13. De Mello WC, Specht P. Chronic blockade of angiotensin II AT1‐receptors increased cell‐to‐cell communication, reduced fibrosis and improved impulse propagation in the failing heart. J Renin Angiotensin Aldosterone Syst 2006;7:201‐205. [DOI] [PubMed] [Google Scholar]
- 14. Shimizu M, Tanaka R, Uchida M, Orito K, Shimamura S, Yamane Y. Effect of Angiotensin II Type 1 receptor blocker on cardiac angiotensin‐converting enzyme and chymase‐like activities, and cardiac fibrosis in cardiomyopathic hamsters. J Vet Med Sci 2006;68:227‐233. [DOI] [PubMed] [Google Scholar]
- 15. Yoshida J, Yamamoto K, Mano T, et al. AT1 receptor blocker added to ACE inhibitor provides benefits at advanced stage of hypertensive diastolic heart failure. Hypertension 2004;43:686‐691. [DOI] [PubMed] [Google Scholar]
- 16. Oliveira‐Junior SA, Martinez PF, Guizoni DM, et al. AT1 receptor blockade attenuates insulin resistance and myocardial remodeling in rats with diet‐induced obesity. PLoS ONE 2014;9:e86447. [DOI] [PMC free article] [PubMed] [Google Scholar]
- 17. Charron F, Tsimiklis G, Arcand M, et al. Tissue‐specific GATA factors are transcriptional effectors of the small GTPase RhoA. Genes Dev 2001;15:2702‐2719. [DOI] [PMC free article] [PubMed] [Google Scholar]
- 18. Gallagher JM, Komati H, Roy E, Nemer M, Latinkic BV. Dissociation of cardiogenic and postnatal myocardial activities of GATA4. Mol Cell Biol 2012;32:2214‐2223. [DOI] [PMC free article] [PubMed] [Google Scholar]
- 19. Liang Q, Wiese RJ, Bueno OF, Dai YS, Markham BE, Molkentin JD. The transcription factor GATA4 is activated by extracellular signal‐regulated kinase 1‐ and 2‐mediated phosphorylation of serine 105 in cardiomyocytes. Mol Cell Biol 2001;21:7460‐7469. [DOI] [PMC free article] [PubMed] [Google Scholar]
- 20. Herzig TC, Jobe SM, Aoki H, et al. Angiotensin II type1a receptor gene expression in the heart: AP‐1 and GATA‐4 participate in the response to pressure overload. Proc Natl Acad Sci 1997;94:7543‐7548. [DOI] [PMC free article] [PubMed] [Google Scholar]
- 21. Morimoto T, Hasegawa K, Kaburagi S, et al. Phosphorylation of GATA‐4 Is Involved in α 1 ‐Adrenergic Agonist‐responsive Transcription of the Endothelin‐1 Gene in Cardiac Myocytes. J Biol Chem 2000;275:13721‐13726. [DOI] [PubMed] [Google Scholar]
- 22. Pikkarainen S, Tokola H, Majalahti‐Palviainen T, et al. GATA‐4 is a nuclear mediator of mechanical stretch‐activated hypertrophic program. J Biol Chem 2003;278:23807‐23816. [DOI] [PubMed] [Google Scholar]
- 23. Katanasaka Y, Suzuki H, Sunagawa Y, Hasegawa K, Morimoto T. Regulation of cardiac transcription factor GATA4 by post‐translational modification in cardiomyocyte hypertrophy and heart failure. Int Heart J 2016;57:672‐675. [DOI] [PubMed] [Google Scholar]
- 24. Majalahti T, Suo‐Palosaari M, Sármán B, et al. Cardiac BNP gene activation by angiotensin II in vivo. Mol Cell Endocrinol 2007;273:59‐67. [DOI] [PubMed] [Google Scholar]
- 25. Bisping E, Ikeda S, Kong SW, et al. Gata4 is required for maintenance of postnatal cardiac function and protection from pressure overload‐induced heart failure. Proc Natl Acad Sci U S A 2006;103:14471‐14476. [DOI] [PMC free article] [PubMed] [Google Scholar]
- 26. Oka T, Xu J, Molkentin JD. Re‐employment of developmental transcription factors in adult heart disease. Semin Cell Dev Biol 2007;18:117‐131. [DOI] [PMC free article] [PubMed] [Google Scholar]
- 27. Zaglia T, Dedja A, Candiotto C, Cozzi E, Schiaffino S, Ausoni S. Cardiac interstitial cells express GATA4 and control dedifferentiation and cell cycle re‐entry of adult cardiomyocytes. J Mol Cell Cardiol 2009;46:653‐662. [DOI] [PubMed] [Google Scholar]
- 28. Mathison M, Singh VP, Sanagasetti D, et al. Cardiac reprogramming factor Gata4 reduces postinfarct cardiac fibrosis through direct repression of the profibrotic mediator snail. J Thorac Cardiovasc Surg 2017;154:1601‐1610. [DOI] [PMC free article] [PubMed] [Google Scholar]
- 29. Tveden‐Nyborg P, Bergmann TK, Lykkesfeldt J. Basic & clinical pharmacology & toxicology policy for experimental and clinical studies. Basic Clin Pharmacol Toxicol 2018;123:233‐235. [DOI] [PubMed] [Google Scholar]
- 30. Tenhunen O, Soini Y, Ilves M, et al. p38 Kinase rescues failing myocardium after myocardial infarction: evidence for angiogenic and anti‐apoptotic mechanisms. FASEB J 2006;20:1907‐1909. [DOI] [PubMed] [Google Scholar]
- 31. Suo M, Hautala N, Foldes G, et al. Posttranscriptional control of BNP gene expression in angiotensin II‐induced hypertension. Hypertension 2002;39:803‐808. [DOI] [PubMed] [Google Scholar]
- 32. Serpi R, Tolonen A‐M, Huusko J, et al. Vascular endothelial growth factor‐B gene transfer prevents angiotensin II‐induced diastolic dysfunction via proliferation and capillary dilatation in rats. Cardiovasc Res 2011;89:204‐213. [DOI] [PubMed] [Google Scholar]
- 33. Rysä J, Tenhunen O, Serpi R, et al. GATA‐4 is an angiogenic survival factor of the infarcted heart. Circ Hear Fail 2010;3:440‐450. [DOI] [PubMed] [Google Scholar]
- 34. Jurado Acosta A, Rysä J, Szabo Z, et al. Transcription factor PEX1 modulates extracellular matrix turnover through regulation of MMP‐9 expression. Cell Tissue Res 2017;367:369‐385. [DOI] [PubMed] [Google Scholar]
- 35. Tenhunen O, Rysä J, Ilves M, Soini Y, Ruskoaho H, Leskinen H. Identification of cell cycle regulatory and inflammatory genes as predominant targets of p38 mitogen‐activated protein kinase in the heart. Circ Res 2006;99:485‐493. [DOI] [PubMed] [Google Scholar]
- 36. Itoh N, Ohta H, Nakayama Y, Konishi M. Roles of FGF signals in heart development, health, and disease. Front Cell Dev Biol 2016;4:110. [DOI] [PMC free article] [PubMed] [Google Scholar]
- 37. Debrus S, Rahbani L, Marttila M, Delorme B, Paradis P, Nemer M. The zinc finger‐only protein Zfp260 is a novel cardiac regulator and a nuclear effector of α1‐adrenergic signaling. Mol Cell Biol 2005;25:8669‐8682. [DOI] [PMC free article] [PubMed] [Google Scholar]
- 38. Komati H, Maharsy W, Beauregard J, Hayek S, Nemer M. ZFP260 is an inducer of cardiac hypertrophy and a nuclear mediator of endothelin‐1 signaling. J Biol Chem 2011;286:1508‐1516. [DOI] [PMC free article] [PubMed] [Google Scholar]
- 39. Oka T, Maillet M, Watt AJ, et al. Cardiac‐specific deletion of gata4 reveals its requirement for hypertrophy, compensation, and myocyte viability. Circ Res 2006;98:837‐845. [DOI] [PubMed] [Google Scholar]
- 40. Heineke J, Molkentin JD. Regulation of cardiac hypertrophy by intracellular signalling pathways. Nat Rev Mol Cell Biol 2006;7:589‐600. [DOI] [PubMed] [Google Scholar]
- 41. Molkentin JD. The zinc finger‐containing transcription factors GATA‐4, ‐5, and ‐6. Ubiquitously expressed regulators of tissue‐specific gene expression. J Biol Chem 2000;275:38949‐38952. [DOI] [PubMed] [Google Scholar]
- 42. Koivisto E, Jurado Acosta A, Moilanen A‐M, et al. Characterization of the regulatory mechanisms of activating transcription factor 3 by hypertrophic stimuli in rat cardiomyocytes. PLoS ONE 2014;9:e105168. [DOI] [PMC free article] [PubMed] [Google Scholar]
- 43. Kobayashi S, Lackey T, Huang Y, et al. Transcription factor gata4 regulates cardiac BCL2 gene expression in vitro and in vivo. FASEB J 2006;20:800‐802. [DOI] [PubMed] [Google Scholar]
- 44. Moilanen A‐M, Rysä J, Kaikkonen L, et al. WDR12, a member of nucleolar PeBoW‐complex, is up‐regulated in failing hearts and causes deterioration of cardiac function. PLoS ONE 2015;10:e0124907. [DOI] [PMC free article] [PubMed] [Google Scholar]
- 45. Moilanen A‐M, Rysä J, Mustonen E, et al. Intramyocardial BNP gene delivery improves cardiac function through distinct context‐dependent mechanisms. Circ Hear Fail 2011;4:483‐495. [DOI] [PubMed] [Google Scholar]
- 46. Szatkowski ML, Westfall MV, Gomez CA, et al. In vivo acceleration of heart relaxation performance by parvalbumin gene delivery. J Clin Invest 2001;107:191‐198. [DOI] [PMC free article] [PubMed] [Google Scholar]
- 47. van Berlo JH, Elrod JW, Aronow BJ, Pu WT, Molkentin JD. Serine 105 phosphorylation of transcription factor GATA4 is necessary for stress‐induced cardiac hypertrophy in vivo. Proc Natl Acad Sci 2011;108:12331‐12336. [DOI] [PMC free article] [PubMed] [Google Scholar]
- 48. Berk BC, Fujiwara K, Lehoux S. ECM remodeling in hypertensive heart disease. J Clin Invest 2007;117:568‐575. [DOI] [PMC free article] [PubMed] [Google Scholar]
- 49. Pikkarainen S, Tokola H, Kerkelä R, Ruskoaho H. GATA transcription factors in the developing and adult heart. Cardiovasc Res 2004;63:196‐207. [DOI] [PubMed] [Google Scholar]
- 50. Charron F, Paradis P, Bronchain O, Nemer G, Nemer M. Cooperative interaction between GATA‐4 and GATA‐6 regulates myocardial gene expression. Mol Cell Biol 1999;19:4355‐4365. [DOI] [PMC free article] [PubMed] [Google Scholar]
- 51. Ahmed SH, Clark LL, Pennington WR, et al. Matrix metalloproteinases/tissue inhibitors of metalloproteinases: Relationship between changes in proteolytic determinants of matrix composition and structural, functional, and clinical manifestations of hypertensive heart disease. Circulation 2006;113:2089‐2096. [DOI] [PubMed] [Google Scholar]
- 52. Chemaly ER, Kang S, Zhang S, et al. Differential patterns of replacement and reactive fibrosis in pressure and volume overload are related to the propensity for ischaemia and involve resistin. J Physiol 2013;591:5337‐5355. [DOI] [PMC free article] [PubMed] [Google Scholar]
- 53. Zhang W, Lavine KJ, Epelman S, et al. Necrotic myocardial cells release Damage‐Associated Molecular Patterns that provoke fibroblast activation in vitro and trigger myocardial inflammation and fibrosis in vivo. J Am Heart Assoc 2015;4:1‐20. [DOI] [PMC free article] [PubMed] [Google Scholar]
- 54. Suzuki YJ. Cell signaling pathways for the regulation of GATA4 transcription factor: Implications for cell growth and apoptosis. Cell Signal 2011;23:1094‐1099. [DOI] [PMC free article] [PubMed] [Google Scholar]
- 55. Morisco C, Seta K, Hardt SE, Lee Y, Vatner SF, Sadoshima J. Glycogen synthase kinase 3beta regulates GATA4 in cardiac myocytes. J Biol Chem 2001;276:28586‐28597. [DOI] [PubMed] [Google Scholar]
- 56. Wang J, Feng XH, Schwartz RJ. SUMO‐1 modification activated GATA4‐dependent cardiogenic gene activity. J Biol Chem 2004;279:49091‐49098. [DOI] [PubMed] [Google Scholar]
- 57. Takaya T, Kawamura T, Morimoto T, et al. Identification of p300‐targeted acetylated residues in GATA4 during hypertrophic responses in cardiac myocytes. J Biol Chem 2008;283:9828‐9835. [DOI] [PubMed] [Google Scholar]
- 58. van Berlo JH, Elrod JW, Van Den Hoogenhof MMG, et al. The transcription factor GATA‐6 regulates pathological cardiac hypertrophy. Circ Res 2010;107:1032‐1040. [DOI] [PMC free article] [PubMed] [Google Scholar]
- 59. van Berlo JH, Aronow BJ, Molkentin JD. Parsing the Roles of the Transcription Factors GATA‐4 and GATA‐6 in the Adult Cardiac Hypertrophic Response. PLoS ONE 2013;8:e84591. [DOI] [PMC free article] [PubMed] [Google Scholar]
Associated Data
This section collects any data citations, data availability statements, or supplementary materials included in this article.
Supplementary Materials
Supplementary Material