
Figure 3.
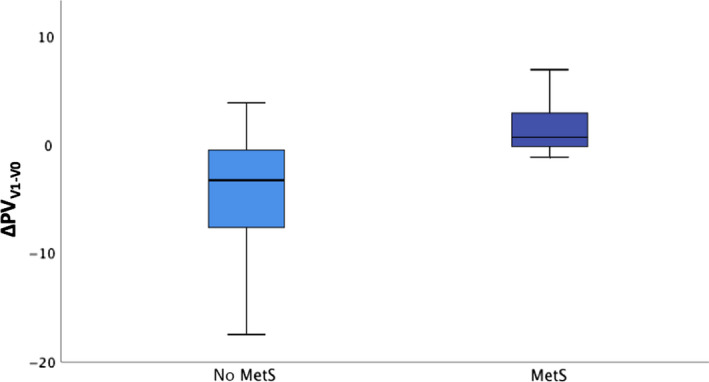
PV reduction (Δ) at V1 in patients without (no MetS) and with metabolic syndrome (MetS) (P = .017). Colored boxes indicate interquartile range (IQR), and center vertical lines indicate median
Official websites use .gov
A
.gov website belongs to an official
government organization in the United States.
Secure .gov websites use HTTPS
A lock (
) or https:// means you've safely
connected to the .gov website. Share sensitive
information only on official, secure websites.
PV reduction (Δ) at V1 in patients without (no MetS) and with metabolic syndrome (MetS) (P = .017). Colored boxes indicate interquartile range (IQR), and center vertical lines indicate median