
Figure 3.
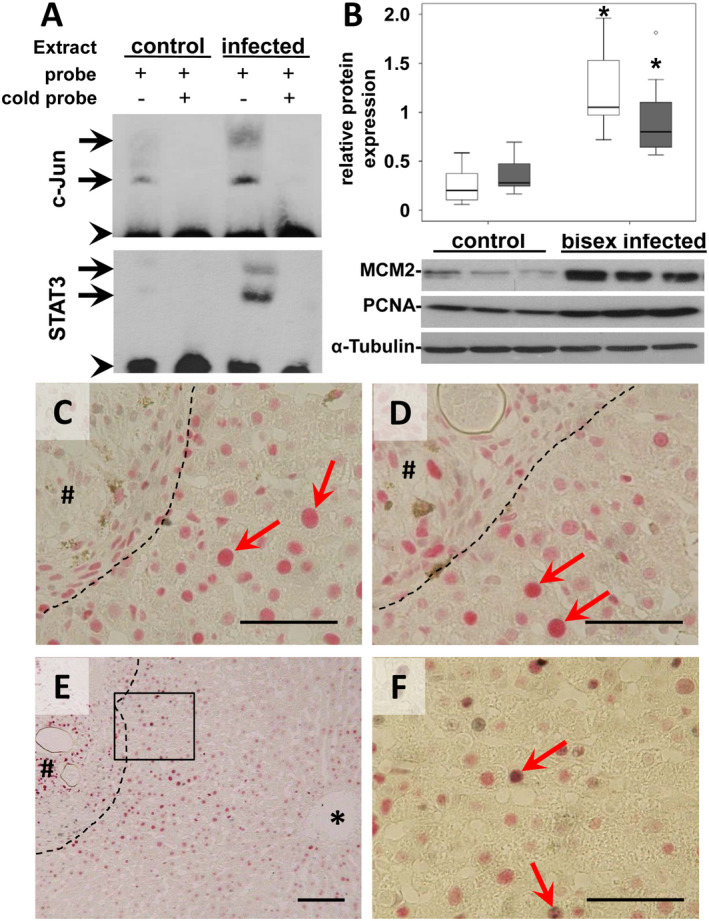
AP‐1/DNA binding and induction of proliferation markers. (A) The upper EMSA assay demonstrated the enhanced AP1/DNA binding in two different complexes (arrows) using liver extracts of S. mansoni–infected hamsters in comparison with single‐sex infected controls. The preparation of nuclear extracts and the binding to the labelled consensus oligonucleotide were performed in the absence of a competitor or in the presence of 100‐fold excess of the unlabeled AP‐1 consensus oligonucleotide (cold probe). Binding of STAT3 to biotin‐labeled DNA probes is shown in the lower EMSA blot. To compete with the binding, an unlabeled STAT3 binding‐site DNA probe was added to the reaction in 100‐times molar excess. The STAT3‐DNA complexes are marked by arrows. Arrowhead indicates free probe. (B) Western blot analysis and subsequent assessment of optical density of the signals depicted enhanced expression of the MCM2 and the PCNA in S. mansoni–infected hamsters. MCM2 (white bars) PCNA (gray bars), n = 9/group for statistical analysis; representative blots are depicted, *P < 0.05. (C,D) Immunohistological nuclear staining (red arrows) of MCM2 (C, red) and PCNA (D, red) was shown in hepatocytes closely located around granuloma. Magnification ×400, bars 50 µm. (E,F) Immunohistological costaining of c‐Jun (red) and Ki67 (gray) demonstrated the activation of the cell cycle in hepatocytes with prominently activated c‐Jun (red arrows). Magnification ×100 (C), ×400 (D), bars 100 µm (C), 50 µm (D). *central vein, # granuloma, dashed line granuloma border.