

Abstract
Background
Lung function testing in small children is cumbersome. However, reduced variability of tidal breathing recorded using impedance pneumography (IP) during sleep was recently found to be a potential objective marker of wheeze in children aged 1‐5 years. We aimed to investigate how an acute bronchial obstruction (BO) and its severity, and recovery thereof reflect in expiratory variability index (EVI).
Methods
EVI was measured using a wearable IP system (Ventica®) during sleep in 40 healthy controls (aged 1.5‐5.9 years) and 30 patients hospitalized due to acute BO (aged 1.3‐5.3 years). In healthy controls, EVI was measured for 1‐3 nights at their homes. Patients were measured for several nights during hospitalization, as practically feasible, and at home 2 and 4 weeks post‐discharge.
Results
We received 79 EVI results from 39 controls and 139 from 30 patients. 90% had previous BO episodes, 30% used asthma controller medication before and 100% after hospitalization. Compared to controls, EVI was significantly lower during hospitalization (P < .0001) having significant correlation with number of days to discharge (r = −.38, P = .004). At 2 or 4 weeks post‐discharge, EVI was not significantly different from the controls (P = .14, P = .49, respectively). EVI was significantly associated with chest auscultation findings (P = .0001) being 17.5 (4.9) (median, IQR) with normal auscultation, 15.6 (7.4) in those with prolonged expiration and 11.4 (6.8) in those with wheeze and/or rales and crackles.
Conclusions
EVI was found to be a sensitive, objective marker of acute BO, showing strong association with changes in clinical status in wheezy children aged 1‐5 years.
Keywords: asthma, home monitoring, impedance pneumography, lung function, obstruction, pediatric, tidal breathing, wheeze
Key message.
Expiratory variability index (EVI) measured during sleep using impedance pneumography is a novel, easy, objective lung function test for small children and infants.
1. INTRODUCTION
Asthma in preschool children is often over‐ or underdiagnosed. 1 Episodes of bronchial obstruction (BO) are a distinct feature in patients with both recurrent wheezing and asthma and can be in many cases wrongly attributed. Diagnosis is complicated by the difficulty in obtaining objective measurements of lung function leading to inadequate or inappropriately prolonged therapy. 1 Lack of possibilities for routine lung function testing in this age group, especially at home, impedes also monitoring of their asthma 2 leading to poor disease control, 3 which increases the burden of the disease through avoidance of physical activities, 4 school absenteeism 5 and more frequent exacerbations, emergency department visits and hospitalizations. 6
Analysis of tidal breathing flow‐volume (TBFV) curves needing minimal co‐operation has been studied as an alternative in assessing lung function in small children. This has been done by using direct measurements of TBFV with a face mask and deriving different curve feature parameters, such as timing of peak expiratory flow, that presumably associate with the presence of airway obstruction and with increased risk of asthma. 7 Recently, we found that indices derived from longer (during whole‐night sleep) TBFV recordings done using impedance pneumography (IP) are associated with the risk of persistent asthma in infants 8 and symptoms in wheezy children. 9
A newer approach in TBFV analysis quantifies the level of variability of the curves over time. Reduced variability has been associated with COPD 10 and asthma 11 in adults, and increased hospitalization rates 12 together with BO and its response to a bronchodilator 13 in infants and children. Recently, we showed that the TBFV variability in wheezy preschool children is associated with controller medication withdrawal and symptoms, 14 and that the obstruction‐related pathologic rigidity of the curve is most prominent within a specific section of the curve (15%‐45% of exhaled volume), 15 producing a marker that we named the expiratory variability index (EVI).
The aim of this proof‐of‐concept study was to understand the range and dynamics of EVI in association with the clinical status, and signs and symptoms of acute BO in preschool children (age 1‐5 years) during hospitalization and 4 weeks of recovery thereof.
2. METHODS
2.1. Study design
The study was designed as a prospective, observational, non‐interventional proof‐of‐concept study in children (age 1‐5 years) hospitalized because of severe BO and followed during hospitalization and recovery thereof (ClinicalTrials.gov Identifier: NCT03488303). EVI in patients was compared to a control group of healthy subjects of the same age (ClinicalTrials.gov Identifier: NCT03551236).
Parents of all participants gave a written informed consent before recruitment. Both studies (patients and controls) were approved by the Hospital Ethics Committee (No. 2/2018 and 11/2016, respectively) and performed according to the Declaration of Helsinki.
2.2. Study participants
Between April and November 2018, we recruited 30 patients aged 1‐5 years who were admitted to the department of pulmonology and allergology for infants and young children and preschool and school children at Children's Hospital Srebrnjak, Zagreb, Croatia, with a diagnosis of acute airway obstruction or asthma exacerbation requiring inpatient treatment. We excluded children with need for an ICU treatment, bronchiolitis, pneumonia (not including viral infections), or other cardiorespiratory or neurological chronic diseases or states that may significantly alter the overnight breathing pattern. Patients needing ICU treatment were excluded because the ICU monitors use the same technology to record respiratory rate, thus potentially interfering with the IP recording signal.
We recruited 39 healthy control children aged 1‐5 years between April and June 2017 from kindergartens in Zagreb, Croatia. Children were excluded if they had any of the following: preterm birth, chronic respiratory disorder of prematurity, recurrent bronchitis or recurrent hospitalizations because of a respiratory illness (recurrent pneumonia), primary immunodeficiency, chronic rhinosinusitis, sinonasal polyposis, nasal congestion, adenotonsillar hypertrophy, signs and symptoms of sleep apnea or sleep‐disordered breathing, acute respiratory infection or hospitalization because of an acute illness within 4 weeks prior to inclusion, personal or family history or clinical evidence of asthma, atopy or other chronic respiratory disorders, use of asthma rescue or maintenance medication within 4 weeks prior to inclusion.
2.3. Study outline
After being admitted to the ward, IP recording was performed on each night of the stay when the child and family were compliant and willing. Lung function testing using impulse oscillometry (IOS) (Masterscreen IOS, Erich Jaeger GmbH, Hoechberg, Germany) was performed as feasible. As patients were hospitalized due to severe acute BO, IOS measurements were done in many cases without the tapering of short‐acting bronchodilators. Clinical status of the patients was assessed every evening and morning (clinical examination with lung auscultation and vitals—body temperature, heart and respiratory rate, blood oxygen saturation (SaO2)). The treatment at admittance started with systemic corticosteroid dose of 1‐2 mg/kg of body weight of methylprednisolone together with the inhalations of salbutamol and/or ipratropium, followed by the inhalations of fluticasone propionate every 12 hours + inhalations of salbutamol (SABA, every 4‐6 hours) and/or ipratropium (every 8 hours) depending on the clinical presentation and the rate of recovery. During the first days, some of the patients were given supplementary oxygen when needed. Average in‐hospital stay was between 3 and 6 days.
After discharge, patients were invited for follow‐up visits after two and four weeks. They were all prescribed regular inhaled corticosteroids, in some cases in combination with leukotriene antagonists (LTRA) or long‐acting beta agonist (LABA) with SABA prn. At home, the patients kept a diary of symptoms and drug administration. The same assessments as during the inpatient period were performed at follow‐up visits, and the patients were given IP recording equipment and instructed how to perform measurements at home during the following 1‐2 nights.
2.4. Tidal breathing analysis
Nocturnal tidal breathing signal was collected using IP recorders (Ventica® Recorder, Revenio Research Ltd.). The system comprises four skin electrodes attached close to the axillae and a portable recorder device in a shirt pocket (Figure 1). High accuracy of recording is enabled through our research on correct skin‐electrode placement 16 and signal processing algorithm to remove cardiogenic impedance distortions. 17 The method has been validated to have high agreement with simultaneously measured direct mouth flow during a methacholine challenge test in infants 18 and preschool children. 19
Figure 1.

Sketch of the measurement set‐up
EVI was derived automatically with commercial analysis software (Ventica® Analytics v2.1.0). EVI is derived by calculating correlations between partial expiratory flow‐volume curves recording from the duration of the night's sleep. TBFV curve part of 15%‐45% of exhaled volume is used as this has been found to have best discriminative properties between healthy and obstructive subjects. 15 Low EVI indicates reduced variability of that part of TBFV curve.
2.5. Statistical analysis
Results are presented as median values with inter‐quartile range (IQR), unless otherwise stated.
EVI values from all (one to three) measurements in control individuals were pooled together for analyses, except when within‐subject variability between repeated measurements was analysed.
Two group differences were tested using the Mann‐Whitney U test, and for three or more subgroups using the Kruskal‐Wallis test. Within‐patient changes were tested using the Wilcoxon signed‐rank test. Correlations between two continuous variables were analysed using the Pearson correlation test.
Predicted values for oscillometric lung function test results of Malmberg et al were used. 20 Respiratory and heart rates were age‐corrected using reference of Fleming et al. 21
All analyses were performed using Stata 16 software (StataCorp).
3. RESULTS
3.1. Participants & feasibility
The control subjects were aged (median, range) 4.1 (1.5‐5.9) years with 14 (39%) boys, and patients were aged 2.8 (1.3‐5.3) years with 23 (77%) boys. Nineteen (63%) patients had a positive family history of atopy and/or asthma, 27 (90%) had previous episodes of BO, 10 (33%) were on ICS at the time of current BO episode, and 23 (77%) were previously using ICS and 28 (93%) SABA, with 10 (33%) that had previous allergic sensitization to foodstuff and/or aeroallergens.
Success rate of the measurements was 83% with electrode contact problems being the most frequent reason (10%) for failure (Table 1).
Table 1.
Success rates of EVI measurements
| Healthy controls | Patients in hospital | Patients at home | All | |
|---|---|---|---|---|
| Number of measurement attempts—n | 89 | 70 | 103 | 262 |
| Successful—n (%) | 79 (89) | 56 (80) | 83 (81) | 218 (83) |
| Fail due to electrode contact problems—n (%) | 7 (8) | 10 (14) | 10 (10) | 27 (10) |
| Fail due to short sleep and/or excess movement during night—n (%) | 3 (3) | 4 (6) | 9 (9) | 16 (6) |
| Fail due to other reason—n (%) | 0 (0) | 0 (6) | 1 (1) | 1 (0) |
3.2. Expiratory variability index (EVI)
EVI did not correlate with height or age of the control subjects (r = 0.03, P = .80, and r = 0.12, P = .28, respectively). The 50th, 10th and 5th percentiles of their EVI results distribution were 17.4, 14.0 and 12.1, respectively, corresponding to diagnostic specificities of the respective EVI thresholds.
EVI was significantly lower during the inpatient period than at 2 or 4 weeks post‐discharge follow‐ups (pooled inpatient results, P = .0002 and P < .0001, respectively, Table 2 and Figure 2) despite continuous inpatient bronchodilator therapy. When compared to healthy controls, EVI was significantly lower during the inpatient period (P < .0001) but not at the follow‐up control visits at 2 and 4 weeks after discharge (P = .14 and P = .49, respectively). EVI below 14.0 (10th percentile of the controls) was observed in 61% of the measurements done during the inpatient period and in 22% at control visits.
Table 2.
Expiratory variability index (EVI), oxygen saturation (SaO2) and age‐corrected heart and respiratory rates (as percentage of reference, measured by a nurse) in healthy controls and patients at different time points. Values reported as median (inter‐quartile range)
| Controls | Patients | ||||||
|---|---|---|---|---|---|---|---|
| Days before hospital discharge | Weeks after discharge | ||||||
| 4 days | 3 days | 2 days | 1 days | 2 weeks | 4 weeks | ||
| No. of measurements | 79 | 4 | 11 | 19 | 22 | 41 | 42 |
| EVI* | 17.4 (3.8) | 8.9 (5.4) | 9.6 (6.0) | 12.4 (7.7) | 14.9 (5.6) | 16.4 (4.4) | 17.0 (5.5) |
| SaO2 (%)* | 99.0 (1.0) | 94.5 (3.5) | 97.0 (2.0) | 97.0 (2.0) | 97.0 (0.0) | 99.0 (1.0) | 99.0 (1.0) |
| Heart rate (%) | 103 (21) | 99 (11) | 105 (25) | 105 (14) | 104 (10) | 109 (17) | 106 (21) |
| Respiratory rate (%) | 88 (10) | 91 (19) | 97 (16) | 96 (8) | 96 (15) | 90 (24) | 88 (15) |
Significant correlation (P < .05) with number of days before discharge during the inpatient period.
Figure 2.
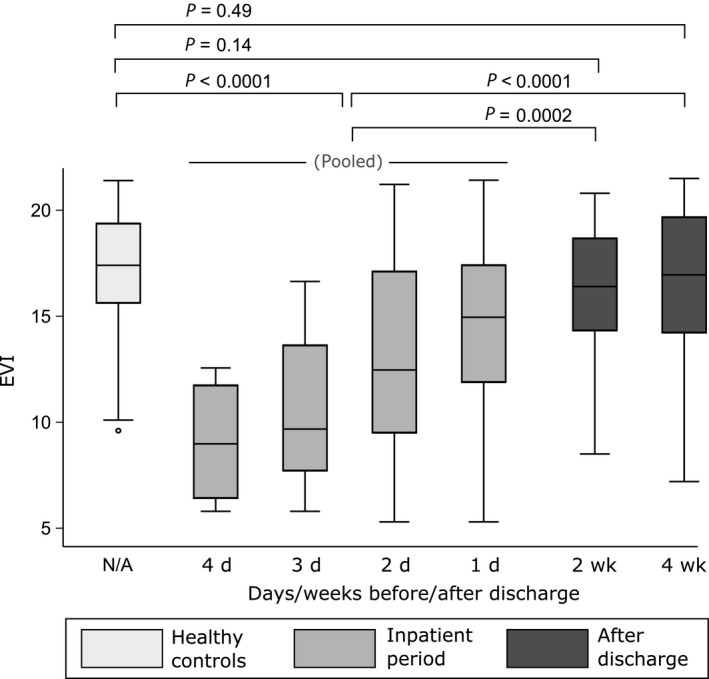
EVI values of the healthy controls and the patients at different time points. See Table 2 for sample sizes. The rectangles cover 25‐75 percentile range, middle lines denote median, and the whiskers extend to extrema, excluding outliers, defined as being farther than 1.5 times IQR from the closer quartile
During the inpatient period, EVI and the level of SaO2 both showed a significant correlation with number of days to discharge (r = −.38, P = .004, and r = −.43, P = .001, respectively), but no mutual correlation was found (r = .13, P = .33). Age‐corrected heart or respiratory rates were not correlated with days to discharge (r = −0.07, P = .60, and r = −.03, P = .79), nor with EVI or SaO2. Increase in EVI from first available inpatient measurement to first control measurement was 3.3 (4.7) (n = 24).
Abnormal auscultation findings were found during 93% of the inpatient measurements, but only in 12% after the discharge. EVI was significantly different between three different categories of chest auscultation findings (P = .0001). When compared to normal findings (EVI was 17.5 [4.9]), area under curve (AUC) of ROC curve was 0.81 (95% CI 0.71‐0.91) for wheeze and/or rales and crackles (EVI was 11.4 [6.8]), and 0.67 (95% CI 0.55‐0.79) when only a prolonged expiration was found on auscultation (EVI was 15.6 [7.4]) (Figure 3). Nasal congestion without signs of BO did not lower EVI (20.0 [1.7], n = 10); instead, it was even slightly higher than in the healthy controls (P = .001).
Figure 3.

ROC curves of EVI value according to chest auscultation findings (only patients). Most of the abnormal auscultation findings (83%) occurred during inpatient period (while children received continuous bronchodilator therapy)
A subsample of patients that were able to cooperate and could produce a technically acceptable lung function measurement with impulse oscillometry were analysed, showing no significant difference (P = .83) between R5%pred during inpatient period (119 (42) %, n = 16) and at control visits thereafter (111 (39) %, n = 51). The same was found for the bronchodilator reversibility of R5 (−7 (35) %, n = 14 vs −11 (15) %, n = 24, respectively, P = .17). EVI was not significantly associated with baseline R5%pred (r = −0.13, P = .28, n = 67) or with the level of bronchodilator reversibility for R5 (r = −.05, P = .75, n = 38).
Repeatability of EVI between two consecutive nights was not different between the healthy controls (night‐to‐night difference −0.4 [2.6]) and the patients during the period of good control (first and second control visit, −0.3 [2.1] and −0.2 [2.6], respectively).
4. DISCUSSION
Major finding from this proof‐of‐concept study was that EVI was significantly lower during severe acute BO with a significant increase during the inpatient recovery period. Already 2 weeks after discharge in patients on asthma controller treatment recovering from a severe acute BO episode EVI was found to be comparable to healthy controls. EVI was also found to be significantly associated with clinical signs of obstruction (on auscultation), being the lowest in children with the worst lung auscultation findings. All major findings corroborate the concept that EVI recorded using IP during sleep is an objective and sensitive marker of BO in children aged 1‐5 years of age despite bronchodilator therapy.
EVI showed to be rather dynamic as almost all patients suffered from history of asthma or recurrent wheeze (90% having previous BO episodes and 93% previously using SABA), yet EVI was low in most patients only during acute BO and not after recovery. This dynamic behaviour could be expected in children of this age as there is still no significant remodelling present in the airways. It is also noteworthy that EVI was low despite the intensive bronchodilation therapy. This may be attributed to incomplete effect of the treatment during severe obstruction, longer pauses in drug administration during the night and the typical nocturnal worsening of the obstruction. Also, apart from bronchoconstriction, BO can be caused by thick mucus secretions or mucosal oedema of the airways. Insensitivity to short‐acting bronchodilator therapy is a beneficial feature of EVI, considering its potential routine use to assess BO at home. Another desired characteristic would be insensitivity to upper airway obstruction. In this study, in a small subsample (n = 10) where children had significant nasal congestion but no signs of BO, EVI was, indeed, normal or even slightly elevated as compared to healthy controls. Insensitivity to bronchodilators and upper airway congestion were both also findings of our other recent study. 14 Furthermore, the other study found low EVI (below 14) in approximately every third child with history of recurrent obstructions also when no inhaler therapy or ICS alone was administered, mostly dispelling the concern that a low EVI result could be caused directly by SABA through some (unknown) neurophysiological interaction.
During the inpatient period, EVI and SaO2 were significantly associated with number of days prior to discharge, but age‐corrected respiratory or heart rates were not (Table 2). EVI and SaO2 were, however, not mutually correlated as SaO2 reaches its plateau already at the beginning of BO treatment most likely due to its high compensatory capacity (haemoglobin dissociation curve). Also, SaO2 is not influenced only by BO, but also by other factors like ventilation‐perfusion mismatch. Respiratory and heart rates are commonly recorded as the criteria for the primary severity assessments of acute BO, but they seem not to be suitable for follow‐up, perhaps because they are affected by other factors than BO, such as bronchodilating agents and hospitalization stress (when awake).
This is the first time EVI values from these patients or controls were reported in a journal manuscript. A recently published study with a control sample of 40 healthy children of comparable age measured in Finland provided a highly comparable EVI distribution as the controls in this study with a median, and 10th and 5th percentiles of 17.3, 14.0 and 12.0, respectively (17.4, 14.0 and 12.1 in this study). 14
The success rate of the EVI measurements was comparable when the measurements were done at the ward (80%) or at home (81%), but a little bit lower than in the Finnish study (94%). 14 Better ways to secure the skin electrodes or better types of electrodes should be explored to improve this, as electrode contact problems were the primary reason for test failure. Also, the importance of careful instruction of the parents should be stressed.
We observed no clear association for EVI with age or height in healthy controls, similar to our recent study. 14 This is perhaps not surprising, as EVI assesses only the pattern of TBFV curve shapes and not their absolute volume or flow rates. EVI is likely associated with the neural control of respiration 15 , 22 whose fastest development phase is already past at this age. 23
The main limitations of this study are a relatively small sample size and the limited possibility to do other lung function methods for comparison. In infants, sedation of severely obstructed patients for infant lung function testing would introduce unjustified risks, whereas IOS measurements were hindered by lack of patient co‐operation and the need to provide regular bronchodilator treatment. EVI, on the other hand, was feasible, showing highly significant association with the severity of BO and significant change with clinical recovery already in this relatively small sample.
This study showed that low EVI is strongly associated with currently present severe BO in recurrent wheezers aged 1‐5 years despite continuous administration of short‐acting bronchodilator therapy. EVI is sensitive enough to show clinically meaningful change due to recovery already during the inpatient period. It also suggests that nasal congestion would not affect EVI, not causing false positive results. This proof‐of‐concept study provided clear evidence that EVI measured using IP technique has a high potential for an easy and objective detection of BO in young children, suitable for home use.
CONFLICT OF INTEREST
VPS holds patents relating to impedance pneumography. VPS and AH are employees of Revenio Group corporation that commercializes impedance pneumography technology. MT reports grants and personal fees from Revenio, during the conduct of the study; personal fees from Pliva; personal fees from Boehringer Ingelheim; personal fees from Belupo; personal fees from AbbVie; personal fees from Novartis; and personal fees from MSD, outside the submitted work; IMV reports grants and personal fees from Revenio, during the conduct of the study. DP reports grants, personal fees and non‐financial support from Revenio, during the conduct of the study; grants and personal fees from GlaxoSmithKline; personal fees and non‐financial support from Menarini; personal fees from Pliva; personal fees and non‐financial support from Boehringer Ingelheim; personal fees from Belupo; personal fees from AbbVie; personal fees from Novartis; personal fees from MSD; personal fees from Chiesi; and personal fees and non‐financial support from Philips, outside the submitted work.
AUTHOR CONTRIBUTION
Ville‐Pekka Seppä: Conceptualization (supporting); Data curation (supporting); Formal analysis (lead); Methodology (lead); Resources (lead); Software (lead); Supervision (supporting); Visualization (lead); Writing‐original draft (lead); Writing‐review & editing (lead). Mirjana Turkalj: Conceptualization (supporting); Data curation (supporting); Investigation (equal); Methodology (supporting); Project administration (supporting); Resources (supporting); Software (supporting); Supervision (supporting); Validation (supporting); Visualization (supporting); Writing‐original draft (supporting); Writing‐review & editing (equal). Anton Hult: Data curation (equal); Formal analysis (supporting); Resources (supporting); Software (supporting); Writing‐original draft (supporting); Writing‐review & editing (supporting). Ivana Maloča Vuljanko: Investigation (equal); Project administration (supporting); Resources (supporting); Software (supporting); Supervision (supporting); Validation (supporting); Visualization (supporting); Writing‐original draft (supporting); Writing‐review & editing (equal). Davor Plavec: Conceptualization (lead); Data curation (lead); Formal analysis (supporting); Funding acquisition (equal); Investigation (lead); Methodology (lead); Project administration (lead); Resources (lead); Software (supporting); Supervision (lead); Validation (lead); Visualization (equal); Writing‐original draft (equal); Writing‐review & editing (lead).
Seppä V‐P, Turkalj M, Hult A, et al; Collaborators . Expiratory variability index (EVI) is associated with the severity of acute bronchial obstruction in small children: A proof‐of‐concept study. Pediatr Allergy Immunol. 2020;31:636–642. 10.1111/pai.13257
The peer review history for this article is available at https://publons.com/publon/10.1111/pai.13257
Funding information
The study was funded by Revenio Research Ltd (Vantaa, Finland). IP recorders, their accessories and software were provided free of charge by Revenio Research Ltd for the duration of the study.
REFERENCES
- 1. National Asthma Education and Prevention Program . NHLBI Expert Panel Report 3 (EPR‐3): Guidelines for the diagnosis and management of asthma‐summary report 2007. J Allergy Clin Immunol. 2007;120(5 Suppl):S94‐138. [DOI] [PubMed] [Google Scholar]
- 2. Moeller A, Carlsen K‐H, Sly PD, et al. Monitoring asthma in childhood: lung function, bronchial responsiveness and inflammation. Eur Respirat Rev. 2015;24(136):204‐215. [DOI] [PMC free article] [PubMed] [Google Scholar]
- 3. Gustafsson PM, Watson L, Davis KJ, Rabe KF. Poor asthma control in children: evidence from epidemiological surveys and implications for clinical practice. Int J Clin Pract. 2006;60(3):321‐334. [DOI] [PubMed] [Google Scholar]
- 4. Vahlkvist S, Inman MD, Pedersen S. Effect of asthma treatment on fitness, daily activity and body composition in children with asthma. Allergy. 2010;65(11):1464‐1471. [DOI] [PubMed] [Google Scholar]
- 5. Milton B, Whitehead M, Holland P, Hamilton V. The social and economic consequences of childhood asthma across the lifecourse: a systematic review. Child Care Health Devel. 2004;30(6):711‐728. [DOI] [PubMed] [Google Scholar]
- 6. Haselkorn T, Fish JE, Zeiger RS, et al. Consistently very poorly controlled asthma, as defined by the impairment domain of the Expert Panel Report 3 guidelines, increases risk for future severe asthma exacerbations in The Epidemiology and Natural History of Asthma: Outcomes and Treatment Regimens (TENOR) study. J All Clin Immunol. 2009;124(5):895‐902.e4. [DOI] [PubMed] [Google Scholar]
- 7. Håland G, Lødrup‐Carlsen K, Sandvik L, et al. Reduced lung function at birth and the risk of asthma at 10 years of age. N Engl J Med. 2006;355(16):1682‐1689. [DOI] [PubMed] [Google Scholar]
- 8. Gracia‐Tabuenca J, Seppä V‐P, Jauhiainen M, et al. Tidal breathing flow volume profiles during sleep in wheezing infants measured by impedance pneumography. J Appl Physiol. 2019;126(5):1409‐1418. [DOI] [PubMed] [Google Scholar]
- 9. Gracia‐Tabuenca J, Seppä V‐P, Jauhiainen M, Paassilta M, Viik J, Karjalainen J. Tidal breathing flow profiles during sleep in wheezing children measured by impedance pneumography. Respirat Physiol Neurobiol. 2020;271:103312. [DOI] [PubMed] [Google Scholar]
- 10. Dames KK, Lopes AJ, de Melo PL. Airflow pattern complexity during resting breathing in patients with COPD: Effect of airway obstruction. Respirat Physiol Neurobiol. 2014;192:39‐47. [DOI] [PubMed] [Google Scholar]
- 11. Veiga J, Lopes AJ, Jansen JM, Melo PL. Airflow pattern complexity and airway obstruction in asthma. J Appl Physiol. 2011;111(2):412‐419. [DOI] [PubMed] [Google Scholar]
- 12. Usemann J, Suter A, Zannin E, et al. Variability of tidal breathing parameters in preterm infants and associations with respiratory morbidity during infancy: a cohort study. J Pediatrics. 2019;205:61‐69.e1. [DOI] [PubMed] [Google Scholar]
- 13. Hmeidi H, Motamedi‐Fakhr S, Chadwick EK, et al. Tidal breathing parameters measured by structured light plethysmography in children aged 2–12 years recovering from acute asthma/wheeze compared with healthy children. Physiol Rep. 2018;6(12):e13752. [DOI] [PMC free article] [PubMed] [Google Scholar]
- 14. Seppä V‐P, Paassilta M, Kivistö J, et al. Reduced expiratory variability index (EVI) is associated with controller medication withdrawal and symptoms in wheezy children aged 1–5 years. Pediatric All Immunol. 2020:1‐7. 10.1111/pai.13234 [DOI] [PMC free article] [PubMed] [Google Scholar]
- 15. Seppä V‐P, Hult A, Gracia‐Tabuenca J, et al. Airway obstruction is associated with reduced variability in specific parts of the tidal breathing flow–volume curve in young children. ERJ Open Res. 2019;5(2):00028‐02019. [DOI] [PMC free article] [PubMed] [Google Scholar]
- 16. Seppä V‐P, Hyttinen J, Uitto M, Chrapek W, Viik J. Novel electrode configuration for highly linear impedance pneumography. Biomed Tech (Berl). 2013;58(1):35‐38. [DOI] [PubMed] [Google Scholar]
- 17. Seppa V‐P, Hyttinen J, Viik J. A method for suppressing cardiogenic oscillations in impedance pneumography. Physiol Meas. 2011;32(3):337‐345. [DOI] [PubMed] [Google Scholar]
- 18. Malmberg LP, Seppä V‐P, Kotaniemi‐Syrjänen A, et al. Measurement of tidal breathing flows in infants using impedance pneumography. Eur Respir J. 2017;49(2):1600926. [DOI] [PubMed] [Google Scholar]
- 19. Seppä V‐P, Pelkonen AS, Kotaniemi‐Syrjänen A, Mäkelä MJ, Viik J, Malmberg LP. Tidal breathing flow measurement in awake young children by using impedance pneumography. J Appl Physiol. 2013;115(11):1725‐1731. [DOI] [PubMed] [Google Scholar]
- 20. Malmberg LP, Pelkonen A, Poussa T, Pohjanpalo A, Haahtela T, Turpeinen M. Determinants of respiratory system input impedance and bronchodilator response in healthy Finnish preschool children. Clin Physiol Funct Imaging. 2002;22(1):64‐71. [PubMed] [Google Scholar]
- 21. Fleming S, Thompson M, Stevens R, et al. Normal ranges of heart rate and respiratory rate in children from birth to 18 years of age: a systematic review of observational studies. Lancet. 2011;377(9770):1011‐1018. [DOI] [PMC free article] [PubMed] [Google Scholar]
- 22. Hult A, Gjergja Juraški R, Gracia‐Tabuenca J, Partinen M, Plavec D, Seppä V‐P. Sources of variability in expiratory flow profiles during sleep in healthy young children. Respir Physiol Neurobiol. 2019;274:103352. [DOI] [PubMed] [Google Scholar]
- 23. Carroll JL, Donnelly DF. Respiratory physiology and pathophysiology during sleep In: Sheldon SH, Ferber R, Kryger MH, Gozal D. eds. Principles and Practice of Pediatric Sleep Medicine, 2nd ed. London: Elsevier; 2014. [Google Scholar]