

Abstract
Single glycan–protein interactions are often weak, such that glycan binding partners commonly utilize multiple, spatially defined binding sites to enhance binding avidity and specificity. Current array technologies usually neglect defined multivalent display. Laser‐based array synthesis technology allows for flexible and rapid on‐surface synthesis of different peptides. By combining this technique with click chemistry, neo‐glycopeptides were produced directly on a functionalized glass slide in the microarray format. Density and spatial distribution of carbohydrates can be tuned, resulting in well‐defined glycan structures for multivalent display. The two lectins concanavalin A and langerin were probed with different glycans on multivalent scaffolds, revealing strong spacing‐, density‐, and ligand‐dependent binding. In addition, we could also measure the surface dissociation constant. This approach allows for a rapid generation, screening, and optimization of a multitude of multivalent scaffolds for glycan binding.
Keywords: click chemistry, combinatorial chemistry, laser-induced forward transfer, lectin, microarrays
Interactions of proteins with glycans rely on multivalency, where multiple adjacent binding events are involved. To study this glycan density‐dependent binding, a facile technique to synthesize peptide‐based multivalent carbohydrate scaffolds in parallel, directly on‐chip, in the microarray format, was developed. This allows to rapidly generate arrays of multivalent glycan structures, without the need for individual multistep syntheses per compound.

Introduction
Glycan arrays are indispensable tools to screen carbohydrate interaction partners in high‐throughput. They offer many different glycans, immobilized as spots on a solid surface. Since the advent of glycan microarrays some 20 years ago,1 they have become a standard tool2 in the discovery of novel interactions. Applying this technology, various binding studies were already successfully carried out over the last years.3 Since many pathogens infect a host by binding to cell‐surface glycans using glycan binding proteins (GBPs), called lectins, the screening of such interactions represents a cornerstone in the field.4
Intrinsic (per binding site) glycan–protein affinities are weak (K D≈μm–mm)2a and GBPs can often interact with diverse substrates, due to their rather low specificity. To improve weak binding and low specificity, binding domains of pathogens are often equipped with multiple, spatially defined glycan binding sites to enhance avidity.5 This effect is known as multivalency and serves as a common strategy in nature to achieve high avidity between glycans and GBPs.
Still, multivalent effects are somewhat difficult to screen and not yet fully understood.6 Therefore, multivalency, one of the key aspects in glycan recognition processes, is often neglected, since glycan density and spacing on a standard solid support is difficult to control.7 Flexible and rapid methods for precise spatial distribution and orientation of glycans on a microarray need to be developed to screen GBPs for the identification of strong, selective, and reliable binders.8
To mimic the natural occurrence of glycans, many different multivalent scaffolds have been pre‐synthesized in different shapes.9 Peptide chemistry has been widely employed to attach sugars at specific positions onto chemically well‐defined backbones, leading to multivalent glycoconjugates with controlled spatial arrangement.10 A major challenge is the transfer of such methods to the preparation of spatially defined glycan microarrays. Usually, arrays are printed on solid supports, ignoring the specific glycan spacing and density within each spot. As a result, glycans are attached to the surface in an uncontrolled way, which can result in reproducibility problems and the loss of glycan binding events due to mismatched spacing.11 Additionally, an excess in glycan density can lead to suppression of the binding due to steric hindrance. Thus, only spatially defined glycan microarrays can solve this problem.
The simplest way to tune glycan density on the microarray is the direct printing of glycan containing solutions of various concentrations or by modifying the surface functionalization density.11a, 12 This method provides good qualitative results regarding multivalency of GBPs, although the organization of the glycans remains random. Another, yet more defined approach for multivalent display of glycans on microarrays, is the printing of pre‐synthesized or natural multivalent scaffolds. Those molecules already provide a defined multivalency of the glycan moieties. Through the printing process, the density can be regulated according to the applied concentration of the spotting solution. In this way, glycoconjugates, such as natural glycoproteins,13 neo‐glycoproteins/neo‐glycopeptides,1, 14 glycodendrimers,15 glycan‐conjugated DNA,16 glycoclusters,17 and glycopolymers18 were used to fabricate microarrays, displaying multivalent carbohydrate structures. These approaches usually require labor‐intensive multistep pre‐syntheses for each compound. In addition, subsequent array printing can suffer from fluctuating compound solubility and density, immobilization efficiency, as well as sometimes poor spot morphology.
Hence, a promising strategy to generate defined multivalency in the microarray format is the on‐chip synthesis, which means the step‐wise synthesis directly on the final microarray surface. This should allow for a more rapid and reproducible production of such arrays. Since glycan synthesis is quite challenging, only disaccharides have been successfully synthesized directly on a surface using purely chemical approaches.19 Alternatively, other approaches have been investigated to generate multivalent glycan structures on‐chip. A remarkable example is the use of photopolymerization to grow brush‐like glycopolymers with distinct multivalency on a solid support by varying the irradiation time.20 Another method to create multivalency is the pre‐immobilization of scaffolds that bear a distinct number of functional groups for glycan attachments.11b
Here, we present a flexible alternative, using our new combinatorial laser‐induced forward transfer (cLIFT) technology.21 In combination with copper(I)‐catalyzed alkyne–azide cycloaddition (CuAAC), we synthesized neo‐glycopeptides directly on a functionalized glass slide to manufacture microarrays. Since our approach does not require cumbersome pre‐synthesis of individual scaffolds, it offers a rapid and flexible method for multivalent glycan structures synthesis, with a defined spot morphology and a controlled immobilization efficiency.
Results and Discussion
We applied the cLIFT technology, which is used for on‐chip peptide synthesis (see Experimental Section).21 In brief, different donor slides are produced (Figure 1 A), containing different amino acid building blocks. These building blocks are laser‐transferred to an acceptor, where the on‐chip chemical synthesis is performed (Figure 1 B). We synthesized arrays of different synthetic peptide sequences, containing various numbers of the alkyne‐functionalized amino acid l‐propargylglycine (Pra). Subsequently, we used CuAAC to attach azido‐functionalized sugars to these distinct positions on the peptide backbone. Then, we studied the interactions of the fluorescently labeled lectins concanavalin A (ConA) and human langerin by fluorescence scanning. In addition, by varying the lectin concentration, we could determine the (surface) dissociation constant K D,surf of ConA regarding different neo‐glycopeptide sequences.
Figure 1.

cLIFT process. (A) Preparation of activated amino acid (AA) donor slides by spin coating. (B) Transfer of activated amino acid and polymer matrix using cLIFT. For details see Experimental Section; rps=rounds per second.
On‐chip peptide synthesis using the cLIFT technology
We used the two amino acid derivatives Fmoc‐Pra‐OPfp 1 and Fmoc‐Gly‐OPfp 2 to synthesize all sixteen variants of the possible peptide tetramers in a microarray format. The commercially available 3D Fmoc‐NH‐β‐Ala‐PEGMA‐co‐MMA glass slides were used as acceptor slides for the peptide synthesis. Prior to the synthesis, the surface was functionalized with a PEG‐based spacer (for details, see Experimental Section and Supporting Information), followed by the cLIFT synthesis of two glycines. This increases the distance of the to‐be‐synthesized molecules from the solid support to make them more accessible for subsequent GBP interaction studies. After attachment of the spacers and Fmoc deprotection, the free amino groups were used as the starting point for peptide synthesis. Two donor slides, one containing Fmoc‐Pra‐OPfp 1 (B) and the other Fmoc‐Gly‐OPfp 2 (G), were employed to synthesize the sixteen tetrapeptide combinations of the two amino acids (synthesis on solid support starts from the C‐terminus, Figure 2, naming convention from N‐ to C‐terminus, for example, N‐GGGB‐C). For each amino acid layer, the laser transfer and the coupling reaction were performed three times to increase the synthesis yield and reduce potential deletion sequences. The coupling reaction, which forms the amide bond between the transferred amino acid and the solid support, was conducted in an oven under inert gas atmosphere at 90 °C. At this temperature, the glass‐transition temperature of the inert polymer matrix is exceeded, which enables diffusion and coupling of the amino acids within the polymer matrix spots. To ensure that each amino acid layer is repetitively transferred on top of the previous one, the acceptor slide was aligned on a positioning table by three mechanical springs and a vacuum fixation. This forces the acceptor slide always into the same position (Figure 6 and Supporting Information). The peptides were synthesized as three sets of quadruplicates on one array (the resulting binding intensity is the mean of 12 spots).
Figure 2.

Overview of the synthesized peptide tetramers. (A) Illustration of the acceptor slide with the tetrapeptide spot pattern created through cLIFT. Sixteen different tetrapeptides (1I‐1VIII and 2I‐2VIII) were synthesized from C‐ to N‐terminus using the two amino acids Fmoc‐Pra‐OPfp 1 (=B) and Fmoc‐Gly‐OPfp 2 (=G); naming convention from N‐to C‐terminus: N‐XXXX‐C‐(array surface), X=B/G. Each dashed square represents one sequence as quadruplicate spots. (B) Structures of the peptides according to the position of the squares.
Figure 6.

Lasing machine setup (cLIFT) showing the different components.
To assess the array synthesis quality, we first clicked in a carboxytetramethylrhodamine (TAMRA) azide fluorescent dye and analyzed the fluorescence intensity. For peptides containing one Pra (i.e., one dye molecule per scaffold), we observe highly similar staining intensities. This shows that the synthesis yield is comparable. Interestingly, for all other sequences with more than one Pra, we observe less intensity than in the latter case. This can be attributed to the FRET mechanism,22 causing self‐quenching of multiple adjacent dye molecules (see Figure 3). For more information, see Supporting Information.
Figure 3.

General reaction conditions for neo‐glycopeptide formation using CuAAC and theoretical spacing estimates in a simplified scaffold (for more information, see Supporting Information).
On‐chip CuAAC for neo‐glycopeptide formation
The copper(I)‐catalyzed alkyne‐azide cycloaddition (CuAAC) has previously been exploited to fabricate glycopolymers10c, 10e, 23 or to install glycans or glycoconjugates on a solid support.18a, 18d, 24 Here, we used the CuAAC to attach a small collection of azide‐functionalized saccharides onto the peptide tetramers (Figure 2) to form neo‐glycopeptides. The sugar azides 3–10 and 21 were synthesized from the unmodified monomer building blocks (see Figure 4 and supporting information).25 For each of the sugar azides, the CuAAC was performed on an individual array, using standard CuAAC conditions (Figure 3). We also approximated the theoretical spacing in a scaffold (see Supporting Information). Each array contains the peptide tetramer pattern shown in Figure 2 as three replicas, yielding a total of twelve neo‐glycopeptide replicas for each combination of sugar azide and peptide tetramer (three sets of quadruplicates).
Figure 4.

Fluorescence staining intensities of the respective sugar‐azide microarrays. (A, B) ConA (CF®633 labeled) staining was performed at a concentration of 100 μg mL−1 on different arrays with different sugar azides (3–8 are shown). Weaker (A) and stronger (B) binding ligands for ConA are shown in separate graphs. (C) Human langerin (FITC labeled) staining was performed at a concentration of 63 μg mL−1 on different arrays with different sugar azides (9, 10 are shown). The results show significant spacing‐, density‐, and ligand‐dependent binding effects. For more information, see Supporting Information.
Lectin binding assays, fluorescence scanning, and analysis
We generated neo‐glycopeptide arrays that result from the CuAAC between the mannose azides 3–6, glucose azides 7 and 8, galactose azide 21, and the peptide tetramer pattern shown in Figure 2. The arrays were incubated with fluorescently labeled concanavalin A (ConA), 100 μg mL−1 in HEPES‐buffer containing manganese and calcium ions. The galactose azide 21, as well as the plain peptides without any click modification served as negative controls (see Supporting Information).
The neo‐glycopeptides bearing the glucosamine (β‐GlcNTs) azide 9 and the human blood group B trisaccharide azide 10 respectively, were incubated with fluorescently labeled langerin, 63 μg mL−1 in HEPES‐buffer, containing calcium ions. As a negative control, we used glucose azide 7, as well as the plain peptides without any click modification (see Supporting Information).
A fluorescence scan was performed and the staining intensity was analyzed. In Figure 4 (A and B: ConA; C: langerin), for each microarray with the respective sugar azide, the fluorescence staining intensity is presented after lectin incubation. The bar charts show the mean values of the in total twelve spots (three sets of quadruplicate spots) for each neo‐glycopeptide (see Supporting Information).
General trends
We observed a strong spacing‐, density‐, and ligand‐dependent binding. Comparing the binding of the four monovalent scaffolds (GGGB, GGBG, GBGG, BGGG) with only one Pra (i.e., sugar) unit, we observe very similar binding for each compound/lectin combination. Thus, these ligands seem to offer similar binding strength, which confirms our initial results with the dye‐azide.
Furthermore, different ligands show large differences in binding strength and their spatial distance within the neo‐glycopeptide has a significant impact.
Concanavalin binders
According to literature, ConA should only bind to α‐Man 6 and α‐Glc 7, not to β‐Glc 8. For the following analysis of our results (Figure 4 A), we considered the binding signal of the poly‐glycine peptide GGGG as the background signal. Monovalent scaffolds of α‐Man bind about twofold stronger than α‐Glc. No significant binding to β‐Glc could be detected. However, ConA binding to α‐Man increases exponentially with linear increase in the number of sugars on the scaffold, which clearly indicates multivalent interaction: In comparison to monovalent α‐Man structures, divalent α‐Man scaffolds show a 7‐ to 17‐fold signal increase, trivalent scaffolds an 18‐ to 30‐fold, and the tetravalent a 37‐fold increase.
Comparing α‐Glc and α‐Man scaffolds, binding to divalent α‐Man >5‐fold higher than that to divalent α‐Glc. Tri‐ and tetravalent α‐Man scaffolds show a 7‐ to 10‐fold higher signal over the respective α‐Glc scaffolds.
In contrast to monovalent α‐Glc scaffolds, the binding to di‐, tri‐, and tetravalent α‐Glc scaffolds only increases 2‐ to 11‐fold. Especially for some divalent scaffolds with two directly adjacent Pra in the sequence (GGBB, GBBG, BBGG, theoretical spacing ≈2.1 nm), we observed an only two‐fold signal increase over the monovalent structures, indicating non‐multivalent interaction. Binding to multivalent β‐Glc scaffolds is generally very weak.
Furthermore, spacing plays an important role (see supporting information): Interestingly, scaffolds with two directly adjacent Pra in the sequence (GGBB, GBBG, BBGG, theoretical spacing ≈2.1 nm) show generally less binding, whereas non‐adjacent divalent structures (GBGB, BGGB, BGBG, theoretical spacing ≈0.7 nm and ≈2.3 nm) show stronger binding. Similarly, for trivalent binders, an intermittent glycine (BGBB, BBGB) increases the binding, in comparison to terminal glycines (GBBB, BBBG).
In addition, the orientation of the sugar‐azides on the scaffold also have an effect. According to our simple spacing model, the scaffolds GBGB and BGBG should theoretically show the same results due to similar spacing. Yet, the latter shows less binding, which may be caused by the opposite orientation of the sugars on the scaffold.
Next, introducing a C5 alkyl spacer between the azide and the anomeric position of a glycan significantly increases binding (α‐Man‐C5 3 vs. α‐Man 6; Figure 4 A vs. B). This alkyl spacer should increase the flexibility of the sugars on the scaffold, which makes it more accessible to the lectins. For monovalent α‐Man‐C5, we observe a 70‐fold increase in binding in comparison to monovalent α‐Man ligands, a ≈30‐fold for divalent, a ≈15‐fold for trivalent, and a ≈10‐fold increase for tetravalent ligands.
In comparison to monomannose 3, α‐1,6‐linked di‐mannoside 5 is a similarly good binder. Yet, only for the tetravalent scaffold, α‐1,6‐linked di‐mannoside is an even better binder. As already seen with α‐Man 6, we observe for both compounds 3 and 5 a very similar spacing effect on binding.
Finally, α‐1,2‐linked di‐mannoside 4 is our strongest observed binder for ConA. Only one dimer unit suffices to result in saturated binding at this ConA concentration. Due to saturation, further increase in valency has no effect.
Langerin binders
The tosylated glucosamine (β‐GlcNTs) 9 was found to be a selective and strong binder for langerin,25c while blood group B trisaccharide 10 is known for a weak affinity to langerin.26 We can confirm these results and see very similar effects of spacing and multivalent glycan display on the langerin binding as for the two ConA binders α‐Man 6 and α‐Glc 7.
K D,surf determination
To assess the surface dissociation constant of ConA to our scaffolds, we generated eight microarrays, all containing the neo‐glycopeptides based on mannose azide 3. We incubated them with a dilution series (45–5760 nm) of fluorescently labeled ConA in a HEPES‐buffer containing manganese and calcium ions, to determine the K D,surf values for each of the sixteen neo‐glycopeptides. The result of the fluorescence scan is shown in Figure 5. The fluorescence intensity for all ConA concentrations is plotted against the respective peptide sequences. The curves follow the same binding trends as described above for monomannose 3 in Figure 4 for all the applied ConA concentrations. Using the data shown in Figure 5, we determined the surface dissociation constant K D,surf for the different neo‐glycopeptides (Table 1) by using a nonlinear curve fitting approach. With increasing number of mannose units on the peptide, the binding strength of ConA increases, leading to smaller K D,surf values due to multivalency effects. The synthesized neo‐glycopeptides reach dissociation constants in the low micromolar range between ≈1 μm −4 μm. In the literature, different dissociation constants K D,surf have been reported. They are highly dependent on the usually not well‐defined multivalent interaction and range from the micromolar to the low nanomolar range.27 Often, it is reported to be about ≈200 nm, whereas we observed a five times lower value. We believe that this is mainly due to the protein resistance of the PEGMA‐co‐MMA functionalized glass slides for our microarray synthesis, which are known to be protein resistant.28 Only by introducing a poly(ethylene glycol)3‐spacer on these surfaces prior to the peptide scaffold synthesis, we could observe sufficient binding of ConA. Spacers and surface functionalization are known to sometimes have significant effects on lectin binding.29
Figure 5.
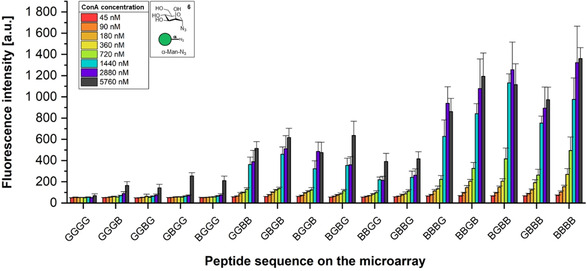
Fluorescence intensities (arbitrary units) of the neo‐glycopeptides (containing mannose azide 3) on the microarray (compare Figure 2) after incubation with CF®633 ConA at various concentrations. The strongest binding is achieved with the peptide, offering the highest number of mannoses. Fluorescence images can be found in the supporting information.
Table 1.
Determined K D,surf values for the neo‐glycopeptides shown in Figure 5.[a]
|
Entry |
Neo‐glycopeptide |
Number of α‐mannose 3 |
K D,surf [μm] |
|---|---|---|---|
|
1 |
GGGG |
0 |
NB[b] |
|
2 |
GGGB |
1 |
3.44±0.56[c] |
|
3 |
GGBG |
1 |
3.56±0.50[c] |
|
4 |
GBGG |
1 |
3.93±0.74[c] |
|
5 |
BGGG |
1 |
3.84±0.52[c] |
|
6 |
GGBB |
2 |
1.15±0.08 |
|
7 |
GBGB |
2 |
1.11±0.10 |
|
8 |
BGGB |
2 |
1.21±0.13 |
|
9 |
BGBG |
2 |
1.41±0.12 |
|
10 |
BBGG |
2 |
1.48±0.18 |
|
11 |
GBBG |
2 |
1.40±0.13 |
|
12 |
BBBG |
3 |
1.16±0.07 |
|
13 |
BBGB |
3 |
1.08±0.09 |
|
14 |
BGBB |
3 |
0.93±0.42[d] |
|
15 |
GBBB |
3 |
1.04±0.07 |
|
16 |
BBBB |
4 |
0.99±0.07 |
[a] For the fitting curves see supporting information. [b] Since no sugar unit is present on this peptide, no binding of ConA can occur. NB=no binding. [c] Hypothetical fit values, since saturation was not reached (see supporting information). [d] A different fit model had to be used (standard model did not converge), causing a larger standard deviation.
Conclusions
We have developed a flexible and facile approach to synthesize glycan microarrays for multivalent display. By synthesizing different peptides directly on‐chip as scaffolds in the microarray format, we can attach different azido‐sugars or other azido‐functionalized molecules. This protocol circumvents the cumbersome pre‐synthesis of individual multivalent scaffolds in multistep syntheses.
With these glycan microarrays, we observed that the binding of the lectins to different ligands is dependent on spacing and density. ConA binds strongly to α‐mannose compounds 3–6, with the strongest binding to α‐1,2‐linked di‐mannose 4. With our standard concentration, the binding to 4 already plateaued for monovalent scaffolds, whereas additional ligands on a scaffold did not increase its binding strength. Human langerin binds strongly to the β‐GlcNTs azide 9, strongly depending on the number of ligands. Moreover, it also binds to the human blood group B trisaccharide azide 10, but in a much less spacing‐ and valency‐dependent manner.
One current limitation of this approach is the synthesis surface: Since we used PEGMA‐co‐MMA functionalized glass slides for our arrays, which are known to be protein resistant,28 we had to introduce a PEG‐spacer on the surface. Only then, we could observe significant binding of ConA. In a recent study, lectin interactions regarding different glycan array surface coatings, linkers/spacers, and densities were compared.29 A strong impact of α‐Man density on ConA binding was observed, while many other lectin–glycan interactions did not show this dependency.
Besides the glass surface coating, also the molecular orientation on the scaffold has an impact on the multivalent display: The theoretical spacing between the two scaffolds BGBG and GBGB should be similar, yet, the binding strength differs, likely due to opposite orientation on the scaffold. In the future, we want to investigate this with molecular dynamics simulations. Furthermore, we also want to test different commercially available surfaces, which can offer better properties for probing weakly interacting binders. In addition, larger and longer scaffolds should increase the binding even further.
To our knowledge, this is the first time that multivalent glycan scaffolds with molecularly defined valency, length, and spacing have been synthesized directly on‐chip. Since the technology is also available as a low‐budget system, it can be employed by almost every laboratory in the world.21b In the future, our laser‐based synthesis approach will be automated with a robot.30 This will allow for an easy incorporation of additional building blocks to synthesize diverse peptide‐based scaffolds to generate diverse arrays of glycopeptides. We believe that the results are valuable for the design and preparation of multivalent carbohydrate microarrays and their application for functional studies of glycan binding proteins and pathogen binding. We expect that with this approach, we can generate a multitude of different multivalent neo‐glycopeptides, combining natural and synthetic amino acids with different glycan structures.
Experimental Section
Preparation of the donor and acceptor slides
Donor slide preparation: Microscope glass slides (Marienfeld Superior, Lauda‐Königshofen/Baden‐Württemberg, Germany; size 76×26×1 mm, ground edges, pure white glass) were covered on one side with self‐adhesive polyimide foil (Kapton, DuPont, USA; CMC Klebetechnik GmbH, Frankenthal/Rheinland‐Pfalz, Germany; thickness of polyimide layer approx. 25 μm, thickness of glue layer approx. 45 μm). The transfer material was spin coated at 80 rps on top of the polyimide foil, using a spin coater device (Schaefer Technologie GmbH, Langen/Hessen, Germany; KLM Spin‐Coater SCC‐200). Different spin coating solutions were prepared. Therefore, 3.00 mg of the l‐amino acid building block pentafluorophenyl (OPfp)‐activated Fmoc‐Gly‐OPfp 2 and 27.0 mg of inert polymer matrix (SLEC PLT 7552, Sekisui Chemical GmbH, Düsseldorf/Nordrhein‐Westfalen, Germany) were dissolved in a mixture of 450 μL DCM and 50 μL DMF. In case of the non‐activated Fmoc‐Pra‐OH, a solution containing 2.17 mg of l‐amino acid, 27.0 mg of inert polymer matrix, 1.00 μL DIC, and 1.19 mg PfpOH in a mixture of 450 μL DCM and 50 μL DMF was applied, which forms the desired Fmoc‐Pra‐OPfp 1 in situ (see Supporting Information).
Acceptor slides: The 3D Fmoc‐NH‐β‐Ala‐PEGMA‐co‐MMA glass slides (25 nm thick coating, loading of functional groups 1 nmol cm−2, estimated functional group spacing of 7–10 nm) were acquired from PEPperPRINT GmbH (Heidelberg/Baden‐Württemberg, Germany). For the on‐chip synthesis of the peptide tetramers, the slides were initially modified with a PEG‐based spacer as shown in the supporting information, to improve the accessibility of the surface bound molecules for the lectins.
cLIFT machine setup
We use a laser system, consisting of a 200 mW TOPTICA iBeam smart 488‐S laser with a wavelength of 488 nm (TOPTICA Photonics AG, Gräfelfing/Bayern, Germany), which is passed through a 1:10 beam expander and a Racoon 11 laser scanning system (ARGES GmbH, Wackersdorf/Bayern, Germany), equipped with an f‐Theta‐lens (S4LFT5110/322, Sill Optics GmbH, Wendelstein/Bayern, Germany). This setup facilitates to scan the focus of the laser beam in a 66 mm×66 mm plane, which enables reproducible irradiation of a surface at various positions for a high‐quality cLIFT process (Figure 6). The slide holder table (lasing area) is equipped with three mechanical springs and a vacuum mechanism to ensure the same alignment of the acceptor slide when placing it in the holder.
cLIFT technique parameters
For the arrays with a pitch of 250 μm, we used 60 % laser power and a pulse duration of 6 ms per spot. The resulting spot diameter is about 150 μm.
General cLIFT process
The cLIFT process is conducted in the lasing area as seen in Figure 6. Therefore, the acceptor slide is placed on the slide holder with the functionalized side facing upwards. The donor slide is placed on top of the acceptor slide with the spin coated side facing down. When the donor slide is irradiated with the laser beam, the light passes through the microscope glass slide and hits the polyimide foil. The polyimide foil expands, hits the acceptor slide and, thereby, transfers small amounts of the inert polymer matrix32 with the activated amino acid as a tiny spot onto the acceptor slide.
General on‐chip synthesis of peptides using cLIFT
After initial preparation of the donor and acceptor surfaces, our current protocol for the synthesis of 4‐mer peptide (scaffold) arrays comprises 12 synthesis steps. One step for each peptide chain elongation (four), which we repeated three times to increase the coupling yield. Including more building blocks is simple and does not require significantly more time.
Peptide array synthesis: The commercially available 3D Fmoc‐NH‐β‐Ala‐PEGMA‐co‐MMA glass slide (PEPperPRINT GmbH, Heidelberg/Baden‐Württemberg, Germany) was used as the acceptor slide for the peptide synthesis. Before starting the actual synthesis of the peptides, the whole slide was first functionalized with a PEG ((EG)3) ‐based spacer (≈17 Å length, see supporting information), leading to free amino groups on the surface. Without this spacer, lectin binding is too weak for detection. The first layer of OPfp‐activated and Fmoc‐protected amino acids was transferred via cLIFT using two different donor slides to create a combinatorial pattern on the acceptor slide. The coupling reaction was accomplished by heating the slide in an oven under inert gas atmosphere at 90 °C for 1 h. Subsequently, the slide was washed with acetone (2×2 min in a petri dish on a shaker) and dried in a jet of air. The cLIFT transfer of the same amino acid pattern, the coupling step, and the washing procedure were repeated twice. Free remaining amino groups on the slide were capped (acetylated) by immersing the slide in 10 mL of capping solution (20 % DIPEA and 10 % acetic anhydride in DMF), first for 2 min in an ultrasonic bath and then for 30 min on a shaker. The capping solution was replaced by a freshly prepared one and shaking was continued for an additional 30 min. The slide was washed consecutively with DMF (3×5 min), MeOH (1×2 min), DCM (1×1 min), and dried in a jet of air. Terminal Fmoc‐groups were removed by immersing the slide in 10 mL of Fmoc‐deprotection solution (20 % piperidine in DMF) for 20 min on a shaker. The slide was washed consecutively with DMF (3×5 min), MeOH (1×2 min), DCM (1×1 min), and dried in a jet of air. For subsequent layers of amino acids, the whole process was repeated for each pattern to synthesize the desired peptides.
In case of the last amino acid within the peptide chain, the Fmoc‐removal was accomplished before the capping step to have an acetyl group at the N‐terminus instead of a bulky Fmoc‐protecting group.
Synthesis of the sugar azides
The human blood group B trisaccharide 10 was obtained by enzymatic synthesis, compounds 3–9 and 21 were synthesized starting from the unprotected monosaccharides as shown in the supporting information.
General on‐chip copper(I)‐catalyzed alkyne‐azide cycloaddition (CuAAC)
CuSO4 (530 μg, 3.36 μmol, 2.00 equiv) and sodium ascorbate (998 μg, 5.04 μmol, 3.00 equiv) were added to a mixture of 100 μL DMSO and 100 μL water in a vial. The vial was shaken for 5 min and, afterwards, the precipitate was centrifuged and the remaining solution was passed through a syringe filter (0.2 μm, polypropylene). The sugar azide (1.68 μmol, 1.00 equiv) was dissolved in this solution and then applied on the acceptor surface (c=8.4 μmol mL−1). For the incubation, we used a 16‐well format incubation chamber (PEPperPRINT GmbH, Heidelberg/Baden‐Württemberg, Germany). The prepared solution (200 μL) was poured in one of the wells and then shaken overnight in the dark. The slide was washed with water (1×30 min) in a petri dish on a shaker and dried in a jet of air.
Concanavalin A (ConA) binding assay
Before starting the lectin incubation, the acceptor slide was first incubated with a blocking buffer for fluorescence scanning (Rockland, USA, MB‐070). For the blocking step, we used a 16‐well format incubation chamber (PEPperPRINT GmbH, Heidelberg/Baden‐Württemberg, Germany) and for each well 250 μL of the blocking buffer were applied. The blocking step was done on a shaker for 30 min. After the blocking step, the incubation with the fluorescently labeled ConA lectin (Biotium, Inc., USA, CF®633 ConA) was accomplished. Therefore, the lectin was dissolved in a HEPES‐buffer (50 mm HEPES, 100 mm NaCl, 1 mm CaCl2, 1 mm MnCl2, 10 % blocking buffer, 0.05 % Tween‐20, pH 7.5) at a concentration of 100 μg mL−1. For one well, 200 μL of this solution were applied. The incubation took place for 1 h on a shaker, protected from light. The slide was washed in the wells of the incubation chamber with PBS‐T (3×300 μL for 5 min) and then the whole glass slide was dipped into a TRIS buffer (1 mm TRIS, pH 7.4), to remove salt residues. The slide was dried in a jet of air and fluorescence scanning was used to detect the lectin binding.
Langerin binding assay
The acceptor slide was pre‐swelled in PBS‐T for 15 min on a shaker in a petri dish. Before starting the lectin incubation, the acceptor slide was first incubated with a blocking buffer for fluorescence scanning (Rockland, Limerick/Pennsylvania, USA; blocking buffer for fluorescent western blotting MB‐070). For the blocking step, we used a 16‐well format incubation chamber (PEPperPRINT GmbH, Heidelberg/Baden‐Württemberg, Germany) and for each well 250 μL of the blocking buffer were applied. The blocking step was done on a shaker for 30 min. After the blocking step, the incubation with the FITC‐labeled human langerin ECD (recombinantly expressed as described previously32) was accomplished. Therefore, the lectin was dissolved in a HEPES‐buffer (50 mm HEPES, 100 mm NaCl, 10 mm CaCl2, 1 mm MnCl2, 10 % blocking buffer, 0.05 % Tween‐20, pH 7.5) at a concentration of 63 μg mL−1. For one well, 200 μL of this solution were applied. The incubation took place for 1 h on a shaker protected from light. The slide was washed in the wells of the incubation chamber with PBS‐T (3×200 μL for 5 min) and then the whole glass slide was dipped into a TRIS buffer (1 mm TRIS, pH 7.4), to remove salt residues. The slide was dried in a jet of air and fluorescence scanning was used to detect the lectin binding.
Fluorescence scan
The fluorescence scan of the CF®633 ConA labeled neo‐glycopeptides and the TAMRA labeled peptides were done on the high resolution microarray scanner GenePix 4000B (Molecular Devices, Sunnyvale/California, USA), using an excitation wavelength of 635 nm or 532 nm at 5 μm resolution, while the fluorescence scan of the FITC‐langerin labeled neo‐glycopeptides was done on the high resolution microarray scanner GenePix 4300A (Molecular Devices, Sunnyvale/California, USA) using an excitation wavelength of 488 nm at 5 μm resolution. For the analysis of the fluorescence images, we used the analysis software GenePix Pro 6.0 (Molecular Devices, Sunnyvale/California, USA). For the spots a circular shape was defined.
Synthesis and analysis of neo‐glycopeptides (consisting of propargylglycine and glycine) regarding multivalency effects
The peptide tetramers (Figure 2), consisting of propargylglycine and glycine, were synthesized according to the general on‐chip synthesis of peptides using cLIFT. Therefore, two donor slides were manufactured, one embedding Fmoc‐Pra‐OPfp 1 and the other one Fmoc‐Gly‐OPfp 2. The sugar azides 3–10, and 21 were then clicked to the alkyne side chains, following the general on‐chip copper(I)‐catalyzed alkyne–azide cycloaddition (CuAAC). For each of the sugar azides, the reaction was performed in a separate cavity of a 16‐well format incubation chamber on the microarray. Each cavity contains the peptide tetramer pattern shown in Figure 2 as three replicas, yielding a total of twelve neo‐glycopeptide replicas for each combination of a single sugar azide and one peptide tetramer (three sets of quadruplicates). To detect multivalency effects, the neo‐glycopeptides resulting from the mannose azides 3–6, glucoses 7 and 8 (and galactose 21 as a negative control) were incubated with fluorescently labeled ConA, using the above described ConA binding assay (16‐well format incubation chamber) and the ones synthesized with the sugar azides 9 and 10 (and glucose 7 as a negative control) were incubated with fluorescently labeled langerin following the above described langerin binding assay. Consequently, for each neo‐glycopeptide, twelve separate spots were generated on the microarray slide. After fluorescence scanning, the median of the fluorescence intensity was determined for each spot, using the microarray analysis software GenePix Pro 6.0. For each set of twelve medians, the mean value was calculated, where spot values that deviate more than 40 % from the mean were omitted from the calculation (very few values were omitted). In case of the langerin binding, the GGGG sequence, where no sugar unit is present on the peptide, was used as the background signal and was subtracted from all other values.
K D,surf determination experiments
The K D,surf values were calculated for the binding of the CF®633 ConA lectin to the neo‐glycopeptides (tetramers), containing the α‐mannopyranosyl residue 6. The peptide tetramers (Figure 2) consisting of propargylglycine and glycine were synthesized according to the general on‐chip synthesis of peptides using cLIFT. Therefore, two donor slides were manufactured, one embedding Fmoc‐Pra‐OPfp 1 and the other one Fmoc‐Gly‐OPfp 2. The mannose azide 6 was then clicked to the alkyne side chains, following the general on‐chip copper(I)‐catalyzed alkyne–azide cycloaddition (CuAAC). The concanavalin A (ConA) binding assay was then performed using different concentrations of the lectin (45 nm, 90 nm, 180 nm, 360 nm, 720 nm, 1440 nm, 2880 nm, and 5760 nm). The CuAAC as well as the binding assay were done in a 16‐well format incubation chamber. For each peptide and each concentration, twelve separated spots were generated on the microarray slide. After fluorescence scanning, the median of the fluorescence intensity was determined for each spot, using the microarray analysis software GenePix Pro 6.0. For each set of twelve medians, the mean value was then calculated, where spot values that deviate more than 40 % from the mean were omitted from the calculation (very few values were omitted, only for high ConA concentrations, where ConA precipitated). The results were plotted against the different peptide sequences on the microarray slide for each ConA concentration. The K D,surf values were determined by plotting the means for each peptide sequence against the concentration on a logarithmic scale. Then a nonlinear curve (Category: Growth/Sigmoidal; function: DoseResp; iteration algorithm: Levenberg (except BGBB, using Orthogonal Distance Regression (Pro), showing higher standard deviation)) was fitted and the K D,surf values were calculated using the software Origin 2019 (OriginLab, Northhampton/Massachusetts, USA).
Conflict of interest
F.F.L. is named on a patent application regarding the laser‐based synthesis of peptide microarrays.
Biographical Information
Felix Loeffler studied physics and received his doctorate in physics and biochemistry from the University of Heidelberg and the German Cancer Research Center. After his postdoctoral research at the Karlsruhe Institute of Technology (KIT), Germany, and UC Berkeley, USA, in engineering, infectious disease research, and biochemistry, he became a young investigator at KIT in 2015. Since 2017, he heads a multidisciplinary research group at the Max Planck Institute of Colloids and Interfaces in Potsdam, Germany. His research is currently focused on chemical and materials synthesis technologies.

Supporting information
As a service to our authors and readers, this journal provides supporting information supplied by the authors. Such materials are peer reviewed and may be re‐organized for online delivery, but are not copy‐edited or typeset. Technical support issues arising from supporting information (other than missing files) should be addressed to the authors.
Supplementary
Acknowledgements
This research was supported by the German Federal Ministry of Education and Research [BMBF, grant number 13XP5050A], the MPG‐FhG cooperation [Glyco3Display], and the Max Planck Society.
M. Mende, A. Tsouka, J. Heidepriem, G. Paris, D. S. Mattes, S. Eickelmann, V. Bordoni, R. Wawrzinek, F. F. Fuchsberger, P. H. Seeberger, C. Rademacher, M. Delbianco, A. Mallagaray, F. F. Loeffler, Chem. Eur. J. 2020, 26, 9954.
References
- 1. Wang D., Liu S., Trummer B. J., Deng C., Wang A., Nat. Biotechnol. 2002, 20, 275–281. [DOI] [PubMed] [Google Scholar]
- 2.
- 2a. Geissner A., Seeberger P. H., Annu. Rev. Anal. Chem. 2016, 9, 223–247; [DOI] [PubMed] [Google Scholar]
- 2b. Rillahan C. D., Paulson J. C., Annu. Rev. Biochem. 2011, 80, 797–823. [DOI] [PMC free article] [PubMed] [Google Scholar]
- 3.
- 3a. Wang Z., Chinoy Z. S., Ambre S. G., Peng W., McBride R., de Vries R. P., Glushka J., Paulson J. C., Boons G.-J., Science 2013, 341, 379; [DOI] [PMC free article] [PubMed] [Google Scholar]
- 3b. Ruprecht C., Bartetzko M. P., Senf D., Dallabernadina P., Boos I., Andersen M. C. F., Kotake T., Knox J. P., Hahn M. G., Clausen M. H., Pfrengle F., Plant Physiol. 2017, 175, 1094; [DOI] [PMC free article] [PubMed] [Google Scholar]
- 3c. Brzezicka K., Echeverria B., Serna S., van Diepen A., Hokke C. H., Reichardt N.-C., ACS Chem. Biol. 2015, 10, 1290–1302. [DOI] [PubMed] [Google Scholar]
- 4.
- 4a. Li R. J. E., van Vliet S. J., van Kooyk Y., Curr.Opin. Biotechnol. 2018, 51, 24–31; [DOI] [PubMed] [Google Scholar]
- 4b. Geissner A., Anish C., Seeberger P. H., Current Opin. Chem. Biol. 2014, 18, 38–45; [DOI] [PubMed] [Google Scholar]
- 4c. Lepenies B., Seeberger P. H., Immunopharmacol. Immunotoxicol. 2010, 32, 196–207. [DOI] [PubMed] [Google Scholar]
- 5.
- 5a. Lundquist J. J., Toone E. J., Chem. Rev. 2002, 102, 555–578; [DOI] [PubMed] [Google Scholar]
- 5b. Jiménez Blanco J. L., Ortiz Mellet C., García Fernández J. M., Chem. Soc. Rev. 2013, 42, 4518–4531; [DOI] [PubMed] [Google Scholar]
- 5c. Fasting C., Schalley C. A., Weber M., Seitz O., Hecht S., Koksch B., Dernedde J., Graf C., Knapp E.-W., Haag R., Angew. Chem. Int. Ed. 2012, 51, 10472–10498; [DOI] [PubMed] [Google Scholar]; Angew. Chem. 2012, 124, 10622–10650. [Google Scholar]
- 6. Dubacheva G. V., Araya-Callis C., Volbeda A. G., Fairhead M., Codee J., Howarth M., Richter R. P., J. Am. Chem. Soc. 2017, 139, 4157–4167. [DOI] [PMC free article] [PubMed] [Google Scholar]
- 7. Mende M., Bordoni V., Tsouka A., Loeffler F. F., Delbianco M., Seeberger P. H., Faraday Disc. 2019, 219, 9–32. [DOI] [PubMed] [Google Scholar]
- 8.
- 8a. Doores K. J., Gamblin D. P., Davis B. G., Chem. Eur. J. 2006, 12, 656–665; [DOI] [PubMed] [Google Scholar]
- 8b. Imberty A., Chabre Y. M., Roy R., Chem. Eur. J. 2008, 14, 7490–7499; [DOI] [PubMed] [Google Scholar]
- 8c. Kitov P. I., Sadowska J. M., Mulvey G., Armstrong G. D., Ling H., Pannu N. S., Read R. J., Bundle D. R., Nature 2000, 403, 669–672. [DOI] [PubMed] [Google Scholar]
- 9.
- 9a. Delbianco M., Bharate P., Varela-Aramburu S., Seeberger P. H., Chem. Rev. 2016, 116, 1693–1752; [DOI] [PubMed] [Google Scholar]
- 9b. Pieters R. J., Org. Biomol. Chem. 2009, 7, 2013–2025; [DOI] [PubMed] [Google Scholar]
- 9c. Payne R. J., Wong C.-H., Chem. Commun. 2010, 46, 21–43. [DOI] [PubMed] [Google Scholar]
- 10.
- 10a. Wojcik F., O'Brien A. G., Götze S., Seeberger P. H., Hartmann L., Chem. Eur. J. 2013, 19, 3090–3098; [DOI] [PubMed] [Google Scholar]
- 10b. Wojcik F., Lel S., O'Brien A. G., Seeberger P. H., Hartmann L., Beilstein J. Org. Chem. 2013, 9, 2395–2403; [DOI] [PMC free article] [PubMed] [Google Scholar]
- 10c. Ponader D., Maffre P., Aretz J., Pussak D., Ninnemann N. M., Schmidt S., Seeberger P. H., Rademacher C., Nienhaus G. U., Hartmann L., J. Am. Chem. Soc. 2014, 136, 2008–2016; [DOI] [PubMed] [Google Scholar]
- 10d. Wittmann V., Seeberger S., Angew. Chem. Int. Ed. 2000, 39, 4348–4352; [DOI] [PubMed] [Google Scholar]; Angew. Chem. 2000, 112, 4508–4512; [Google Scholar]
- 10e. Ponader D., Wojcik F., Beceren-Braun F., Dernedde J., Hartmann L., Biomacromolecules 2012, 13, 1845–1852. [DOI] [PubMed] [Google Scholar]
- 11.
- 11a. Valles D., Naeem Y., Rozenfeld A., Aldasooky R., Wong A., Carbonell C., Mootoo D. R., Braunschweig A., Faraday Discuss. 2019, 219, 77–89; [DOI] [PMC free article] [PubMed] [Google Scholar]
- 11b. Kim H. S., Hyun J. Y., Park S.-H., Shin I., RSC Adv. 2018, 8, 14898–14905. [DOI] [PMC free article] [PubMed] [Google Scholar]
- 12.
- 12a. Wang L., Cummings R. D., Smith D. F., Huflejt M., Campbell C. T., Gildersleeve J. C., Gerlach J. Q., Kilcoyne M., Joshi L., Serna S., Reichardt N.-C., Parera Pera N., Pieters R. J., Eng W., Mahal L. K., Glycobiology 2014, 24, 507–517; [DOI] [PMC free article] [PubMed] [Google Scholar]
- 12b. Liang P.-H., Wang S.-K., Wong C.-H., J. Am. Chem. Soc. 2007, 129, 11177–11184; [DOI] [PubMed] [Google Scholar]
- 12c. Broecker F., Seeberger P. H., Small Molecule Microarrays: Methods and Protocols (Eds.: M. Uttamchandani, S. Q. Yao), Springer New York, New York, 2017, pp. 227–240; [Google Scholar]
- 12d. Zhang Y., Li Q., Rodriguez L. G., Gildersleeve J. C., J. Am. Chem. Soc. 2010, 132, 9653–9662; [DOI] [PMC free article] [PubMed] [Google Scholar]
- 12e. Liang C.-H., Wang S.-K., Lin C.-W., Wang C.-C., Wong C.-H., Wu C.-Y., Angew. Chem. 2011, 123, 1646–1650. [Google Scholar]
- 13. Kilcoyne M., Gerlach J. Q., Gough R., Gallagher M. E., Kane M., Carrington S. D., Joshi L., Anal. Chem. 2012, 84, 3330–3338. [DOI] [PubMed] [Google Scholar]
- 14.
- 14a. Willats W. G. T., Rasmussen S. E., Kristensen T., Mikkelsen J. D., Knox J. P., Proteomics 2002, 2, 1666–1671; [DOI] [PubMed] [Google Scholar]
- 14b. Angeloni S., Ridet J. L., Kusy N., Gao H., Crevoisier F., Guinchard S., Kochhar S., Sigrist H., Sprenger N., Glycobiology 2004, 15, 31–41; [DOI] [PubMed] [Google Scholar]
- 14c. Tian X., Pai J., Shin I., Chem. Asian J. 2012, 7, 2052–2060; [DOI] [PubMed] [Google Scholar]
- 14d. Manimala J. C., Roach T. A., Li Z., Gildersleeve J. C., Angew. Chem. Int. Ed. 2006, 45, 3607–3610; [DOI] [PubMed] [Google Scholar]; Angew. Chem. 2006, 118, 3689–3692; [Google Scholar]
- 14e. Manimala J. C., Li Z., Jain A., VedBrat S., Gildersleeve J. C., ChemBioChem 2005, 6, 2229–2241; [DOI] [PubMed] [Google Scholar]
- 14f. Adams E. W., Ueberfeld J., Ratner D. M., O'Keefe B. R., Walt D. R., Seeberger P. H., Angew. Chem. Int. Ed. 2003, 42, 5317–5320; [DOI] [PubMed] [Google Scholar]; Angew. Chem. 2003, 115, 5475–5478; [Google Scholar]
- 14g. Walz A., Odenbreit S., Mahdavi J., Borén T., Ruhl S., Glycobiology 2005, 15, 700–708; [DOI] [PubMed] [Google Scholar]
- 14h. Tateno H., Mori A., Uchiyama N., Yabe R., Iwaki J., Shikanai T., Angata T., Narimatsu H., Hirabayashi J., Glycobiology 2008, 18, 789–798; [DOI] [PubMed] [Google Scholar]
- 14i. de Boer A. R., Hokke C. H., Deelder A. M., Wuhrer M., Glycoconjugate J. 2008, 25, 75–84. [DOI] [PubMed] [Google Scholar]
- 15.
- 15a. Zhou X., Turchi C., Wang D., J. Proteome Res. 2009, 8, 5031–5040; [DOI] [PMC free article] [PubMed] [Google Scholar]
- 15b. Fukuda T., Onogi S., Miura Y., Thin Solid Films 2009, 518, 880–888; [Google Scholar]
- 15c. Branderhorst H. M., Ruijtenbeek R., Liskamp R. M. J., Pieters R. J., ChemBioChem 2008, 9, 1836–1844; [DOI] [PubMed] [Google Scholar]
- 15d. Parera Pera N., Branderhorst H. M., Kooij R., Maierhofer C., van der Kaaden M., Liskamp R. M. J., Wittmann V., Ruijtenbeek R., Pieters R. J., ChemBioChem 2010, 11, 1896–1904. [DOI] [PubMed] [Google Scholar]
- 16.
- 16a. Ciobanu M., Huang K.-T., Daguer J.-P., Barluenga S., Chaloin O., Schaeffer E., Mueller C. G., Mitchell D. A., Winssinger N., Chem. Commun. 2011, 47, 9321–9323; [DOI] [PubMed] [Google Scholar]
- 16b. Huang K.-T., Gorska K., Alvarez S., Barluenga S., Winssinger N., ChemBioChem 2011, 12, 56–60; [DOI] [PubMed] [Google Scholar]
- 16c. Gorska K., Huang K.-T., Chaloin O., Winssinger N., Angew. Chem. Int. Ed. 2009, 48, 7695–7700; [DOI] [PubMed] [Google Scholar]; Angew. Chem. 2009, 121, 7831–7836; [Google Scholar]
- 16d. Kielar C., Reddavide F. V., Tubbenhauer S., Cui M., Xu X., Grundmeier G., Zhang Y., Keller A., Angew. Chem. 2018, 130, 15089–15093; [DOI] [PubMed] [Google Scholar]
- 16e. Hawkes W., Huang D., Reynolds P., Hammond L., Ward M., Gadegaard N., Marshall J. F., Iskratch T., Palma M., Faraday Disc. 2019, 219, 203–219. [DOI] [PubMed] [Google Scholar]
- 17. Moni L., Pourceau G., Zhang J., Meyer A., Vidal S., Souteyrand E., Dondoni A., Morvan F., Chevolot Y., Vasseur J.-J., Marra A., ChemBioChem 2009, 10, 1369–1378. [DOI] [PubMed] [Google Scholar]
- 18.
- 18a. Godula K., Rabuka D., Nam K. T., Bertozzi C. R., Angew. Chem. Int. Ed. 2009, 48, 4973–4976; [DOI] [PMC free article] [PubMed] [Google Scholar]; Angew. Chem. 2009, 121, 5073–5076; [Google Scholar]
- 18b. Godula K., Bertozzi C. R., J. Am. Chem. Soc. 2012, 134, 15732–15742; [DOI] [PMC free article] [PubMed] [Google Scholar]
- 18c. Godula K., Bertozzi C. R., J. Am. Chem. Soc. 2010, 132, 9963–9965; [DOI] [PMC free article] [PubMed] [Google Scholar]
- 18d. Zilio C., Bernardi A., Palmioli A., Salina M., Tagliabue G., Buscaglia M., Consonni R., Chiari M., Sensors and Actuators B: Chemical 2015, 215, 412–420. [Google Scholar]
- 19. Ban L., Mrksich M., Angew. Chem. Int. Ed. 2008, 47, 3396–3399; [DOI] [PubMed] [Google Scholar]; Angew. Chem. 2008, 120, 3444–3447. [Google Scholar]
- 20. Bian S., Zieba S. B., Morris W., Han X., Richter D. C., Brown K. A., Mirkin C. A., Braunschweig A. B., Chem. Sci. 2014, 5, 2023–2030. [DOI] [PMC free article] [PubMed] [Google Scholar]
- 21.
- 21a. Loeffler F. F., Foertsch T. C., Popov R., Mattes D. S., Schlageter M., Sedlmayr M., Ridder B., Dang F.-X., von Bojničić-Kninski C., Weber L. K., Fischer A., Greifenstein J., Bykovskaya V., Buliev I., Bischoff F. R., Hahn L., Meier M. A. R., Bräse S., Powell A. K., Balaban T. S., Breitling F., Nesterov-Mueller A., Nat. Commun. 2016, 7, 11844; [DOI] [PMC free article] [PubMed] [Google Scholar]
- 21b. Eickelmann S., Tsouka A., Heidepriem J., Paris G., Zhang J. F., Molinari V., Mende M., Loeffler F. F., Adv. Mater. Technol. 2019, 4, 1900503. [Google Scholar]
- 22. Shiba A., Kinoshita-Kikuta E., Kinoshita E., Koike T., Sensors 2017, 17, 1877. [DOI] [PMC free article] [PubMed] [Google Scholar]
- 23. Pérez-Balderas F., Ortega-Muñoz M., Morales-Sanfrutos J., Hernández-Mateo F., Calvo-Flores F. G., Calvo-Asín J. A., Isac-García J., Santoyo-González F., Org. Lett. 2003, 5, 1951–1954. [DOI] [PubMed] [Google Scholar]
- 24. Bian S., He J., Schesing K. B., Braunschweig A. B., Small 2012, 8, 2000–2005. [DOI] [PubMed] [Google Scholar]
- 25.
- 25a. Kang B., Okwieka P., Schöttler S., Winzen S., Langhanki J., Mohr K., Opatz T., Mailänder V., Landfester K., Wurm F. R., Angew. Chem. Int. Ed. 2015, 54, 7436–7440; [DOI] [PubMed] [Google Scholar]; Angew. Chem. 2015, 127, 7544–7548; [Google Scholar]
- 25b. Patel M. K., Vijayakrishnan B., Koeppe J. R., Chalker J. M., Doores K. J., Davis B. G., Chem. Commun. 2010, 46, 9119–9121; [DOI] [PubMed] [Google Scholar]
- 25c. Wamhoff E.-C., Schulze J., Bellmann L., Rentzsch M., Bachem G., Fuchsberger F. F., Rademacher J., Hermann M., Del Frari B., van Dalen R., Hartmann D., van Sorge N. M., Seitz O., Stoitzner P., Rademacher C., ACS Cent. Sci. 2019, 5, 808–820. [DOI] [PMC free article] [PubMed] [Google Scholar]
- 26. Feinberg H., Powlesland A. S., Taylor M. E., Weis W. I., J. Biol. Chem. 2010, 285, 13285–13293. [DOI] [PMC free article] [PubMed] [Google Scholar]
- 27.
- 27a. Smith E. A., Thomas W. D., Kiessling L. L., Corn R. M., J. Am. Chem. Soc. 2003, 125, 6140–6148; [DOI] [PubMed] [Google Scholar]
- 27b. Pandey B., Tan Y. H., Fujikawa K., Demchenko A. V., Stine K. J., J. Carbohydr. Chem. 2012, 31, 466–503. [DOI] [PMC free article] [PubMed] [Google Scholar]
- 28. Stadler V., Kirmse R., Beyer M., Breitling F., Ludwig T., Bischoff F. R., Langmuir 2008, 24, 8151–8157. [DOI] [PubMed] [Google Scholar]
- 29. Temme J. S., Campbell C. T., Gildersleeve J. C., Faraday Disc. 2019, 219, 90–110. [DOI] [PMC free article] [PubMed] [Google Scholar]
- 30.G. Paris, J. Heidepriem, A. Tsouka, M. Mende, S. Eickelmann, F. Loeffler, Automated laser-assisted synthesis of microarrays for infectious disease research, Proc. SPIE 10875, Microfluidics, BioMEMS, and Medical Microsystems XVII, 108750C (4 March 2019).
- 31. Paris G., Klinkusch A., Heidepriem J., Tsouka A., Zhang J., Mende M., Mattes D. S., Mager D., Riegler H., Eickelmann S., Loeffler F. F., Appl. Surf. Sci. 2020, 508, 144973. [Google Scholar]
- 32. Hanske J., Schulze J., Aretz J., McBride R., Loll B., Schmidt H., Knirel Y., Rabsch W., Wahl M. C., Paulson J. C., Rademacher C., J. Biol. Chem. 2017, 292, 862–871. [DOI] [PMC free article] [PubMed] [Google Scholar]
Associated Data
This section collects any data citations, data availability statements, or supplementary materials included in this article.
Supplementary Materials
As a service to our authors and readers, this journal provides supporting information supplied by the authors. Such materials are peer reviewed and may be re‐organized for online delivery, but are not copy‐edited or typeset. Technical support issues arising from supporting information (other than missing files) should be addressed to the authors.
Supplementary