

Abstract
Background
Immune challenge is known to increase heat stroke risk, although the mechanism of this increased risk is unclear.
Objectives
We sought to understand the effect of immune challenge on heat stroke pathology.
Patients/Methods
Using a mouse model of classic heat stroke, we examined the impact of prior viral or bacterial infection on hematological aspects of recovery. Mice were exposed to heat either 48 or 72 hours following polyinosinic:polycytidylic acid (poly I:C) or lipopolysaccharide injection, time points when symptoms of illness (fever, lethargy, anorexia) were minimized or completely absent.
Results
Employing multivariate supervised machine learning to identify patterns of molecular and cellular markers associated with heat stroke, we found that prior viral infection simulated with poly I:C injection resulted in heat stroke presenting with high levels of factors indicating coagulopathy. Despite a decreased number of platelets in the blood, platelets are large and non‐uniform in size, suggesting younger, more active platelets. Levels of D‐dimer and soluble thrombomodulin were increased in more severe heat stroke, and in cases of the highest level of organ damage markers D‐dimer levels dropped, indicating potential fibrinolysis‐resistant thrombosis. Genes corresponding to immune response, coagulation, hypoxia, and vessel repair were up‐regulated in kidneys of heat‐challenged animals; these correlated with both viral treatment and distal organ damage while appearing before discernible tissue damage to the kidney itself.
Conclusions
Heat stroke‐induced coagulopathy may be a driving mechanistic force in heat stroke pathology, especially when exacerbated by prior infection. Coagulation markers may serve as accessible biomarkers for heat stroke severity and therapeutic strategies.
Keywords: coagulopathy, heat stroke, systems biology, transcriptomics, computational analysis
Essentials.
No definitive clinical test exists to measure severity of heat stroke.
A mouse model and supervised learning are used to identify a signature of circulating biomarkers.
Blood factor signature of coagulopathy predicts thermoregulation and organ damage.
Altered gene expression detected in end‐organs before tissue damage suggests mechanism.
1. INTRODUCTION
Heat stroke is the most severe form of heat illness, resulting in central nervous system dysfunction, organ failure, cardiovascular damage, and death. 1 Heat stroke can be initiated passively (“classic” heat stroke) by high ambient temperatures with the inability to effectively dissipate the accumulated heat load on the body. Even upon the onset of heat illness symptoms, quantitative assessment of progression and severity is complicated, leading to uncertainty in diagnosis and evaluation of danger to the patient. Heat stroke induces similar symptoms to those induced by infection, including hyperthermia, neurological abnormalities, dehydration, and inflammation. Prior viral or bacterial infection is known to increase risk for heat stroke, potentially by pre‐inducing a febrile and immune compromised state. 2 , 3 Elevated levels of pro‐inflammatory cytokines such as IL‐1β, IL‐6, IFN‐γ, and TNFα are common to both infection and heat stroke, 4 , 5 suggesting that infection can prime a harmful immune response that is synergistically promoted by heat challenge and drives severe pathology. The role of thermal regulation, and dysregulation, is indeed increasingly appreciated as playing an important role in pathophysiological processes. 6
Currently, no definitive clinical test exists to measure severity or predict outcome and recovery time from heat stroke. The most common molecular biomarkers utilized for assessment of organ damage with heat stroke diagnosis are blood urea nitrogen and creatinine (kidney injury), myoglobin and creatine kinase (rhabdomyolysis), and the liver transaminases aspartate aminotransferase (AST) and alanine aminotransferase (ALT), which can be released by several tissues but namely skeletal muscle and liver. As such, these represent general biomarkers of organ dysfunction and damage that can be a sign of alternative, independent conditions, and are thus not exclusive markers for heat stroke. 1 Accordingly, they are not sufficiently specific for use in diagnosis, prognosis, or assignment of therapeutic strategy. To construct a quantitative measure that can be used as a diagnostic and prognostic tool, we hypothesized that shifts in the profile of blood cell populations may provide an opening for construction of a unique “fingerprint” of blood factors indicative of heat stroke and its severity. Using a mouse model of classic heat stroke developed in our laboratory, we examined the impact of prior viral or bacterial infection on hematological aspects of recovery. To avoid the influence of illness‐induced fever on our model, mice were exposed to heat either 48 or 72 hours following polyinosinic:polycytidylic acid (poly I:C) or lipopolysaccharide (LPS) injection, time points when symptoms of illness (fever, lethargy, anorexia) were minimal or completely absent.
Here, we demonstrate the use of a complete blood count (CBC) profile as a multivariate predictor of circadian thermoregulation, with a signature indicating underlying heat stroke‐induced coagulopathy (HSIC). A multivariate pattern of pro‐coagulation markers further correlates with the amount of liver damage in heat‐stroked animals, providing a potentially useful signature of circulating biomarkers for HSIC. We perform transcriptomic analysis in kidney tissue to further explore the underlying mechanistic precursors to end‐organ damage, and find that genes related to immune response, coagulation, hypoxia, and wound healing are up‐regulated even in histologically healthy tissue. These findings suggest a central role for HSIC that mimics disseminated intravascular coagulopathy (DIC) 7 as a main pathophysiological driver of organ damage and mortality in classic heat stroke. Further, these results demonstrate that the coagulation response can be detected early, before tissue damage occurs, suggesting a potential therapeutic strategy to detect, treat, and halt severe heat stroke cases.
2. METHODS
2.1. Experimental design
The objective of this study was to devise a signature of circulating blood factors that correlates with heat stroke severity and downstream outcomes such as end‐organ damage, and to use this signature to explore the possibility of mechanistic insight into propagation of heat stroke pathology. To achieve this objective, a cohort of mice were primed with different immune challenges for different incubation periods before subjection to heat challenge, which we expected to give a range of severity of heat stroke phenotypes, and examined at a range of time points following heat challenge. Specifically, the cohort of mice was divided into three groups and received an injection of poly I:C, LPS, or sterile saline (Figure 1A). Mice were returned to their home cages for either 48 or 72 hours, after which they were exposed to heat stress at 39.5°C, or were unheated controls at 25°C. We note that illness recovery periods of 48 or 72 hours coincide with the return to baseline of clinical symptoms in these animals (fever, lethargy, body weight loss, and reduced intake of food and water) after LPS or poly I:C challenge, respectively. Mice were sacrificed at Tc,max (42.4°C), 1 day following Tc,max, or 7 days following Tc,max, for a total of 36 groups (Tables S1 and S2 in supporting information) and N = 13 mice per group, where group is specific to immune challenge, immune incubation time, heat challenge, and time point parameters. Upon sacrifice, organs were harvested and blood was drawn from the heart to perform CBC (Figure 1B) and assay of plasma coagulation markers (Figure 1C; see also Methods).
Figure 1.
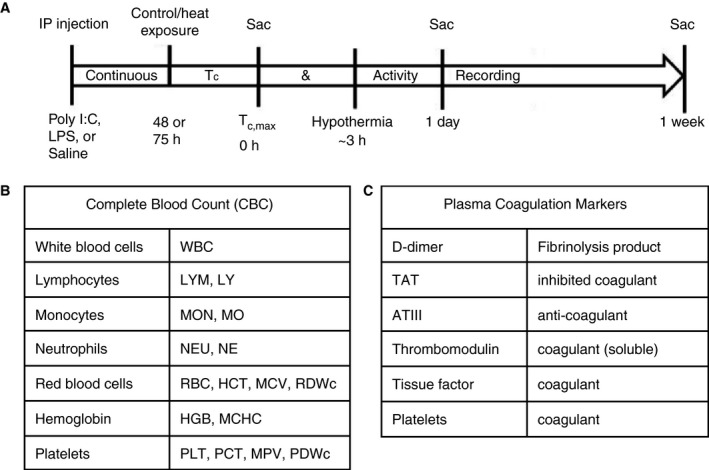
Experimental design. A, Cohort of mice was divided into three groups and received an injection of polyinosinic:polycytidylic acid, lipopolysaccharide, or sterile saline. Mice were returned to their home cages for either 48 or 72 hours, after which they were exposed to heat stress at 39.5°C, or were unheated controls at 25°C. Mice were sacrificed at Tc,max (42.4°C), 1 day following Tc,max, or 7 days following Tc,max, for a total of 36 groups (Tables S1 and S2) and N = 13 mice per group, where group is specific to immune challenge, immune incubation time, heat challenge, and time point parameters. Upon sacrifice, organs were harvested and blood was drawn from the heart to perform (B) complete blood count and (C) assay of plasma coagulation markers (see Methods)
2.2. Animals
Male C57BL/6J mice (Jackson Laboratories) weighing 23.4 ± 0.1 g were individually housed in Nalgene polycarbonate cages (11.5 in × 7.5 in × 5 in) fitted with high efficiency particulate air (HEPA)‐filter tops and Shepherds Specialty Blend bedding (ScottPharma) under standard laboratory conditions (25 ± 2°C; 12:12 hour light‐dark cycle, lights on at 06:00 hours). Rodent laboratory chow (Harlan Teklad 7012) and water were provided ad libitum. Each cage was supplied with a Nalgene Mouse House, maple wood product (#W0002; Bio‐Serv), and stainless steel ring attached to the wire lid for enrichment. Procedures were approved by the Institutional Animal Care and Use Committee at the United States Army Research Institute of Environmental Medicine, adhering to the Guide for the Care and Use of Laboratory Animals in an Association for Assessment and Accreditation of Laboratory Animal Care‐accredited facility.
2.3. Radiotelemetry transmitter implantation
Under isoflurane anesthesia, mice were intraperitoneally implanted with radiotelemetry transmitters (1.1 g, G2 Emitter; Starr Life Sciences) to measure body core temperature (Tc ± 0.1°C) and general activity (counts). 5 , 8 Surgical analgesia was provided with subcutaneous buprenorphine injection (0.05 mg/kg) just prior to surgery, and again 24 and 48 hours post‐procedure. Mice recovered from surgery in 7‐10 days as assessed by return to pre‐surgical body weight, normal food and water consumption, and stable circadian Tc and activity rhythms. 9 Tc and activity were continuously monitored at 1‐minute intervals throughout recovery and experimentation using the VitalView system.
2.4. Immune stimulant injection
Injections were performed between 0700 and 1000 hours, when mice displayed a normal baseline Tc < 36.0°C. Mice were weighed and intraperitoneally (IP) injected with vehicle (equivolume of saline; SAL), poly I:C (100 µg/kg), or LPS (50 µg/kg) as viral and bacterial stimulants, respectively. Body weight and food and water consumption were measured daily following injection. Mice otherwise recovered undisturbed for 48 or 72 hours prior to heat stress protocol (Tables S1 and S2).
2.5. Heat stress protocol
Mice in their home cages were placed into a floor‐standing incubator (model 3950; Thermo Forma) at 25 ± 2°C the day before heat exposure to acclimate to incubator noises. 8 Cage filter tops were removed to permit air circulation. Between 0700 and 1000 hours the next day, mice with baseline Tc < 36.0°C were selected for heat stress protocol (Figure 1, Tables S1 and S2). Mice were weighed; food, water, and enrichment items were removed from the cage; and incubator ambient temperature (Ta) was increased to 39.5 ± 0.2°C. Mice remained in the heated chamber until maximum Tc (Tc,max) of 42.4°C was reached, upon which mice were removed from heat, weighed, provided food and water ad libitum, and recovered undisturbed at 25°C until sample collection. Control mice were exposed to identical experimental conditions at Ta of 25 ± 2°C with time‐matched procedures.
2.6. Sample collection
Mice were sacrificed at time points for sample collection: (a) baseline (prior to heat/control exposure), (b) Tc,max, (c) 24 hours following Tc,max, or (d) 7 days following Tc,max (Figure 1, Tables S1 and S2). At sacrifice, mice were anesthetized with isoflurane and blood was collected via intracardiac puncture and immediately transferred to ethylenediaminetetraacetic acid (EDTA) microcentrifuge tubes and placed on ice. A CBC was performed on blood samples using a VetScan HM5 Hematology Analyzer (Abaxis), including: white blood cell count (WBC), lymphocyte count (LYM), % lymphocytes (LY), monocyte count (MON), % monocytes (MO), neutrophil count (NEU), % neutrophils (NE), red blood cell count (RBC), hematocrit (HCT), mean corpuscular volume (MCV), width of red blood cell size distribution (RDWc), hemoglobin (HGB), mean corpuscular hemoglobin concentration (MCHC), platelet count (PLT), % platelets (PCT), mean platelet volume (MPV), width of platelet size distribution (PDWc; see Figure 1B, Figure S1 in supporting information). Concentrations of plasma coagulative factors (Figure 1C, Figure S1) were measured by enzyme‐linked immunosorbent assay (ELISA) according to manufacturer protocol: D‐dimer (Mybiosource), thrombin‐antithrombin complex, antithrombin III (Abcam), soluble thrombomodulin (R&D Systems), and tissue factor (BosterBio), as well as granzyme B, a marker of liver damage (ThermoFisher).
2.7. Partial least squares modeling
We used partial least squares regression 10 and discriminant analysis with variable importance of projection (VIP) scores to identify a signature of blood factors correlating with heat stroke pathology, as measured by core body temperature (Tc) and granzyme B concentration. Briefly, partial least squares analysis identifies an optimal set of eigenvectors to relate the matrix of observed parameters (in this case, blood factors) to the matrix of outcomes or phenotypic observations with minimum residual error. Modeling was conducted in MATLAB using PLS_Toolbox (Eigenvector Research). Data was normalized along each parameter by Z‐score. Cross‐validation was performed with one third of the relevant dataset, or with one fifth of the relevant dataset if N < 15. The number of latent variables (LVs) was chosen to minimize cumulative error over all predictions. Where noted, we orthogonally rotated models to achieve maximal separation across LV1. We calculated model confidence by randomly permuting the matrix of outcomes or phenotypic observations to form a distribution of error for 100 random models and comparing our model to this distribution with the Mann‐Whitney U test. Importance of each parameter to the model prediction was quantified using VIP score, an average of the weights of each parameter over all latent variables normalized by latent variable percent of variance. A VIP score > 1 (above average contribution) was considered important for model performance and prediction.
2.8. RNAseq
RNA was purified from 20 mg tissue samples of kidney using the RNeasy Mini Prep kit with DNase (Qiagen) according to manufacturer protocol. Mice were selected from the larger cohort as six mice randomly chosen from each of the eight subgroups undergoing 48‐hour post‐injection incubation: saline‐ or poly I:C‐treated, heated or unheated, Tc,max or 1 day time‐point. RNAseq was performed by the BioMicroCenter at the Massachusetts Institute of Technology on a HiSeq2000 with read length of 40SE, using Kapa mRNA hyperprep for library preparation.
2.9. Transcriptomic analysis
Gene expression was mapped using the STAR/RSEM pipeline with Mus musculus GRCm38.93 as reference (Ensembl). We estimated variance‐mean dependence in count data and tested for differential expression based on a model using the negative binomial distribution with the DESeq package in R from the Bioconductor repository. Six outliers were identified by principal component analysis (PCA), and later confirmed by quality control to be contaminated or feature low read counts. These samples were excluded from further analysis. Remaining samples were ranked using the log2‐fold change and PCA loadings and submitted for pre‐ranked gene set enrichment analysis 11 (GSEA) of heated poly I:C‐treated mice compared with non‐heated saline‐treated mice at the 1 day time point. Enrichment for Hallmark Gene Sets was calculated using the classic scoring scheme. Full GSEA combining Tc,max and 1 day time points was performed as confirmation, using the Diff_Of_Classes metric with phenotype permutation.
Log2‐fold change of gene transcripts was used as input to the prcomp function in R, and loadings were extracted using get_pca_var. The most predictive principal components for the four given classes (heat challenge, poly I:C injection) were determined by multiclass log regression and leave‐one‐out cross‐validation. Principal components 2 and 3 were chosen as the best model, with class prediction accuracy of 90.5%.
2.10. Histopathology
Samples of liver, kidney, spleen, lung, and duodenum from the same 48 mice examined with RNAseq were formalin‐fixed and submitted to IDEXX BioResearch for histopathology analysis. The submitted tissues were trimmed, processed, blocked, sectioned, stained with hematoxylin and eosin (H&E), and examined microscopically. Observed microscopic changes were graded utilizing a standard system: 0 = no significant change, 1 = minimal, 2 = mild, 3 = moderate, and 4 = severe.
2.11. Data sharing statement
RNAseq data are available at GEO (accession number GSE129188). Histopathology scores are available with the online version of this article. For original data please contact eproctor@psu.edu.
3. RESULTS
3.1. Hematology signature predicts difference in circadian Tc
Although Tc is used clinically as a measure of heat stroke severity, individual responses to a given value of Tc are highly variable 1 and not necessarily indicative of internal pathology. Immune involvement in heat stroke pathology provides an opening for potential assessment of severity of patient response, where the ideal biomarkers should be easily and quickly accessible such that they are practical for clinical use. We thus aimed to identify immune biomarkers circulating in blood quantifiable with a standard clinical test and correlating with a known measure of thermoregulatory control. As Tc is the most commonly used metric for heat stroke diagnosis, even though imperfect, we used the circadian differential in average Tc, ΔTc (awake Tc minus sleep Tc), as a measure of thermal response and heat stroke severity.
The various physiological, cellular, and molecular parameter measurements are provided in Figure S1, with respect to experimental cohorts. Simple univariate statistical analyses raised no significant capability for prediction of ΔTc from any of these individually. However, multivariate models that take into account co‐variation of these parameters due to their biological inter‐dependence could be constructed to yield successful predictions, and consequent biological insights. Indeed, we found that a metric representing the quantitative distributions of blood cell populations in a CBC can effectively predict ΔTc (Figure 2). Our orthogonalized partial least squares regression model (four latent variables, three‐fold cross‐validation, R 2 of cross‐validation .205, Wilcoxon cross‐validation P‐value .008; see Methods) constructed from data from 137 mice predicts changes in circadian thermoregulation from covariation among CBC panel measurements, separating individual mice along a spectrum from those demonstrating “flipped” circadian thermoregulation (Figure 2A, blue), with higher Tc during sleep, to those with “normal” circadian thermoregulation (Figure 2A, red). The full pattern of factors distinguishing thermoregulatory regime (Figure 2B) indicates depressed immune cell populations with increasing heat stroke severity. We also found increased numbers of red blood cells, with a smaller average size but widened size distribution. This pattern is indicative of dehydration, which is commonly experienced both in heat stroke and infection, and synergistically in the presence of both stimuli. Low platelet levels were also correlated with heat stroke severity, and their large size and broad size distribution indicate younger, more active platelets, 12 introducing the potential for coagulopathy. Variable importance in projection (VIP) analysis (see Methods) identified the red blood cell signature and platelet signature as the dominating factors in determining ΔTc, and thus the most relevant to heat stroke pathology (Figure 2B, red bars). Importantly, the overall pattern predictive of the circadian thermoregulation proxy for heat stroke severity is a faint but highly statistically significant signal among the biological “noise” of individual variation in response to heat and infection stimulus, making up only 9.8% of the variation in blood cell populations but explaining 31% of the variation in ΔTc (P = .008).
Figure 2.
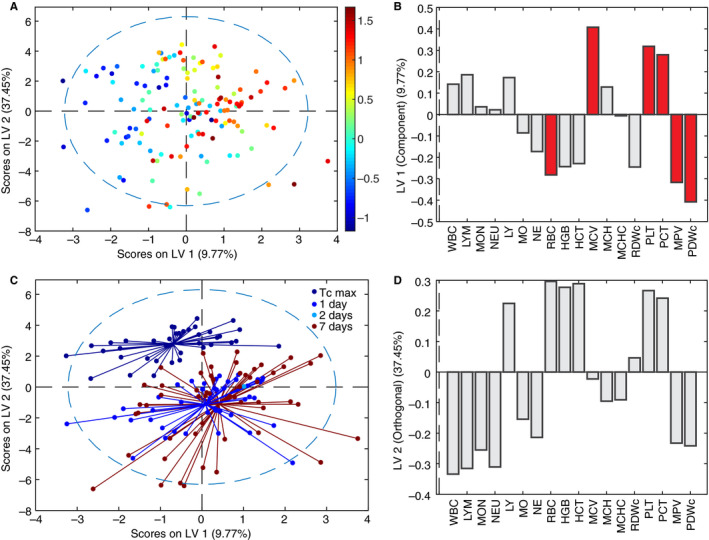
Multivariate hematological signature predicts circadian differential in average core body temperature (ΔTc), a proxy of heat stroke severity. A, Orthogonalized partial least squares regression model uses covariation in complete blood count results to separate mice on a spectrum of ΔTc as average Tc,day – average Tc,night (color bar, °C). N = 137, four latent variables, cross‐validated using one third of input data. R 2 of cross‐validation: .205, Wilcoxon cross‐validation, P‐value .008. B, Loadings on latent variable 1 (LV1) represent contributions of each factor to ΔTc. Red bars indicate variable importance of progression ≥ 1, a greater‐than‐average contribution to correlation. C, Recoloring of existing model according to time‐point of sacrifice. LV2 represents differences between complete blood count at Tc,max, 1, 2, and 7 days. D, Loadings on LV2 represent contribution of each factor to timeline of pathology
We assessed the timeline of changes in blood cell populations in heat stroke pathology by mapping the time point of each blood sample onto the existing partial least squares regression model (Figure 2C). We found that, without providing any information about timeline in the original model, the time elapsed following removal from heat stress formed a major axis of variation and separation in the data, representing 37.5% of the overall variation in blood cell populations. While dehydration and lowered immune cell counts are ameliorated at later time points, the pathological signature of thrombocytopenia strengthens (Figure 2D), suggesting a delayed physiological response that could include platelet‐consumptive coagulopathy.
3.2. Plasma coagulative markers predict liver damage
To further investigate potential coagulopathy indicated by the thrombocytopenia signature predictive of ΔTc, we measured levels of coagulation and fibrinolysis markers (from here forward collectively called coagulative markers) in the blood by ELISA: D‐dimer, thrombin‐antithrombin complex (TAT), antithrombin (ATIII), and soluble thrombomodulin (TM). Levels of tissue factor were also assessed, but could not be performed in a sufficient number of mice per group for statistically significant analysis. We constructed an orthogonalized partial least squares regression model correlating these markers with hepatic concentration of granzyme B, a serine protease secreted by cytotoxic lymphocytes that mediates apoptosis and indicates organ damage. In order to decrease the number of variables in our model, we included only mice treated with saline or poly I:C, undergoing a 48‐hour post‐injection incubation, sacrificed at Tc,max or 1 day following. We excluded mice treated with LPS from this analysis, as LPS is known to promote coagulopathy and could therefore confound measurement of the contribution of the coagulation system to heat stroke pathology. We excluded the 7‐day time point from our model because mouse‐to‐mouse variability in recovery from heat stroke stimulus was amplified at this later time point, resulting in non‐relevant noise that interfered with the predictive molecular signature. While not practically useful for diagnosis of heat stroke, the highly heterogeneous response at the 7‐day time point highlights that heat stroke recovery is variable even among genetically identical experimental animals in identical environmental conditions, and that circulating biomarkers are not completely restored to baseline after 7 days. While not further explored in this work, this information is highly relevant to ongoing discussion of timeline for the danger to the patient of increased risk for a second heat stroke event. 13 , 14
The resulting orthogonalized partial least squares regression model (two latent variables, three‐fold cross‐validation, R 2 of cross‐validation .518, Wilcoxon cross‐validation P‐value .004) constructed from data from 30 mice predicts levels of hepatic granzyme B using concentrations of four circulating coagulative markers (Figure 3), separating mice along a spectrum of no (blue) to high (red) liver damage with 54% of the variation in the coagulative markers explaining 50% of the liver damage phenotype (P = .004; Figure 3A). Examination of treatment conditions, which were not considered in the model, reveals a synergistic relationship between previous viral infection and heat challenge in coagulopathy‐derived organ damage (Figure 3), with saline injection (Figure 3B, blue) at the low end of the spectrum and poly I:C plus heat (Figure 3B, red) on the extreme high end of the spectrum. The pattern of factors defining this spectrum of increasing organ damage highlights high levels of soluble thrombomodulin and D‐dimer as the primary predictors of pathology (Figure 3C), demonstrating up‐regulated activation of coagulation and fibrinolysis pathways leading to (a) clot formation, as D‐dimer is only released after formation of cross‐linked fibrin clots; (b) fibrinolysis, ie, the breakdown of clots as seen by the release of D‐dimer; and (c) resistance to fibrinolysis, as soluble thrombomodulin greatly augments activation of thrombin‐activatable fibrinolysis inhibitor (TAFI). 15
Figure 3.
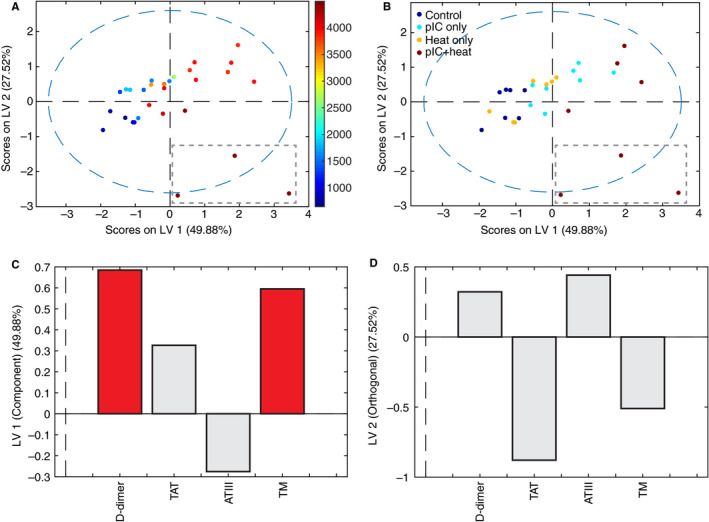
Coagulation perturbations correlate with liver damage in heat‐ and viral‐challenged mice. A, Orthogonalized partial least squares regression model uses covariation in levels of circulating coagulation markers to separate mice on a spectrum of liver damage from none (blue) to high (red), as measured by levels of granzyme B (color bar, pg/mL). Gray dashed box highlights three outliers in (D). N = 30, two latent variables, cross‐validated using one third of input data. R2 of cross‐validation: 0.518, Wilcoxon cross‐validation, P‐value .004. B, Recoloring of existing model according to treatment, 48 hours prior to heat challenge. Differences in treatment lie on the same axis (LV1) as the granzyme B spectrum, indicating correlation between treatment and organ damage. Gray dashed box highlights three outliers in (D). C, Loadings on latent variable 1 (LV1) represent contributions of each factor to concentration of granzyme B. Red bars indicate variable importance of progression ≥ 1, a greater‐than‐average contribution to correlation. D, Three outliers differ sufficiently to create an orthogonal axis of variation, LV2, upon which they separate from other points. Loadings on LV2 represent distinguishing factors of these outliers with extreme pathology, including extremely high values of thrombomodulin but decreased D‐dimer, potentially due to fibrinolysis resistance
Additionally, three animals exhibited a sufficiently different relationship between molecular coagulative markers and liver damage from the rest of the subjects that they defined their own latent variable (Figure 3A,B, gray dashed box), representing 27.5% of the overall variation in the dataset. These three animals presented with pronounced liver damage and extremely high levels of soluble thrombomodulin, but much lower levels of D‐dimer than their granzyme B concentration would suggest (Figure 3D). We interpreted this significant deviation from the model fit as evidence of fibrinolysis resistance, which may be reasonably expected with very high levels of soluble thrombomodulin due to TAFI activation, 15 and is often indicative of platelet‐rich clots.
3.3. Immune response and clotting factor genes up‐regulated in histologically normal tissues
As the above results have demonstrated, the immune and hematologic consequences of heat stroke are evident at the tissue level soon after heat challenge. The speed with which these changes appear led us to hypothesize that immune response and coagulopathy we noted may be more than just markers of damage, but also play a mechanistic role driving heat stroke pathology in end‐organs. To further elucidate the molecular mechanisms involved in instigating these tissue‐level changes, we performed transcriptomic analysis on livers and kidneys of mice from the most severely affected groups, mice treated with poly I:C and heat‐challenged 48 hours following treatment, along with comparable controls (saline‐treated, unheated mice). Because LPS is known to promote coagulopathy, which we found above may play a mechanistic role in heat stroke pathology (Figure 3), we did not examine LPS‐treated mice in this analysis. We targeted the Tc,max and 1 day time points to avoid the biological noise created by the high variability in recovery observed at 7 days. While RNA in livers had already begun to degrade and was unsuitable for analysis, pathology was less advanced in kidneys; in fact, no histopathological abnormalities were noted in kidney tissue (Table S4in supporting information), allowing us the opportunity to probe the landscape of molecular events prior to appearance of tissue dysfunction and damage.
Despite the absence of tissue‐level pathology in the kidney, we were able to detect changes in RNA expression distinguishing severe heat stroke from controls. Among the most differentially expressed genes between these groups were those involved in metabolism, inflammation, apoptosis, and coagulation (Figure 4A). However, genes involved in these processes were both up‐ and down‐regulated, leading to confusion in interpretation. Because the accumulation of many small changes can result in a larger effect than a small number of large changes, we performed pre‐ranked GSEA 11 to identify overall classes of genes that are differentially expressed in the poly I:C, heat‐challenged mice. While down‐regulated gene sets almost exclusively revealed decreases in metabolic processes (Table S3 in supporting information), we identified multiple up‐regulated gene sets involved in inflammatory response, hypoxia, wound healing, and coagulation (false discovery rate q‐value < 0.25; Figure 4B, Table S3).
Figure 4.
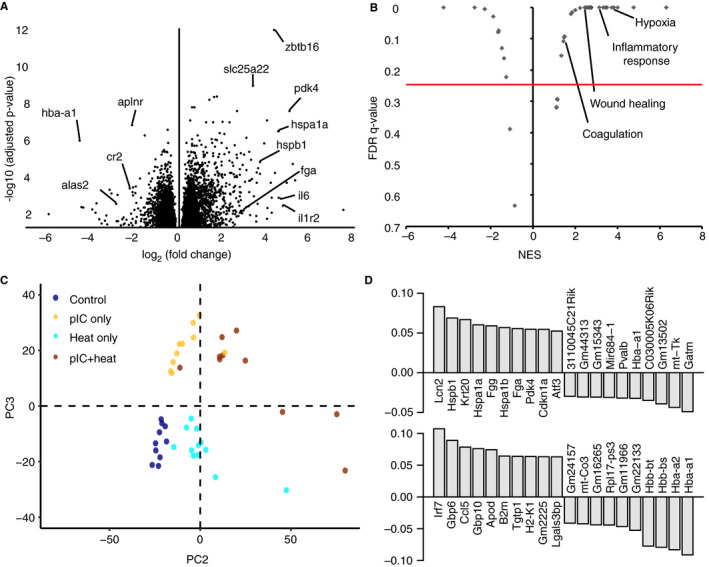
Transcription changes in genes related to vascular injury response in heat stroke. A, Volcano plot showing differentially expressed genes (log2(fold change)) in kidneys of polyinosinic:polycytidylic acid (poly I:C)‐treated, heat‐challenged mice, and their statistical significance as adjusted P‐value. B, Volcano plot showing highly enriched gene sets (NES, normalized enrichment score) and their statistical significance as false discovery rate q‐value. C, Principal component analysis of gene transcripts separates groups by heat application (PC2, 9% of variation in gene transcripts) or poly I:C injection (PC3, 5% of variation in gene transcripts). D, Top 10 positive and top 10 negative contributing gene transcripts to heat response (PC2, top) and poly I:C response (PC3, bottom)
To identify patterns of co‐varying gene transcripts that together differentiate heat‐stroked animals, we performed principal component analysis using all non‐zero transcripts (Figure 4C,D). The two principal components separating the treatment groups roughly represent heat application (PC2, 9% of variation in gene transcripts) and poly I:C injection (PC3, 5% of variation in gene transcripts). Loadings on these principal components reveal key players in heat stroke response related to the gene sets identified by GSEA: decreased hba and hbb, components of hemoglobin that promote fibrinolysis when released from red blood cells 16 ; increased lcn2, involved in innate immunity and an early biomarker for acute kidney injury; increased krt20, a filament protein contributing to structural integrity of epithelial cells; increased hspa1a and hspb1, protein folding chaperones in response to environmental stress; and increased fgg and fga, components of fibrinogen, the most abundant protein in blood clots. Notably, we also observe a >two‐fold increase in expression of sdc1, a marker of vascular activation and injury (adjusted P = .021). Taken together, these results strongly suggest pre‐symptomatic co‐occurring vascular damage, reduced oxygen transportation machinery in erythrocytes leading to ischemia, coagulopathy, end‐organ damage, and inflammatory response.
4. DISCUSSION
Disseminated intravascular coagulopathy and similar coagulopathic phenotypes are promoted in infection, 17 and also in heat stroke. 18 The two coagulopathy‐promoting stimuli experienced together, or in short succession, may produce a synergistic effect, as we observed in this work. Coagulopathy is thus a prime candidate for the mechanism of the increased risk of heat stroke‐related pathology following bacterial or viral infection, and consequently the targeting of early coagulation perturbations before onset of clinical coagulopathy may be beneficial to preventing incipient or future heat stroke. 19 , 20 The thrombocytopenia we observed in heat‐stroked mice is a likely a consequence of DIC‐like phenotype, 19 , 21 , 22 , 23 which we have termed HSIC, although a contribution from immune‐mediated destruction of platelets is also possible. 24 Additional support for HSIC as a main mechanism of heat stroke pathological progression to organ dysfunction and failure is the appearance of either thrombosis, bleeding, or both in heat stroke patients and animal models, 25 , 26 , 27 a similar phenotype to that observed in DIC. 7
Taken together, our findings suggest that both pathways may occur simultaneously, with hyperthermia producing a coagulopathy that drives the observed pathology in tissues, instigating an immune reaction to platelet‐rich clots and a cytokine storm in response to vascular injury, which together create a positive feedback reaction to generate incipient multi‐organ damage. Our gene expression findings support this proposed positive feedback mechanism: histopathology reports from kidneys assayed with RNAseq indicated no tissue‐level pathology (Table S4), while on the molecular level we found highly significant increased expression of genes involved in immune response, wound healing, and hypoxia. We thus are able to distinctly detect molecular‐level changes that distinguish the strongest responders to heat challenge before pathology propagates to have tissue‐level effects detrimental to organ function. Conversely, while liver samples in these same mice displayed distinct tissue‐level pathology including coagulative necrosis (Table S2), RNA in these tissues had already begun to degrade and we were unable to isolate transcripts at high enough quality for sequencing. Overall, the changes in these specific sets of genes suggest that tissue is being deprived of blood due to thrombosis and/or breakdown of vascular structures (eg, capillaries), and a wound healing response is initiated. These findings are further supported by a report from Hagiwara et al, 28 that administration of recombinant thrombomodulin, a co‐factor that enhances the Protein C‐mediated anticoagulant response of vascular endothelium, results in reduced organ damage in a rat model of heat stress‐induced inflammation.
Because no large clots or hemorrhages were observed in tissue histology, we conclude that the coagulation and corresponding injury to vessel walls occurs at the capillary level, similar to what is observed in DIC. In the case of heat stroke, hyperthermia may be directly damaging the vessel walls of small capillaries, causing the release of tissue factor and initiating the coagulation process. Although we could not test all of the animals studied here for tissue factor levels due to the small volume of blood available in each mouse and the large panel of assays we performed, we did observe heightened levels of tissue factor in heat‐stroked animals when all time points and incubation times were pooled (Figure S1).
We have presented in this work, to our knowledge, the first RNAseq analysis of tissue from an animal model of heat stroke. While other studies have presented gene expression assayed by quantitative PCR, 29 , 30 , 31 the advantage of RNAseq is the agnostic measure of the full transcriptome, rather than a set of pre‐chosen RNAs. This agnostic search allows us to assay a greater extent of perturbation to the system state of the tissue, without narrowing our view with expectations. We can also extrapolate the effect of the measured perturbations using prior knowledge from the STRING protein‐protein interaction database 32 to illustrate the downstream effects of these dysregulated RNA transcripts by the interactions between their protein products. By using this experimental knowledge to connect the sets of gene transcripts we identified as part of dysregulated processes, we see that the identified RNAs are interconnected at the protein level, and that transcriptional dysregulation could lead to synergistic dysfunction, disrupting tissue function to a larger degree than evident from individual dysregulated species or processes (Figure 5). We find clusters of genes that regulate immune function, connected via the complement system and coagulation to groups of genes involved in metabolism and stress response. Two tightly linked clusters of genes involved in cell cycle regulation dominate the center of the network, acting as a hub connecting many other gene sets, with genes involved in tissue growth and remodeling spread throughout.
Figure 5.
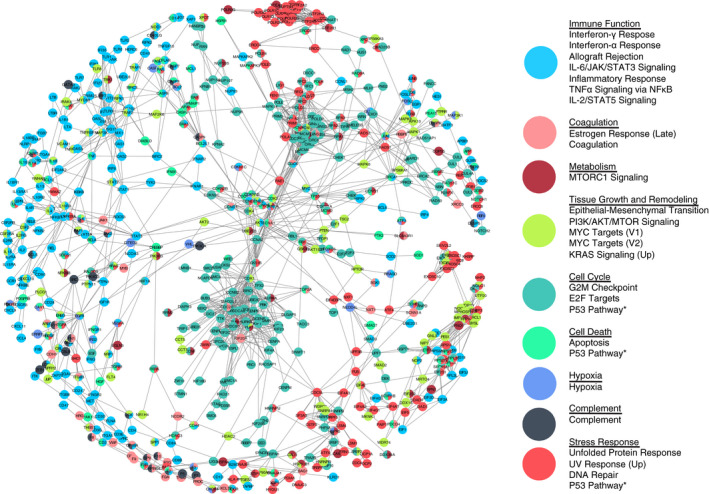
Dysregulated gene transcripts form a network of affected protein interactions. Dysregulated RNA transcripts in heat‐stroked mice as identified by combined_score from the STRING database of protein‐protein interactions, including experiments, co‐expression, and gene fusion evidence of interaction. Nodes (gene transcripts) are colored by HALLMARK gene sets, grouped as listed. Nodes were chosen as leading edge subsets of gene sets with enrichment false discovery rate q‐value < 0.25 in polyinosinic:polycytidylic acid, heated mice over saline, unheated mice. Edges were chosen as STRING combined_score > 0.99, 33 with shorter length representing higher score (edge‐weighted, spring‐embedded layout). Nodes classified into more than one enriched gene set are colored as a pie chart 34
In summary, we have demonstrated in an animal model of heat stroke that (a) heat stroke severity can be predicted immediately after heat exposure through a simple and widely available clinical test (complete blood count with differential); (b) a coagulopathy (HSIC) with diagnostic features similar to DIC occurs early after heat exposure and before tissue‐level histopathologic changes in end‐organs can be observed; (c) a complex series of concurrent changes at the gene expression and protein levels highlight increases in immune/inflammatory responses, hypoxia, wound healing, and coagulation; and (d) prior viral infection may increase heat stroke risk and severity through a feed‐forward coagulative mechanism. These findings highlight the importance of further investigation into the presentation and mechanisms of HSIC in heat stroke, which could lead to targeted treatment of the early coagulopathic component to halt progression of the condition to organ failure. Such treatments may take the form of focused blood component transfusions or drugs (eg, tranexamic acid or recombinant factor VIIa) for the bleeding phenotype, or anticoagulation therapy (eg, heparinization) for the clotting phenotype.
CONFLICTS OF INTEREST
The authors have no conflicts of interest.
AUTHOR CONTRIBUTIONS
EAP, SMD, DAL, and LRL conceived and planned experiments and analysis; EAP and SMD carried out experiments; EAP, SCVN, MKK, and DKB analyzed data; EAP, CDB, DKB, MBY, DAL, and LRL interpreted results; EAP, CDB, DAL, and LRL wrote the manuscript with input from all authors. All authors provided critical feedback and helped shape the research, analysis, and manuscript.
Supporting information
Supinfo
ACKNOWLEDGMENTS
This work was supported by the Institute for Collaborative Biotechnologies through contracts W911NF‐09‐D‐0001 and W911NF‐19‐2‐0026 from the US Army Research Office, and by a grant from the USAMRAA program W81XWH‐13‐MOMJPC5‐IPPEHA. EAP was partially supported by the MIT CEHS Training Grant in Environmental Toxicology T32‐ES007020. CDB and MBY were supported by NIH‐DOD Grant UM1‐HL120877. The authors thank Brian A. Joughin and Justin R. Pritchard for their valuable input. The opinions or assertions contained herein are the private views of the author(s) and are not to be construed as official or as reflecting the views of the Army or the Department of Defense. In conducting the research described in this report, the investigators adhered to the Guide for the Care and Use of Laboratory Animals as prepared by the Committee for the Update of the Guide for the Care and Use of Laboratory Animals of the Institute for Laboratory Animal Research, National Research Council. Citations of commercial organizations and trade names in this report do not constitute an official Department of the Army endorsement or approval of the products or services of these organizations.
Proctor EA, Dineen SM, Van Nostrand SC, et al. Coagulopathy signature precedes and predicts severity of end‐organ heat stroke pathology in a mouse model. J Thromb Haemost. 2020;18:1900–1910. 10.1111/jth.14875
Manuscript handled by: Scott Diamond
Final decision: Scott Diamond, 23 April 2020
Contributor Information
Douglas A. Lauffenburger, Email: lauffen@mit.edu.
Lisa R. Leon, Email: lisa.r.leon.civ@mail.mil.
REFERENCES
- 1. Leon LR, Bouchama A. Heat stroke. Compr Physiol. 2015;5:611‐647. [DOI] [PubMed] [Google Scholar]
- 2. Gardner JW, Kark JA, Karnei K, et al. Risk factors predicting exertional heat illness in male Marine Corps recruits. Med Sci Sports Exerc. 1996;28:939‐944. [DOI] [PubMed] [Google Scholar]
- 3. Carter R, Cheuvront SN, Sawka MN. A case report of idiosyncratic hyperthermia and review of U.S. Army heat stroke hospitalizations. J Sport Rehabil. 2007;16:238‐243. [DOI] [PubMed] [Google Scholar]
- 4. Bouchama A, Ollivier V, Roberts G, et al. Experimental heatstroke in baboon: analysis of the systemic inflammatory response. Shock. 2005;24:332‐335. [DOI] [PubMed] [Google Scholar]
- 5. Leon LR, Blaha MD, DuBose DA. Time course of cytokine, corticosterone, and tissue injury responses in mice during heat strain recovery. J Appl Physiol. 2006;100:1400‐1409. [DOI] [PubMed] [Google Scholar]
- 6. Evans SS, Repasky EA, Fisher DT. Fever and the thermal regulation of immunity: the immune system feels the heat. Nat Rev Immunol. 2015;15:335‐349. [DOI] [PMC free article] [PubMed] [Google Scholar]
- 7. Mazer SP, Pinsky DJ. DIC at the Intersection of the Thrombotic, Fibrinolytic and Inflammatory Axes. Madame Curie Bioscience Database [Internet]. Austin, TX: Landes Bioscience; 2000. [Google Scholar]
- 8. Leon LR, DuBose DA, Mason CW. Heat stress induces a biphasic thermoregulatory response in mice. Am J Physiol Regul Integr Comp Physiol. 2005;288:R197‐204. [DOI] [PubMed] [Google Scholar]
- 9. Blaha MD, Leon LR. Effects of indomethacin and buprenorphine analgesia on the postoperative recovery of mice. J Am Assoc Lab Anim Sci. 2008;47:8‐19. [PMC free article] [PubMed] [Google Scholar]
- 10. Geladi P, Kowalski BR. Partial least‐squares regression: a tutorial. Anal Chim Acta. 1986;185:1‐17. [Google Scholar]
- 11. Subramanian A, Tamayo P, Mootha VK, et al. Gene set enrichment analysis: a knowledge‐based approach for interpreting genome‐wide expression profiles. Proc Natl Acad Sci USA. 2005;102:15545‐15550. [DOI] [PMC free article] [PubMed] [Google Scholar]
- 12. Mangalpally KKR, Siqueiros‐Garcia A, Vaduganathan M, Dong J‐F, Kleiman NS, Guthikonda S. Platelet activation patterns in platelet size sub‐populations: differential responses to aspirin in vitro. J Thromb Thrombolysis. 2010;30:251‐262. [DOI] [PubMed] [Google Scholar]
- 13. Wallace RF, Kriebel D, Punnett L, Wegman DH, Amoroso PJ. Prior heat illness hospitalization and risk of early death. Environ Res. 2007;104:290‐295. [DOI] [PubMed] [Google Scholar]
- 14. O’Connor FG, Casa DJ, Bergeron MF, et al. American College of Sports Medicine Roundtable on exertional heat stroke–return to duty/return to play: conference proceedings. Curr Sports Med Rep. 2010;9:314‐321. [DOI] [PubMed] [Google Scholar]
- 15. Bajzar L, Nesheim M, Morser J, Tracy PB. Both cellular and soluble forms of thrombomodulin inhibit fibrinolysis by potentiating the activation of thrombin‐activable fibrinolysis inhibitor. J Biol Chem. 1998;273:2792‐2798. [DOI] [PubMed] [Google Scholar]
- 16. Moore HB, Moore EE, Gonzalez E, et al. Hemolysis exacerbates hyperfibrinolysis, whereas platelolysis shuts down fibrinolysis: evolving concepts of the spectrum of fibrinolysis in response to severe injury. Shock. 2015;43:39‐46. [DOI] [PMC free article] [PubMed] [Google Scholar]
- 17. Antoniak S. The coagulation system in host defense. Res Pract Thromb Haemost. 2018;2:549‐557. [DOI] [PMC free article] [PubMed] [Google Scholar]
- 18. Hifumi T, Kondo Y, Shimazaki J, et al. Prognostic significance of disseminated intravascular coagulation in patients with heat stroke in a nationwide registry. J Crit Care. 2018;44:306‐311. [DOI] [PubMed] [Google Scholar]
- 19. Knochel JP. Editorial: disseminated intravascular coagulation in heat stroke. Response to heparin therapy . JAMA. 1975;231:496‐497. [DOI] [PubMed] [Google Scholar]
- 20. Chen F, Li H, Zhu G, Chen X, Tang Z. Sodium tanshinone IIA sulfonate improves inflammation, aortic endothelial cell apoptosis, disseminated intravascular coagulation and multiple organ damage in a rat heat stroke model. Mol Med Rep. 2017;16:87‐94. [DOI] [PMC free article] [PubMed] [Google Scholar]
- 21. Bruchim Y, Klement E, Saragusty J, Finkeilstein E, Kass P, Aroch I. Heat stroke in dogs: a retrospective study of 54 cases (1999–2004) and analysis of risk factors for death. J Vet Intern Med. 2006;20:38‐46. [DOI] [PubMed] [Google Scholar]
- 22. Diehl KA, Crawford E, Shinko PD, Tallman RD, Oglesbee MJ. Alterations in hemostasis associated with hyperthermia in a canine model. Am J Hematol. 2000;64:262‐270. [DOI] [PubMed] [Google Scholar]
- 23. Drobatz KJ, Macintire DK. Heat‐induced illness in dogs: 42 cases (1976–1993). J Am Vet Med Assoc. 1996;209:1894‐1899. [PubMed] [Google Scholar]
- 24. Zenker I, Keller L, Meichner K, Unterer S, Hartmann K. Immune mediated destruction of platelets in dogs with heat stroke: A prospective study. Tierärztliche Praxis Ausgabe K: Kleintiere / Heimtiere. 2009;37:314‐318. [Google Scholar]
- 25. Mohanty D, Gomez J, Mustafa KY, Khogali M, Das KC. Pathophysiology of bleeding in heat stress: an experimental study in sheep. Exp Hematol. 1997;25:615‐619. [PubMed] [Google Scholar]
- 26. Boersma LV, Leyten QH, Meijer JW, Strubbe EJ, Bosch FH. Cerebral hemorrhage complicating exertional heat stroke. Clin Neurol Neurosurg. 1998;100:112‐115. [DOI] [PubMed] [Google Scholar]
- 27. Al‐Mashhadani SA, Gader AGMA, Al Harthi SS, Kangav D, Shaheen FA, Bogus F. The coagulopathy of heat stroke: alterations in coagulation and fibrinolysis in heat stroke patients during the pilgrimage (Haj) to Makkah. Blood Coagul Fibrinolysis. 1994;5:731‐736. [DOI] [PubMed] [Google Scholar]
- 28. Hagiwara S, Iwasaka H, Goto K, et al. Recombinant thrombomodulin prevents heatstroke by inhibition of high‐mobility group box 1 protein in sera of rats. Shock. 2010;34:402‐406. [DOI] [PubMed] [Google Scholar]
- 29. Ji J, Gu Z, Li H, Su L, Liu Z. Cryptdin‐2 predicts intestinal injury during heatstroke in mice. Int J Mol Med. 2018;41:137‐146. [DOI] [PMC free article] [PubMed] [Google Scholar]
- 30. King MA, Leon LR, Morse DA, Clanton TL. Unique cytokine and chemokine responses to exertional heat stroke in mice. J Appl Physiol. 2017;122:296‐306. [DOI] [PubMed] [Google Scholar]
- 31. Audet GN, Dineen SM, Quinn CM, Leon LR. Altered hypothalamic inflammatory gene expression correlates with heat stroke severity in a conscious rodent model. Brain Res. 2016;1637:81‐90. [DOI] [PubMed] [Google Scholar]
- 32. Szklarczyk D, Franceschini A, Wyder S, et al. STRING v10: protein‐protein interaction networks, integrated over the tree of life. Nucleic Acids Res. 2015;43:D447‐D452. [DOI] [PMC free article] [PubMed] [Google Scholar]
- 33. Doncheva NT, Morris JH, Gorodkin J, Jensen LJ. Cytoscape StringApp: network analysis and visualization of proteomics data. J Proteome Res. 2019;18:623‐632. [DOI] [PMC free article] [PubMed] [Google Scholar]
- 34. Morris JH, Kuchinsky A, Ferrin TE, Pico AR. enhancedGraphics: a Cytoscape app for enhanced node graphics. F1000Res. 2014;3:147. [DOI] [PMC free article] [PubMed] [Google Scholar]
Associated Data
This section collects any data citations, data availability statements, or supplementary materials included in this article.
Supplementary Materials
Supinfo