

Abstract
Background and Aims
Free and bioavailable 25‐hydroxyvitamin D (25OHD) are emerging measurements of vitamin D status. It remains unclear whether circulating free or bioavailable 25OHD are relevant to hepatocellular carcinoma (HCC) prognosis. Our aim was to test the hypothesis that bioavailable 25OHD may be a better serum biomarker of vitamin D status than total 25OHD on the association with HCC survival.
Approach and Results
We included 1,031 newly diagnosed, previously untreated patients with HCC from the Guangdong Liver Cancer Cohort enrolled between September 2013 and April 2017. Serum total 25OHD levels were measured using an electrochemiluminescence immunoassay. Serum‐free 25OHD levels were measured using a two‐step enzyme‐linked immunosorbent assay. Bioavailable 25OHD levels were calculated from measured free 25OHD and albumin using a previously validated equation. Primary outcomes were liver cancer–specific (LCSS) and overall survival (OS). Cox proportional hazards models were performed to calculate the multivariable hazard ratios (HRs) and 95% confidence intervals (CIs). During a median follow‐up of 726 days, 430 patients had deceased, including 393 deaths from HCC. In multivariable analyses, higher bioavailable 25OHD levels were significantly associated with better survival, independent of nonclinical and clinical prognostic factors including serum C‐reactive protein, Barcelona Clinic Liver Cancer stage, and cancer treatment. The multivariable‐adjusted HRs in the highest versus lowest quartile of bioavailable 25OHD levels were 0.69 (95% CI: 0.51, 0.93; P for trend = 0.014) for LCSS and 0.71 (95% CI: 0.53, 0.94; P for trend = 0.013) for OS. In contrast, neither total nor free 25OHD levels were associated with LCSS or OS.
Conclusions
Higher bioavailable, rather than total, 25OHD levels were independently associated with improved survival in a population‐based HCC cohort, suggesting a potential utility of bioavailable 25OHD in HCC prognosis.
Abbreviations
- 25OHD
25‐hydroxyvitamin D
- BCLC
Barcelona Clinic Liver Cancer
- BMI
body mass index
- CI
confidence interval
- CRP
C‐reactive protein
- DBP
vitamin D binding protein
- eGFR
estimated glomerular filtration rate
- HBsAg
hepatitis B surface antigen
- HBV
hepatitis B virus
- HCC
hepatocellular carcinoma
- HCV
hepatitis C virus
- HR
hazard ratio
- LCSS
liver cancer‐specific survival
- OS
overall survival
- PLC
primary liver cancer
- RCT
randomized controlled trial
- SYSUCC
Sun Yat‐sen University Cancer Center
Liver cancer ranks as the sixth most commonly diagnosed cancer and the fourth leading cause of cancer death worldwide.1 Although improved survival has been observed in the modern therapeutic era, liver cancer is still characterized by a generally incurable clinical course with 5‐year relative survival in a range of 5%‐30%.2 Hepatocellular carcinoma (HCC) represents nearly 90% of all liver cancer cases.3 The prognosis of HCC is known to be influenced by tumor characteristics, general health and hepatic function of the patient, and cancer treatments.4 However, investigation of modifiable predictive and prognostic factors has been limited for HCC survivors.
Vitamin D is a steroid hormone that has been implicated in cancer development and progression due to its antineoplastic properties including anti‐proliferation, pro‐differentiation, pro‐apoptosis, anti‐inflammation, and anti‐angiogenesis, as well as inhibition of invasion and metastasis.5 Observational epidemiological studies have found an inverse association of vitamin D status with risk of total cancer incidence and mortality.6, 7, 8 However, a recent meta‐analysis of randomized controlled trials (RCTs) has demonstrated a divergent effect of vitamin D supplementation, which reduces total cancer mortality but does not lower total cancer incidence in the general population, supporting a broad benefit of vitamin D in cancer prognosis.9 Consistent with this hypothesis, observational cohort studies have shown improved survival in cancer patients with higher circulating vitamin D concentrations, measured before or shortly after diagnosis of cancer.10 However, evidence linking vitamin D status to organ‐specific cancer survival is sparse and has produced conflicting results between and within types of cancers.10, 11, 12 Specific to liver cancer, few studies have been conducted.12, 13
The total 25‐hydroxyvitamin D (25OHD) level in serum or plasma is used currently to assess vitamin D status in routine clinical practice.14 Circulating 25OHD exists in three forms: (1) about 85%‐90% is tightly bound to vitamin D–binding protein (DBP); (2) approximately 10%‐15% is loosely bound to albumin; and (3) less than 0.03% is unbound and free.15 As put forward by the “free hormone hypothesis,” only the free and nonspecifically bound fraction of hormones are available at the cellular level to exert their biological actions.16 Accordingly, free and albumin‐bound 25OHD constitute bioavailable 25OHD (25OHD that is not bound to DBP).17 Several studies have suggested a clear advantage of free and/or bioavailable 25OHD over total 25OHD under pathological conditions, particularly, liver disease.18, 19 The liver is a pivotal organ for vitamin D metabolism, where 25‐hydroxylation of vitamin D and synthesis of DBP and albumin occur. Hence, total 25OHD measurements might be misleading in the settings of liver pathology, whereas analysis of free and/or bioavailable 25OHD could provide further insights.20, 21, 22, 23 Nevertheless, whether free or bioavailable 25OHD brings additional benefits over routine total 25OHD estimation in relation to the prognosis of liver cancer is unclear.
Therefore, our objective is to determine the association of serum total, free, and bioavailable 25OHD with survival in a large prospective cohort of HCC patients.
Patients and Methods
Study Population
The analyses were performed within the Guangdong Liver Cancer Cohort (GLCC) study, an ongoing, prospective cohort study of patients with primary liver cancer (PLC). Established in 2013 at Sun Yat‐sen University Cancer Center (SYSUCC) in Guangzhou, China, the GLCC is designed to identify genetic and environmental factors associated with PLC progression and prognosis. Details of the methods have been described previously.24 In brief, 1,359 newly diagnosed, previously untreated patients with PLC were enrolled between September 2013 and April 2017. Written informed consent was obtained from each patient. Approval for the study was obtained from the institutional review board of School of Public Health at the Sun Yat‐sen University.
We restricted the current analyses to patients receiving a diagnosis of HCC (C22.0 as per the International Classification of Diseases, version 10 [ICD‐10] codes) who had adequate serum samples for vitamin D assays with Barcelona Clinic Liver Cancer (BCLC) stage25 at 0 to C. The process of participant selection is described in Supporting Fig. S1. Finally, 1,031 patients were included in this study, of whom 979 were eligible for total 25OHD analysis and 1,002 for free and bioavailable 25OHD analysis.
Determination of 25OHD Fractions
Fasting venous blood specimens were collected within 30 days of diagnosis prior to anticancer therapy. Serum samples were centrifuged, separated, and stored at 80°C in aliquots after blood collection as soon as possible. To minimize technical variability, all serum samples were batched. Serum total 25OHD concentration was quantified by using an electrochemiluminescence immunoassay (Roche Diagnostics, Mannheim, Germany). Serum‐free 25OHD was measured directly using a two‐step enzyme‐linked immunosorbent assay (ELISA) (Future Diagnostics B.V., Wijchen, Netherlands). The measurements of free 25OHD obtained with the immunoassay are well consistent with the measurements using symmetric dialysis and centrifugal ultrafiltration.22, 23, 26, 27 The intraassay coefficients of variance were, respectively, 11.2% and 3.1% for total and free 25OHD for masked, replicate quality control samples.
Serum bioavailable 25OHD was calculated from measured free 25OHD, albumin, and affinity constant between 25OHD and albumin using the following equation28:
| (1) |
where [Bio D] is the concentration of bioavailable 25OHD, [DFree] is the concentration of free 25OHD, [DAlb] is the concentration of albumin‐bound 25OHD, [Alb] is the concentration of serum albumin, Kalb is the affinity constant between 25OHD and albumin (6 × 10⁵ M−1), and all concentrations are expressed in mol/L.
Survival Outcomes
Liver cancer–specific (LCSS) and overall survival (OS) were primary endpoints. LCSS time was calculated from date of blood sampling to date of death from HCC, or last known date alive. OS was defined as time from date of blood draw to date of death from any cause, or date of last follow‐up. Follow‐up was censored at the time of last outcome ascertainment (February 22, 2019). Deaths were ascertained through passive follow‐up by medical records and active follow‐up through mail or telephone interview of next‐of‐kin every 6 to 12 months. Identification number or full name in conjunction with the date of birth of persistent nonresponders were searched through death certificates reported to the Guangdong Provincial Centers for Disease Control and Prevention. Underlying cause of death (e.g., HCC, other cause) was assigned from death certificates and hospital follow‐up records according to the ICD‐10 codes.
Clinical and Lifestyle Data Collection
Routine laboratory parameters were measured immediately at the Clinical Laboratory of SYSUCC according to standard protocols. Detailed clinical characteristics, including age at diagnosis, sex, education level (primary school or below, secondary school, college or higher), residence (urban, rural), date of diagnosis, date of blood collection, family history of PLC, preexisting chronic liver disease (hepatitis B virus [HBV] and hepatitis C virus [HCV] infection, fatty liver disease, cirrhosis), liver function, kidney function, specific tumor markers for PLC (alpha‐fetoprotein), systemic inflammation (C‐reactive protein [CRP]), mineral metabolism (serum calcium), BCLC stage, and cancer treatment (e.g., hepatectomy/liver transplantation, local ablation, hepatic arterial intervention, other treatments), were abstracted from the SYSUCC electronic clinical and administrative databases by trained research staff. The family history of PLC was defined according to a diagnosis of PLC among any parents or siblings of the patient. HBV/HCV infection was defined as seropositivity of hepatitis B surface antigen (HBsAg) and/or antibody to HCV (anti‐HCV). Hepatic function was evaluated using a series of hepatic injury biomarkers including alanine aminotransferase, aspartate aminotransferase, gamma‐glutamyltransferase (GGT), alkaline phosphatase (ALP), albumin, and total bilirubin. Child‐Pugh score29 was also included to indicate the severity of liver dysfunction and hepatic functional reserve. Kidney function was assessed by the estimated glomerular filtration rate (eGFR) calculated using the Modification of Diet in Renal Disease Study equation,30 and chronic kidney disease was defined as eGFR <60 mL/min per 1.73 m2.
Anthropometric measures were collected by nurses following a standard procedure using the same calibrated equipment. Body mass index (BMI) was calculated as weight in kilograms divided by height in meters squared. A structured questionnaire was used to collect lifestyle data on physical activity, smoking, and alcohol drinking status. Physical activity was assessed by summing the products of time spent on a variety of activities, including occupation, transportation, housework, and leisure‐time physical activity, times the mean metabolic equivalent for that activity.
Statistical Analysis
Demographic and clinical information were compared across bioavailable 25OHD quartiles for continuous variables by analysis of variance or Kruskal‐Wallis tests and for categorical variables by Pearson chi‐square tests. Differences in serum 25OHD fractions between survivors and nonsurvivors were compared using Wilcoxon rank‐sum tests. Pairwise associations between serum 25OHD fractions were examined using Spearman’s rank correlation tests. The association of serum 25OHD fractions with LCSS and OS was first examined using Kaplan‐Meier survival analysis. Cox proportional hazards models were then used to calculate hazard ratios (HRs) and 95% confidence intervals (CIs), adjusted for predefined covariates. Serum 25OHD fractions were included in models in quartiles, with the lowest quartile as the reference category. Minimally adjusted models included age at diagnosis, sex, BMI, and season of blood collection, followed by full adjustment for clinical prognostic factors including serum CRP, eGFR, BCLC stage, and cancer treatment. We did not additionally control prognostic factors such as tumor characteristics, liver function, and general health in the multivariable models, as the BCLC stage comprehensively considers tumor number and size, Child‐Pugh score, and the performance status of the patient.25 Time‐25OHD interactions did not show appreciable nonproportionality. Test for linear trend was calculated by entering the median values of 25OHD quartiles into the models. Restricted cubic spline Cox regression31 was performed and no nonlinearity was found. Observations with missing data were omitted from the models by default, given that only a few covariates were missing with a small proportion. Additional analyses stratified by sex, BMI, HBV/HCV infection, eGFR, CRP, BCLC stage, and cancer treatment were conducted for bioavailable 25OHD. Interactions were evaluated using the Wald test.
Statistical analyses were performed with the use of SAS software, version 9.4 (SAS Institute, Cary, NC). Two‐tailed P < 0.05 was considered statistically significant.
Results
Patient Characteristics
Among the 1,031 included patients, 909 (88.2%) were men. Mean age at diagnosis was 53.0 ± 11.9 years. All participants lived in Guangdong and nearby provinces in South China (23.9°N ± 3.5°N). The median time between cancer diagnosis and blood collection was 6 (interquartile range [IQR]: 0‐11) days. The mean serum level of total, free, and bioavailable 25OHD was 35.84 ± 11.30 ng/mL, 5.77 ± 1.68 pg/mL, and 2.20 ± 0.68 ng/mL, respectively. Patient characteristics according to quartiles of bioavailable 25OHD levels are displayed in Supporting Table S1. Compared with the lowest quartile, patients in the highest quartile of bioavailable 25OHD levels were more physically active, had lower GGT and ALP levels, a lower proportion of CRP <3.0 mg/L, higher serum levels of albumin, calcium, total and free 25OHD, and were more likely to receive liver surgery and collect blood specimens in summer. The distributions of other variables were similar among patients with different bioavailable 25OHD concentrations.
Distribution of 25OHD Fractions
Distribution of Serum total, free, and bioavailable 25OHD levels is presented in Fig. 1. Median total 25OHD concentration was 34.63 ng/mL for the entire cohort, with a range from 5.85 to 72.24 ng/mL (Fig. 1A). At the time of blood collection, 6.1% of patients fulfilled the criteria for vitamin D deficiency (total 25OHD < 20 ng/mL), and a further 28.8% were vitamin D insufficient (total 25OHD ≥20 and <30 ng/mL). Median serum level of free and bioavailable 25OHD was 5.58 pg/mL (range: 2.18‐14.93 pg/mL) and 2.12 ng/mL (0.72‐6.00 ng/mL), respectively (Fig. 1B,C). No significant differences in serum total and free 25OHD levels were observed between survivors and nonsurvivors (P > 0.05). However, survivors had significantly higher bioavailable 25OHD concentrations than nonsurvivors (median: 2.18 vs. 2.03 ng/mL, P < 0.001). As shown in Supporting Fig. S2, serum total 25OHD levels were moderately correlated with free 25OHD (Spearman r = 0.55, P < 0.001) and bioavailable 25OHD levels (Spearman r = 0.52, P < 0.001) (Supporting Fig. S2A,B), and free 25OHD levels were strongly correlated with bioavailable 25OHD levels (Supporting Fig. S2C; Spearman r = 0.94, P < 0.001).
Figure 1.
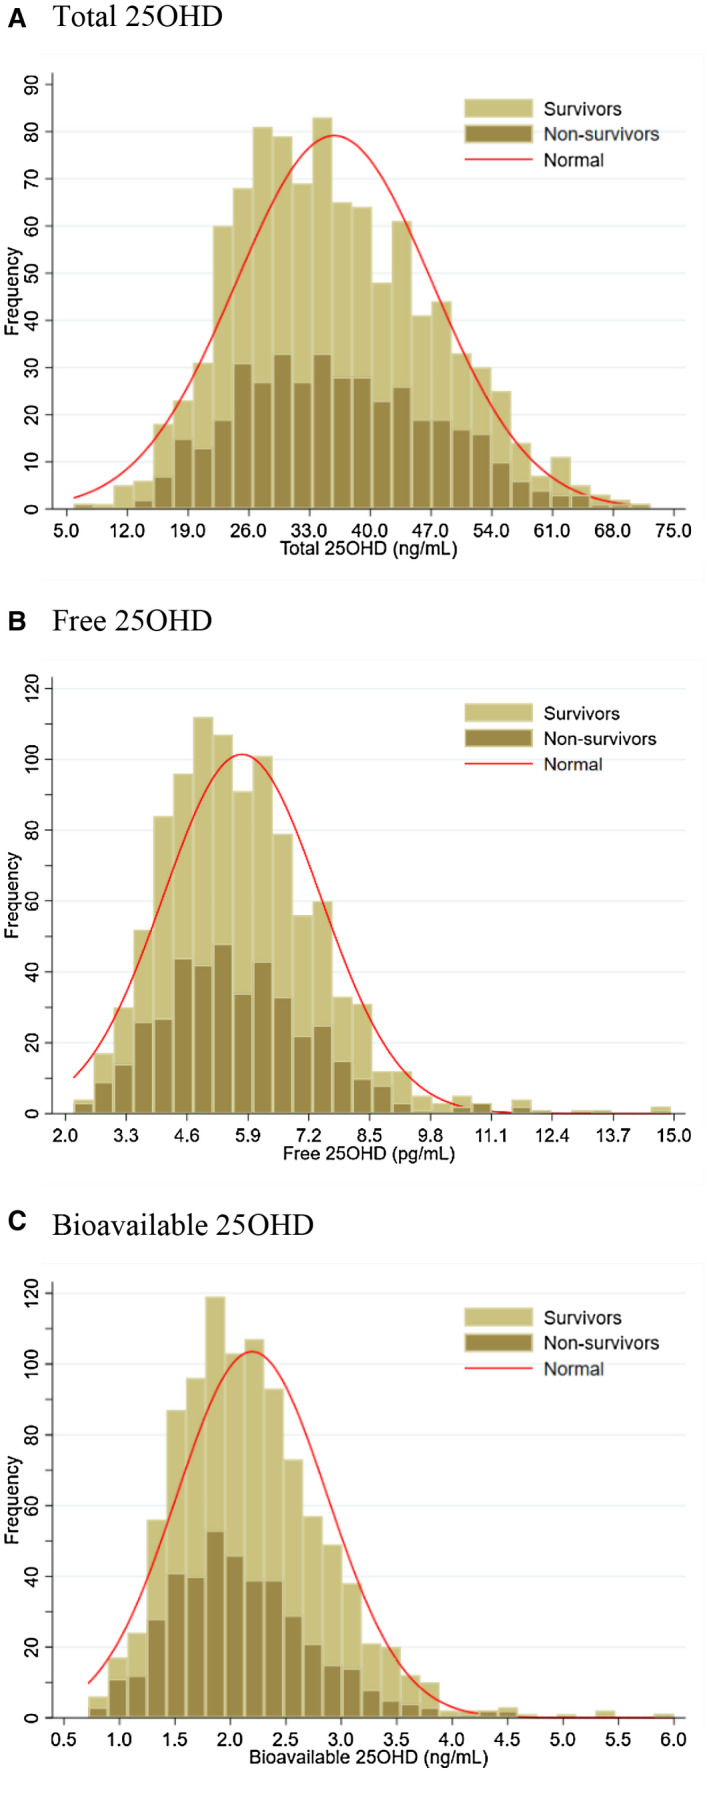
Distribution of serum levels of total 25OHD (A), free 25OHD (B) and bioavailable 25OHD (C) in the study cohort. Abbreviation: 25OHD, 25‐hydroxyvitamin D.
Serum 25OHD Fractions and Survival
During a median follow‐up of 726 (IQR: 329‐1,133) days and 790,490 person‐days at risk, 430 (41.7%) deaths were documented and 393 (91.4%) of them died of HCC. Kaplan‐Meir survival curves by quartiles of serum 25OHD fractions are illustrated in Fig. 2. Similar results for LCSS and OS were observed. Total and free 25OHD levels were not significantly related to survival (Fig. 2A‐D; log rank P > 0.05), whereas higher bioavailable 25OHD levels were associated with significantly increased survival (Fig. 2E,F; log rank P = 0.019 for LCSS and 0.03 for OS). The associations with LCSS and OS remained materially unchanged after adjustment for nonclinical covariates, even additionally for clinical prognostic factors including serum CRP, eGFR, BCLC stage, and cancer treatment (Table 1). Compared with patients in the lowest quartile of bioavailable 25OHD levels, patients in the highest quartile had a multivariable‐adjusted HR for LCSS of 0.69 (95% CI: 0.51, 0.93; P for trend = 0.014) and for OS of 0.71 (95% CI: 0.53, 0.94; P for trend = 0.013). In contrast, no significant associations with either LCSS or OS were observed for total or free 25OHD levels (P for trend > 0.05).
Figure 2.
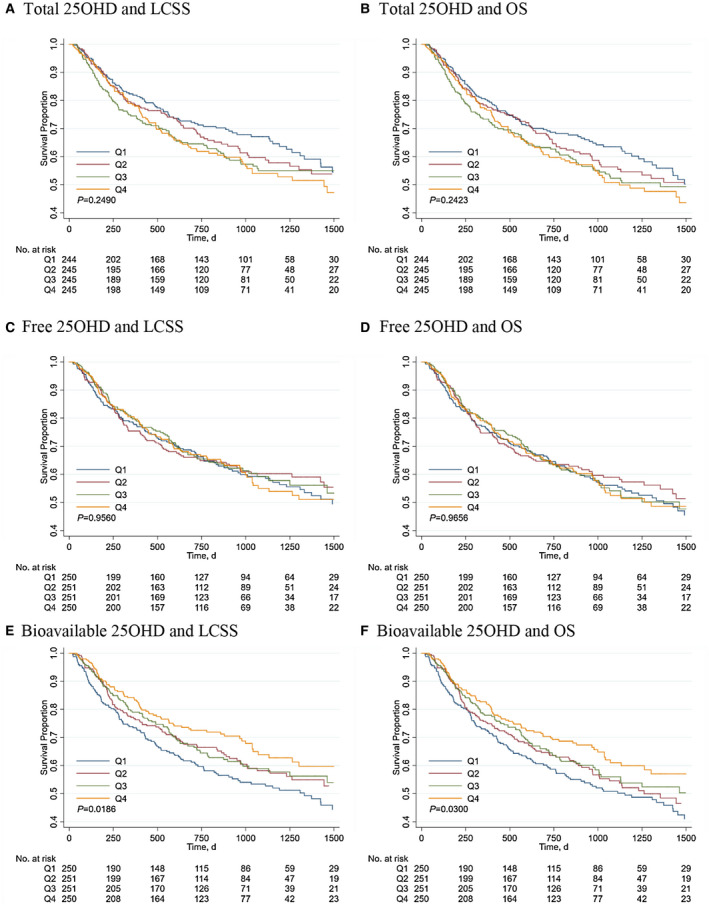
Kaplan‐Meier survival curves for LCSS (A) and OS (B) by quartiles of serum total 25OHD levels, for LCSS (C) and OS (D) by quartiles of serum free 25OHD levels, and for LCSS (E) and OS (F) by quartiles of serum bioavailable 25OHD levels. Abbreviations: 25OHD, 25‐hydroxyvitamin D; LCSS, liver cancer‐specific survival; OS, overall survival.
Table 1.
Multivariable‐Adjusted Associations of Quartiles of Serum Total, Free, and Bioavailable 25OHD Levels With Survival Outcomes in the Guangdong Liver Cancer Cohort Study
| Quartile of Serum 25OHD Fractions | P for Trend‡ | ||||
|---|---|---|---|---|---|
| Q1 | Q2 | Q3 | Q4 | ||
| LCSS | |||||
| Total 25OHD (ng/mL) | ≤27.34 | 27.34‐34.63 | 34.63‐43.63 | >43.63 | – |
| Number of deaths | 87 | 89 | 99 | 101 | – |
| Person‐days at risk | 208,751 | 190,081 | 186,362 | 178,700 | – |
| Mortality rate per 10,000 person‐days | 4.17 (3.29, 5.04) | 4.68 (3.71, 5.65) | 5.31 (4.27, 6.36) | 5.65 (4.55, 6.75) | – |
| Nonclinical factors–adjusted HR (95% CI)* | 1.00 | 1.08 (0.80, 1.45) | 1.21 (0.91, 1.63) | 1.25 (0.93, 1.68) | 0.109 |
| Clinical factors–adjusted HR (95% CI)† | 1.00 | 0.90 (0.66, 1.22) | 0.99 (0.73, 1.32) | 0.97 (0.72, 1.31) | 0.934 |
| Free 25OHD (pg/mL) | ≤4.62 | 4.62‐5.58 | 5.58‐6.71 | >6.71 | – |
| Number of deaths | 102 | 94 | 91 | 95 | – |
| Person‐days at risk | 201,823 | 192,957 | 183,620 | 183,656 | – |
| Mortality rate per 10,000 person‐days | 5.05 (4.07, 6.03) | 4.87 (3.89, 5.86) | 4.96 (3.94, 5.97) | 5.17 (4.13, 6.21) | – |
| Nonclinical factors–adjusted HR (95% CI)* | 1.00 | 0.94 (0.71, 1.24) | 0.94 (0.71, 1.25) | 1.01 (0.76, 1.34) | 0.926 |
| Clinical factors–adjusted HR (95% CI)† | 1.00 | 0.83 (0.63, 1.10) | 0.79 (0.59, 1.05) | 0.90 (0.68, 1.20) | 0.503 |
| Bioavailable 25OHD (ng/mL) | ≤1.73 | 1.73‐2.12 | 2.12‐2.56 | >2.56 | – |
| Number of deaths | 115 | 96 | 95 | 76 | – |
| Person‐days at risk | 189,317 | 190,655 | 189,481 | 192,603 | – |
| Mortality rate per 10,000 person‐days | 6.07 (4.96, 7.18) | 5.04 (4.03, 6.04) | 5.01 (4.01, 6.02) | 3.95 (3.06, 4.83) | – |
| Nonclinical factors–adjusted HR (95% CI)* | 1.00 | 0.81 (0.62, 1.06) | 0.77 (0.59, 1.02) | 0.63 (0.47, 0.85) | 0.002 |
| Clinical factors–adjusted HR (95% CI)† | 1.00 | 0.80 (0.61, 1.05) | 0.75 (0.57, 0.98) | 0.69 (0.51, 0.93) | 0.014 |
| OS | |||||
| Total 25OHD (ng/mL) | ≤27.34 | 27.34‐34.63 | 34.63‐43.63 | >43.63 | – |
| Number of deaths | 97 | 97 | 109 | 110 | – |
| Person‐days at risk | 208,751 | 190,081 | 186,362 | 178,700 | – |
| Mortality rate per 10,000 person‐days | 4.65 (3.72, 5.57) | 5.10 (4.09, 6.12) | 5.85 (4.75, 6.95) | 6.16 (5.01, 7.31) | – |
| Nonclinical factors–adjusted HR (95% CI)* | 1.00 | 1.07 (0.81, 1.42) | 1.21 (0.92, 1.59) | 1.24 (0.93, 1.64) | 0.103 |
| Clinical factors–adjusted HR (95% CI)† | 1.00 | 0.88 (0.66, 1.18) | 0.97 (0.73, 1.29) | 0.95 (0.72, 1.26) | 0.939 |
| Free 25OHD (pg/mL) | ≤4.62 | 4.62‐5.58 | 5.58‐6.71 | >6.71 | – |
| Number of deaths | 111 | 101 | 102 | 103 | – |
| Person‐days at risk | 201,823 | 192,957 | 183,620 | 183,656 | – |
| Mortality rate per 10,000 person‐days | 5.50 (4.48, 6.52) | 5.23 (4.21, 6.26) | 5.55 (4.48, 6.63) | 5.61 (4.53, 6.69) | – |
| Nonclinical factors–adjusted HR (95% CI)* | 1.00 | 0.93 (0.71, 1.22) | 0.97 (0.74, 1.28) | 1.01 (0.77, 1.33) | 0.845 |
| Clinical factors–adjusted HR (95% CI)† | 1.00 | 0.83 (0.63, 1.09) | 0.83 (0.63, 1.09) | 0.89 (0.68, 1.18) | 0.494 |
| Bioavailable 25OHD (ng/mL) | ≤1.73 | 1.73‐2.12 | 2.12‐2.56 | >2.56 | – |
| Number of deaths | 122 | 109 | 102 | 84 | – |
| Person‐days at risk | 189,317 | 190,655 | 189,481 | 192,603 | – |
| Mortality rate per 10,000 person‐days | 6.44 (5.30, 7.59) | 5.72 (4.64, 6.79) | 5.38 (4.34, 6.43) | 4.36 (3.43, 5.29) | – |
| Nonclinical factors–adjusted HR (95% CI)* | 1.00 | 0.87 (0.67, 1.13) | 0.80 (0.61, 1.04) | 0.67 (0.50, 0.88) | 0.004 |
| Clinical factors–adjusted HR (95% CI)† | 1.00 | 0.85 (0.66, 1.11) | 0.77 (0.59, 1.00) | 0.71 (0.53, 0.94) | 0.013 |
Adjusted for age at diagnosis, sex, BMI, and season of blood collection.
Adjusted additionally for eGFR, CRP level, BCLC stage, and cancer treatment.
The median values of serum 25OHD quartiles were used in the models.
Stratified Analyses
Interactions of bioavailable 25OHD levels with sex, BMI, HBV/HCV infection, eGFR, serum CRP, BCLC stage, and cancer treatment on association with survival outcomes did not reach statistical significance (Table 2; P for interaction >0.05). The inverse association of bioavailable 25OHD with LCSS or OS remained largely unchanged across most subgroups, despite that statistical power was diminished. Notably, the improvement in survival associated with higher bioavailable 25OHD levels was evident even in BCLC stage C patients, with an HR of 0.67 (95% CI: 0.46, 0.98 comparing extreme quartiles; P for trend = 0.039) for LCSS and 0.69 (95% CI: 0.48, 0.99; P for trend = 0.037) for OS. Additionally, the beneficial effect of higher bioavailable 25OHD levels on survival was both statistically significant among patients receiving local treatment (HR = 0.73; 95% CI: 0.54, 0.99; P for trend = 0.041 for LCSS; and HR = 0.74; 95% CI: 0.55, 1.00; P for trend = 0.032 for OS) versus systemic treatment (HR = 0.07, 95% CI: 0.01, 0.52; P for trend = 0.004 for LCSS; and HR = 0.08; 95% CI:0.01, 0.55; P for trend = 0.004 for OS).
Table 2.
Hazard Ratios (95% CI)* for Survival Outcomes by Serum Bioavailable 25OHD Levels Stratified by Selected Covariates in the Guangdong Liver Cancer Cohort Study
| No. of Deaths/Total | Quartile of Bioavailable 25OHD | P for Trend§ | P for Interaction|| | ||||
|---|---|---|---|---|---|---|---|
| Q1 | Q2 | Q3 | Q4 | ||||
| LCSS | |||||||
| Sex | 0.276 | ||||||
| Women | 35/121 | 1.00 | 0.54 (0.22, 1.32) | 0.42 (0.16, 1.11) | 0.68 (0.22, 2.13) | 0.284 | |
| Men | 347/881 | 1.00 | 0.83 (0.62, 1.11) | 0.79 (0.59, 1.06) | 0.72 (0.53, 0.99) | 0.040 | |
| BMI at diagnosis | 0.255 | ||||||
| <24.0 kg/m2 | 282/679 | 1.00 | 0.85 (0.62, 1.17) | 0.79 (0.58, 1.08) | 0.81 (0.57, 1.15) | 0.184 | |
| ≥24.0 kg/m2 | 100/322 | 1.00 | 0.67 (0.38, 1.17) | 0.61 (0.34, 1.09) | 0.46 (0.25, 0.84) | 0.014 | |
| HBV/HCV infection | 0.597 | ||||||
| HBsAg (‐) and anti‐HCV (−) | 30/91 | 1.00 | 0.94 (0.34, 2.61) | 1.12 (0.32, 3.95) | 0.67 (0.17, 2.65) | 0.639 | |
| HBsAg (+) and/or anti‐HCV (+) | 352/911 | 1.00 | 0.81 (0.60, 1.08) | 0.74 (0.56, 0.99) | 0.71 (0.52, 0.96) | 0.024 | |
| eGFR | 0.371 | ||||||
| ≥60 mL/min per 1.73 m2 | 369/963 | 1.00 | 0.80 (0.61, 1.06) | 0.73 (0.55, 0.97) | 0.68 (0.50, 0.92) | 0.010 | |
| <60 mL/min per 1.73 m2 | 13/39 | 1.00 | 0.17 (0.00, 9.72) | 1.61 (0.09, 30.19) | 0.20 (0.01, 4.90) | 0.592 | |
| Serum CRP | 0.469 | ||||||
| ≤3.0 mg/L | 120/530 | 1.00 | 0.89 (0.53, 1.49) | 0.67 (0.39, 1.15) | 0.87 (0.53, 1.42) | 0.532 | |
| >3.0 mg/L | 262/471 | 1.00 | 0.79 (0.57, 1.10) | 0.77 (0.56, 1.06) | 0.60 (0.41, 0.89) | 0.012 | |
| BCLC stage | 0.360 | ||||||
| 0‐A | 72/427 | 1.00 | 0.69 (0.37, 1.28) | 0.47 (0.24, 0.93) | 0.66 (0.34, 1.28) | 0.106 | |
| B | 52/120 | 1.00 | 0.80 (0.38, 1.68) | 0.84 (0.37, 1.91) | 0.90 (0.37, 2.17) | 0.863 | |
| C | 258/455 | 1.00 | 0.85 (0.60, 1.20) | 0.82 (0.59, 1.15) | 0.67 (0.46, 0.98) | 0.039 | |
| Cancer treatment | 0.192 | ||||||
| Local treatment† | 355/959 | 1.00 | 0.82 (0.62, 1.09) | 0.76 (0.57, 1.02) | 0.73 (0.54, 0.99) | 0.041 | |
| Systemic treatment‡ | 27/43 | 1.00 | 0.47 (0.11, 2.13) | 0.28 (0.08, 0.96) | 0.07 (0.01, 0.52) | 0.004 | |
| OS | |||||||
| Sex | 0.334 | ||||||
| Women | 39/121 | 1.00 | 0.69 (0.29, 1.60) | 0.45 (0.17, 1.15) | 0.70 (0.23, 2.14) | 0.280 | |
| Men | 378/881 | 1.00 | 0.87 (0.66, 1.15) | 0.80 (0.61, 1.06) | 0.73 (0.54, 0.99) | 0.037 | |
| BMI at diagnosis | 0.531 | ||||||
| <24.0 kg/m2 | 304/679 | 1.00 | 0.89 (0.66, 1.21) | 0.80 (0.59, 1.09) | 0.77 (0.55, 1.09) | 0.105 | |
| ≥24.0 kg/m2 | 113/322 | 1.00 | 0.77 (0.45, 1.31) | 0.67 (0.38, 1.17) | 0.58 (0.33, 1.02) | 0.058 | |
| HBV/HCV infection | 0.997 | ||||||
| HBsAg (‐) and anti‐HCV (−) | 36/91 | 1.00 | 1.11 (0.43, 2.84) | 1.43 (0.45, 4.57) | 0.83 (0.24, 2.91) | 0.879 | |
| HBsAg (+) and/or anti‐HCV (+) | 381/911 | 1.00 | 0.84 (0.64, 1.11) | 0.75 (0.57, 0.98) | 0.71 (0.53, 0.96) | 0.017 | |
| eGFR | 0.887 | ||||||
| ≥60 mL/min per 1.73 m2 | 399/963 | 1.00 | 0.86 (0.66, 1.13) | 0.76 (0.58, 0.99) | 0.71 (0.53, 0.96) | 0.015 | |
| <60 mL/min per 1.73 m2 | 18/39 | 1.00 | 0.15 (0.01, 2.31) | 0.32 (0.02, 4.36) | 0.08 (0.01, 0.89) | 0.079 | |
| Serum CRP | 0.470 | ||||||
| ≤3.0 mg/L | 133/530 | 1.00 | 0.99 (0.61, 1.62) | 0.76 (0.45, 1.27) | 0.89 (0.56, 1.43) | 0.526 | |
| >3.0 mg/L | 283/471 | 1.00 | 0.82 (0.60, 1.12) | 0.76 (0.56, 1.04) | 0.62 (0.43, 0.90) | 0.010 | |
| BCLC stage | 0.349 | ||||||
| 0‐A | 84/427 | 1.00 | 0.80 (0.45, 1.41) | 0.58 (0.32, 1.07) | 0.68 (0.36, 1.28) | 0.126 | |
| B | 56/120 | 1.00 | 0.82 (0.40, 1.67) | 0.77 (0.34, 1.71) | 0.86 (0.37, 1.99) | 0.710 | |
| C | 277/455 | 1.00 | 0.90 (0.65, 1.26) | 0.82 (0.59, 1.15) | 0.69 (0.48, 0.99) | 0.037 | |
| Cancer treatment | 0.266 | ||||||
| Local treatment† | 387/959 | 1.00 | 0.88 (0.67, 1.15) | 0.77 (0.59, 1.02) | 0.74 (0.55, 1.00) | 0.032 | |
| Systemic treatment‡ | 30/43 | 1.00 | 0.48 (0.11, 2.14) | 0.31 (0.10, 0.98) | 0.08 (0.01, 0.55) | 0.004 | |
Adjusted for age at diagnosis, sex, BMI, season of blood collection, eGFR, CRP level, BCLC stage, and cancer treatment and the corresponding variable was removed from the models when it was a stratified factor.
Including hepatectomy, liver transplantation, local ablation, and hepatic arterial intervention.
Including radiation therapy and systemic treatment (e.g., molecular targeted therapy, systemic chemotherapy, traditional Chinese medication).
The median values of serum 25OHD quartiles were used in the models.
Interactions were evaluated using the Wald test.
Discussion
This is an investigation of the relationship between vitamin D status at diagnosis, estimated comprehensively using serum total, free, and bioavailable 25OHD levels, and survival in a large prospective cohort of newly diagnosed, previously untreated patients with HCC. In the study population, higher bioavailable 25OHD levels were associated with improved LCSS and OS, independent of clinical prognostic factors including systemic inflammation, BCLC stage, and cancer treatment. By contrast, serum total and free 25OHD levels were related to neither LCSS nor OS.
Two prospective studies to date have addressed the prognostic value of circulating total 25OHD levels for survival in patients with liver cancer. One study conducted in 200 German patients with HCC demonstrated that patients with serum total 25OHD ≤10 ng/mL had significantly decreased OS in comparison to patients with total 25OHD >10 ng/mL following the diagnosis of HCC.13 The other study using data from 206 Finnish male smokers, who received a diagnosis of liver cancer during the follow‐up of the Alpha‐Tocopherol, Beta‐Carotene Cancer Prevention Study, showed a suggestive improvement in LCSS among participants with higher total 25OHD levels up to 28 years before cancer diagnosis, albeit not statistically significant.12 Of note, the existing studies were both carried out in European populations living at latitudes higher than 50°N. As opposed to the aforementioned studies, no significant associations of serum total 25OHD with either LCSS or OS were observed in our study population. However, it should be pointed out that total 25OHD concentrations in the European studies are much lower than those in the present study (13.9‐17 ng/mL vs. 35.8 ng/mL), which could be partially attributed to the difference in race and latitude. In our study, serum total 25OHD levels were generally high, and most patients were vitamin D sufficient (total 25OHD ≥ 30 ng/mL). The inconsistent findings may suggest a potential ceiling effect of total 25OHD on HCC survival that no additional benefit would be provided when total 25OHD reaches a certain concentration. In other words, the relative rarity of vitamin D deficiency in the study population may preclude exploration of an association between lower total 25OHD levels and patient outcomes. However, we observed no significant evidence for worse survival in the highest versus lowest quartile of total 25OHD, which eliminates the concern about the safety of total 25OHD concentrations exceeding 40 ng/mL. Still, it should be emphasized that measuring simply total 25OHD as the diagnostic tool is probably inadequate under various disease conditions, because total 25OHD concentrations, which are subject to multiple environmental and physiological changes,32 may be a surrogate of general health status. In particular, the liver is responsible for 25‐hydroxylation of vitamin D and production of DBP and albumin. Thus, patients with synthetic hepatic dysfunction always have altered total 25OHD levels,20, 21, 22 which may not accurately reflect 25OHD levels available for cellular uptake.
Here we extend previous literature of the standard measure of vitamin D status to investigate the relationship between free and bioavailable 25OHD levels and HCC prognosis for the first time. We observed that serum bioavailable 25OHD levels were inversely related to both LCSS and OS, indicating bioavailable 25OHD but not total 25OHD is an independent predictor for survival among HCC patients. In agreement with our findings, higher preoperative levels of bioavailable 25OHD rather than total 25OHD were reported to be associated with improved OS in patients with stage I‐III colorectal cancer.33 In addition, bioavailable 25OHD has been suggested to be a more informative measure of vitamin D status for the prognosis of coronary artery disease than total 25OHD.34 The nonsignificant association of free 25OHD levels with survival is unexpected in the current study. However, considering that only tiny amounts (<0.03%) of total 25OHD are free and unbound in serum,15 bioavailable 25OHD levels are approximately equal to albumin‐bound 25OHD levels. Because albumin‐bound 25OHD is capable of dissociating rapidly in a dynamically perfused tissue, bioavailable 25OHD levels might be more representative of the bioavailability of vitamin D than a very small proportion of free 25OHD. Findings from epidemiological studies support this notion that bioavailable 25OHD levels were better linked to biological outcomes than the free fraction alone.34, 35 Our results highlight that bioavailable measures of 25OHD are potentially useful for predicting the risk of liver cancer mortality. With the recent availability of a commercial direct free 25OHD measurement ELISA kit, the determination of bioavailable 25OHD is much easier and more precise than the calculation based on the DBP and total 25OHD levels.28
Experimental studies have demonstrated strong biological plausibility for the association between vitamin D and liver cancer survival.5, 36 Vitamin D deprivation may promote liver tumor growth through regulation of toll‐like receptor 7 and β‐catenin activation in the context of Smad3 disruption.37 Additionally, vitamin D treatment can inhibit the proliferation of hepatoma cells by reducing the expression of histone deacetylase 2 (HDAC2), thereby increasing the expression of p21 (WAF1/Cip1) and phosphatase and tensin homolog deletion on chromosome 10 (phosphatase and tensin homolog) in a dose‐dependent manner, resulting in cell cycle arrest at G0/G1 phase.38, 39 The down‐regulation of HDAC2 caused by vitamin D can also induce the apoptosis of HepG2 cells through regulating the down‐regulation–mediated pathway and/or the mitochondria‐mediated pathway.40 Besides, vitamin D can stimulate the expression of thioredoxin‐interacting protein, leading to inhibited proliferation, enhanced apoptosis, and oxidative injury in HCC cells.41 Furthermore, vitamin D has an anti‐inflammatory effect on HCC by suppressing inflammatory cytokine (interleukin‐6 and tumor necrosis factor α) secretion in a p27kip1 gene–dependent way.42 Liver cancer cells have the ability to convert 25OHD to 1α,25‐dihydroxyvitamin D (1α,25[OH]2D), the biologically active form of vitamin D, in a intracrine, autocrine or paracrine manner, which allows vitamin D to play antineoplastic roles in local tumor tissues while minimizing the risk of hypercalcemia.43
The present study raises the possibility of improving survival in HCC patients through elevating bioavailable 25OHD levels. Given that there are moderate correlations between total and bioavailable levels of 25OHD, vitamin D supplementation targeted at increasing the total 25OHD levels may be promising. It has been reported that participants with vitamin D deficiency had increased both total and bioavailable 25OHD levels after being given vitamin D therapy.44 Two recent large‐scale RCTs, the Vitamin D and Omega‐3 Trial and the Vitamin D Assessment study, demonstrated that supplementation of vitamin D resulted in a suggestive but not statistically significant reduction in cancer mortality in the general population.45, 46 Nevertheless, the protective benefit of vitamin D supplementation against cancer mortality became pronounced when pooling the large RCTs together.9 In addition, two recent RCTs suggest that patients with digestive tract cancers, especially colorectal cancer, may benefit from vitamin D supplementation.47, 48 Our findings indicate that the assessment of vitamin D status using bioavailable instead of total 25OHD levels would aid in the identification of individuals who are most likely to benefit from vitamin D supplementation.
Although biologically plausible, establishing a causal relationship between vitamin D and HCC prognosis is challenging due to possible reverse causality and potential residual confounding from such an observational study. Previous studies have reported a high prevalence of vitamin D deficiency in patients with chronic liver disease including HCC.13, 49 Most of the patients had preexisting chronic liver disease and were diagnosed at an advanced stage, despite being newly diagnosed with HCC. As 25OHD, DBP, and albumin are produced in the liver, there is a possibility that bioavailable 25OHD levels reflect the functional status of the liver among HCC patients. However, bioavailable 25OHD levels were not associated with HBV/HCV infection, liver cirrhosis, fatty liver disease, and even BCLC stage in the study population. Moreover, including BCLC stage, a comprehensive index of tumor grade and liver function, in the multivariable models did not change the significant association between bioavailable 25OHD levels and HCC survival. In addition to BCLC stage, we also adjusted for other important potential confounders that may affect 25OHD levels, such as obesity, season, and systemic inflammatory response. However, the observed associations of bioavailable 25OHD levels with HCC survival remained. Appropriately designed and adequately powered RCTs are warranted to detect whether improving the vitamin D bioavailable status has a favorable effect on survival in patients recently diagnosed with HCC.
Several strengths of this study are notable. First, we prospectively examined a large patient population with newly diagnosed, previously untreated HCC, which has the ability to capture the spectrum of patients with HCC and to eliminate potential confounding by previous treatment history. Furthermore, both total and free 25OHD levels were directly measured in serum. A direct free 25OHD measurement avoids the relative inaccuracy of calculating free 25OHD from total 25OHD, DBP, and albumin levels.19 Additionally, extensively demographic, clinical, and treatment covariate data allowed for rigorous control of potential confounders and evaluation of effect modification, despite that residual confounding can never be completely ruled out in the observational studies. Finally, despite HCC being a highly lethal malignancy, we used both LCSS and OS data in our analyses, given that 25OHD may be a surrogate marker for general health not specific to patients with HCC.50
Limitations of our study must also be considered. There are concerns that serum 25OHD was measured at a single time point and disease progression might adversely influence 25OHD concentrations. Nonetheless, we included multiple clinical confounders, including kidney function, systemic inflammation, BCLC stage and cancer treatment, in multivariable models and the associations of bioavailable 25OHD with survival remained consistent. Moreover, although the overall study was large, the sample size drops in the stratified analyses. We also excluded other histological types of PLC from the analyses for small numbers, which may limit the generalizability of our findings to all patients with PLC. Finally, all of our study participants were of Asian descent and lived in South China; thus, caution should be taken when applying our results to racially and geographically diverse patient populations.
In summary, bioavailable 25OHD may be a preferable vitamin D form over total 25OHD in terms of the association of vitamin D status with HCC prognosis. Our observations provide compelling evidence for inverse associations between serum bioavailable 25OHD levels at diagnosis and HCC survival, suggesting a potential utility of bioavailable 25OHD as a prognostic biomarker in patients with HCC.
Author Contributions
Study concept and design: A.P.F., H.L.Z., M.S.C.; acquisition of data: A.P.F., J.A.L., Y.J.Z., Z.Y.L., Q.J.L., D.M.Z., Y.L., R.H.Z., Z.G.Z., Y.J.X., X.J.X., M.S.C., H.L.Z.; Statistical analysis: A.P.F.; interpretation of data: A.P.F.; drafting of manuscript: A.P.F.; critical review and revision of manuscript: A.P.F.; study supervision: H.L.Z., M.S.C., W.H.L.; final approval of the version to be published: all authors.
Supporting information
Acknowledgments
The authors thank the office and field staff of Sun‐yet Sen University Cancer Center for data collection, processing, and preparation. We thank all Guangdong Liver Cancer Cohort Study participants for their contributions to this study.
This work was supported by the National Natural Science Foundation of China (81803219, 81472966); the Guangdong Medical Research Foundation (A2018402); the Natural Science Foundation of Guangdong Province (2018A030310335); and the Fundamental Research Funds for the Central Universities (17ykpy14). The funding bodies had no role in the design, implementation, analysis, or interpretation of the data.
Potential conflict of interest: Nothing to report.
Contributor Information
Min‐Shan Chen, Email: chminsh@mail.sysu.edu.cn, Email: zhuhl@mail.sysu.edu.cn.
Hui‐Lian Zhu, Email: zhuhl@mail.sysu.edu.cn.
References
Author names in bold designate shared co‐first authorship.
- 1. Bray F, Ferlay J, Soerjomataram I, Siegel RL, Torre LA, Jemal A. Global cancer statistics 2018: GLOBOCAN estimates of incidence and mortality worldwide for 36 cancers in 185 countries. CA Cancer J Clin 2018;68:394‐424. [DOI] [PubMed] [Google Scholar]
- 2. Allemani C, Matsuda T, Di Carlo V, Harewood R, Matz M, Nikšić M, et al. Global surveillance of trends in cancer survival 2000‐14 (CONCORD‐3): analysis of individual records for 37 513 025 patients diagnosed with one of 18 cancers from 322 population‐based registries in 71 countries. Lancet 2018;391:1023‐1075. [DOI] [PMC free article] [PubMed] [Google Scholar]
- 3. Llovet JM, Zucman‐Rossi J, Pikarsky E, Sangro B, Schwartz M, Sherman M, et al. Hepatocellular carcinoma. Nat Rev Dis Primers 2016;2:16018. [DOI] [PubMed] [Google Scholar]
- 4. Bruix J, Sherman M, Llovet JM, Beaugrand M, Lencioni R, Burroughs AK, et al. Clinical management of hepatocellular carcinoma. Conclusions of the Barcelona‐2000 EASL conference. European Association for the Study of the Liver. J Hepatol 2001;35:421‐430. [DOI] [PubMed] [Google Scholar]
- 5. Feldman D, Krishnan AV, Swami S, Giovannucci E, Feldman BJ. The role of vitamin D in reducing cancer risk and progression. Nat Rev Cancer 2014;14:342‐357. [DOI] [PubMed] [Google Scholar]
- 6. Budhathoki S, Hidaka A, Yamaji T, Sawada N, Tanaka‐Mizuno S, Kuchiba A, et al. Plasma 25‐hydroxyvitamin D concentration and subsequent risk of total and site specific cancers in Japanese population: large case‐cohort study within Japan Public Health Center‐based Prospective Study cohort. BMJ 2018;360:k671. [DOI] [PMC free article] [PubMed] [Google Scholar]
- 7. Afzal S, Brondum‐Jacobsen P, Bojesen SE, Nordestgaard BG. Genetically low vitamin D concentrations and increased mortality: Mendelian randomisation analysis in three large cohorts. BMJ 2014;349:g6330. [DOI] [PMC free article] [PubMed] [Google Scholar]
- 8. Yin L, Ordonez‐Mena JM, Chen T, Schottker B, Arndt V, Brenner H. Circulating 25‐hydroxyvitamin D serum concentration and total cancer incidence and mortality: a systematic review and meta‐analysis. Prev Med 2013;57:753‐764. [DOI] [PubMed] [Google Scholar]
- 9. Keum N, Lee DH, Greenwood DC, Manson JE, Giovannucci E. Vitamin D supplementation and total cancer incidence and mortality: a meta‐analysis of randomized controlled trials. Ann Oncol 2019;30:733‐743. [DOI] [PMC free article] [PubMed] [Google Scholar]
- 10. Vaughan‐Shaw PG, O'Sullivan F, Farrington SM, Theodoratou E, Campbell H, Dunlop MG, et al. The impact of vitamin D pathway genetic variation and circulating 25‐hydroxyvitamin D on cancer outcome: systematic review and meta‐analysis. Br J Cancer 2017;116:1092‐1110. [DOI] [PMC free article] [PubMed] [Google Scholar]
- 11. Mondul AM, Weinstein SJ, Layne TM, Albanes D. Vitamin D and cancer risk and mortality: state of the science, gaps, and challenges. Epidemiol Rev 2017;39:28‐48. [DOI] [PMC free article] [PubMed] [Google Scholar]
- 12. Weinstein SJ, Mondul AM, Yu K, Layne TM, Abnet CC, Freedman ND, et al. Circulating 25‐hydroxyvitamin D up to 3 decades prior to diagnosis in relation to overall and organ‐specific cancer survival. Eur J Epidemiol 2018;33:1087‐1099. [DOI] [PMC free article] [PubMed] [Google Scholar]
- 13. Finkelmeier F, Kronenberger B, Koberle V, Bojunga J, Zeuzem S, Trojan J, Piiper A, et al. Severe 25‐hydroxyvitamin D deficiency identifies a poor prognosis in patients with hepatocellular carcinoma—a prospective cohort study. Aliment Pharmacol Ther 2014;39:1204‐1212. [DOI] [PubMed] [Google Scholar]
- 14. Institute of Medicine . Dietary Reference Intakes for Calcium and Vitamin D. Washington, DC: National Academies Press (US); 2011. [PubMed] [Google Scholar]
- 15. Bikle DD, Gee E, Halloran B, Kowalski MA, Ryzen E, Haddad JG. Assessment of the free fraction of 25‐hydroxyvitamin D in serum and its regulation by albumin and the vitamin D‐binding protein. J Clin Endocrinol Metab 1986;63:954‐959. [DOI] [PubMed] [Google Scholar]
- 16. Mendel CM. The free hormone hypothesis: a physiologically based mathematical model. Endocr Rev 1989;10:232‐274. [DOI] [PubMed] [Google Scholar]
- 17. Chun RF, Peercy BE, Orwoll ES, Nielson CM, Adams JS, Hewison M. Vitamin D and DBP: the free hormone hypothesis revisited. J Steroid Biochem Mol Biol 2014;144:132‐137. [DOI] [PMC free article] [PubMed] [Google Scholar]
- 18. Bikle DD, Malmstroem S, Schwartz J. Current controversies: are free vitamin metabolite levels a more accurate assessment of vitamin D status than total levels? Endocrinol Metab Clin North Am 2017;46:901‐918. [DOI] [PMC free article] [PubMed] [Google Scholar]
- 19. Tsuprykov O, Chen X, Hocher CF, Skoblo R, Lianghong Y, Hocher B. Why should we measure free 25(OH) vitamin D? J Steroid Biochem Mol Biol 2018;180:87‐104. [DOI] [PubMed] [Google Scholar]
- 20. Bikle DD, Halloran BP, Gee E, Ryzen E, Haddad JG. Free 25‐hydroxyvitamin D levels are normal in subjects with liver disease and reduced total 25‐hydroxyvitamin D levels. J Clin Invest 1986;78:748‐752. [DOI] [PMC free article] [PubMed] [Google Scholar]
- 21. Schwartz JB, Lai J, Lizaola B, Kane L, Weyland P, Terrault NA, et al. Variability in free 25(OH) vitamin D levels in clinical populations. J Steroid Biochem Mol Biol 2014;144:156‐158. [DOI] [PMC free article] [PubMed] [Google Scholar]
- 22. Schwartz JB, Gallagher JC, Jorde R, Berg V, Walsh J, Eastell R, et al. Determination of free 25(OH)D concentrations and their relationships to total 25(OH)D in multiple clinical populations. J Clin Endocrinol Metab 2018;103:3278‐3288. [DOI] [PMC free article] [PubMed] [Google Scholar]
- 23. Schwartz JB, Lai J, Lizaola B, Kane L, Markova S, Weyland P, et al. A comparison of measured and calculated free 25(OH) vitamin D levels in clinical populations. J Clin Endocrinol Metab 2014;99:1631‐1637. [DOI] [PMC free article] [PubMed] [Google Scholar]
- 24. Fang AP, Chen PY, Wang XY, Liu ZY, Zhang DM, Luo Y, et al. Serum copper and zinc levels at diagnosis and hepatocellular carcinoma survival in the Guangdong Liver Cancer Cohort. Int J Cancer 2019;144:2823‐2832. [DOI] [PubMed] [Google Scholar]
- 25. Llovet JM, Bru C, Bruix J. Prognosis of hepatocellular carcinoma: the BCLC staging classification. Semin Liver Dis 1999;19:329‐338. [DOI] [PubMed] [Google Scholar]
- 26. Heureux N, Lindhout E, Swinkels L. A direct assay for measuring free 25‐hydroxyvitamin D. J AOAC Int 2017;100:1318‐1322. [DOI] [PubMed] [Google Scholar]
- 27. Bikle D, Bouillon R, Thadhani R, Schoenmakers I. Vitamin D metabolites in captivity? Should we measure free or total 25(OH)D to assess vitamin D status? J Steroid Biochem Mol Biol 2017;173:105‐116. [DOI] [PMC free article] [PubMed] [Google Scholar]
- 28. Powe CE, Evans MK, Wenger J, Zonderman AB, Berg AH, Nalls M, et al. Vitamin D‐binding protein and vitamin D status of black Americans and white Americans. N Engl J Med 2013;369:1991‐2000. [DOI] [PMC free article] [PubMed] [Google Scholar]
- 29. Pugh RN, Murray‐Lyon IM, Dawson JL, Pietroni MC, Williams R. Transection of the oesophagus for bleeding oesophageal varices. Br J Surg 1973;60:646‐649. [DOI] [PubMed] [Google Scholar]
- 30. Levey AS, Stevens LA, Schmid CH, Zhang YL, Castro AF 3rd, Feldman HI, et al. A new equation to estimate glomerular filtration rate. Ann Intern Med 2009;150:604‐612. [DOI] [PMC free article] [PubMed] [Google Scholar]
- 31. Desquilbet L, Mariotti F. Dose‐response analyses using restricted cubic spline functions in public health research. Stat Med 2010;29:1037‐1057. [DOI] [PubMed] [Google Scholar]
- 32. Kuhn T, Kaaks R, Teucher B, Hirche F, Dierkes J, Weikert C, et al. Dietary, lifestyle, and genetic determinants of vitamin D status: a cross‐sectional analysis from the European Prospective Investigation into Cancer and Nutrition (EPIC)‐Germany study. Eur J Nutr 2014;53:731‐741. [DOI] [PubMed] [Google Scholar]
- 33. Yang L, Chen H, Zhao M, Peng P. Prognostic value of circulating vitamin D binding protein, total, free and bioavailable 25‐hydroxy vitamin D in patients with colorectal cancer. Oncotarget 2017;8:40214‐40221. [DOI] [PMC free article] [PubMed] [Google Scholar]
- 34. Yu C, Xue H, Wang L, Chen Q, Chen X, Zhang Y, et al. Serum bioavailable and free 25‐hydroxyvitamin D levels, but not its total level, are associated with the risk of mortality in patients with coronary artery disease. Circ Res 2018;123:996‐1007. [DOI] [PubMed] [Google Scholar]
- 35. Bhan I, Powe CE, Berg AH, Ankers E, Wenger JB, Karumanchi SA, et al. Bioavailable vitamin D is more tightly linked to mineral metabolism than total vitamin D in incident hemodialysis patients. Kidney Int 2012;82:84‐89. [DOI] [PMC free article] [PubMed] [Google Scholar]
- 36. Louka ML, Fawzy AM, Naiem AM, Elseknedy MF, Abdelhalim AE, Abdelghany MA. Vitamin D and K signaling pathways in hepatocellular carcinoma. Gene 2017;629:108‐116. [DOI] [PubMed] [Google Scholar]
- 37. Chen J, Katz LH, Munoz NM, Gu S, Shin JH, Jogunoori WS, et al. Vitamin D deficiency promotes liver tumor growth in transforming growth factor‐beta/Smad3‐deficient mice through Wnt and toll‐like receptor 7 pathway modulation. Sci Rep 2016;6:30217. [DOI] [PMC free article] [PubMed] [Google Scholar]
- 38. Huang J, Yang G, Huang Y, Kong W, Zhang S. 1,25(OH)2D3 inhibits the progression of hepatocellular carcinoma via downregulating HDAC2 and upregulating P21(WAFI/CIP1). Mol Med Rep 2016;13:1373‐1380. [DOI] [PubMed] [Google Scholar]
- 39. Huang J, Yang G, Huang Y, Zhang S. Inhibitory effects of 1,25(OH)2D3 on the proliferation of hepatocellular carcinoma cells through the downregulation of HDAC2. Oncol Rep 2017;38:1845‐1850. [DOI] [PubMed] [Google Scholar]
- 40. Huang J, Yang G, Huang Y, Zhang S. 1,25(OH)2D3 induced apoptosis of human hepatocellular carcinoma cells in vitro and inhibited their growth in a nude mouse xenograft model by regulating histone deacetylase 2. Biochimie 2018;146:28‐34. [DOI] [PubMed] [Google Scholar]
- 41. Hamilton JP, Potter JJ, Koganti L, Meltzer SJ, Mezey E. Effects of vitamin D3 stimulation of thioredoxin‐interacting protein in hepatocellular carcinoma. Hepatol Res 2014;44:1357‐1366. [DOI] [PMC free article] [PubMed] [Google Scholar]
- 42. Guo J, Ma Z, Ma Q, Wu Z, Fan P, Zhou X, et al. 1, 25(OH)(2)D(3) inhibits hepatocellular carcinoma development through reducing secretion of inflammatory cytokines from immunocytes. Curr Med Chem 2013;20:4131‐4141. [DOI] [PMC free article] [PubMed] [Google Scholar]
- 43. Chiang KC, Yen CL, Yeh CN, Hsu JT, Chen LW, Kuo SF, et al. Hepatocellular carcinoma cells express 25(OH)D‐1alpha‐hydroxylase and are able to convert 25(OH)D to 1alpha,25(OH)(2)D, leading to the 25(OH)D‐induced growth inhibition. J Steroid Biochem Mol Biol 2015;154:47‐52. [DOI] [PubMed] [Google Scholar]
- 44. Yao P, Sun L, Lu L, Ding H, Chen X, Tang L, et al. Effects of genetic and nongenetic factors on total and bioavailable 25(OH)D responses to vitamin D supplementation. J Clin Endocrinol Metab 2017;102:100‐110. [DOI] [PubMed] [Google Scholar]
- 45. Scragg R, Khaw KT, Toop L, Sluyter J, Lawes CMM, Waayer D, et al. Monthly high‐dose vitamin D supplementation and cancer risk: a post hoc analysis of the vitamin D assessment randomized clinical trial. JAMA Oncol 2018;4:e182178. [DOI] [PMC free article] [PubMed] [Google Scholar]
- 46. Manson JE, Cook NR, Lee IM, Christen W, Bassuk SS, Mora S, et al. Vitamin D supplements and prevention of cancer and cardiovascular disease. N Engl J Med 2019;380:33‐44. [DOI] [PMC free article] [PubMed] [Google Scholar]
- 47. Urashima M, Ohdaira H, Akutsu T, Okada S, Yoshida M, Kitajima M, et al. Effect of vitamin D supplementation on relapse‐free survival among patients with digestive tract cancers: the AMATERASU randomized clinical trial. JAMA 2019;321:1361‐1369. [DOI] [PMC free article] [PubMed] [Google Scholar]
- 48. Ng K, Nimeiri HS, McCleary NJ, Abrams TA, Yurgelun MB, Cleary JM, et al. Effect of high‐dose vs standard‐dose vitamin D3 supplementation on progression‐free survival among patients with advanced or metastatic colorectal cancer: the sunshine randomized clinical trial. JAMA 2019;321:1370‐1379. [DOI] [PMC free article] [PubMed] [Google Scholar]
- 49. Arteh J, Narra S, Nair S. Prevalence of vitamin D deficiency in chronic liver disease. Dig Dis Sci 2010;55:2624‐2628. [DOI] [PubMed] [Google Scholar]
- 50. Schottker B, Jorde R, Peasey A, Thorand B, Jansen EH, Groot L, et al. Vitamin D and mortality: meta‐analysis of individual participant data from a large consortium of cohort studies from Europe and the United States. BMJ 2014;348:g3656. [DOI] [PMC free article] [PubMed] [Google Scholar]
Associated Data
This section collects any data citations, data availability statements, or supplementary materials included in this article.
Supplementary Materials