

Abstract
Aim
To identify people in English primary care with equivalent cardiovascular risk to participants in the sodium–glucose co‐transporter‐2 inhibitor (SGLT‐2i) cardiovascular outcome trials (CVOTs). A secondary objective was to report the usage of SGLT‐2is.
Methods
Cross‐sectional analysis of people registered with participating practices in the Royal College of General Practitioners (RCGP) Research and Surveillance Centre (RSC) network on the 31 December 2016. We derived: (1) proportions of the primary care population eligible for inclusion in each SGLT‐2i CVOT (CANVAS, DECLARE, EMPA‐REG and VERTIS); (2) characteristics of the eligible population compared with trial participants (demographics, disease duration and vascular risk); and (3) differences within the eligible population prescribed SGLT‐2is.
Results
The proportions of people with type 2 diabetes (N = 84 394) meeting the inclusion criteria for each CVOT were: DECLARE 27% [95% confidence interval (CI) 26.5–27.1]; CANVAS 17% (16.6–17.1); VERTIS 7% (7.1–7.4); and EMPA‐REG 7% (6.5–6.8). Primary care populations fulfilling inclusion criteria were 5–8 years older than trial cohorts, and <10% with inclusion criteria of each trial were prescribed an SGLT‐2i; a greater proportion were men, and of white ethnicity.
Conclusions
There was variation in proportions of the primary care type 2 diabetes population fulfilling inclusion criteria of SGLT‐2i CVOTs. The more stringent the inclusion criteria, the lower the proportion identified in a primary care setting. Prescription rates for SGLT‐2is were low in this national database, and there were demographic disparities in prescribing.
What’s new?
It is unclear to what extent the findings of the sodium–glucose co‐transporter‐2 (SGLT‐2) inhibitor cardiovascular outcomes trials (CVOTs) are generalizable to the real‐world type 2 diabetes populations.
Using a national primary care database, we found that the inclusion criteria of four SGLT‐2 inhibitor CVOTs applied to between 7% and 27% of people with type 2 diabetes.
Generalizability of the findings from CVOTs to a wider type 2 diabetes population may be restricted to groups defined by the inclusion criteria for each trial.
Uniform inclusion criteria for trials would allow direct comparison to be made between trials.
Introduction
Cardiovascular outcome trials (CVOTs) are randomized controlled trials (RCTs) developed after 2008 following guidance from the US Food and Drug Administration (FDA) to ensure the cardiovascular safety of glucose‐lowering medications in type 2 diabetes 1. CVOTs were principally designed to determine safety/non‐inferiority of newer glucose‐lowering drugs compared with placebo when added to standard care. The primary composite trial endpoint comprised death due to cardiovascular causes, non‐fatal myocardial infarction and non‐fatal stroke. However, cardiovascular superiority has also been demonstrated in six CVOTs, with significant reductions for the primary composite endpoint for canagliflozin and empagliflozin from the sodium–glucose co‐transporter‐2 inhibitor (SGLT‐2i) medication class, and liraglutide, albiglutide, semaglutide and dulaglutide, from the glucagon‐like peptide‐1 receptor agonist (GLP‐1 RA) medication class 2, 3, 4, 5, 6, 7.
Generalizability of these trials to real‐world type 2 diabetes populations is challenging because each trial had different inclusion criteria. A national primary care comparison of the first SGLT‐2i CVOT, the Empagliflozin Cardiovascular Outcome Event Trial in Type 2 Diabetes Mellitus Patients–Removing Excess Glucose (EMPA‐REG OUTCOME) trial, showed that only a small proportion of people with type 2 diabetes conformed to the trial inclusion criteria 8. This was due to the high cardiovascular risk inclusion criteria of the trial. The rationale behind selecting people at high cardiovascular risk is that adverse cardiovascular events can be expected to occur in this group over the shortest period, limiting duration and costs of the trials 9. More recently, several studies have reported that the proportion of people meeting inclusion criteria vary considerably between four SGLT‐2i CVOTs 10, 11, 12. Further analysis of other real‐world clinical data is essential to determine how the differing inclusion criteria affect the generalizability of SGLT‐2i CVOTs.
The aims of the present study were: (1) to describe differences between CVOT inclusion criteria; (2) their implications for the proportion of the diabetes population that this trial evidence would include; and (3) the proportions prescribed SGLT‐2is, reporting any disparity in prescribing of SGLT‐2is.
Methods
Study design and data source
We conducted a cross‐sectional analysis of adults with type 2 diabetes in the Royal College of General Practitioners (RCGP) Research and Surveillance Centre (RSC) database to identify those that shared comparable cardiovascular risk to participants in each SGLT‐2i CVOT: Canagliflozin Cardiovascular Assessment Study (CANVAS) and CANVAS‐Renal (collectively known as the CANVAS Program) 6, 13; Dapagliflozin Effect on Cardiovascular Events–Thrombolysis in Myocardial Infarction 58 (DECLARE‐TIMI 58); EMPA‐REG OUTCOME; and eValuation of ERTugliflozin effIcacy and Safety CardioVascular outcomes trial (VERTIS CV) 7, 14, 15. The planned methods for this study have previously been reported 16.
The RCGP RSC is a sentinel network of primary care practices from across England. The network comprises > 200 practices, with a population in excess of 2 million people 17, and is representative of the national population 18. Data quality of the RCGP RSC, and for UK primary care in general, is particularly high since the introduction of a pay‐for‐performance scheme, the Quality and Outcomes Framework in 2004 19.
In the UK, primary care medical records are computerized, and key data were recorded, at the time of this study using a comprehensive primary care terminology called the ‘Read codes’ 20. The Read classification includes clinical codes for diagnosed conditions, treatments, processes of care and laboratory data. UK primary care is a registration‐based system; citizens are registered with a single practice, and have a unique identifier, the National Health Service (NHS) number. This allowed us to determine an accurate denominator for the RCGP RSC population.
Data were extracted from the primary care records of all people registered with practices in the RCGP RSC database on 31 December 2016, and included those with type 2 diabetes aged 18 years or more on this date. We identified the proportion of people with type 2 diabetes that met the cardiovascular inclusion criteria across the four SGLT‐2i CVOTs (Table 1). We then described the clinical characteristics of each identified group, and compared these with equivalent data from the trials. In addition, we determined the proportions of people in each group that had previously been prescribed an SGLT‐2i, reporting gender, ethnicity and socio‐economic status. Socio‐economic status was determined at the individual level by converting individual postcode to Index of Multiple Deprivation (IMD) 21; this is a machine processed activity at the point of data extraction, with researchers not having access to individual’s postcodes. We then, converted IMD scores into a categorical variable, quintiles, with quintile 1 being the most, and quintile 5 the least deprived.
Table 1.
Inclusion criteria used in SGLT‐2i cardiovascular outcomes trials
| Criteria | Trial (drug) | ||||
|---|---|---|---|---|---|
|
(canagliflozin) |
DECLARE‐TIMI 58 15 (dapagliflozin) |
EMPA‐REG OUTCOME 7 (empagliflozin) |
VERTIS CV 14 (ertugliflozin) |
||
| Age (years) | ≥ 30 and history of CVD, or ≥ 50 and with CV risk factors | ≥ 40 and history of CVD, or ≥ 55 (males) or ≥ 60 (females) and with CV risk factors | ≥ 18 | ≥ 40 | |
| HbA1c | mmol/mol | ≥ 53 and ≤ 91 | ≥ 48 and ≤ 108 | ≥ 53 and ≤ 86 | ≥ 53 and ≤ 91 |
| % | ≥ 7.0 and ≤ 10.5 | ≥ 6.5 and ≤ 12.0 | ≥ 7.0 and ≤ 10.0 | ≥ 7.0 and ≤ 10.5 | |
| Renal function | eGFR (ml min−1 1.73 m−2) | ≥ 30 | No criterion | ≥ 30 | No criterion |
| CrCl (ml/min) | No criterion | ≥60 | No criterion | No criterion | |
| BMI (kg/m2) | No criterion | No criterion | ≤ 45 | ≥ 18 | |
| History of CVD (≥ 1 of the following) | |||||
| Coronary |
|
|
|
|
|
| Cerebrovascular | Stroke |
|
|
|
|
| Peripheral |
|
|
≥ 1 of the following:
>50% or hemodynamically significant via non‐invasive methods) in one limb
|
Peripheral arterial disease as indicated by:
|
|
| No history of CVD | |||||
| ≥ 2 of the following: | ≥ 1 of the following: | No criterion | No criterion | ||
| Hypertension | SBP ≥ 140 mmHg while on ≥ 1 anti‐hypertensive agents | Blood pressure >140/90 mm/Hg or on anti‐hypertensive therapy | |||
| Dyslipidaemia | HDL cholesterol <1 mmol/l) | LDL‐ cholesterol >130 mg/dl (3.36 mmol/l) within last 12 months or on lipid lowering therapy for at least 12 months | |||
| Duration of diabetes (years) | ≥10 | No criterion | |||
| Renal function | Micro‐ or macroalbuminuria | No criterion | |||
| Smoking status | Current smoker | Current smoker (5 cigarettes/day or more for at least 1 year) | |||
ABI, ankle : brachial index; CABG, coronary artery bypass graft; CrCl, creatinine clearance; CV, cardiovascular; CVD, cardiovascular disease; SBP, systolic blood pressure.
Identifying study groups
We used an established ontological and algorithmic approach to identify people with type 2 diabetes. In the first step, all people with diabetes were identified according to diagnosis of diabetes (excluding gestational diabetes and other types of secondary diabetes), clinical investigations (blood glucose and HbA1c), and glucose‐lowering medications (except metformin). These people were then categorized by diabetes type (type 1, type 2, undetermined) using a seven‐step algorithm, which takes into account age, type of medication and BMI 22.
To identify groups of people with equivalent cardiovascular risk to the SGLT‐2i CVOTs, we used the nearest matching Read codes available to determine cardiovascular risk factors 16. These include codes for diagnosis, procedures and laboratory‐based data. Wider criteria were used for particular conditions not recorded in primary care. For example, for hospital admission for unstable angina, we used diagnosis codes for unstable angina and codes indicating poor angina control (Table S1). For the DECLARE inclusion criteria we used eGFR ≥ 60 ml min−1 1.73m−2 as a surrogate marker for creatinine clearance (CrCl) ≥ 60 ml/min.
Data analysis
The demographic and clinical characteristics of people meeting the inclusion criteria of each trial were compared with equivalent data for the previously published trials. These data included age, gender, ethnicity, HbA1c, BMI, blood pressure (SBP and DBP), presence of hypertension, renal function using eGFR, duration of diabetes, presence of cardiovascular disease (CVD), and glucose‐lowering medications.
Age was defined as of the end of the study period (31 December 2016), whereas BMI was taken from the most recently recorded values. For missing data, BMI was calculated using weight and height. HbA1c and blood pressure were also defined using the latest recorded measurements.
To capture data on currently used medications, we took the most recent prescriptions in the 6 months before 31 December 2016. The eGFR was calculated based on the latest serum creatinine value entered into the individual’s medical record, with at least two values required that were recorded 90 days or more apart 23. Duration of diabetes was determined from the first event that indicated diabetes, which included diagnosis codes, investigation results to indicate diabetes, or the date for a first prescription of a glucose‐lowering drug. Presence of hypertension and CVD were captured from the first recorded diagnosis in the individuals’ medical records.
Statistical analysis
We calculated the proportion of people that met the inclusion criteria for each trial. We described their clinical characteristics, using proportions for categorical variables, and mean (sd) and median (IQR) to report continuous data. These data were compared with the baseline characteristics described in the completed trials: CANVAS Program, DECLARE‐TIMI 58 and EMPA‐REG OUTCOME.
Finally, we report any disparity within the population eligible to start this class of medicines and those ever prescribed at least one SGLT‐2i. The percentages of people prescribed an SGLT‐2i were reported according to the areas of potential disparity (gender, ethnicity and socio‐economic status), and 95% confidence intervals (CI) calculated to explore differences.
Sensitivity analysis
For sensitivity analysis, we restricted our analysis to complete cases. Because each trial had specific inclusion criteria, we created separate subsets of people with type 2 diabetes that were relevant to each CVOT in terms of specific variables to remove missing cases for (Appendix [Link]). Using the subsets with complete cases, we then recalculated the proportion of people that met the inclusion criteria of each CVOT.
Ethical considerations
This study was approved by the RCGP RSC Research Approval Committee (RSC_CLIN_0218), and was determined by the Health Research Authority/Medical Research Council online tool as a clinical audit not requiring formal ethics committee review 24. Data were pseudonymized at the point of extraction, so personal data were not identifiable to the researchers.
Results
Data were analysed from the computerized medical records of 1 595 445 people across 164 practices in the RCGP RSC network. Within this population, we identified 84 394 adults with type 2 diabetes. Of these, the following numbers of people met the inclusion criteria for cardiovascular risk in each trial: CANVAS 14 227 (17%; 95% CI 16.6–17.1); DECLARE 22 651 (27%; 26.5–27.1); EMPA‐REG 5628 (7%; 6.5–6.8); VERTIS 6119 (7%; 7.1–7.4).
Participants in the CVOTs were younger than people in the RCGP RSC database with equivalent cardiovascular risk factors (CANVAS 63.2 vs. 69.9 years; DECLARE 63.9 vs. 69.3 years; EMPA‐REG 63.1 vs. 71.8 years), but shared a similar mean BMI and eGFR (Table 2). Duration of diabetes and HbA1c were also similar, except for longer duration of disease (11.0 vs. 9.7 years) and higher HbA1c in participants in the DECLARE trial than RCGP RSC individuals that met the inclusion criteria (67 vs. 61 mmol/mol; 8.3% vs. 7.7%). A higher proportion of participants in the CANVAS and DECLARE trials were of white ethnicity (CANVAS 78% vs. 72%; DECLARE 80% vs. 71%) than people eligible for each trial in the RCGP RSC database, but there were similar proportions for EMPA‐REG (73% vs. 74%). Blood pressure values were marginally higher in the trial participants; however, hypertension was substantially more common in the CANVAS and EMPA‐REG trials than in people that met the inclusion criteria for the CVOTs (CANVAS 90% vs. 75%; EMPA‐REG 95% vs. 72%).
Table 2.
Characteristics of participants for SGLT‐2i cardiovascular outcomes trials and people in the RCGP RSC population that met inclusion criteria for each trial
| Characteristic* | CANVAS Program (canagliflozin) | DECLARE‐TIMI 58 (dapagliflozin) | EMPA‐REG OUTCOME (empagliflozin) | VERTIS CV (ertugliflozin) | ||||
|---|---|---|---|---|---|---|---|---|
|
CANVAS participants† (N = 5795) |
RCGP RSC – CANVAS inclusion criteria (N = 14 227) |
DECLARE participants‡ (N = 8582) |
RCGP RSC ‐ DECLARE inclusion criteria (N = 22 651) |
EMPA‐REG participants§ (N = 4687) |
RCGP RSC ‐ EMPA‐REG inclusion criteria (N = 5628) |
RCGP RSC ‐ VERTIS inclusion criteria (N = 6119) |
||
| Age (years) | 63.2 ± 8.3 | 69.9 ± 10.7 | 63.9 ± 6.8 | 69.3 ± 8.8 | 63.1 ± 8.6 | 71.8 ± 10.5 | 71.8 ± 10.5 | |
| Men | 3759 (64.9) | 9298 (65.4) | 5411 (63.1) | 14 162 (62.5) | 3336 (71.2) | 3950 (70.2) | 4311 (70.5) | |
| HbA1c | % | 8.2 ± 0.9 | 8.1 ± 0.9 | 8.3 ± 1.2 | 7.7 ± 1.3 | 8.1 ± 0.9 | 7.9 ± 0.8 | 8.0 ± 0.9 |
| mmol/mol | 66 ± 10 | 65 ± 10 | 67 ± 13 | 61 ± 14 | 65 ± 9 | 63 ± 8 | 64 ± 10 | |
| BMI (kg/m2) | 31.9 ± 5.9 | 31.1 ± 6.1 | 32.1 ± 6.0 | 31.1 ± 6.2 | 30.6 ± 5.3 | 30.3 ± 5.3 | 30.7 ± 5.9 | |
| SBP (mmHg) | 136.4 ± 15.8 | 134.5 ± 15.4 | 135.1 ± 15.3 | 133.5 ± 14.1 | 135.3 ± 16.9 | 131.7 ± 15.2 | 131.9 ± 15.5 | |
| DBP (mmHg) | 77.6 ± 9.6 | 74.0 ± 9.6 | NR | 74.5 ± 9.1 | 76.6 ± 9.7 | 72.4 ± 9.5 | 72.2 ± 9.7 | |
| Hypertension¶ | 5188 (89.5) | 10 705 (75.2) | 6977 (81.3) | 18 525 (81.8) | 4446 (94.9) | 4046 (71.9) | 4438 (72.5) | |
| eGFR (ml min−1 1.73 m−2) | 76.7 ± 20.3 | 76.0 ± 21.0 | 85.4 ± 15.8 | 83.8 ± 12.7 | 74.2 ± 21.6 | 72.7 ± 20.8 | 70.5 ± 23.0 | |
| Ethnicity | ||||||||
| White | 4508 (77.8) | 10 222 (71.8) | 6843 (79.7) | 16 152 (71.3) | 3403 (72.6) | 4142 (73.6) | 4491 (73.4) | |
| Non‐white‖ | 1287 (22.2) | 1896 (13.3) | 1739 (20.3) | 3095 (13.7) | 1284 (27.4)** | 609 (10.8) | 679 (11.1) | |
| Missing | – | 2109 (14.8) | – | 3404 (15.0) | – | 877 (15.6) | 949 (15.5) | |
| Duration of diabetes (years) | ||||||||
| Mean duration | 13.5 ± 7.7 | 13.5 ± 7.5 | NR | 10.4 ± 7.1 | NR | 13.0 ± 8.2 | 13.3 ± 8.4 | |
| Median duration (IQR) | NR | 12.9 (8.8–17.1) | 11.0 (6.0–16.0) | 9.7 (5.1–14.4) | NR | 12.1 (7.1–16.9) | 12.4 (7.3–17.5) | |
CVD, cardiovascular disease; NR, not reported.
Unless specified, data are mean ± sd or n (%).
Pooled canagliflozin participants (100 and 300 mg doses) in CANVAS or CANVAS‐R trials.
Dapagliflozin participants (10 mg doses).
Pooled empagliflozin participants (10 and 25 mg doses).
Previous hypertension or on antihypertensive therapy.
Trial data includes Asian, black and other ethnicity; RCGP RSC includes Asian, black, mixed ethnicity, and other ethnicity.
EMPA‐REG trial included 41 participants categorised as ‘other/missing’ ethnicity.
Differences in prevalence of CVD between the CVOTs and people meeting inclusion of each trial were also found. Approximately 25% more participants in the CANVAS trial had any type of CVD compared with people in the RCGP RSC database with equivalent CV risk factors (71% vs. 46%), whereas two‐fifths (40%) of participants in the DECLARE trial had any type of CVD compared with only a quarter (25%) of people in the RCGP RSC database (Table 3). People who met the inclusion criteria for the EMPA‐REG CVOT were equally likely to have CVD as the participants themselves.
Table 3.
Proportion of people according to type of cardiovascular disease in the RCGP RSC population that met inclusion criteria for SGLT‐2i cardiovascular outcomes trial
| History of CVD* | CANVAS Program (canagliflozin) | DECLARE‐TIMI 58 (dapagliflozin) | EMPA‐REG OUTCOME (empagliflozin) | VERTIS CV (ertugliflozin) | |||
|---|---|---|---|---|---|---|---|
|
CANVAS participants† (N = 5795) |
RCGP RSC – CANVAS inclusion criteria (N = 14 227) |
DECLARE participants‡ (N = 8582) |
RCGP RSC – DECLARE inclusion criteria (N = 22 651) |
EMPA‐REG participants§ (N = 4687) |
RCGP RSC – EMPA‐REG inclusion criteria (N = 5628) |
RCGP RSC – VERTIS inclusion criteria (N = 6119) |
|
| Coronary | 3234 (55.8) | 3750 (26.4) | 2824 (32.9) | 3773 (16.7) | 3545 (75.6) | 3506 (62.3) | 3787 (61.9) |
| Cerebrovascular | 1113 (19.2) | 2307 (16.2) | 653 (7.6) | 1719 (7.6) | 1084 (23.1) | 1508 (26.8) | 1637 (26.8) |
| Peripheral | 1176 (20.3) | 1630 (11.5) | 522 (6.1) | 1722 (7.6) | 982 (21.0) | 1545 (27.5) | 1747 (28.6) |
| Any | 4127 (71.2) | 6489 (45.6) | 3474 (40.5) | 5555 (24.5) | 4657 (99.4) | 5628 (100.0) | 6119 (100.0) |
Data are n (%).
Pooled canagliflozin participants (100 and 300 mg doses) in CANVAS or CANVAS‐R trials.
Dapagliflozin participants (10 mg doses).
Pooled empagliflozin participants (10 and 25 mg doses).
Fewer than one in ten people who met the inclusion criteria of any of the CVOTs were prescribed an SGLT‐2i (Fig. 1). Insulin use was at least 50% more common in the trial populations than in people that met trial inclusion criteria in the RCGP RSC database. Use of sulfonylureas and metformin was also more common in the trial populations (Table 4). A greater proportion of men compared with women, and people of white ethnicity compared with black ethnicity were prescribed SGLT‐2is across each group identified as eligible for the CVOTs. Prescribing rates were also higher in the IMD quintile 1 (most deprived) compared with IMD quintile 5 (least deprived) in the eligible populations for the CANVAS and DECLARE trials (Table 5), but there was some intersection amongst the other quintiles.
FIGURE 1.
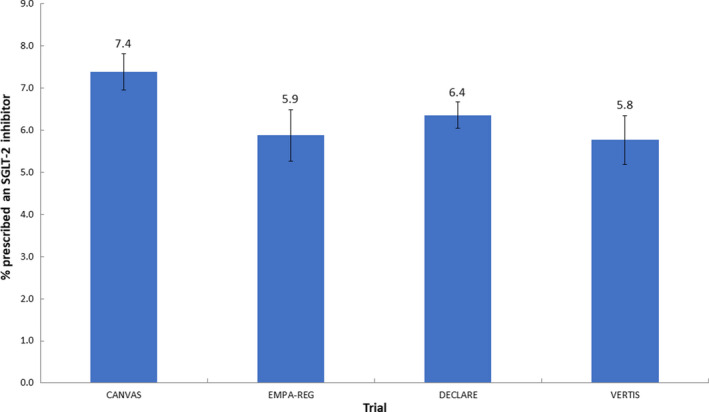
The proportion of people in the RCGP RSC database meeting trial eligibility criteria and were prescribed SGLT‐2is.
Table 4.
Proportion of people according to diabetes medication use in the RCGP RSC population that met inclusion criteria for each SGLT‐2i cardiovascular outcomes trial
| Glucose lowering therapies* | CANVAS Program (canagliflozin) | DECLARE‐TIMI 58 (dapagliflozin) | EMPA‐REG OUTCOME (empagliflozin) | VERTIS CV (ertugliflozin) | |||
|---|---|---|---|---|---|---|---|
|
CANVAS participants† (N = 5795) |
RCGP RSC – CANVAS inclusion criteria (N = 14 227) |
DECLARE participants‡ (N = 8582) |
RCGP RSC – DECLARE inclusion criteria (N = 22 651) |
EMPA‐REG participants§ (N = 4687) |
RCGP RSC – EMPA‐REG inclusion criteria (N = 5628) |
RCGP RSC – VERTIS inclusion criteria (N = 6119) |
|
| Metformin | 4447 (76.7) | 10 201 (71.7) | 7020 (81.8) | 16 103 (71.1) | 3459 (73.8) | 3752 (66.7) | 3927 (64.2) |
| Insulin | 2890 (49.9) | 4437 (31.2) | 3567 (41.6) | 4042 (17.8) | 2252 (48.0) | 1753 (31.1) | 2097 (34.3) |
| Sulfonylurea | 2528 (43.6) | 5509 (38.7) | 3615 (42.1) | 6862 (30.3) | 2014 (43.0) | 1921 (34.1) | 2061 (33.7) |
| DPP‐4 inhibitor | 697 (12.0) | 3400 (23.9) | 1418 (16.5) | 4080 (18.0) | 529 (11.3) | 1238 (22.0) | 1363 (22.3) |
| Thiazolidinedione | NR | 487 (3.4) | NR | 688 (3.0) | 198 (4.2) | 136 (2.4) | 146 (2.4) |
| GLP‐1 RA | 222 (3.8) | 860 (6.0) | 397 (4.6) | 996 (4.4) | 126 (2.7) | 262 (4.7) | 291 (4.8) |
Data are n (%).
Pooled canagliflozin participants (100 and 300 mg doses) in CANVAS or CANVAS‐R trials.
Dapagliflozin participants (10 mg doses).
Pooled empagliflozin participants (10 and 25 mg doses).
Table 5.
Disparities in individuals prescribed SGLT‐2is within the type 2 diabetes population who meet the cardiovascular outcomes trial inclusion criteria*
| Characteristic |
RCGP RSC – CANVAS inclusion criteria (N = 14 227) |
RCGP RSC – DECLARE inclusion criteria (N = 22 651) |
RCGP RSC – EMPA‐REG inclusion criteria (N = 5628) |
RCGP RSC – VERTIS inclusion criteria (N = 6119) | ||||
|---|---|---|---|---|---|---|---|---|
| n | % (95% CI) | n | % (95% CI) | n | % (95% CI) | n | % (95% CI) | |
| Gender | ||||||||
| Men | 742 | 8.0 (7.43–8.54) | 989 | 7.0 (6.57–7.41) | 258 | 6.5 (5.77–7.32) | 273 | 6.3 (5.61–7.07) |
| Women | 309 | 6.3 (5.60–6.96) | 452 | 5.3 (4.85–5.81) | 73 | 4.4 (3.40–5.36) | 80 | 4.4 (3.48–5.42) |
| Ethnicity | ||||||||
| White | 789 | 7.7 (7.21–8.24) | 1085 | 6.7 (6.33–7.11) | 244 | 5.9 (5.19–6.62) | 258 | 5.7 (5.08–6.44) |
| Asian | 87 | 7.0 (5.60–8.40) | 106 | 5.6 (4.62–6.69) | 25 | 5.7 (3.65–7.99) | 26 | 5.3 (3.50–7.41) |
| Black | 12 | 2.6 (1.32–4.19) | 22 | 2.4 (1.43–3.51) | 2 | 1.9 (0.00–4.67) | 2 | 1.7 (0.00–4.13) |
| Mixed | 13 | 13.4 (7.22–20.62) | 11 | 7.8 (3.55–12.77) | 5 | 19.2 (3.85–34.62) | 6 | 18.8 (6.25–34.38) |
| Other | 9 | 9.5 (4.21–15.79) | 11 | 7.0 (3.16–11.39) | 3 | 7.9 (0.00–18.42) | 4 | 10.0 (2.50–20.00) |
| Missing | 141 | 6.7 (5.64–7.78) | 206 | 6.1 (5.26–6.87) | 52 | 5.9 (4.45–7.53) | 57 | 6.0 (4.53–7.59) |
| IMD Quintile | ||||||||
| IMD quintile 5 (least deprived) | 206 | 6.6 (5.72–7.48) | 303 | 5.8 (5.15–6.43) | 66 | 5.2 (4.05–6.51) | 69 | 5.1 (4.01–6.31) |
| IMD quintile 4 | 220 | 7.4 (6.50–8.40) | 322 | 6.7 (5.98–7.40) | 81 | 6.8 (5.36–8.21) | 89 | 6.9 (5.57–8.28) |
| IMD quintile 3 | 187 | 6.9 (5.95–7.82) | 243 | 5.6 (4.91–6.26) | 68 | 6.0 (4.67–7.41) | 72 | 5.9 (4.59–7.30) |
| IMD quintile 2 | 186 | 7.2 (6.22–8.19) | 252 | 6.4 (5.67–7.20) | 52 | 5.2 (3.87–6.55) | 57 | 5.1 (3.84–6.42) |
| IMD quintile 1 (most deprived) | 250 | 8.9 (7.86–9.96) | 319 | 7.5 (6.68–8.25) | 63 | 6.1 (4.68–7.60) | 65 | 5.8 (4.43–7.18) |
| Missing | 2 | 8.0 (0.00–20.00) | 2 | 5.1 (0.00–12.82) | 1 | 14.3 (0.00–42.86) | 1 | 10.0 (0.00–30.00) |
Proportions of people in the RCGP RSC population eligible for each cardiovascular outcomes trials (CVOT) ever prescribed SGLT‐2is, stratified by gender, ethnicity and IMD quintile. For example, 7.7% (95% CI 7.21–8.24) of people of white ethnicity (N = 10 222) in the RCGP RSC – CANVAS cohort were ever prescribed an SGLT‐2i compared with 2.6% (95% CI 1.32–4.19) of people of black ethnicity (N = 454).
Sensitivity analysis
Proportions of missing data for each variable are provided (Table S2). Between 6% and 23% of cases were removed from the type 2 diabetes cohort for the complete case analysis (Table S3). The proportions of people identified for each CVOT were slightly higher (Table S4) than those in our primary analysis, but DECLARE remained the most representative of the trials.
Discussion
This study in primary care confirmed that between 7% and 27% of the type 2 diabetes population fulfil the inclusion criteria of the SGLT‐2i CVOTs. There are categorical differences in the inclusion criteria of the CVOTs for the SGLT‐2is. The differences between inclusion criteria are related to the level of cardiovascular risk. The population eligible to participate seen in practice are similar; however, the practice population who meet the inclusion criteria are 5 to 8 years older. We also report that only ~ 10% of those who meet the study criteria are currently prescribed SGLT‐2is and how disparities may exist in prescribing, with a bias towards prescribing to men and white ethnicity.
When guidance for the CVOTs was first released in 2008, the FDA advised that the trials should comprise people at greater risk of cardiovascular events, including those with advanced duration of diabetes, older people and those with impaired kidney function 1. These inclusion requirements are typical of RCT design, in which participants must be at high risk of experiencing the specific outcome in an appropriate amount of time; less than 5 years in the case of CVOTs 9. A consequence of these inclusion criteria is that the findings only apply to a subset of the type 2 diabetes population. As yet, the findings of CVOTs cannot be applied to the wider type 2 diabetes population. Our study highlights the impact of the differences between inclusion criteria of each of the SGLT‐2i CVOTs.
The eligibility criteria for CVOT trial recruitment followed what investigators of each CVOT deemed to be a high‐risk population. The EMPA‐REG OUTCOME trial had the most selective criteria of a history of CVD, and at least 18 years of age 7. In the CANVAS trial, approximately two‐thirds of participants were > 30 years of age with established CVD, the remaining participants were aged ≥ 50 years with at least two risk factors but no history of CVD 6. The VERTIS‐CV trial is yet to be completed, but includes only people aged ≥ 40 years with previous CVD 14. The DECLARE trial had the broadest eligibility criteria, with just 41% of participants aged ≥ 40 years with established CVD, while the remaining participants were men ≥ 55 years and women ≥ 60 years with one or more risk factors 15. The differences in the inclusion criteria were reflected in our study, with the lowest proportion of people identified using the EMPA‐REG OUTCOME and VERTIS criteria (both 7%), followed by CANVAS (17%), and DECLARE (27%). These data support the findings of other CVOT eligibility‐based studies, which also showed substantial differences between the proportions of people identified according to inclusion criteria of each trial. In the retrospective cross‐sectional study of 20 293 people in the National Health and Nutrition Examination Survey (NHANES), weighted analyses demonstrated between 4% and 40% of the US population were eligible for the SGLT‐2i CVOTs 12. A European‐based observational study of 803 836 people from Germany, the Netherlands, Norway and Sweden, found that 17% to 59% met the main criteria for the CVOTs 10. More recently, DISCOVER, a 3‐year prospective cohort study of 15 992 people with type 2 diabetes from four regions of the world (Asia‐Pacific, Europe, Latin America, and Middle East and Africa) identified 7% to 41% of the cohort as eligible for the CVOTs 11. Again, DECLARE was the most representative CVOT in the above studies.
The implications of these data are that the findings of the SGLT‐2i CVOTs may apply only to particular subgroups of people with type 2 diabetes – those with a history of CVD or with risk factors for CVD. This feature is highlighted in the recent ADA and EASD joint guidelines for managing hyperglycaemia, which recommend SGLT‐2is as a second line therapy only in people with previous atherosclerotic CVD or chronic kidney disease 25. Moreover, the inclusion criteria of the trials vary, so that the more highly selective these were, the smaller proportion of people (from the RCGP RSC database) eligible. Comparing the findings from the trials themselves is complex because the eligibility of the trials differ, and this is demonstrated by this study in terms of the proportions of people identified and population characteristics. Uniformity in participant selection would make such comparisons more achievable.
When considering usage of SGLT‐2is, prescribing rates were low (< 10%) in the subgroups of people with type 2 diabetes with equivalent risk for cardiovascular events to the trials. Given the positive results of the trials to date, this may seem surprising. Several factors are likely to have influenced these figures. First, prescribing of SGLT‐2is is influenced by renal function; initiation of SGLT‐2is is not licensed if eGFR < 60 ml min−1 1.73m−2, and continuation only permitted if eGFR ≥ 45 ml min−1 1.73m−2 26. Many people with type 2 diabetes have impaired kidney function, and therefore were not prescribed these drugs. In addition, the latest UK National Institute for Health and Care Excellence (NICE) guidelines for the management of type 2 diabetes were published in 2015 before evidence of cardiovascular safety/efficacy were available 27. SGLT‐2is are recommended by NICE as a third line therapy, an add on to metformin, pioglitazone or sulfonylurea, with a specific focus on improving blood glucose levels. More recently, other national and international guidelines have acknowledged the positive findings of CVOTs, and recommend medications with demonstrable cardiovascular benefit earlier in the treatment pathway for people with established CVD 25, 28. Updated analyses of these data, therefore, may show increased prescribing of SGLT‐2is in people with a history of CVD.
Strengths and limitations
The RCGP RSC database contains a large nationally representative population, which has been demonstrated to have a high level of data completeness 18, 22, 29. However, there may be some selection bias in terms of the volunteer practices of the RCGP RSC network, and these are marginally in more affluent areas compared with the English population as a whole 18.
The data source used to identify people according to the inclusion criteria of each trial carries several limitations. There is some likelihood of missing data due to failure to enter key information into a person’s medical record (such as diagnoses, key risk factors), and recording of data in different healthcare systems. For instance, incidence of myocardial infarction is lower in the RCGP RSC database than primary care data that are linked to hospital data such as Clinical Practice Research Datalink; crude rates: 96.9 and 186.7 per 100 000 respectively 29, 30. However, pay‐for‐performance for chronic disease management, which relies on coding for payment 19, encouraged coding.
Because of the nature of the data source, it is likely that the number of people identified was underestimated for some variables. For example, ankle–brachial index and peripheral revascularization are procedures that are not commonly used in primary care, and there may be a lag in case ascertainment in primary care. Identification of the inclusion criteria was restricted by the use of the clinical codes, Read codes, used in UK primary care. As such, the closest matching codes available were used to capture information on diagnosis or risks factors, which may have led to an overestimation of people that met the inclusion criteria.
The sensitivity analysis showed only slightly higher proportions of people met the inclusion criteria of the trials, and these data supported our primary analysis. However, we were unable to remove missing data for different types of disease because the presence of a condition in primary care records was indicated only by the date an entry was made; unless a date is present in a person’s record, it is assumed that the individual does not have the condition, when it may in fact be undiagnosed. This is a limitation of secondary use of observational data.
Conclusions
The CVOTs are important trials assessing cardiovascular safety of new classes of drugs used in the management of type 2 diabetes. The cardiovascular benefits of SGLT‐2is from these trials were important new findings. However, the more stringent the inclusion criteria, the lower the proportion identified in a primary care setting. The generalizability of the findings to a wider type 2 diabetes population may be restricted to groups defined by the inclusion criteria for each trial. Direct comparability of CVOTs will only be possible if, in future, they move towards common inclusion criteria. Only a small proportion of those who meet trial inclusion criteria currently receive these medicines, although this may change as the outcomes of these trials become more widely known.
Funding sources
Sponsorship for this study and article processing charges were funded by AstraZeneca UK Limited. All authors have full access to all of the data in this study and take complete responsibility for the integrity of the data and accuracy of the data analysis.
Competing interests
W.H. has had part of his academic salary funded from grant awards with Eli Lilly and Company, Novo Nordisk Limited and AstraZeneca UK Ltd. M.F. receives financial support for research, speaker meetings and consultancy from AMGEN, MSD, Merck, AstraZeneca, Pfizer, Novo Nordisk Ltd, Eli Lilly and Co., and Sanofi‐Aventis. N.M. has received financial support for research, speaker meetings and consultancy from MSD, Merck, BMS, AstraZeneca, Pfizer, Novo Nordisk Ltd, Eli Lilly and Co., and Sanofi‐Aventis. M.J. has nothing to declare. S.d.L. holds grants from Eli Lilly and Company, GlaxoSmithKline, Takeda, AstraZeneca and Novo Nordisk Ltd through the University of Surrey for investigator lead research in diabetes.
Author contributions
W.H. led the drafting of the manuscript. M.F., N.M., M.J. and S.d.L. reviewed the manuscript and study design and contributed to the final manuscript draft.
Supporting information
Table S1. Variables used in the RCGP RSC database to match against the inclusion criteria of each SGLT‐2 inhibitor CVOT (CANVAS Program, DECLARE‐TIMI 58, EMPA‐REG OUTCOME, and VERTIS CV).
Table S2. Proportion of missing data per variable excluded in complete case analysis.
Table S3. Proportion of complete cases in the T2DM population prior to creation of SGLT‐2i CVOTs subsets.
Table S4. Proportion of people with complete cases that met the inclusion criteria of each SGLT‐2i CVOT.
Acknowledgements
The authors would like to thank patients and practices who are members of the RCGP RSC network, and allow their records to be used for this study. The computerized medical record (CMR) system vendors: EMIS, In Practice and TPP. We would also like to thank Apollo Medical systems, the RCGP and University of Surrey colleagues: Filipa Ferreira (Senior Project Manager), Rachel Byford, and Julian Sherlock (SQL developers).
Variables screened for missing data for analysis of complete cases only as part of a sensitivity analysis.
CANVAS
Age; HbA1c; eGFR; Systolic blood pressure; High‐density lipoprotein cholesterol; Microalbuminuria; Smoking status
DECLARE
Age; HbA1c; eGFR; Systolic blood pressure; Diastolic blood pressure; Low‐density lipoprotein cholesterol; Smoking status
EMPA‐REG
Age; HbA1c; eGFR; BMI
VERTIS
Age; HbA1c; eGFR; BMI
Diabet. Med. 37, 1499–1508(2020)
References
- 1. U.S. Department of Health and Human Services Food and Drug Administration Center for Drug Evaluation and Research (CDER) . Guidance for Industry: Diabetes Mellitus — Evaluating Cardiovascular Risk in New Antidiabetic Therapies to Treat Type 2 Diabetes; 2008. Available https://www.fda.gov/downloads/Drugs/GuidanceComplianceRegulatoryInformation/Guidances/ucm071627.pdf Last accessed 2 January 2020. [Google Scholar]
- 2. Gerstein HC, Colhoun HM, Dagenais GR, Diaz R, Lakshmanan M, Pais P et al Dulaglutide and cardiovascular outcomes in type 2 diabetes (REWIND): a double‐blind, randomised placebo‐controlled trial. Lancet 2019; 394: 121–130. [DOI] [PubMed] [Google Scholar]
- 3. Hernandez AF, Green JB, Janmohamed S, D’Agostino RB Sr, Granger CB, Jones NP et al Albiglutide and cardiovascular outcomes in patients with type 2 diabetes and cardiovascular disease (Harmony Outcomes): a double‐blind, randomised placebo‐controlled trial. Lancet 2018; 392: 1519–1529. [DOI] [PubMed] [Google Scholar]
- 4. Marso SP, Bain SC, Consoli A, Eliaschewitz FG, Jodar E, Leiter LA et al Semaglutide and cardiovascular outcomes in patients with type 2 diabetes. N Engl J Med 2016; 375: 1834–1844. [DOI] [PubMed] [Google Scholar]
- 5. Marso SP, Daniels GH, Brown‐Frandsen K, Kristensen P, Mann JF, Nauck MA et al Liraglutide and cardiovascular outcomes in type 2 diabetes. N Engl J Med 2016; 375: 311–322. [DOI] [PMC free article] [PubMed] [Google Scholar]
- 6. Neal B, Perkovic V, Mahaffey KW, de Zeeuw D, Fulcher G, Erondu N et al Canagliflozin and cardiovascular and renal events in type 2 diabetes. N Engl J Med 2017; 377: 644–657. [DOI] [PubMed] [Google Scholar]
- 7. Zinman B, Wanner C, Lachin JM, Fitchett D, Bluhmki E, Hantel S et al Empagliflozin, cardiovascular outcomes, and mortality in type 2 diabetes. N Engl J Med 2015; 373: 2117–2128. [DOI] [PubMed] [Google Scholar]
- 8. McGovern A, Feher M, Munro N, de Lusignan S. Sodium–glucose co‐transporter 2 (SGLT2) inhibitor: comparing trial data and real‐world use. Diabetes Ther 2017; 8: 365–376. [DOI] [PMC free article] [PubMed] [Google Scholar]
- 9. Cefalu WT, Kaul S, Gerstein HC, Holman RR, Zinman B, Skyler JS et al Cardiovascular outcomes trials in type 2 diabetes: where do we go from here? reflections from a Diabetes Care editors' expert forum. Diabetes Care 2018; 41: 14–31. [DOI] [PMC free article] [PubMed] [Google Scholar]
- 10. Birkeland KI, Bodegard J, Norhammar A, Kuiper JG, Georgiado E, Beekman‐Hendriks WL et al How representative of a general type 2 diabetes population are patients included in cardiovascular outcome trials with SGLT2 inhibitors? A large European observational study. Diabetes Obes Metab 2018. 10.1111/dom.13612 {Epub ahead of print]. [DOI] [PMC free article] [PubMed] [Google Scholar]
- 11. Pintat S, Fenici P, Hammar N, Ji L, Khunti K, Medina J et al Eligibility of patients with type 2 diabetes for sodium‐glucose cotransporter 2 inhibitor cardiovascular outcomes trials: a global perspective from the DISCOVER study. BMJ Open Diabetes Res Care 2019; 7: e000627. [DOI] [PMC free article] [PubMed] [Google Scholar]
- 12. Wittbrodt ET, Eudicone JM, Bell KF, Enhoffer DM, Latham K, Green JB. Eligibility varies among the 4 sodium‐glucose cotransporter‐2 inhibitor cardiovascular outcomes trials: implications for the general type 2 diabetes US population. Am J Manag Care 2018; 24(Suppl): S138–S145. [PubMed] [Google Scholar]
- 13. Neal B, Perkovic V, Mahaffey KW, Fulcher G, Erondu N, Desai M et al Optimizing the analysis strategy for the CANVAS Program: a prespecified plan for the integrated analyses of the CANVAS and CANVAS‐R trials. Diabetes Obes Metab 2017; 19: 926–935. [DOI] [PMC free article] [PubMed] [Google Scholar]
- 14. Merck Sharp & Dohme Corp . Cardiovascular Outcomes Following Ertugliflozin Treatment in Type 2 Diabetes Mellitus Participants With Vascular Disease, The VERTIS CV Study (MK‐8835‐004). Available https://clinicaltrials.gov/ct2/show/NCT01986881 Last accessed 2 January 2020. [Google Scholar]
- 15. Wiviott SD, Raz I, Bonaca MP, Mosenzon O, Kato ET, Cahn A et al DECLARE–TIMI 58 Investigators. Dapagliflozin and cardiovascular outcomes in type 2 diabetes. N Engl J Med 2019; 380: 347–357. [DOI] [PubMed] [Google Scholar]
- 16. Hinton W, Feher MD, Munro N, de Lusignan S. How generalizable are cardiovascular outcome trials of sodium‐glucose co‐transporter‐2 inhibitors? A national database study: study protocol. Diabetes Ther 2019; 10: 1163–1170. [DOI] [PMC free article] [PubMed] [Google Scholar]
- 17. de Lusignan S, Correa A, Smith GE, Yonova I, Pebody R, Ferreira F et al RCGP Research and Surveillance Centre: 50 years’ surveillance of influenza, infections, and respiratory conditions. Br J Gen Pract 2017; 67: 440–441. [DOI] [PMC free article] [PubMed] [Google Scholar]
- 18. Correa A, Hinton W, McGovern A, van Vlymen J, Yonova I, Jones S et al Royal College of General Practitioners Research and Surveillance Centre (RCGP RSC) sentinel network: a cohort profile. BMJ Open 2016; 6: e011092. [DOI] [PMC free article] [PubMed] [Google Scholar]
- 19. Langdown C, Peckham S. The use of financial incentives to help improve health outcomes: is the quality and outcomes framework fit for purpose? A systematic review. J Public Health (Oxf) 2014; 36: 251–258. [DOI] [PubMed] [Google Scholar]
- 20. de Lusignan S. Codes, classifications, terminologies and nomenclatures: definition, development and application in practice. Inform Prim Care 2005; 13: 65–70. [DOI] [PubMed] [Google Scholar]
- 21. Department for Communities and Local Government . The English Indices of Deprivation 2015 Available https://www.gov.uk/government/statistics/english‐indices‐of‐deprivation‐2015 Last accessed 2 January 2020. [Google Scholar]
- 22. McGovern A, Hinton W, Correa A, Munro N, Whyte M, de Lusignan S. Real‐world evidence studies into treatment adherence, thresholds for intervention and disparities in treatment in people with type 2 diabetes in the UK. BMJ Open 2016; 6: e012801. [DOI] [PMC free article] [PubMed] [Google Scholar]
- 23. Cole NI, Liyanage H, Suckling RJ, Swift PA, Gallagher H, Byford R et al An ontological approach to identifying cases of chronic kidney disease from routine primary care data: a cross‐sectional study. BMC Nephrol 2018; 19: 85. [DOI] [PMC free article] [PubMed] [Google Scholar]
- 24. Health Research Authority . Is My Study Research? Available http://www.hra‐decisiontools.org.uk/research/ Last accessed 2 January 2020. [Google Scholar]
- 25. Davies MJ, D’Alessio DA, Fradkin J, Kernan WN, Mathieu C, Mingrone G et al Management of hyperglycemia in type 2 diabetes, 2018. A consensus report by the American Diabetes Association (ADA) and the European Association for the Study of Diabetes (EASD). Diabetes Care 2018; 2018(41): 2669–2701. [DOI] [PMC free article] [PubMed] [Google Scholar]
- 26. Goodchild E, Chowdhury TA. Managing diabetes in the presence of renal impairment. Prescriber 2017; 24–30. [Google Scholar]
- 27. National Institute for Health and Care Excellence . Type 2 Diabetes in Adults: Management. NICE guideline 28. Available https://www.nice.org.uk/guidance/ng28 Last accessed 2 January 2020. [Google Scholar]
- 28. Scottish Intercollegiate Guidelines Network . Pharmacological management of glycaemic control in people with type 2 diabetes 2017 [Available from: http://www.sign.ac.uk/assets/sign154.pdf.
- 29. Hinton W, McGovern A, Coyle R, Han TS, Sharma P, Correa A et al Incidence and prevalence of cardiovascular disease in English primary care: a cross‐sectional and follow‐up study of the Royal College of General Practitioners (RCGP) Research and Surveillance Centre (RSC). BMJ Open 2018; 8: e020282. [DOI] [PMC free article] [PubMed] [Google Scholar]
- 30. Herrett E, Shah AD, Boggon R, Denaxas S, Smeeth L, van Staa T et al Completeness and diagnostic validity of recording acute myocardial infarction events in primary care, hospital care, disease registry, and national mortality records: cohort study. BMJ 2013; 346: f2350. [DOI] [PMC free article] [PubMed] [Google Scholar]
Associated Data
This section collects any data citations, data availability statements, or supplementary materials included in this article.
Supplementary Materials
Table S1. Variables used in the RCGP RSC database to match against the inclusion criteria of each SGLT‐2 inhibitor CVOT (CANVAS Program, DECLARE‐TIMI 58, EMPA‐REG OUTCOME, and VERTIS CV).
Table S2. Proportion of missing data per variable excluded in complete case analysis.
Table S3. Proportion of complete cases in the T2DM population prior to creation of SGLT‐2i CVOTs subsets.
Table S4. Proportion of people with complete cases that met the inclusion criteria of each SGLT‐2i CVOT.