

Abstract
Stanniocalcin‐1 (STC1) secreted by mesenchymal stromal cells (MSCs) has anti‐inflammatory functions, reduces apoptosis, and aids in angiogenesis, both in vitro and in vivo. However, little is known about the molecular mechanisms of its regulation. Here, we show that STC1 secretion is increased only under specific cell‐stress conditions. We find that this is due to a change in actin stress fibers and actin‐myosin tension. Abolishment of stress fibers by blebbistatin and knockdown of the focal adhesion protein zyxin leads to an increase in STC1 secretion. To also study this connection in 3D, where few focal adhesions and actin stress fibers are present, STC1 expression was analyzed in 3D alginate hydrogels and 3D electrospun scaffolds. Indeed, STC1 secretion was increased in these low cellular tension 3D environments. Together, our data show that STC1 does not directly respond to cell stress, but that it is regulated through mechanotransduction. This research takes a step forward in the fundamental understanding of STC1 regulation and can have implications for cell‐based regenerative medicine, where cell survival, anti‐inflammatory factors, and angiogenesis are critical.
Keywords: 3D culture, actin‐myosin, mechanotransduction, mesenchymal stromal cell, stanniocalcin‐1, zyxin
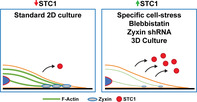
Secreted stanniocalcin‐1 (STC1) is important for cell survival, but its regulation is largely unknown. We show that STC1 secretion is regulated through the mechanosensitive proteins actin and zyxin. STC1 increased in specific, but not all, cell‐stress conditions and 3D cultures, where actin and zyxin are low. Understanding STC1 regulation is important to optimize transplanted cell survival in regenerative medicine applications.
Significance statement.
Stanniocalcin‐1 (STC1) has been shown to be anti‐inflammatory; it reduces apoptosis and promotes angiogenesis both in vitro and in vivo. Controlling these cellular responses are of key importance in regenerative medicine and tissue engineering. Despite these important functions, the regulation of STC1 is widely understudied and is poorly understood. We show here that STC1 is upregulated in certain, but not all, cell‐stress conditions and that this correlates with a change in the actin cytoskeleton. This study demonstrates that STC1 is regulated through focal adhesions, ROCK, and actin‐myosin. Also, in 3D scaffolds, where cellular tension is low, STC1 is upregulated. This research takes a step forward in the fundamental understanding of STC1 regulation and paves the way for future research. These results can have direct implications for different cell‐based regenerative medicine approaches, where cell survival, anti‐inflammatory factors, and angiogenesis are critical.
1. INTRODUCTION
Stanniocalcin‐1 (STC1) is a widely expressed hypocalcemic 50‐kDa homodimeric glycoprotein hormone originally found in teleost fish, and more recently in mammals. STC1 is released into the bloodstream and regulates blood calcium levels by influencing renal and intestinal calcium and phosphate transport through paracrine signaling. 1 In addition, STC1 has recently been reported to be involved in cellular responses to several cell‐stress inducing stimuli such as hypoxia, 2 , 3 , 4 inflammation, 3 oxidative stress, 5 , 6 and cancer. 7 STC1 expression increases in hypoxia, regulated by hypoxia‐inducible factor (HIF), 4 and promotes angiogenesis in vitro and in vivo by increasing expression of vascular endothelial growth factor (VEGF). 7 In addition, STC1 secreted by human mesenchymal stromal cells (hMSCs) has been proposed as an important anti‐apoptotic factor in the MSC secretome. 8 , 9 , 10 Several studies have shown that STC1 is related with cell survival. In a coculture model, hMSCs increased STC1 secretion when fibroblasts were UV‐irradiated, which in turn enhanced their survival by reducing apoptosis. 11 Similarly, hMSCs upregulated STC1 expression when cancer cells were treated with reactive oxygen species (ROS), increasing their survival by reducing intracellular ROS. 5 The reduction of intracellular ROS by hMSC‐secreted STC1 has also been shown for endothelial cells. 12 In vivo, STC1 secreted by injected hMSCs reduced fibrosis and ROS in a mouse pulmonary fibrosis model. 13 STC1 has also been reported to increase in 3D culture platforms, such as spheroids and 3D‐additive manufactured scaffolds, compared to 2D cultures such as tissue culture polystyrene (TCP). 14 , 15 , 16 , 17 Despite these efforts, the molecular mechanisms by which STC1 expression and secretion are regulated are still unclear.
Here, we show that STC1 secretion is increased in hMSCs challenged with stress conditions 18 , 19 , 20 , 21 such as hypotonic shock or nutrient deprivation, but not in hypertonic shock. Our data show that the regulation of STC1 secretion is not directly related with apoptosis and cell survival, but rather regulated by mechanotransduction. We demonstrate that the actin structure changes in hypotonic and nutrient deprivation conditions, but not with hypertonic treatment. This change in actin is, at least partly, responsible for the increased STC1 secretion, demonstrated by an increase in STC1 secretion after treatment with blebbistatin or zyxin knockdown. This shows that STC1 is regulated by mechanotransduction, an observation not previously reported.
2. RESULTS
2.1. Increased STC1 release in certain cell‐stress conditions
STC1 has been shown to be involved in apoptosis both in vitro and in vivo, 5 , 7 , 11 , 12 , 13 but its regulation is largely unknown. To start investigating how STC1 is regulated, we treated hMSCs for 8 hours in different cell‐stress inducing conditions: hypertonic medium (200 mM NaCl in basic medium), hypotonic medium (90% water in basic medium), or nutrient deprivation (phosphate buffered saline [PBS]). After 8 hours, apoptosis, measured by caspase 3/7 activity, was significantly increased 9.1 ± 1.2x (P < .001) and 1.5 ± 0.05x (P < .01) in the hypertonic (Figure 1A) and nutrient deprivation conditions (Figure 1C), respectively, compared to the basic (untreated) condition. Caspase 3/7 activity was not affected in the hypotonic condition (Figure 1B). Total DNA was significantly reduced in all conditions, by 38% ± 16% (P < .05) in the hypertonic condition (Figure 1D), by 60% ± 4% (P < .001) in the hypotonic condition (Figure 1E) and by 54% ± 11% (P < .01) in the nutrient deprivation condition (Figure 1F). Together, these results show that the different cell‐stress inducing conditions successfully induced cell death in a large portion, but not all of the treated cells. Next, to investigate the regulation of STC1 in different cell‐stress‐inducing conditions, we analyzed STC1 secretion. Interestingly, STC1 secretion was not significantly different in the hypertonic condition, but was significantly increased in both the hypotonic and nutrient deprivation conditions (Figure 1G‐I). In the hypotonic and nutrient deprivation conditions, STC1 secretion increased 4.6 ± 1.4x (P < .05) and 2.6 ± 0.1x (P < .0001) compared to the untreated condition, respectively. qPCR analysis of STC1 expression revealed no difference in mRNA expression between control and cell‐stress inducing conditions, showing that the change in STC1 secretion is not regulated on a transcription level (supplemental online Figure 1). Together, these data show that STC1 is affected by some, but not all cell‐stress conditions, warranting further investigation in STC1 regulation.
FIGURE 1.
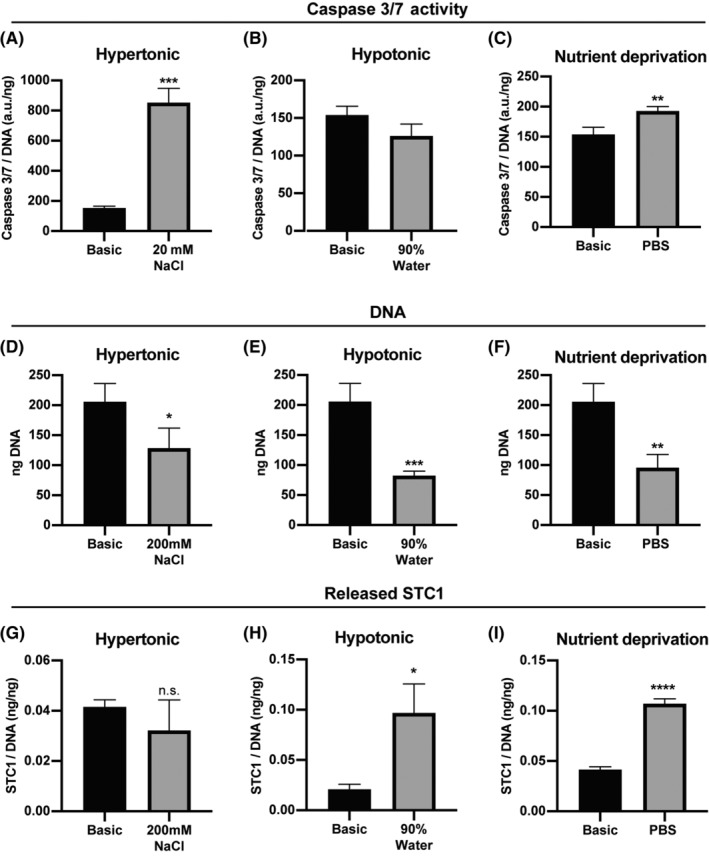
Caspase 3/7 activity, DNA and STC1 release in specific cell‐stress conditions. A‐C, Caspase 3/7 activity, normalized by total DNA, of hMSCs treated for 8 hours in A, hypertonic medium (Basic medium + 200 mM NaCl); B, hypotonic medium (90% water in basic medium); or C, nutrient deprivation medium (PBS). D‐F, Total DNA of hMSCs after 8 hours in D, hypertonic medium; E, hypotonic medium; or F, PBS. G‐I, Total released STC1, measured by ELISA, over an 8 hours period of hMSCs treated with G, hypertonic medium; H, hypotonic medium; or I, PBS. N = 3 for each condition. Student's t‐test; n.s. not significant, *P < .05, **P < .01, ***P < .001, ****P < .0001, compared to Basic. Error bars represent mean ± SD. hMSCs, human mesenchymal stromal cells; PBS, phosphate buffered saline; STC1, stanniocalcin‐1
To exclude a potential effect of differences in proliferation in the 8 hours of various cell‐stress conditions, we analyzed STC1 release in different proliferation inhibited conditions. When proliferation was inhibited by culturing cells for 6 days with 0.5% FBS, STC1 secretion increased (supplemental online Figure 2A,B). However, when proliferation was inhibited for 24 hours with 1% DMSO, STC1 secretion decreased (supplemental online Figure 2C,D). Other proliferation inhibitors did not influence STC1 secretion (high cell seeding density, actinomycin D, CDK4 inhibitor, valproic acid, AZD5438) (supplemental online Figure 2E,F). Also, increasing proliferation by the addition of bFGF to the medium did not affect STC1 secretion. DNA significantly decreased in the 0.5% FBS, 1% DMSO condition and AZD5438 condition, but not in the other conditions. This suggests that proliferation is not directly correlated with STC1 secretion. Knock down of STC1, however, led to a decrease in proliferation and adding recombinant STC1 increased proliferation (supplemental online Figure 2G‐I). Together, these data show that STC1 can influence proliferation, but proliferation does not directly influence STC1 secretion.
2.2. Specific cell‐stress conditions induce change in actin network
The STC1 secretion was increased by hypotonic‐ and nutrient deprivation treatment, but not by hypertonic treatment. While all three conditions induced cell death, only two conditions increased STC1 secretion. Caspase 3/7 increased in hypertonic and nutrient deprivation conditions, and not in hypotonic conditions. Yet, STC1 increased in hypotonic and PBS, and not hypertonic conditions. Together, this shows that STC1 secretion is not directly affected by cell death or apoptosis, but is regulated through other mechanisms. We observed clear differences in cell morphology in the different cell‐stress conditions. To understand if this could be correlated with the increased STC1 secretion, we stained hMSCs for F‐actin after 8 hours in the hypertonic, hypotonic and nutrient deprivation conditions (Figure 2A). Interestingly, hypertonic treatment did not greatly affect the actin structure, cell area, or number of actin stress fibers in the cells that remained alive (Figure 2A‐C). Hypotonic treatment reduced cell size 71% ± 30% (P < .001) and the number of stress fibers by 86% ± 25% (P < .001), compared with the untreated condition. While the nutrient deprivation treatment did not significantly affect cell area, it completely abolished the actin stress fibers in the cells. In addition to actin stress fibers, we also analyzed focal adhesions. Focal adhesions are directly connected to the actin network and play an important role in mechanotransduction pathways. 22 Zyxin, an important focal adhesion protein, was visualized and quantified in the different cell‐stress inducing conditions. The number of zyxin focal adhesions per cell area was greatly reduced (P < .0001) in the hypotonic and nutrient deprivation conditions, but not in the hypertonic condition (Figure 2D,E). The zyxin results correlated neatly with the actin stress fiber quantification and STC1 secretion.
FIGURE 2.
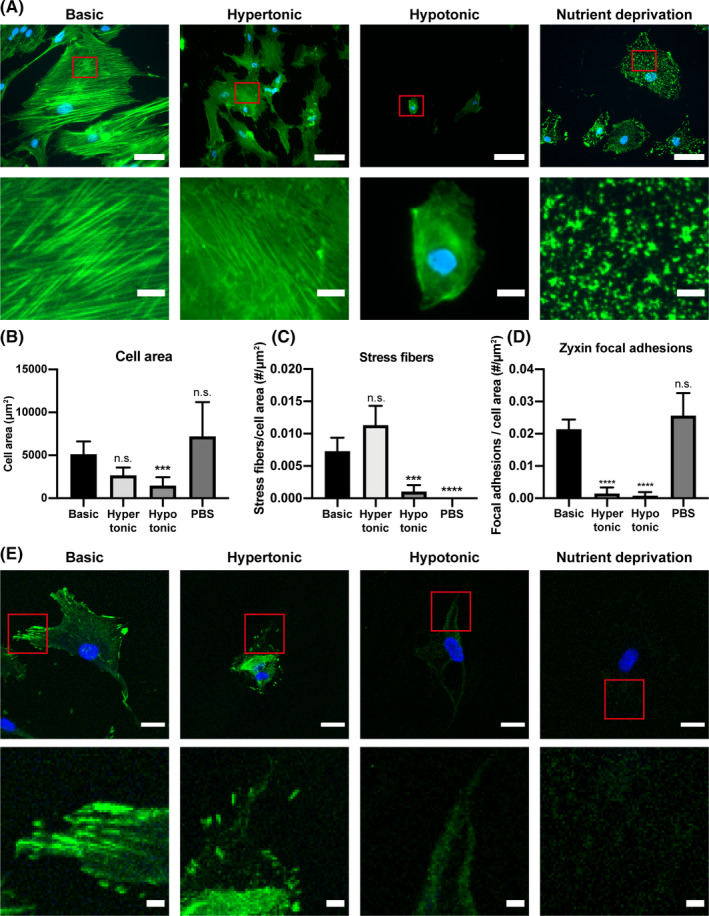
Reduced actin stress fibers in specific cell‐stress conditions. A, F‐actin (green) and nuclei (blue) staining of hMSCs incubated for 8 hours with hypertonic medium (200 mM NaCl in basic medium), or hypotonic medium (90% water in basic medium), or nutrient deprivation medium (PBS). Red rectangles in the top panel highlight the area magnified in the bottom panel, where a 7× magnification of the respective image above is depicted. Scale bar = 75 μm (top) and 10 μm (bottom). B, Quantification of cell area in the respective cell‐stress conditions. Average cell area was measured in 12 different images for each condition. C, Quantification of the number of stress fibers per cell area in the different cell‐stress conditions. n = 15 cells per condition. D, Quantification of zyxin positive focal adhesions per cell area in the different cell‐stress conditions. n = 20 per condition. B, C, D, One‐way ANOVA; n.s. not significant, ***P < .001, ****P < .0001 compared with Basic. Error bars represent mean ± 95% CI. E, Zyxin (green) and nuclei (blue) staining of hMSCs in the different cell‐stress inducing conditions. Red rectangles in the top panel highlight the area magnified in the bottom panel, where a 4× magnification of the respective image above is depicted. Scale bar = 25 μm (top) and 5 μm (bottom). hMSCs, human mesenchymal stromal cells; PBS, phosphate buffered saline
2.3. STC1 secretion is regulated through zyxin and actin‐myosin
Hypotonic and nutrient deprivation treatments decreased actin stress fibers and zyxin positive focal adhesions and increased STC1 secretion, while the hypertonic treatment did not affect actin stress fibers, zyxin, or STC1 secretion. To test whether there is a functional link between the actin network and STC1 secretion, we treated hMSCs for 24 hours with blebbistatin, a potent actin‐myosin inhibitor. 23 Indeed, a 3.1 ± 0.9x (P < .01) increase of released STC1 was observed when actin‐myosin tension was inhibited (Figure 3A). The same trend was observed for two other different hMSCs donors, with an increase of 2.7 ± 1.1x (P < .05) and 2.3 ± 0.2x (P < .01) (supplemental online Figure 3A,C). To understand the role of zyxin and focal adhesions in the regulation of STC1, we knocked down zyxin in hMSCs (supplemental online Figure 4A). STC1 secretion increased by 5.0 ± 1.0x and 4.5 ± 1.0x (P < .01 for both) in zyxin knockdowns 1 and 2, respectively (Figure 3C). Zyxin plays an important role in linking the focal adhesions to the actin network and forming stress fibers, 24 , 25 as opposed to other focal adhesion proteins, such as paxillin that are more involved in signal transduction. 26 , 27 , 28 To understand whether this link to the actin network is important, rather than direct signal transduction from the focal adhesions, we knocked down paxillin (supplemental online Figure 3B). Indeed, no change in STC1 secretion was observed after knockdown of paxillin (Figure 3B), further hinting at the importance of actin‐myosin tension in the regulation of STC1. ROCK activation induces actin‐myosin tension 29 , 30 and stabilizes actin stress fibers. 31 , 32 To further investigate the link between actin‐myosin and STC1, we treated hMSCs for 24 hours with the ROCK inhibitor Y27632. The results were not conclusive as STC1 secretion increased 29% ± 18% (P < .05) with donor #1 cells (Figure 3D), had no statistical significant difference in donor #2 (supplemental online Figure 3B), and had a decrease of 103% ± 84% (P < .001) for donor #3 (supplemental online Figure 3D) after ROCK inhibition. This shows that ROCK might not play a role in the regulation of STC1 release. Lamin A/C, a nuclear skeleton protein, which is also connected to the actin network and transduces signals to the inside of the nucleus 33 was also tested. After knockdown of lamin A/C (supplemental online Figure 3C), no difference in STC secretion was observed (Figure 3E), demonstrating that it is not involved in this process. Lastly, we knocked down YAP (supplemental online Figure 3D), an important mechanosensitive transcription factor. 34 Again, no change in STC1 secretion was observed (Figure 3F). Together, these results demonstrate that STC1 secretion is mechanosensitive and a direct result of a lack of focal adhesions or reduced actin‐myosin tension, either through zyxin inhibition or by actin‐myosin tension inhibition. Regulators of machanosensing mechanisms such as ROCK, lamin A/C or YAP signaling seemed not to influence the secretion of STC1.
FIGURE 3.
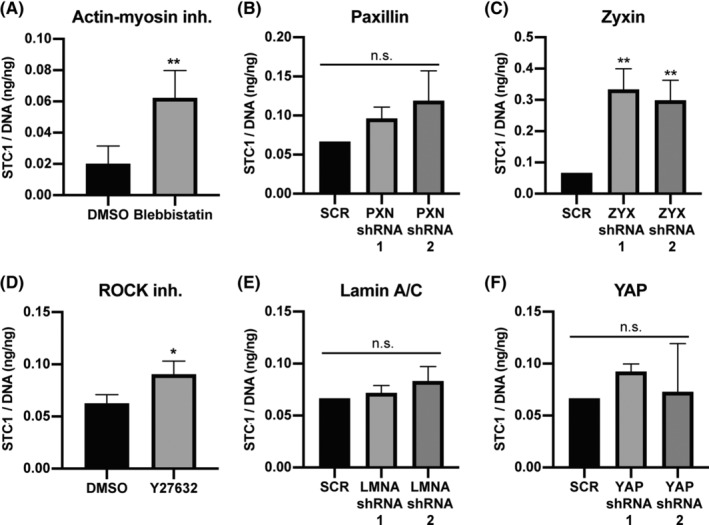
Increased STC1 release after specific interference in mechanotransduction pathways. A, Total secreted STC1 in the medium over 24 hours culture period measured by ELISA, normalized by total DNA in each sample. STC1/DNA was measured in hMSCs treated with A, blebbistatin (n = 4), or D, ROCK inhibitor Y27632 (n = 3), or in hMSCs transduced with shRNA against B, PXN, C, ZYX, E, LMNA or F, YAP (n = 3). A, D, Student's t‐test, or B, C, E, F, one‐way ANOVA; n.s. not‐significant, *P < .05, **P < .01 compared to A, D, DMSO or B, C, E, F, control scrambled shRNA (SCR). Error bars represent mean ± SD. hMSCs, human mesenchymal stromal cells; STC1, stanniocalcin‐1
2.4. Increased STC1 secretion in 3D cultures
Previous reports have shown that STC1 is upregulated in different 3D culture systems. 14 , 15 , 16 , 17 We have previously shown that hMSCs in 3D electrospun (ESP) scaffolds have fewer stress fibers and focal adhesions than in 2D. 35 , 36 We have also seen that 3D alginate hydrogels show the same trend, in line with results published by others. 37 , 38 , 39 , 40 , 41 , 42 , 43 , 44 , 45 Indeed, when stained for zyxin, hMSCs cultured in 3D RGD‐modified alginate hydrogels or 3D ESP scaffolds displayed very few zyxin positive focal adhesions, while many large focal adhesions were observed in 2D TCP (Figure 4A). As expected, STC1 secretion was increased 5.7 ± 1.0x (P < .001) in 3D alginate and 6.0 ± 1.4x (P < .001) in 3D ESP. These results suggest that the increase of STC1 in 3D cultures observed here and by others 14 , 15 , 16 , 17 could come from a reduction in stress fibers and zyxin positive focal adhesions.
FIGURE 4.
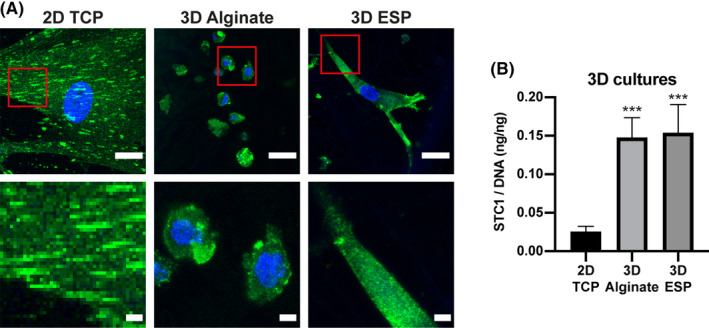
Less zyxin and more STC1 secretion in 3D cultures. A, Zyxin (green) and nuclei (blue) immunofluorescent staining of hMSCs cultured in 2D TCP, 3D Alginate and 3D ESP. Red rectangles in the top panel highlight the area magnified in the bottom panel, where a 4× magnification of the respective image above is depicted. Scale bar = 30 μm (top) and 5 μm (bottom). B, Total secreted STC1 in the medium over 24 hours culture period, measured by ELISA, normalized by total DNA in each sample (n = 4 for 2D TCP; n = 3 for 3D alginate and 3D ESP). One‐way ANOVA; ***P < .001 compared to 2D TCP. Error bars represent mean ± SD. hMSCs, human mesenchymal stromal cells; STC1, stanniocalcin‐1; TCP, tissue culture polystyrene
3. DISCUSSION
Acting as a paracrine protein, STC1 has been shown to promote angiogenesis, reduce apoptosis and enhance overall cell survival. 5 , 7 , 11 , 12 , 13 STC1 is known to be upregulated in different stress conditions, 4 , 11 , 12 , 13 but the molecular mechanisms behind such biological activity are still poorly understood. This was used as a starting point and hMSCs were treated with different stress inducing conditions (hypo‐ and hypertonic, and nutrient deprivation). STC1 secretion only increased in specific stress‐inducing conditions and only in the conditions where the actin cytoskeleton was greatly affected (hypotonic and nutrient deprivation). We found a reduction in actin stress fibers and cell size after 8 hours of hypotonic treatment, in line with previous reports 19 and an aberration of actin stress fibers in cells treated following nutrient deprivation, also in line with previous reports. 18 , 20 The increase in STC1 secretion in these conditions, as well as the change in the actin cytoskeleton, has not been previously reported and led us to investigate a causal link between the two. Indeed, by inhibiting actin‐myosin tension with blebbistatin, we showed that the change in actin structure was responsible for the increased STC1 secretion. The hypertonic treatment did not change the actin cytoskeleton; even though it induced cell death and apoptosis, STC1 secretion remained unchanged. This suggests that the increase in STC1 release after induced cell‐stress might be due to a change in actin cytoskeleton, rather than being a direct response to cell‐stress, apoptosis or cell death. Others have reported that depolymerization of actin results in increased vesicle secretion, hinting at a potential mechanism of the increased STC1 secretion. 46 The number of zyxin positive focal adhesions was also reduced in the hypotonic and nutrient deprivation conditions, but not the hypertonic condition, correlating with the STC1 secretion. When zyxin was knocked down, we also found an increase in STC1 secretion, proving a causal link between the two. Zyxin is known to play an important role in stress fiber formation. 24 , 25 Paxillin knockdown, however, did not result in an increase in STC1 secretion, in line with the fact that paxillin is not required for stress fiber formation. 26 , 27 , 28 ROCK activation induces actin‐myosin contraction 29 , 30 and stabilizes actin filaments. 31 , 32 However, ROCK does not necessarily inhibit completely focal adhesions formation. In fact, Hoffman et al, 47 showed that although exposing zyxin−/− cells to ROCK inhibitor (Y27632) led to a loss of stress fibers, when these cells were then induced to express zyxin in the presence of the inhibitor they kept partially some of their stress fibers. A difference in baseline ROCK expression, focal adhesions or actin‐myosin tension could explain the differences between the three donors that we have observed when using the Y27632 ROCK inhibitor. Y27632 ROCK inhibitor only partially blocks actin myosin tension, 48 perhaps being more sensitive to donor variation. Conversely, blebbistatin fully inhibits actin myosin tension at high enough concentrations, 48 thereby overcoming baseline differences between donors. However, the role of ROCK on STC1 regulation remains unclear and further studies are needed to elucidate it. Together, these results suggest a possible interaction between the regulation of STC1 secretion, focal adhesions and actin‐myosin tension. Interestingly, lamin A/C knock down, critical in the transduction of mechanical signals to the nucleus, did not affect the STC1 secretion. Also, YAP knockdown did not affect STC1 secretion. Together with ROCK inhibition results, this suggests that the reduced STC1 secretion due to actin‐myosin tension might not be regulated through the nucleus, YAP or ROCK signaling. Block et al 11 have shown that STC1 and vinculin staining colocalize in hMSCs, A549 lung epithelial cells and mouse embryonic fibroblasts. Interestingly, when fibroblasts were UV‐irradiated they increased STC1 expression, changed their morphology and decreased focal adhesion staining. 11 However, when cocultured with hMSCs, UV‐irradiated fibroblasts restored their shape as well as their vinculin and STC1 expression, with both proteins colocalizing. In addition, Ylostalo et al have demonstrated an upregulation of STC1 gene expression when hMSCs are cultured in 3D spheroids, compared to spread hMSCs cultured on TCP. 49 When 3T3‐L1 fat cells undergo adipogenic differentiation, they become more spherical and upregulate STC1 gene and protein expression. 50 Also, 3D cultures show an increase in vesicle secretion, which could potentially contain STC1. 46 These results are in line with ours and hinted at a mechanosensitive regulation of STC1. Here, we have shown that STC1 is indeed regulated through mechanotransduction pathways, specifically through zyxin and actin‐myosin. In line with this, in 3D environments (alginate hydrogels and ESP scaffolds), fewer focal adhesions formed and STC1 secretion increased. A reduced number of focal adhesions and actin stress fibers have been previously reported in a number of studies in both hydrogels 37 , 38 , 39 , 40 , 41 , 42 , 43 , 44 , 45 and ESP scaffolds. 35 , 36 The increase of STC1 in 3D cultures has been shown before in different 3D culture systems. 14 , 15 , 16 , 17 Our data suggest that this might be due to a reduction in focal adhesions and/or actin‐myosin tension. Whether such a reduction is also dependent on the mechanical properties of the 3D culture system (eg, different stiffness of hydrogels) shall be the objective of future studies. STC1 expression has also been shown to be influenced by hypoxia. 2 , 3 , 4 Hypoxia can also change actin organization, 51 increase focal adhesions, 51 and activate RhoA and ROCK signaling. 52 Whether the change in STC1 expression under hypoxia is regulated through the same zyxin and actin‐myosin dependent pathway as described here remains to be investigated.
Together, the new findings described here pave the way to understand the regulation of STC1 as a paracrine factor secreted by hMSCs. As STC1 can aid cell survival and angiogenesis in vitro and in vivo, 5 , 7 , 11 , 12 , 13 a better understanding of STC1 regulation could aid future cell‐based regenerative medicine.
4. MATERIALS AND METHODS
4.1. Cell culture
Bone marrow hMSCs were isolated from a 22‐year‐old male by aspiration by Texas A&M Health Science Center 53 after ethical approval from the local and national authorities and written consent from the donor. Mononuclear cells were isolated by centrifugation. Isolated hMSCs were verified for differentiation capacity and were received at passage 1. For further expansion, hMSCs were seeded at 1000 cells/cm2 in αMEM + Glutamax medium (Thermo Fisher Scientific) supplemented with 10% (V/V) fetal bovine serum (FBS) (Sigma‐Aldrich) (basic medium) at 37°C in 5% CO2. Upon reaching 70% to 80% confluency, cells were trypsinized in 0.05% trypsin and 0.53 mM EDTA (Thermo Fisher Scientific) and used for experiments at passage 5.
4.2. Cell‐stress conditions
Before the cell‐stress treatments, hMSCs were expanded for 7 days to get sufficient cell numbers. For the hypertonic condition, basic medium was supplemented with 200 mM NaCl (Sigma‐Aldrich); for the hypotonic condition, Basic medium was diluted in miliQ water to get 90% water and 10% basic medium; for the nutrient deprivation condition, pure PBS (Sigma‐Aldrich) was used. Basic medium was used as control. hMSCs were incubated in the various media for 8 hours on the 7th day of culture. After 8 hours, the medium and cells were harvested for Caspase 3/7 assay, DNA, and STC1 ELISA (discussed as follows).
4.3. Proliferation inhibition conditions
hMSCs were seeded at 1000 cells/cm2 and cultured for 5 days in basic medium before starting the different proliferation inhibiting conditions. On day 5, the medium was replaced with basic medium containing 1% (v/v) DMSO, 1 μg/mL actinomycin D, 2 μg/mL CDK4 inhibitor, 166 μg/mL valproic acid, or 0.74 μg/mL AZD5438. Cells were cultured for 6 days with basic medium + 10 ng/mL bFGF, medium with 0.5% FBS (instead of 10%), or seeded at 20000 cells/cm2 (instead of 1000) and cultured in basic medium. The medium replaced 24 hours before harvesting and cells were harvested at the end of the experiment to measure STC1 released in the medium and DNA, respectively. Cells were cultured for 7 days with basic medium supplemented with recombinant STC1 (0.5 μg/mL, BioVendor) to measure the effect of STC1 on proliferation.
4.4. Lentiviral production and transduction, and actin‐myosin and ROCK inhibition
Lentivirus was produced in human embryonic kidney 293FT (HEK) cells. HEK cells were seeded at 60 000 cells/cm2 in a 10‐cm TCP dish in DMEM + 10% FBS. HEK cells were transfected with pMDLg pRRE, pMD2.G, pRSV Rev (Addgene), and one of the pLKO.1 shRNA plasmids using lipofectamine 2000 (Thermo Fisher Scientific) in a ratio of 5:1 (μL lipofectamine 2000:μg DNA) 24 hours after seeding. TRC pLKO.1 constructs (Dharmacon) with the following Clone ID's were used: PXN: TRCN0000123134 and TRCN0000123136; ZYX: TRCN0000074204 and TRCN0000074205; LMNA: TRCN0000061833 and TRCN0000061836; YAP: TRCN0000107265 and TRCN0000107266; STC: TRCN0000154599 and TRCN0000155141; and a non‐targeting shRNA as control (RHS6848). The medium was changed 16 hours after transfection to basic medium. Lentiviral particles were harvested 24 and 48 hours after the change to basic medium and filtered through a 0.45‐μm filter. hMSCs were thawed at 1000 cells/cm2 in a 10 cm‐TCP dish 24 hours before transduction. Three milliliters of unconcentrated filtered medium containing the lentiviral particles was added and incubated overnight at 37°C. After 16 to 24 hours, the medium was changed to basic medium and 24 to 48 hours after, medium was replaced with selection medium (basic medium + 2 μg/mL puromycin (Sigma‐Aldrich)) for 72 hours. After a total of 9 to 10 days after thawing, the cells were passaged at 1000 cells/cm2 and used for subsequent experiments. To test the effect of actin‐myosin tension and ROCK on STC1 secretion, 100 μM blebbistatin (Sigma‐Aldrich) or 10 μM Y27632 in basic medium was added to untransduced hMSCs.
4.5. Hydrogel and scaffold production and culture
Food grade alginate was purified according to a protocol previously published by Neves et al 54 Briefly, alginate with 70% “GG blocks,” kindly provided by FMC polymers, was dissolved overnight in ultrapure water (18 MΩ, Milli‐Q UltraPure Water System, Millipore) at a final concentration of 1% (w/v). After dissolution, activated charcoal (2% (w/v), Sigma‐Aldrich) was added under agitation for 1 hour at RT. The obtained suspension was then centrifuged for 1 hour at 27000g (Beckman centrifuges). Then, the supernatant passed through a series of filters (1.2, 0.45, and 0.22 μm membrane pores, VWR) and was freeze‐dried and stored at −20°C until further use. The alginate was then modified with (glycine)4‐arginine‐glycine‐aspartic acid‐serine‐proline (referred to as RGD throughout the text) (Genscript, Piscataway, New Jersey) to allow cell adhesion by using aqueous carbodiimide chemistry (EDC chemistry). Briefly, as described previously, 55 a 1% (w/v) solution was prepared in 0.1 M 2‐(N‐morpholino) ethanesulfonic acid (MES) buffer solution (0.1 M MES buffering salt, 0.3 M NaCl, pH adjusted to 6.5 using 1 M NaOH, Sigma). N‐Hydroxy‐sulfosuccinimide (sulfo‐NHS, Pierce Chemical) and 1‐ethyl‐(dimethylaminopropyl)‐carbodiimide (EDC, Sigma, 27.40 mg per g alginate), at a molar ratio of 1:2, were sequentially added to the solutions, followed by the addition of 65.9 μmol RGD per gram alginate. The solution was then left stirring for 20 hours and quenched with 18 mg of hydroxylamine hydrochloride (Sigma) per gram alginate. The final product was dialyzed (MWCO 3500, Spectra/Por, VWR) against decreasing concentrations of ultrapure water with NaCl for 3 days at 4°C and freeze‐dried and stored at −20°C. For encapsulation, 100 000 hMSCs were pelleted by centrifugation at 500g for 5 minutes and cells were embedded in 10 μL 1% alginate‐RGD (w/v) (106 cells/ml). The alginate hydrogels were crosslinked in a bath of 100 mM BaCl2 (Sigma‐Aldrich) for 5 minutes, to be subsequently cultured in basic medium.
Electrospun (ESP) scaffolds were produced using 300PEOT55PBT45 (PolyVation), made from a starting 300 kDa poly(ethylene glycol) in the synthesis reaction, with a PEOT/PBT weight ratio of 55/45. A 20% (w/v) solution of 300PEOT55PBT45 was made by dissolving the copolymer in a mixture of 30% (v/v) 1,1,1,3,3,3‐hexafluoro‐2‐propanol AR (HFIP) (Bio‐Solve) and 70% (v/v) chloroform (Sigma‐Aldrich), overnight at room temperature under agitation.
ESP scaffolds were produced on a 19 cm diameter mandrel at 100 RPM rotation on a polyester mesh (FinishMat 6691 LL [40 g/m2], generously provided by Lantor B.V.) with 12 mm holes, on top of aluminum foil. After electrospinning, the collected ESP scaffolds were punched out with a diameter of 15 mm and the aluminum foil was removed. Using this method, 12 mm ESP scaffolds were created with a 1.5 mm supporting polyester ring to improve handleability. Processing parameters were: 1 mL/h flow rate, 15 cm working distance, 40% humidity and 23°C to 25°C. The needle was charged between 10 to 15 kV, while the collector was charged between −2 and −5 kV. For sterilization, ESP scaffolds were submerged in 70% ethanol for 15 minutes and subsequently dried until visually dry. The ESP scaffold were then seeded with 30 000 hMSCs and cultured in basic medium.
4.6. Stanniocalcin ELISA
STC1 secreted into the medium by hMSCs was quantified using a STC1 ELISA kit (Antibodies‐online, kit no. ABIN852096). Medium was changed 24 hours before harvest to an exact volume on the 6th day of culture. For the cell‐stress experiments, medium was changed on the 7th day and only incubated for 8 hours. The ELISA was performed according to the manufacturer's instructions. STC1 concentration was normalized to total DNA in each sample to correct for differences in cell numbers.
4.7. Caspase 3/7 activity assay
Caspase 3/7 activity was measured using the Caspase‐Glo 3/7 assay (Promega). Caspase 3/7 assay solution was mixed 1:1 with alpha‐MEM without phenol red (Thermo Fisher Scientific) (caspase 3/7 lysis buffer) and added to the cells at the moment of harvest. After 30 minutes incubation, light intensity was measured at 520 nm on a CLARIOstar Plus plate reader.
4.8. DNA quantification
hMSCs were washed 2× with PBS to remove dead cells and medium before stored dry at −80°C for later DNA quantification. Samples were freeze‐thawed twice before either RLT lysis buffer (Qiagen) or the caspase lysis 3/7 buffer was added. Samples were freeze‐thawed three times again in lysis buffer (after caspase 3/7 assay, if applicable) to ensure full lysis. TCP samples were scraped and hydrogel and ESP scaffolds were left in the lysis buffer. Samples were then diluted 50× in Tris‐EDTA buffer (10 mM Tris‐HCl, 1 mM EDTA, pH 7.5 [Sigma‐Aldrich]) and a DNA standard curve was made in the same final solution (2% RLT or caspase lysis 3/7 buffer in Tris‐EDTA buffer). Pico green assay (Thermo Fisher Scientific) was used to quantify DNA, according to the manufacturer's protocol.
4.9. Protein isolation and Western blot
To validate the knockdowns, protein was isolated from transduced cells with RIPA buffer (Sigma‐Aldrich), supplemented with cOmplete, Mini, EDTA‐free Protease Inhibitor Cocktail (Sigma‐Aldrich). Cells were grown in TCP dishes and after scraping with lysis buffer, the samples were spun down at 10 000g and the supernatant was used for further analysis. Total protein concentration was quantified using the Pierce BCA protein assay kit (Thermo Fisher Scientific). Twenty micrograms of protein of each sample was incubated in 10% 2‐Mercaptoethanol (Sigma‐Aldrich) in laemmli loading buffer (Bio‐Rad) at 95°C for 5 minutes before loading into a 4% to 15% polyacrylamide gels (Bio‐Rad). The semi‐dry transfer method was used to blot proteins from the gel to a 0.45 μm PVDF membrane (Bio‐Rad). Membranes were blocked in 5% (w/v) fat free milk (Bio‐Rad) in TBS + 0.05% (v/v) tween‐20 (Sigma‐Aldrich) for 1 hour. Primary antibodies were incubated in blocking buffer overnight at 4°C. All antibodies were ordered from Abcam and diluted 1/1000, except for YAP which was diluted 1/500. Lamin A/C: ab108595; Paxillin: ab32084; Zyxin: ab58210; YAP: ab52771; TBP: ab51841. The following day, blots were incubated for 1 hour at room temperature in 0.33 μg/mL goat anti‐rabbit or anti‐mouse HRP (Bio‐Rad) in blocking buffer. Membranes were incubated in Clarity Western ECL (Bio‐Rad) for 1 to 5 minutes to visualize protein bands on a Bio‐Rad ChemiDoc.
4.10. RNA isolation
hMSCs expanded for 7 days in 175 cm2 flasks were exposed to the cell‐stress treatments as previously described above. After 8 hours of incubation, each condition was washed one time with PBS to wash the remaining media. One milliliter of TRIzol (Fisher Scientific) was added to the flaks and cells were dissolved and detached with the help of a cell scraper (VWR). The samples were then frozen at −80°C until further use. For mRNA isolation, samples have been thawed on ice and 200 μL of chloroform (Sigma‐Aldrich) were added. After shaking vigorously for 15 seconds, the samples were left for 15 minutes at RT and then centrifuged at 12 000g for 15 minutes at 4°C. An upper aqueous layer was obtained to which 500 μL of isopropanol (VWR) were added. The samples were incubated for 10 minutes at RT and centrifuged at 12 000g for 10 minutes at 4°C. All but 200 μL of supernatant was discarded and a same volume of molecular grade ethanol (Thermo Fisher Scientific) was mixed into the solution with a pipette to make a lysate. The samples followed then the protocol establish by RNeasy Mini Kit (Qiagen) for mRNA isolation. The mRNA obtained was quantified with a nanodrop and the sample concentration was evened with nucleoside‐free water (Bio‐Rad). To synthesized cDNA, mRNA samples obtained followed the iScript cDNA Synthesis Kit (Bio‐Rad) and followed the thermocycler reaction of 5 minutes at 25°C, 20 minutes at 46°C, 1 minute at 95°C and were frozen at −20°C for storage or in ice for further use.
4.11. Quantitative real‐time RT‐PCR
Primers for STC1 were selected and confirmed for their affinity to the gene with BLAST. 5′‐AGGTGCAGGAAGAGTGCTACA‐3′ and 5′‐GACGACCTCAGTGATGGCTT‐3′ were used as forward and reverse primers, respectively. In order to confirm primers efficiency, control hMSCs cDNA dilution series was performed and a 101% efficiency was obtained for concentrations between 19 and 470 ng/μL. For reverse transcription, 1 ng of sample was loaded with 0.3 μL of primers solution and 7.5 μL of iQ SYBR Green Supermix (Bio‐Rad) to a total of 15 μL. After loading each reaction in a 96‐well plate, the plate was placed on a Real‐Time PCR Detection System (Bio‐Rad) and followed a protocol of 3 minutes at 95°C, 15 seconds at 95°C, 30 seconds at 55°C (repeated 39 times steps), and melting curve: 65°C to 95°C at 0.5°C steps of 5 minutes. The relative level of mRNA expression was calculated using the 2−ΔΔCt method with GAPDH as a reference.
4.12. Immunofluorescence and imaging
hMSCs were fixed at room temperature for 20 minutes in 3.6% (v/v) paraformaldehyde (Sigma‐Aldrich) in PBS. Blocking and permeabilization was done for 1 hour at room temperature in 2% bovine serum albumin (BSA) (VWR) with 0.1% (v/v) triton X (VWR) in PBS. Zyxin antibody (mentioned above in the Western blot section) was used in the same dilution for immunofluorescent staining. Incubation was done overnight at 4°C in 2% (w/v) BSA and 0.05% (v/v) tween‐20 in PBS (incubation buffer). Goat anti‐mouse Alexa Fluor 488 (Thermo Fisher Scientific) in incubation buffer was incubated overnight at 4°C. F‐actin was visualized using phalloidin Alexa Fluor 488 (Thermo Fisher Scientific). After blocking and permeabilization, phalloidin (1/100 in PBS + 0.05% (v/v) tween‐20) was incubated at room temperature for 20 minutes. DAPI (Sigma‐Aldrich, 0.14 μg/mL in PBS + 0.05% (v/v) tween‐20) was used as nuclear staining. Actin images were taken on a wide‐field fluorescence microscope (Nikon‐Ti); zyxin images on an SP8 confocal (Leica) microscope. All images within an experiment were captured on the same day and using the same settings, so quantitative comparisons could be made.
Cell area was quantified using Fiji. Total cell area was divided by the number of cells to get the average cell area per image. Twelve individual images, taken from three different biological replicates, were used for quantification. Actin stress fibers were manually counted in 15 cells per condition and normalized to cell area. The number of zyxin focal adhesions was counted in 20 cells per condition and normalized to cell area.
4.13. Statistics
Number of biological replicates and statistical tests used are stated in figure subtext. At least three biological replicas were used for each assay. Cells selected for quantification of cell size and actin stress fibers were selected randomly. Normal distribution of each data set was tested using the Shapiro‐Wilk test. For multiple comparisons within one experiment, a One‐way ANOVA with Tukey's post hoc was performed, or Kruskal‐Wallis with Dunn's post hoc as nonparametric equivalent. Experiments with one comparison were tested using a two‐tailed Student's t‐test. Significance was set at P < .05. Statistical analysis was performed using GraphPad Prism 8.
5. CONFLICT OF INTEREST
The authors declared no potential conflicts of interest.
6. AUTHOR CONTRIBUTIONS
J.Z., D.B.G.: conception and design, collection and/or assembly of data, data analysis and interpretation, manuscript writing; Y.P.: collection and/or assembly of data; I.L.M.: conception and design, collection and/or assembly of data; S.C.E.: data analysis and interpretation; L.M.: conception and design, data analysis and interpretation, manuscript writing.
Supporting information
Supplemental Figure S1 STC1 mRNA expression unchanged in stress‐inducing conditions. STC1 mRNA expression was analyzed in the stress‐inducing conditions and normalized to GAPDH, and then to the basic, untreated condition. n = 3 for each sample. One‐way ANOVA; n.s. not significant. Error bars represent mean ± SD.
Supplemental Figure S2. Exploring the link between proliferation and STC1. DNA (A) and STC1 release in 24 hours, normalized to DNA (B), in proliferative cells: basic (untreated), and basic +bFGF, or non‐proliferative cells: medium with 0.5% FBS and high cell seeding density (20 000 cells/cm2), 1% DMSO (C, D), actinomycin D, CDK4 inhibitor, valproic acid, or AZD5438 (E, F). (G) STC1 release in 24 hours of hMSCs transduced with scrambled shRNA (SCR), or two different STC1 shRNA. (H) DNA analysis after 7 days of culture in basic medium. (I) DNA analysis after 7 days of culture in basic medium, or basic medium supplemented with recombinant STC1. (C, D, I) Student's t‐test, (A, B, E‐H) One‐way ANOVA. * P < .05, ** P < .01, *** P < .001, ****P < .0001, compared to basic or SCR. Error bars represent mean ± SD.
Supplemental Figure S3. Exploring STC1 secretion in two more donors. Total secreted STC1 in the medium over 24 hours culture period treated with blebbistatin (A) and (C) ROCK inhibitor Y27632 (B) and (D), measured by ELISA, normalized by total DNA in each sample (n = 3 for all samples). (A) and (B) for donor number 2 and (C) and (D) donor number 3. One‐way ANOVA; * P < .05, *** P < .001, n.s. not significant compared to Control. Error bars represent mean ± SD.
Supplemental Figure S4. Validation of knock downs. Western blots of hMSCs transduced with shRNA for ZYX (A), PXN (B), LMNA (C), YAP (D), or control scrambled shRNA (SCR). TATA box binding protein (TBP) is shown as loading control.
ACKNOWLEDGMENTS
We are grateful to the European Research Council starting grant “Cell Hybridge” for financial support under the Horizon2020 framework program (Grant #637308). We are also grateful to the European Community’s Seventh Framework Program (FP7/2007‐2013) (grant agreement No. 305436, STELLAR). Some of the materials used in this work were provided by the Texas A&M Health Science Center College of Medicine Institute for Regenerative Medicine at Scott & White through a grant from NCRR of the NIH (Grant #P40RR017447).
Zonderland J, Gomes DB, Pallada Y, Moldero IL, Camarero‐Espinosa S, Moroni L. Mechanosensitive regulation of stanniocalcin‐1 by zyxin and actin‐myosin in human mesenchymal stromal cells. Stem Cells. 2020;38:948–959. 10.1002/stem.3198
Jip Zonderland and David B. Gomes contributed equally to this work.
Funding information FP7 Health, Grant/Award Number: 305436; H2020 European Research Council, Grant/Award Number: 637308; NCRR of the NIH, Grant/Award Number: P40RR017447
1. DATA AVAILABILITY STATEMENT
The data that support the findings of this study are available on request from the corresponding author.
REFERENCES
- 1. Gerritsen ME, Wagner GF. Stanniocalcin: no longer just a fish tale. Vitam Horm. 2005;70:105‐135. [DOI] [PubMed] [Google Scholar]
- 2. Ito Y, Zemans R, Correll K, et al. Stanniocalcin‐1 is induced by hypoxia inducible factor in rat alveolar epithelial cells. Biochem Biophys Res Commun. 2014;452(4):1091‐1097. [DOI] [PMC free article] [PubMed] [Google Scholar]
- 3. Westberg JA, Serlachius M, Lankila P, Penkowa M, Hidalgo J, Andersson LC. Hypoxic preconditioning induces neuroprotective stanniocalcin‐1 in brain via IL‐6 signaling. Stroke. 2007;38(3):1025‐1030. [DOI] [PubMed] [Google Scholar]
- 4. Law AY, Ching LY, Lai KP, Wong CK. Identification and characterization of the hypoxia‐responsive element in human stanniocalcin‐1 gene. Mol Cell Endocrinol. 2010;314(1):118‐127. [DOI] [PubMed] [Google Scholar]
- 5. Ohkouchi S, Block GJ, Katsha AM, et al. Mesenchymal stromal cells protect cancer cells from ROS‐induced apoptosis and enhance the Warburg effect by secreting STC1. Mol Ther. 2012;20(2):417‐423. [DOI] [PMC free article] [PubMed] [Google Scholar]
- 6. Wang Y, Huang L, Abdelrahim M, et al. Stanniocalcin‐1 suppresses superoxide generation in macrophages through induction of mitochondrial UCP2. J Leukoc Biol. 2009;86(4):981‐988. [DOI] [PMC free article] [PubMed] [Google Scholar]
- 7. He LF, Wang TT, Gao QY, et al. Stanniocalcin‐1 promotes tumor angiogenesis through up‐regulation of VEGF in gastric cancer cells. J Biomed Sci. 2011;18:39. [DOI] [PMC free article] [PubMed] [Google Scholar]
- 8. Lee RH, Oh JY, Choi H, Bazhanov N. Therapeutic factors secreted by mesenchymal stromal cells and tissue repair. J Cell Biochem. 2011;112(11):3073‐3078. [DOI] [PubMed] [Google Scholar]
- 9. Mirotsou M, Jayawardena TM, Schmeckpeper J, Gnecchi M, Dzau VJ. Paracrine mechanisms of stem cell reparative and regenerative actions in the heart. J Mol Cell Cardiol. 2011;50(2):280‐289. [DOI] [PMC free article] [PubMed] [Google Scholar]
- 10. Prockop DJ. Concise review: two negative feedback loops place mesenchymal stem/stromal cells at the center of early regulators of inflammation. Stem Cells. 2013;31(10):2042‐2046. [DOI] [PubMed] [Google Scholar]
- 11. Block GJ, Ohkouchi S, Fung F, et al. Multipotent stromal cells are activated to reduce apoptosis in part by upregulation and secretion of stanniocalcin‐1. Stem Cells. 2009;27(3):670‐681. [DOI] [PMC free article] [PubMed] [Google Scholar]
- 12. Shi M, Yuan Y, Liu J, et al. MSCs protect endothelial cells from inflammatory injury partially by secreting STC1. Int Immunopharmacol. 2018;61:109‐118. [DOI] [PubMed] [Google Scholar]
- 13. Ono M, Ohkouchi S, Kanehira M, et al. Mesenchymal stem cells correct inappropriate epithelial‐mesenchyme relation in pulmonary fibrosis using stanniocalcin‐1. Mol Ther. 2015;23(3):549‐560. [DOI] [PMC free article] [PubMed] [Google Scholar]
- 14. Bartosh TJ, Ylostalo JH. Efficacy of 3D culture priming is maintained in human mesenchymal stem cells after extensive expansion of the cells. Cells. 2019;8(9):1031. [DOI] [PMC free article] [PubMed] [Google Scholar]
- 15. Higuera GA, Fernandes H, Spitters TWGM, et al. Spatiotemporal proliferation of human stromal cells adjusts to nutrient availability and leads to stanniocalcin‐1 expression in vitro and in vivo. Biomaterials. 2015;61:190‐202. [DOI] [PubMed] [Google Scholar]
- 16. Bartosh TJ, Ylostalo JH, Mohammadipoor A, et al. Aggregation of human mesenchymal stromal cells (MSCs) into 3D spheroids enhances their antiinflammatory properties. Proc Natl Acad Sci U S A. 2010;107(31):13724‐13729. [DOI] [PMC free article] [PubMed] [Google Scholar]
- 17. Cantu DA, Hematti P, Kao WJ. Cell encapsulating biomaterial regulates mesenchymal stromal/stem cell differentiation and macrophage immunophenotype. Stem Cells Translational Medicine. 2012;1(10):740‐749. [DOI] [PMC free article] [PubMed] [Google Scholar]
- 18. Kameshima S, Okada M, Yamawaki H. Eukaryotic elongation factor 2 (eEF2) kinase/eEF2 plays protective roles against glucose deprivation‐induced cell death in H9c2 cardiomyoblasts. Apoptosis. 2019;24(3–4):359‐368. [DOI] [PubMed] [Google Scholar]
- 19. Romano SL, Raaphorst GP, Dewey WC. The effects of various salt and sucrose solutions on the U.V.L. sensitivity of CHO cells. Int J Radiat Biol Relat Stud Phys Chem Med. 1979;35(5):401‐415. [PubMed] [Google Scholar]
- 20. Vasicova P, Rinnerthaler M, Haskova D, et al. Formaldehyde fixation is detrimental to actin cables in glucose‐depleted S. cerevisiae cells. Microb Cell. 2016;3(5):206‐214. [DOI] [PMC free article] [PubMed] [Google Scholar]
- 21. Criollo A, Galluzzi L, Chiara Maiuri M, Tasdemir E, Lavandero S, Kroemer G. Mitochondrial control of cell death induced by hyperosmotic stress. Apoptosis. 2007;12(1):3‐18. [DOI] [PMC free article] [PubMed] [Google Scholar]
- 22. Wozniak MA, Modzelewska K, Kwong L, Keely PJ. Focal adhesion regulation of cell behavior. Biochim Biophys Acta. 2004;1692(2–3):103‐119. [DOI] [PubMed] [Google Scholar]
- 23. Kovacs M, Tóth J, Hetényi C, Málnási‐Csizmadia A, Sellers JR. Mechanism of blebbistatin inhibition of myosin II. J Biol Chem. 2004;279(34):35557‐35563. [DOI] [PubMed] [Google Scholar]
- 24. Smith MA, Blankman E, Gardel ML, Luettjohann L, Waterman CM, Beckerle MC. A zyxin‐mediated mechanism for Actin stress fiber maintenance and repair. Dev Cell. 2010;19(3):365‐376. [DOI] [PMC free article] [PubMed] [Google Scholar]
- 25. Griffith E, Coutts AS, Black DM. RNAi knockdown of the focal adhesion protein TES reveals its role in actin stress fibre organisation. Cell Motil Cytoskeleton. 2005;60(3):140‐152. [DOI] [PubMed] [Google Scholar]
- 26. Birukova AA, Cokic I, Moldobaeva N, Birukov KG. Paxillin is involved in the differential regulation of endothelial barrier by HGF and VEGF. Am J Respir Cell Mol Biol. 2009;40(1):99‐107. [DOI] [PMC free article] [PubMed] [Google Scholar]
- 27. Ngu H, Feng Y, Lu L, Oswald SJ, Longmore GD, Yin FCP. Effect of focal adhesion proteins on endothelial cell adhesion, motility and orientation response to cyclic strain. Ann Biomed Eng. 2010;38(1):208‐222. [DOI] [PubMed] [Google Scholar]
- 28. Watanabe‐Nakayama T, Saito M, Machida S, Kishimoto K, Afrin R, Ikai A. Requirement of LIM domains for the transient accumulation of paxillin at damaged stress fibres. Biol Open. 2013;2(7):667‐674. [DOI] [PMC free article] [PubMed] [Google Scholar]
- 29. Amano M, Ito M, Kimura K, et al. Phosphorylation and activation of myosin by rho‐associated kinase (rho‐kinase). J Biol Chem. 1996;271(34):20246‐20249. [DOI] [PubMed] [Google Scholar]
- 30. Burridge K, Chrzanowska‐Wodnicka M. Focal adhesions, contractility, and signaling. Annu Rev Cell Dev Biol. 1996;12:463‐518. [DOI] [PubMed] [Google Scholar]
- 31. Zigmond SH. Formin‐induced nucleation of Actin filaments. Curr Opin Cell Biol. 2004;16(1):99‐105. [DOI] [PubMed] [Google Scholar]
- 32. Lessey EC, Guilluy C, Burridge K. From mechanical force to RhoA activation. Biochemistry. 2012;51(38):7420‐7432. [DOI] [PMC free article] [PubMed] [Google Scholar]
- 33. Gruenbaum Y, Foisner R. Lamins: nuclear intermediate filament proteins with fundamental functions in nuclear mechanics and genome regulation. Annu Rev Biochem. 2015;84:131‐164. [DOI] [PubMed] [Google Scholar]
- 34. Panciera T, Azzolin L, Cordenonsi M, Piccolo S. Mechanobiology of YAP and TAZ in physiology and disease. Nat Rev Mol Cell Biol. 2017;18(12):758‐770. [DOI] [PMC free article] [PubMed] [Google Scholar]
- 35. Sequeira SJ, Soscia DA, Oztan B, et al. The regulation of focal adhesion complex formation and salivary gland epithelial cell organization by nanofibrous PLGA scaffolds. Biomaterials. 2012;33(11):3175‐3186. [DOI] [PMC free article] [PubMed] [Google Scholar]
- 36. Zonderland J, Moldero IL, Anand S, Mota C, Moroni L. Dimensionality changes actin network through lamin A/C and zyxin. Biomaterials. 2020;240:119854. [DOI] [PubMed] [Google Scholar]
- 37. Ferreira SA, Motwani MS, Faull PA, et al. Bi‐directional cell‐pericellular matrix interactions direct stem cell fate. Nat Commun. 2018;9(1):4049. [DOI] [PMC free article] [PubMed] [Google Scholar]
- 38. Lee HP, Stowers R, Chaudhuri O. Volume expansion and TRPV4 activation regulate stem cell fate in three‐dimensional microenvironments. Nat Commun. 2019;10(1):529. [DOI] [PMC free article] [PubMed] [Google Scholar]
- 39. Huebsch N, Arany PR, Mao AS, et al. Harnessing traction‐mediated manipulation of the cell/matrix interface to control stem‐cell fate. Nat Mater. 2010;9(6):518‐526. [DOI] [PMC free article] [PubMed] [Google Scholar]
- 40. Chaudhuri O, Gu L, Klumpers D, et al. Hydrogels with tunable stress relaxation regulate stem cell fate and activity. Nat Mater. 2016;15(3):326‐334. [DOI] [PMC free article] [PubMed] [Google Scholar]
- 41. Tong X, Yang F. Sliding hydrogels with mobile molecular ligands and crosslinks as 3D stem cell niche. Adv Mater. 2016;28(33):7257‐7263. [DOI] [PMC free article] [PubMed] [Google Scholar]
- 42. Parekh SH, Chatterjee K, Lin‐Gibson S, et al. Modulus‐driven differentiation of marrow stromal cells in 3D scaffolds that is independent of myosin‐based cytoskeletal tension. Biomaterials. 2011;32(9):2256‐2264. [DOI] [PMC free article] [PubMed] [Google Scholar]
- 43. Nam S, Stowers R, Lou J, Xia Y, Chaudhuri O. Varying PEG density to control stress relaxation in alginate‐PEG hydrogels for 3D cell culture studies. Biomaterials. 2019;200:15‐24. [DOI] [PMC free article] [PubMed] [Google Scholar]
- 44. Khetan S, Guvendiren M, Legant WR, Cohen DM, Chen CS, Burdick JA. Degradation‐mediated cellular traction directs stem cell fate in covalently crosslinked three‐dimensional hydrogels. Nat Mater. 2013;12(5):458‐465. [DOI] [PMC free article] [PubMed] [Google Scholar]
- 45. Chaires‐Rosas CP, Ambriz X, Montesinos JJ, et al. Differential adhesion and fibrinolytic activity of mesenchymal stem cells from human bone marrow, placenta, and Wharton's jelly cultured in a fibrin hydrogel. J Tissue Eng. 2019;10:2041731419840622. [DOI] [PMC free article] [PubMed] [Google Scholar]
- 46. Mo M, Zhou Y, Li S, Wu Y. Three‐dimensional culture reduces cell size by increasing vesicle excretion. Stem Cells. 2018;36(2):286‐292. [DOI] [PubMed] [Google Scholar]
- 47. Hoffman LM, Jensen CC, Chaturvedi A, Yoshigi M, Beckerle MC. Stretch‐induced actin remodeling requires targeting of zyxin to stress fibers and recruitment of actin regulators. Mol Biol Cell. 2012;23(10):1846‐1859. [DOI] [PMC free article] [PubMed] [Google Scholar]
- 48. Bain J, Plater L, Elliott M, et al. The selectivity of protein kinase inhibitors: a further update. Biochem J. 2007;408(3):297‐315. [DOI] [PMC free article] [PubMed] [Google Scholar]
- 49. Ylostalo JH, Bartosh TJ, Tiblow A, Prockop DJ. Unique characteristics of human mesenchymal stromal/progenitor cells pre‐activated in 3‐dimensional cultures under different conditions. Cytotherapy. 2014;16(11):1486‐1500. [DOI] [PMC free article] [PubMed] [Google Scholar]
- 50. Serlachius M, Andersson LC. Upregulated expression of stanniocalcin‐1 during adipogenesis. Exp Cell Res. 2004;296(2):256‐264. [DOI] [PubMed] [Google Scholar]
- 51. Vogler M, Vogel S, Krull S, et al. Hypoxia modulates fibroblastic architecture, adhesion and migration: a role for HIF‐1α in cofilin regulation and cytoplasmic actin distribution. PLoS One. 2013;8(7):e69128. [DOI] [PMC free article] [PubMed] [Google Scholar]
- 52. Gilkes DM, Xiang L, Lee SJ, et al. Hypoxia‐inducible factors mediate coordinated RhoA‐ROCK1 expression and signaling in breast cancer cells. Proc Natl Acad Sci U S A. 2014;111(3):E384‐E393. [DOI] [PMC free article] [PubMed] [Google Scholar] [Retracted]
- 53. Digirolamo CM, Stokes D, Colter D, Phinney DG, Class R, Prockop DJ. Propagation and senescence of human marrow stromal cells in culture: a simple colony‐forming assay identifies samples with the greatest potential to propagate and differentiate. Br J Haematol. 1999;107(2):275‐281. [DOI] [PubMed] [Google Scholar]
- 54. Neves SC, Gomes DB, Sousa A, et al. Biofunctionalized pectin hydrogels as 3D cellular microenvironments. J Mater Chem B. 2015;3(10):2096‐2108. [DOI] [PubMed] [Google Scholar]
- 55. Rowley JA, Madlambayan G, Mooney DJ. Alginate hydrogels as synthetic extracellular matrix materials. Biomaterials. 1999;20(1):45‐53. [DOI] [PubMed] [Google Scholar]
Associated Data
This section collects any data citations, data availability statements, or supplementary materials included in this article.
Supplementary Materials
Supplemental Figure S1 STC1 mRNA expression unchanged in stress‐inducing conditions. STC1 mRNA expression was analyzed in the stress‐inducing conditions and normalized to GAPDH, and then to the basic, untreated condition. n = 3 for each sample. One‐way ANOVA; n.s. not significant. Error bars represent mean ± SD.
Supplemental Figure S2. Exploring the link between proliferation and STC1. DNA (A) and STC1 release in 24 hours, normalized to DNA (B), in proliferative cells: basic (untreated), and basic +bFGF, or non‐proliferative cells: medium with 0.5% FBS and high cell seeding density (20 000 cells/cm2), 1% DMSO (C, D), actinomycin D, CDK4 inhibitor, valproic acid, or AZD5438 (E, F). (G) STC1 release in 24 hours of hMSCs transduced with scrambled shRNA (SCR), or two different STC1 shRNA. (H) DNA analysis after 7 days of culture in basic medium. (I) DNA analysis after 7 days of culture in basic medium, or basic medium supplemented with recombinant STC1. (C, D, I) Student's t‐test, (A, B, E‐H) One‐way ANOVA. * P < .05, ** P < .01, *** P < .001, ****P < .0001, compared to basic or SCR. Error bars represent mean ± SD.
Supplemental Figure S3. Exploring STC1 secretion in two more donors. Total secreted STC1 in the medium over 24 hours culture period treated with blebbistatin (A) and (C) ROCK inhibitor Y27632 (B) and (D), measured by ELISA, normalized by total DNA in each sample (n = 3 for all samples). (A) and (B) for donor number 2 and (C) and (D) donor number 3. One‐way ANOVA; * P < .05, *** P < .001, n.s. not significant compared to Control. Error bars represent mean ± SD.
Supplemental Figure S4. Validation of knock downs. Western blots of hMSCs transduced with shRNA for ZYX (A), PXN (B), LMNA (C), YAP (D), or control scrambled shRNA (SCR). TATA box binding protein (TBP) is shown as loading control.
Data Availability Statement
The data that support the findings of this study are available on request from the corresponding author.