

Abstract
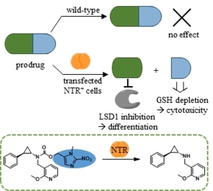
Lysine‐specific demethylase 1 (LSD1) has evolved as a promising therapeutic target for cancer treatment, especially in acute myeloid leukaemia (AML). To approach the challenge of site‐specific LSD1 inhibition, we developed an enzyme‐prodrug system with the bacterial nitroreductase NfsB (NTR) that was expressed in the virally transfected AML cell line THP1‐NTR+. The cellular activity of the NTR was proven with a new luminescent NTR probe. We synthesised a diverse set of nitroaromatic prodrugs that by design do not affect LSD1 and are reduced by the NTR to release an active LSD1 inhibitor. The emerging side products were differentially analysed using negative controls, thereby revealing cytotoxic effects. The 2‐nitroimidazolyl prodrug of a potent LSD1 inhibitor emerged as one of the best prodrug candidates with a pronounced selectivity window between wild‐type and transfected THP1 cells. Our prodrugs are selectively activated and release the LSD1 inhibitor locally, proving their suitability for future targeting approaches.
Keywords: chemistry, drug design, inhibitors, luminescence medicinal, oxidoreductases, prodrugs
Site‐specific targeting: Nitroaromatic prodrugs were activated by the bacterial nitroreductase NfsB (NTR) to selectively inhibit lysine‐specific demethylase 1 (LSD1) in transfected leukaemic cells. The effects of LSD1 inhibition and cytotoxicity of the side products were distinguished by negative controls. This system may be applied in targeting approaches to reach site‐specific LSD1 inhibition.
Introduction
In established cancer chemotherapy, many drugs concurrently cause side effects through their general toxicity to the whole organism. Damage to healthy cells and tissues can be diminished by targeted therapy that exploits differences between healthy and cancer cells. For example, therapeutic monoclonal antibodies are used to target specific surface proteins on cancer cells like HER2 in breast cancer. Another approach to improve drug‐target specificity for a selected cell type or site of disease is the development of prodrugs.1 Prodrugs are pharmacologically inactive forms of an inhibitor that undergo biotransformation to the active agent. The targeting of prodrugs is mainly realised by two possibilities, either by delivering the prodrug to specific transporters or receptors on the cancer cells via antibody‐drug conjugates or by a site‐specific drug release (Figure 1).2 Using phenotypic and genotypic differences between cancer and healthy cells, such as hypoxia or elevated levels of a specific enzyme, the site‐specific activation of prodrugs to the active drug can be achieved. These endogenous mechanisms were also exploited for prodrugs of epigenetic enzyme inhibitors, such as histone deacetylase (HDAC) inhibitor suberanilohydroxamic acid (SAHA; Vorinostat) and the lysine‐specific histone demethylase 1 (LSD1) inhibitor tranylcypromine (TCP, Figure 1).3, 4, 5, 6, 7 An example of using endogenously elevated enzyme levels for targeting is the TCP‐drug conjugate (Figure 1) that is activated by LSD1 in cancer cells. In this case, the LSD1 inhibitor itself is used as a prodrug moiety to release attached anticancer drugs.8, 9
Figure 1.

Schematic description of site‐specific drug release using an endogenous trigger or a targeted catalyst and recent examples for prodrugs of HDAC inhibitors and LSD1 inhibitors. The prodrugs can be activated chemically (blue background) by using thiols or reactive oxygen species (ROS) that are present in the cell or by targeted Pd/Au catalysts. Examples for the ROS‐triggered activation of aryl−boronate prodrugs are the prodrug of Belinostat and Q‐PAC, which releases the active inhibitor TCP.6, 7 Prodrug activation by enzymes that are targeted towards the cells or preferentially located in the target cells is also possible. An example of using endogenously elevated enzyme levels for targeting is NI−SAHA, which is activated by endogenous nitroreductases in hypoxic cells. Another example is the TCP‐drug conjugate (lower section) that is activated by LSD1 in cancer cells. During the mechanism‐based irreversible inhibition of LSD1 by TCP derivatives, the imine intermediate is hydrolysed, and the nitrogen atom is cleaved off from the cyclopropyl ring, leading to LSD1‐triggered release of attached anticancer drugs.8, 9
In addition to the use of endogenous mechanisms for prodrug activation in cancer cells, several other strategies are currently being explored.1 As schematically shown in Figure 1, the selective activation of prodrugs can be accomplished by using a targeted catalyst that is either an exogenous enzyme or a chemical catalyst. Bioorthogonal uncaging strategies such as heterogeneous palladium or gold catalysis can be used to release the inhibitor at the target site (Figure 1, bioorthogonal prodrug).10, 11 Selective targeting of exogenous enzymes to tumour cells is mainly accomplished by directed enzyme prodrug therapy (DEPT) approaches. They allow site‐specific release of active inhibitor by an exogenous enzyme that is either coupled to an antibody (ADEPT) or encoded by a gene that is targeted to the tumour site (GDEPT).1, 12
Delivery systems for the encoding genes are for example viral vectors or synthetic vectors such as liposomes.13 New alternatives to ADEPT are, for example, N‐glycan‐targeting moieties that preferentially accumulate at cancer cells or organs.14, 15 By employing an exogenous enzyme, the off‐target activity of the prodrug is minimised because the prodrug is likely not recognised by human enzymes. One prevalent enzyme for DEPT strategies is the bacterial nitroreductase NfsB (NTR), an oxygen‐insensitive flavin mononucleotide nitroreductase.1, 16 This enzyme has been well studied at both structural and kinetic levels, showing a ping pong Bi‐Bi mechanism with cycles of reduction by NAD(P)H and re‐oxidation by the nitroaromatic substrate.17, 18, 19, 20 A large variety of nitroaromatic substrates is converted to the corresponding hydroxylamines, including nitrofuran antibiotics and 2,4‐dinitrobenzamides such as the prototypical example CB1954, but also some quinones are recognised and reduced to hydroquinones.17, 20 Nitrobenzyl carbamates of a variety of cytotoxic amines are also converted by NTR to the hydroxylamine derivatives that subsequently undergo 1,6‐elimination and release CO2 and the free amine (Figure 2).21, 22, 23, 24 Hay and co‐workers extended the substrate spectrum towards 2‐alkoxy‐4‐nitrobenzylcarbamate and nitroheterocyclic carbamate prodrugs of 5‐aminobenz[e]indole derivatives.25, 26, 27
Figure 2.

Prodrug design and principle. Forming a carbamate with the amine group of LSD1 inhibitor 1 a prevents inhibition of LSD1. The NTR reduces the nitro group of prodrug 1 b via the nitroso intermediate to the hydroxylamine derivative by using NADH as co‐substrate. The following self‐immolative elimination leads to the release of the LSD1 inhibitor 1 a, CO2 and a Michael acceptor as side product, here an azaquinone methide (AQM) derived from the nitrobenzyl group.
Recently, a series of fluorescein‐based fluorophores masked with different nitroaromatics was synthesised in order to identify the best general masking group for NTR substrates.28 Fastest unmasking was observed for fluorescein linked to 2‐nitro‐N‐methyl imidazole (9, Scheme 1) that was subsequently used as prodrug moiety for the cell‐specific chemical delivery of several drugs. Nitrobenzyl and 2‐nitroimidazole carbamates were furthermore used as nitroreductase‐labile groups in a modular activation strategy for cyclopropane−tetrazine ligation.29
Scheme 1.

Synthesis of prodrugs of LSD1 inhibitor 1 a and the structurally related negative control 2 a. Only one enantiomeric structure is shown although it is a racemic mixture.
The general concept of NTR‐activated prodrugs is based on the switch from the electron‐withdrawing nitro group to the donating hydroxylamine, which in turn triggers self‐immolation and fragmentation after enzyme reduction. This was predominantly used for cytotoxic agents so far. We used this system to develop a research tool to study the effects of an epigenetic inhibitor in targeted cells which, as a non‐cytotoxic agent, also allows the study of the effect of the Michael acceptor that is formed upon enzymatic uncaging. Epigenetic modifications, including modifications of DNA and histone tails, are involved in the regulation of gene expression. The appropriate regulation is maintained by enzymes that introduce the modification (writers), those that remove the marks (erasers), and proteins or domains that recognise and bind the marks (readers). Mutations and misdirected recruitment of these epigenetic proteins are often involved in the development of cancer. Therefore, first inhibitors of these epigenetic enzymes emerged as promising drug candidates for cancer therapies over the last years.30, 31 Despite extensive research on specific and potent inhibitors, the recent clinical data suggest that side effects may limit the therapeutic window of epigenetic inhibitors.30, 32 The organ‐ or cell‐type‐specific inhibition of epigenetic regulators is a promising approach to circumvent these side effects because the effect and function of those proteins is highly context‐dependent. In particular, because tumours have highly heterogeneous characteristics, the targeting of specific cancer cells in a tumour, for example, cancer stem cells, may broaden the therapeutic window. This targeting can be achieved by prodrugs that are selectively activated. So far, prodrugs for epigenetic proteins include the DNA methyltransferase inhibitors azacytidine and decitabine or the examples presented in Figure 1 for HDACs and LSD1, yet no exogenous enzymes were used for prodrug activation.33
In this work, the exogenous enzyme NTR was used to activate nitroaryl prodrugs of the potent inhibitor 1 a (Figure 1) for the eraser protein LSD1. Dependent on its interaction partners, LSD1 is involved in both activation and repression of gene transcription by catalysing the demethylation of mono‐ and dimethylated K4 or K9 on histone H3.34, 35 Furthermore, LSD1 is able to demethylate lysine residues at non‐histone proteins, such as p53,36 DNA methyltransferase 137 and E2F1.38 LSD1 was identified as an important histone modifier in embryonic development,39, 40 and is required for haematopoietic cell lineage determination.41, 42 Elevated LSD1 expression levels are associated with poor prognosis in many types of solid cancers, including prostate cancer, breast cancer, and non‐small‐cell lung cancer.43, 44 LSD1 is overexpressed in several haematologic malignancies and thus gained attention as a promising therapeutic target, especially in acute myeloid leukaemia (AML).45 Recently, also a scaffolding role of LSD1 was elucidated in AML and small cell lung cancer (SCLC).46, 47, 48 In both malignancies, irreversible LSD1 inhibitors prevent not only the catalytic activity of LSD1 but also its interaction with the transcription factor GFI1B, thereby activating silenced genes.46, 47, 48 The majority of LSD1 inhibitors developed and used in pre‐clinical and clinical studies are TCP derivatives like 1 a that all share a mechanism of irreversible inhibition by covalently binding the FAD cofactor within the LSD1 active site.49 Herein, an enzyme prodrugs system with the NTR and nitroaryl prodrugs of LSD1 inhibitor 1 a was developed and fully characterised. Not only the release of 1 a and the cell‐specific LSD1 inhibition was shown, but also the effects of the side products was analysed by using appropriate negative controls. Additionally, a luminescent probe was developed to confirm the selective NTR activity in targeted cells. Overall, we established a new research tool to study the effects of pharmacological LSD1 inhibition in a defined context or area.
Results
Rationale for prodrug design
Attachment of a prodrug moiety to an active small molecule should diminish binding to the target protein strongly. In the case of LSD1 inhibitors, the cyclopropyl ring of TCP and its derivatives forms different adducts with C(4a) or N(5) of the LSD1 cofactor FAD.50, 51 In proposed mechanisms for this irreversible inhibition, the electron of the amine is involved in ring‐opening of the cyclopropyl ring and subsequent adduct formation.50 Incorporation of the cyclopropylamine into a carbamate reduces the basicity and reactivity of the TCP amine, and therefore the inhibitory activity of these prodrugs is expected to be significantly reduced. Additionally, the attachment of the nitroaromatic system to the carbamate could also prevent binding in the active site close to FAD by steric hindrance. The masking of the inhibitory activity of TCP‐based LSD1 inhibitors by carbamate formation was already described by Engel et al..6 They coupled TCP to an aryl boronate trigger (R4) that gets activated by high hydrogen peroxide levels in glioblastoma cells, releasing the LSD1 inhibitor and a para‐quinone methide (QM), which acts as a glutathione scavenger (Q‐PAC, Figure 1). The carbamate linker is advantageous as it is more stable than corresponding esters and carbonates in vivo.52 In addition, the carbamic acid formed after elimination of the benzylic prodrug moiety undergoes fast and irreversible self‐immolation.53, 54 This process is driven by its positive entropy and the formation of stable products, namely CO2 and the free amine.53
For our prodrug system, the nanomolar LSD1 inhibitor 1 a 55 was selected and the secondary amine was masked via a carbamate linker with different nitroaromatic alcohols. Figure 2 sketches the principle of prodrug activation for 4‐nitrobenzyl prodrug 1 b. In two reduction steps, the NTR reduces aromatic nitro groups via the nitroso intermediate to the hydroxylamine derivative using NADH as co‐substrate.19 The change from the electron‐withdrawing substituent to an electron‐donating one enables the self‐immolation of the hydroxylamine by 1,6‐elimination in the case of 4‐nitrobenzyl prodrugs or 1,4‐elimination in the case of 5‐membered hetero‐aromatics. Thereby, the intermediate fragments to the active LSD1 inhibitor, CO2 and a Michael acceptor as side product.
The E. coli nitroreductase NfsB has a broad substrate specificity and thus it was expected that it also reduces sterically more demanding prodrugs of 1 a. Gruber et al. give evidence that 2‐nitro‐N‐methyl imidazole is the best masking group for NTR‐mediated prodrug activation.28 However, the most reactive derivative is not necessarily the best prodrug in cellular experiments.26, 56 Therefore, we synthesised a diverse set of prodrugs bearing different nitroaromatics. This is also necessary in order to evaluate the possible interactions of the prodrugs with LSD1. This undesired interaction is conceivable as the prodrugs are substituted with a bulky residue at the TCP amine, similar to potent LSD1 inhibitors and the LSD1‐drug conjugate in Figure 1.
In cellular experiments, the reactivity of the released Michael acceptor side product is different among the nitroaromatics. For 4‐nitrobenzyl prodrugs, the formation of an azaquinone methide (AQM; also known as iminoquinone methide; Figure 2) is described, however, the cellular effects are usually not further studied.21, 22, 57 It is under discussion that these intermediates react with cellular nucleophiles such as the antioxidant glutathione, causing cytotoxic effects at higher concentrations.57 So far, the intrinsic cytotoxicity of AQM was not evaluated well as the activated prodrugs mostly released cytotoxic agents in parallel and negative controls are missing frequently. For nitro heteroaromatics that are one of the prevalent bioreductive groups in hypoxia‐activated prodrugs, different mechanisms of fragmentation, reaction with nucleophiles, and ring‐opening are discussed.58, 59, 60, 61
To distinguish between effects from the released LSD1 inhibitor and the Michael acceptor, two structurally closely related negative controls, 2 c and 2 f, were developed (Scheme 1). Amine 2 a, bearing an additional methyl‐group at the cyclopropyl of TCP, was shown to lack inhibitory activity on LSD1 in the low micromolar range.62 The attachment of 2‐fluoro‐4‐nitrobenzyl or 2‐nitroimidazolyl to the amine of 2 a via a carbamate linker gave the two negative probes 2 c and 2 f, respectively (Scheme 1). They release the same reactive intermediates as the prodrugs 1 c and 1 f, but instead of LSD1 inhibitor 1 a, they release the inactive control 2 a, allowing a differentiated analysis of LSD1 inhibition and effects induced by the released Michael acceptor.
Synthesis of prodrugs and negative controls
Amines 1 a and 2 a were synthesised according to common procedures for reductive amination with primary amines.62 As trans‐TCP is more potent than the cis‐isomer, only prodrugs of trans‐1 a and trans‐2 a were synthesised as racemates and in the case of 1 d as diastereomers, as confirmed by chiral phase HPLC analysis.63 For the carbamate formation, either activation of the amine or of the alcohol is necessary in order to introduce the carbonyl moiety. For prodrugs 1 b–d, 1 f, 1 g and negative controls 2 c and 2 f, the amine was activated to the corresponding carbamoyl chloride using triphosgene (Scheme 1). Prior to the addition of the nitroaromatic alcohol, the hydroxyl group was deprotonated using sodium hydride to facilitate nucleophilic attack on the carbamoyl carbonyl. For nitrothiophene 8, this procedure resulted in low yield and formation of side products. Thus, 8 was activated using 4‐nitrophenyl chloroformate to form the carbonate 11 (Scheme S2) that was subsequently added to amine 1 a, resulting in prodrug 1 e in good yield (47 %).
Alcohols 6 and 8 were obtained by reduction of the corresponding carboxylic acid or aldehyde. Compound 7 was prepared according to patent literature, using TMS−CF3 for the introduction of the trifluoromethyl group.64 The five‐step synthesis scheme for 2‐nitro imidazole 9 described by O'Connor et al. was slightly modified as described in Scheme S1.65 Prior to the addition of cyanamide in the third step, the pH of the solution was adjusted to 3 using a NaOAc/HOAc buffer, instead of using 2 M aqueous NaOH. This stabilization of the pH range avoids double reaction of the cyanamide which would lead to the formation of guanidine instead of the amine. This amine is further oxidised to a nitro group using sodium nitrite and glacial acid. To avoid decomposition of generated nitrous acid, the sodium nitrite dissolved in water was cooled to 0 °C prior to the slow addition of the 2‐aminoimidazole in glacial acid. The hydroxymethyl‐5‐nitro imidazole 10 was synthesised directly from 1‐methyl‐5‐nitroimidazole by microwave‐assisted addition of paraformaldehyde.
In vitro evaluation of LSD1 inhibition by prodrugs
A peroxidase‐coupled assay was used to check for undesired inhibition of LSD1 by the prodrugs 1 b–g and the negative controls 2 a, 2 c and 2 f. In this assay, the hydrogen peroxide generated by the LSD1 enzyme during the demethylation reaction is quantified. The results in Table 1 show that all prodrugs except 1 d are indeed, as desired, >100 times less potent tanh the parent inhibitor 1 a. The smaller window for 1 d and the inhibition of LSD1 by 1 e and 1 g in the micromolar range can be caused either by direct inhibition of LSD1 enzyme by these carbamates or through inherent instability of these two prodrugs. The first hypothesis is supported by the fact that the change from 2‐nitro imidazole (1 f) to 5‐nitro imidazole (1 g) leads to a significant decrease of the IC50. The presence of the trifluoromethyl group in 1 d also seems to contribute to the interaction with LSD1, leading to a lower IC50 value compared with the nitrobenzyl prodrug 1 b.
Table 1.
In vitro evaluation of LSD1 inhibition by the LSD1 inhibitor 1 a, prodrugs 1 b–g and negative controls 2 a, 2 c and 2 f using a Peroxidase‐coupled assay. Most of the prodrugs are >100 times less potent than parent drug 1 a. Determination of higher IC50 values were not possible due to poor solubility. n.i.=inhibition≤10 %.
|
|
# |
LSD1 inhibition in vitro IC50 [μM] |
Potency window prodrug/1 a |
|---|---|---|---|
|
LSD1 inhibitor |
1 a |
0.094±0.017 |
|
|
prodrugs |
1 b |
n.i. at 10 μM |
>110 |
|
1 c |
n.i. at 10 μM |
>110 |
|
|
1 d |
5.23±0.48 |
58±12 |
|
|
1 e |
26.18±5.55 |
288±81 |
|
|
1 f |
n.i. at 10 μM |
>110 |
|
|
1 g |
30.50±0.92 |
335±61 |
|
|
negative controls |
2 a |
n.i. at 10 μM |
>110 |
|
2 c |
n.i. at 10 μM |
>110 |
|
|
2 f |
n.i. at 10 μM |
>110 |
Stability tests with the prodrugs in buffer indicated no significant release of inhibitor 1 a that could distort the measured LSD1 inhibition (Figure S2). Schulz‐Fincke et al. already described that the methylated analogue 2 a was inactive on LSD1 below 10 μM.62 As expected, also negative controls 2 c and 2 f were inactive in the low micromolar range.
In vitro evaluation of prodrug activation and fragmentation
To establish a general method for analysis of a diverse set of prodrugs, we developed a protocol to monitor prodrug activation by the NTR and subsequent fragmentation in one assay. In the first step, fluorescent measurement of NADH oxidation indicates the amount of reduced prodrugs as the consumption of co‐substrate NADH directly correlates with the reduction of the nitro compounds in the reaction.66 The assay was optimised in a way to reach high substrate conversion, necessary for the following quantitative detection of fragmentation products. The enzyme concentration was chosen to keep the conversion ratio between different prodrugs at a constant level and NADH was used in excess. The prodrugs were compared after 15 minutes, when the velocity of NADH oxidation of the prodrug samples was equal to the one from the DMSO control, indicating no further enzymatic reaction. After extended incubation time to allow quantitative fragmentation of activated prodrugs, the released inhibitor 1 a was derivatised at its amine functionality using 9‐fluorenyl‐methoxycarbonyl chloride (Fmoc−Cl), forming fluorescent derivative 3 that was further quantified by HPLC (Figure 3A). Optimised conditions for the derivatisation of amines with Fmoc−Cl from the literature were adapted for our approach.67
Figure 3.
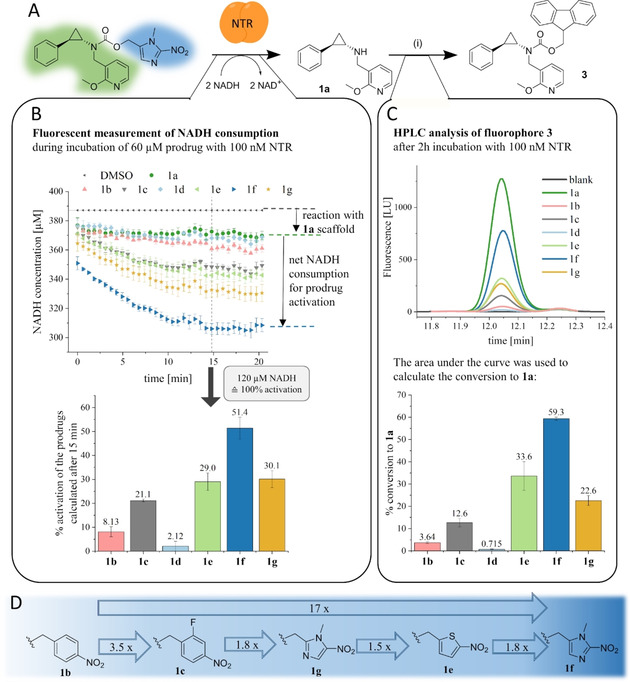
Scheme of in vitro analysis of prodrug activation by NTR and subsequent fragmentation. A) Prodrug activation releases LSD1 inhibitor 1 a, which was further quantitatively derivatised to fluorophore 3. i) FMOC−Cl, NaHCO3, H2O/ACN, pH 9.0. B) The activation of the prodrugs was visualised by fluorescent measurement of NADH consumption during the enzymatic reduction. As two reduction steps are necessary to generate the hydroxylamine, which can further fragment, 100 % prodrug activation was equated with the consumption of two equivalents of NADH. C) The fragmentation to 1 a was evaluated by derivatisation to 3, which was quantified by HPLC analysis. The area under the curve was used to calculate the actual concentration of 3, resulting in the degree of fragmentation displayed in the graph. For the activated fraction of nitrobenzyl‐containing prodrugs 1 b, 1 c and 1 d (measured in (B)), a quantitative fragmentation to 1 a was not observed. In comparison, the heteroaromatic prodrugs 1 e and 1 f fragmented quantitatively. D) Representation of the order of reactivity of the prodrugs with the NTR. The fragmentation data from (C) were used to calculate the factors, and the commonly used nitrobenzyl derivative 1 b was used as reference.
The results from the NADH consumption assay correlate with the ones obtained in the HPLC fragmentation assay (Figure 3B and C). The best‐activated prodrug 1 f also released the highest amount of active inhibitor 1 a. For 2‐nitroimidazole 1 f, the calculated activation was 51.4 % and the detected fragmentation was 59.3 %, hence 8 % higher than expected. The activation was calculated after 15 minutes, but the enzymatic reaction was stopped after two hours. This additional incubation time probably allows for further slow activation of the prodrugs, leading to an increased conversion of 1 f. Compared with the commonly used 4‐nitrobenzyl 1 b, prodrugs 1 c, 1 e, and 1 g showed improved activation and fragmentation properties. We noticed that fluorination of the benzyl ring in meta position to the nitro group like in 1 c improved the prodrug fragmentation rate by a factor of 3.5, an effect also described by Yang et al.68 Nitrothiophene prodrug 1 e and 5‐nitroimidazole 1 g were activated to the same extent, but the fragmentation assay indicates that only 1 e releases the active inhibitor 1 a quantitatively. In contrast, for 5‐nitroimidazole prodrug 1 g and the nitrobenzyl prodrugs 1 b, 1 c, and 1 d, only 34–60 % of the activated prodrug fraction, as calculated from the NADH assay (Figure 3B), were converted to the active inhibitor 1 a (Figure 3C). Interestingly, the 4‐nitrobenzyl derivative 1 d was activated with the lowest rate and showed no significant fragmentation. To rank the prodrug according to their activation by the NTR, we compared the fragmentation rates of each prodrug with the commonly used 4‐nitrobenzyl derivative that showed the poorest NTR‐mediated conversion. Overall, we could improve the prodrug activation and fragmentation from nitrobenzyl 1 b to 2‐nitroimidazole 1 f by a factor of 17 (Figure 3D).
Synthesis and evaluation of luminescent NTR probes to prove NTR activity
In order to determine the expression and correct function of the NTR in transfected cells, a luminescent assay was developed. In literature, a variety of nitro‐caged fluorescent and luminescent probes to visualise the activity of reductases in vitro and in vivo has been described.69, 70 Many of these fluorescent probes can be activated under hypoxia by endogenous oxygen‐sensitive nitroreductases, others are used to detect NTR activity in E. coli or bacterial lysates. For this project, a sensitive probe that is activated by NTR and that can enter cells was required. According to Feng et al., firefly luciferin masked with a nitrobenzyl produced higher luminescent signals than the related amino−luciferin masked with a nitrobenzyl carbamate.70 Zhou et al. additionally found that the cyanobenzothiazole precursor is more suitable for cellular experiments, probably by increased cell‐permeability compared with the negatively charged luciferin.71 Furthermore, the introduction of an N,N′‐dimethylethylenediamine linker increased the reactivity towards the used reductase, in their case a diaphorase.71 By transferring this knowledge to the development of a luminescent NTR probe, the trimethyl lock quinone used by Zhou et al. was replaced by nitroaromatics as protecting group (Figure 4). To further increase the reactivity towards NTR, a 5‐nitrothiophenyl group was attached instead of the less reactive but most commonly used 4‐nitrobenzyl prodrug moiety. So far, 5‐nitrothiophene was rarely used as a masking group for the detection of nitroreductase activity in cells.72 Probe 4 was synthesised by applying standard Mitsunobu conditions to couple (5‐nitrothiophen‐2‐yl)methanol (8) to 6‐hydroxy‐2‐cyanobenzothiazole (hydroxy−CBT; Figure 4). For probe 5, the coupling with the mono‐Boc protected diamine linker was performed as described by Mustafa et al., using bis‐(pentafluorophenyl) carbonate to activate the hydroxy−CBT (Scheme S2).73 In the following Boc‐deprotection with trifluoroacetic acid (TFA), thioanisol was used as a scavenger to avoid side reaction of the tert‐butyl cation on the cyano group of hydroxy−CBT.73 The amine was subsequently coupled to the activated carbonate 11 (Scheme S2) that was used in excess to minimise intramolecular cyclization under basic conditions. The conversion was good estimated by TLC but side product formation necessitated purification via semipreparative HPLC. Thus only 1 % of purified probe 5 were isolated.
Figure 4.
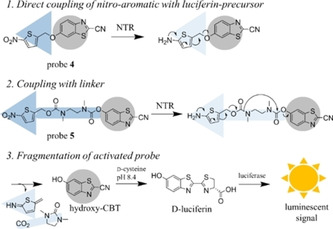
Scheme of luminescent probes for the selective detection of NTR in cells. After activation by NTR, the reduced intermediate fragments spontaneously to release the luciferin‐precursor hydroxy−CBT (highlighted in grey), which further reacts with d‐cysteine to give d‐luciferin. This is quantified by the addition of luciferin detection reagent and subsequent measurement of the generated luminescent signal.
Prior to cellular tests, the stability of probe 4 and 5 in buffer and their activation by recombinant NTR was evaluated in vitro. After incubation of the probes with NTR and excess NADH, the luciferin detection reagent, containing a luciferase and d‐cysteine, was added. Under basic conditions, the liberated luciferin‐precursor hydroxy−CBT reacts with d‐cysteine in a condensation reaction to give d‐luciferin, which further undergoes enzymatic oxidation to an excited state, resulting in a measurable luminescent signal (Figure 4). At low NTR concentrations (18–30 nM), the conversion of probe 5 exceeded the conversion of probe 4 by a factor of at least 5. At higher enzyme concentration, the difference in conversion rate was smaller as the conversion of probe 5 stopped to increase linearly with the NTR concentration. Reasons for the better activation of 5 might be the better accessibility of the nitroaromatic ring to the NTR active site, but also the generation of a thermodynamically stable five‐membered ring that forms after nucleophilic attack of the released amine on the carbonyl group (Figure 4).
Cellular activity
The cellular activity of our enzyme‐prodrug system was evaluated in the AML cell line THP1. The NTR‐expressing cell line THP1‐NTR+ was generated by lentiviral transfection of wild‐type THP1 cells (THP1wt) with an nfsb gene construct. To confirm the cellular activity of the NTR, the developed luminescent probes 4 and 5 were tested in both cell lines THP1wt and THP1‐NTR+ (Figure 5). The heterologously expressed NTR activates the probes leading to a release of the free luciferin precursor only in the transfected cells. After cell lysis, this precursor can be quantified by addition of luciferin detection reagent, as described for the in vitro assay. The conversion of the probes in THP1‐NTR+ cells increased with increasing cell numbers, whereas in THP1wt cells, no increase in luminescent signal was observed (Figure 5). The diamine linker containing probe 5 was much better activated than the directly masked probe 4. One disadvantage of hydroxy−CBT is its instability in cells, only allowing short incubation times and therefore limiting the sensitivity. Pre‐incubation of hydroxy−CBT in vitro with recombinant NTR in buffer did not change the luminescent signal, proving its stability under cell‐free conditions. In summary, the activity of NTR in the stably transfected THP1‐NTR+ cells can be proven using the sensitive and rapidly activated probe 5. In THP1wt cells, we did not observe any conversion and thus it can be expected that no other reductases in THP1wt could activate our pro‐luminescent probes. This fast protocol can be a general tool for the screening of other cell lines in order to identify suitable cells for the NTR/prodrug approach.
Figure 5.
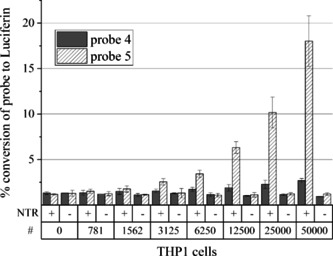
Detection of NTR activity in THP1 cells. In NTR‐expressing THP1 cells (+), probes 4 and 5 are converted to luciferin, whereas in nontransfected THP1wt cells (−), there is no activation. The probe conversion by NTR increases with increasing cell numbers (#).
We then used the two cell lines THP1wt and THP1‐NTR+ for cellular testing of the LSD1 inhibitor 1 a, the prodrugs 1 b–g and the negative controls 2 a, 2 c, 2 f. For the detection of cellular LSD1 activity, we performed a functional (CD86‐based) and a phenotypic assay (Colony Forming Unit assay).
CD86‐based cell assay
In addition to the catalytic activity on methylated proteins, LSD1 has significant scaffolding functions in cells that still respond to enzyme inhibition by TCP and derivatives. Maiques‐Diaz et al. showed such a role of LSD1 in THP1 cells for the regulation of GFI1‐target genes.74 Pharmacological inhibition of LSD1 disrupts the physical interaction with GFI1 resulting in altered expression of GFI1‐target genes with cd86 being one of the most highly upregulated genes.74 Lynch et al. published CD86 as a sensitive dose‐dependent biomarker for LSD1 inhibition in THP1 cells in 2013.75 This change in gene expression after LSD1 inhibition was utilised as a readout for the cellular assay to test all compounds for this enzyme‐prodrug system. In this functional assay, CD86‐positive cells were quantified by FACS analysis after the treatment with either the LSD1 inhibitor 1 a, one of the prodrugs or negative controls.
The LSD1 inhibitor 1 a showed a dose‐dependent increase of CD86‐positive THP1wt cells with an EC50 of 3.0±0.3 nM. The prodrugs of 1 a showed undesired dose‐dependent effects, however with distinct lower potencies than the inhibitor 1 a. As one important feature of our NTR‐prodrugs is a diminished activity on LSD1 in THP1wt, the most promising prodrug in this assay with non‐transfected THP1wt cells is 1 b as it is >1000 times less potent than the inhibitor 1 a. The same assay was performed with THP1‐NTR+ cells, which stably express the prodrug activating enzyme NTR. In this cell line, the prodrugs are expected to be activated by the NTR to release LSD1 inhibitor 1 a, thereby increasing the number of CD86‐positive THP1‐NTR+ cells. All prodrugs, with the exception of 1 d, regulated CD86 levels in the same range as the inhibitor 1 a (EC50=4.1±0.4 nM) in the THP1‐NTR+ cell line (Table 2, Figure 6). Thus, most prodrugs get completely activated into the LSD1 inhibitor 1 a in THP1‐NTR+ cells. Only 1 d had the same EC50 in both cell lines and thus we can conclude that it was not activated in THP1‐NTR+ cells.
Table 2.
FACS analysis of CD86‐positive cells of non‐transfected THP1wt cells and THP1 expressing the NTR (THP1‐NTR+). The selectivity window shows the difference in EC50 between both cell lines. Figure S3 illustrates all individual EC50 curves. n.a.: not accessed.
|
|
# |
THP1wt CD86+ EC50 [nM] |
THP1‐NTR+ CD86+ EC50 [nM] |
selectivity window THP1wt / THP1‐NTR+ |
|---|---|---|---|---|
|
LSD1 inhibitor |
1 a |
3.0±0.3 |
4.1±0.4 |
1±1 |
|
prodrugs |
1 b |
66.5 % at 10 μM |
5.8±0.4 |
>1000[a] |
|
1 c |
783±64 |
3.8±0.2 |
206±28 |
|
|
1 d |
301±37 |
245±30 |
1±1 |
|
|
1 e |
143±32 |
4.0±0.2 |
36±10 |
|
|
1 f |
376±17 |
5.7±0.4 |
66±8 |
|
|
1 g |
617±14 |
15.1±1.1 |
41±4 |
|
|
negative controls |
2 a |
(17.6±0.6)×103 |
(15.3±2.1)×103 |
1±1 |
|
2 c |
>50μM |
29% at 10 μM |
n.a. |
|
|
2 f |
>50μM |
33% at 10 μM |
n.a. |
[a] Calculated from an extrapolated dose‐response curve in THP1wt cells.
Figure 6.

Result of cellular assays with the LSD1 inhibitor 1 a and prodrug 1 f (A, C, E) and the negative controls 2 a and 2 f (B, D, F) with both cell lines, nontransfected THP1wt (triangles and straight lines) and stably NTR expressing THP1‐NTR+ (squares and dashed lines). A), B) The CD86‐based FACS assay showed that prodrug 1 f and negative control 2 f activated in THP1‐NTR+ cells reach the same effect as their parent compounds 1 a and 2 a. C), D) The CFU assay with the prodrug 1 f showed a clear increase in potency in NTR‐expressing cells caused by cell‐type‐specific LSD1 inhibition and cytotoxicity from the formed side product (C). The assay with the negative control 2 f showed the cytotoxic effect from the Michael acceptor as side product involved in the CFU assay. E), F) The viability assay showed cytotoxic effects in NTR‐expressing THP1‐NTR+ cells with the prodrug 1 f (E) and negative control 2 f (F) due to the formed Michael acceptor released as side product after prodrug activation.
Negative controls 2 c and 2 f did not increase CD86‐levels in THP1wt cells up to 50 μM. 2 a showed no LSD1 inhibition in vitro up to 10 μM, however showed a dose‐response effect in the higher micromolar range in THP1wt (EC50=17.6±0.6 μM) and THP1‐NTR+ (EC50=15.3±2.1 μM) cells (Figure 6). 2 c and 2 f are prodrugs of the negative control 2 a and are expected to have the same effect as 2 a in THP1‐NTR+ cells, particularly since the prodrugs of 1 a were quantitatively activated in this assay. Indeed, 2 f showed an effect with 33 % CD86‐positive THP1‐NTR+ cells at 10 μM and 2 c induced 29 % CD86‐positive THP1‐NTR+ cells at the same concentration (2 a induced 34 % at 10 μM). At concentrations above 10 μM, the amount of dead cells in the sample increased. This cytotoxicity, also seen in the viability assays (Figure S5 and Table S1), impeded the measurement of complete dose‐response curves for 2 c and 2 f in THP1‐NTR+ cells. Nevertheless, the negative controls 2 c and 2 f did not affect the CD86 expression at nanomolar concentrations that are needed for our enzyme‐prodrug system. These results prove that the CD86 expression in THP1‐NTR+ cells treated with prodrugs 1 b–g arise from released LSD1 inhibitor 1 a and not from side products of the fragmentation.
The indirect effect on neighbouring cells resulting from a released inhibitor that diffuses from one cell type to neighbours which do not release the inhibitor from prodrugs is called bystander effect. Since the bystander effect is thought to be important for a successful GDEPT therapy, the effect was studied for our prodrugs, too. This bystander effect was studied with mixtures of the cell lines THP1wt and THP1‐NTR+ and with prodrug concentrations that only affect the CD86 levels of THP1‐NTR+ cells. Figure S7 shows that all cells in the mixture of the cell lines are CD86‐positive, which implies that the LSD1 inhibitor released in THP1‐NTR+ cells diffuses to “by‐standing” THP1wt cells without NTR.
Colony forming unit assay
LSD1 represses promoter and enhancer activities in the haematopoietic differentiation program. Therefore, LSD1 inhibition in THP1 cells results in differentiation and reduced numbers of colonies in the colony forming unit (CFU) assay.74, 76, 77 The CFU assay allows the assessment of the capacity of a single progenitor cell to proliferate independently into a colony. Differentiation, but also cytotoxic effects will result in reduced numbers of colonies in the assay. In general, irreversible LSD1 inhibition does not reduce the viability of most cells, including THP1 cells.78 Therefore, cytotoxic effects should not be involved with specific, TCP‐based LSD1 inhibitors. Cellular effects of the LSD1 inhibitor 1 a, prodrugs 1 b–g and negative controls 2 a, 2 c and 2 f were tested in the CFU assay with the two cell lines THP1wt and THP1‐NTR+.
As expected from the nanomolar inhibition of LSD1 in vitro (IC50 of 94±17 nM, Table 1), 1 a also affected the colony formation with an EC50 of 68±12 nM (Figure 6). The assumed decreased potency of the prodrugs on LSD1 was observed in the CFU assay with potencies at least 50 times higher than the EC50 of LSD1 inhibitor 1 a (Table 3) in the same cell line THP1wt. Among the prodrugs, 1 e affected the clonogenic potential of THP1wt cells nearly in the same range as 1 a. In vitro data about LSD1 inhibition (Table 1) and stability data (Figure S2) do not explain this effect of 1 e in the CFU assay with THP1wt, but a rather potent effect was seen in the CD86‐based cell assay, too. The negative controls 2 c and 2 f are both inactive in the Peroxidase‐coupled assay with recombinant LSD1 and also in the CFU assay with THP1wt cells at 50 μM. 2 a did not inhibit LSD1 in vitro at 10 μM but had an effect at higher concentrations in the CFU assay resulting in an EC50 of 45.5±3.2 μM (Figure 6).
Table 3.
CFU assay with the two cell lines THP1wt and THP1‐NTR+. The selectivity window shows the difference in EC50 between both cell lines. Figure S4 illustrates all individual EC50 curves.
|
|
# |
THP1wt CFU EC50 [nM] |
THP1‐NTR+ CFU EC50 [nM] |
Selectivity window THP1wt / THP1‐NTR+ |
|---|---|---|---|---|
|
LSD1 inhibitor |
1 a |
0.06±0.02 |
0.04±0.01 |
2±1 |
|
prodrugs |
1 b |
29.0±1.6 |
7.6±0.7 |
4±1 |
|
1 c |
2.9±0.2 |
0.4±0.2 |
10±5 |
|
|
1 d |
2.5±0.3 |
2.6±0.4 |
1±1 |
|
|
1 e |
0.10±0.01 |
0.15±0.01 |
1±1 |
|
|
1 f |
4.4±0.7 |
0.33±0.07 |
14±4 |
|
|
1 g |
5.0±0.3 |
1.2±0.3 |
4±1 |
|
|
negative controls |
2 a |
45.5±3.2 |
32.4±1.7 |
1±1 |
|
2 c |
>50μM |
14.9±1.0 |
>3±1 |
|
|
2 f |
>50μM |
0.9±0.2 |
>58±13 |
The inhibitor 1 a showed the same potency in both cell lines THP1wt (EC50=0.06±0.02 μM) and THP1‐NTR+ (EC50=0.04±0.01 μM) in the CFU assay (Figure 6). As the THP1‐NTR+ cell line stably expresses the prodrug activating enzyme NTR, LSD1 inhibitor 1 a is released after prodrug treatment of THP1‐NTR+ cells and reduced numbers of colonies should be observed in the CFU assay with THP1‐NTR+ compared with THP1wt cells. This activation of prodrugs is demonstrated by the increased potencies in THP1‐NTR+ cells in the CFU assay compared with non‐transfected THP1wt cells, except from 1 d and 1 e (Table 3). With 14‐fold selectivity, the 2‐nitroimidazolyl prodrug 1 f showed the best selectivity window between the two cell lines THP1wt and THP1‐NTR+ (Figure 6). Since the thiophene‐masked prodrug 1 e already affected the clonogenic potential in THP1wt cells, no increase in potency was obtained in THP1‐NTR+ cells. The prodrug 1 d also showed no change in the EC50 between the two cell lines, likely because it is not activated in THP1‐NTR+ cells, which was already seen in in vitro tests and the CD86‐based cell assay with 1 d before.
Interestingly, the negative controls 2 c and 2 f showed higher potencies in THP1‐NTR+ cells than the negative control 2 a, which is released from 2 c and 2 f after activation by the NTR. Synergistic effects of control 2 a and the Michael acceptor released as side product must be involved in the mechanisms of colony reduction after enzymatic activation of negative controls 2 c or 2 f in THP1‐NTR+ cells. As the recombinant NTR activated the 2‐nitroimidazole containing 2 f better than 2‐fluoro‐4‐nitrobenzyl‐masked 2 c (Figure S1), 2 f might release more of the cytotoxic Michael acceptor, resulting in a higher potency of 2 f in THP1‐NTR+ (EC50=0.9±0.2 μM) compared with 2 c (EC50=14.9±1.0 μM). As the structurally related prodrugs 1 c and 1 f already affected the colony formation of THP1wt in the low micromolar range, they showed a smaller selectivity window compared with 2 c and 2 f. Still, 1 c and 1 f releasing the active LSD1 inhibitor as parent drug are much more potent than the negative controls 2 c and 2 f. The pairs, 1 c/2 c or 1 f/2 f, have identical nitroaromatic prodrug moieties and release the same side products, thus the increased potencies of the prodrugs 1 c and 1 f compared with 2 c and 2 f in THP1‐NTR+ cells must result from the released LSD1 inhibitor 1 a (Figure 6).
The bystander effect, explained in the CD86‐based cell assay section above, was examined in the CFU assay, too. The assay was performed with mixtures of the cell lines THP1wt and THP1‐NTR+ and prodrug concentrations, at which mainly THP1‐NTR+ cells were affected in the CFU assay. Both prodrugs, 1 b at 10 μM and 1 f at 1.0 μM, showed no bystander effect (Figure S8). Due to the highly diluted cell concentration in the assay, cells have to proliferate independently without cell‐cell communication. Thus, released inhibitor 1 a after prodrug activation in transfected cells is not able to diffuse significantly to the more remote cells in the CFU assay. Overall, the in vitro best‐activated prodrug 1 f showed the most potent effect in THP1‐NTR+ cell and the biggest selectivity window between the two cell lines in the CFU assay (Figure 6).
Viability assay and GSH assay
As not only differentiation of cells, but also cytotoxic effects can result in reduced numbers of colonies in the CFU assay, all compounds were tested in a viability assay with both cell lines. In THP1wt cells, no cytotoxicity was observed (Figure S5 and Table S1). Interestingly, the prodrugs 1 c, 1 f, 1 g and 1 e showed cytotoxic effects in the THP1‐NTR+ cell line. The negative controls 2 c and 2 f showed cytotoxicity in THP1‐NTR+ cells, too. Both parent drugs, 1 a of the prodrugs and 2 a of the negative controls had no cytotoxic effect in both cell lines in the viability assay (Figure 6). Thus, the cytotoxicities of prodrugs and negative controls in the two cell lines THP1wt and THP1‐NTR+ in the viability assay must rise from the side products of the enzymatic activation. The QM side product derived from prodrugs with a p‐hydroxy benzyl linker can deplete the scavenger glutathione (GSH) in cells.79 Hulsman et al. identified a GSH‐QM adduct by LC‐MS in HT29 cell lysates after the incubation with their prodrugs.79 The cellular GSH depletion can result in various signal transductions leading to apoptosis or necrosis.80 Similar to QM, the Michael acceptors released from our activated nitroaromatic molecules, are highly electrophilic. Therefore, the cytotoxic negative controls 2 c and 2 f and prodrugs 1 b, 1 c and 1 f were tested in a GSH‐assay with Ellman's reagent for thiol reactivity. All toxic compounds in the viability assay resulted in reduced GSH‐levels in THP1‐NTR+ cells but had no effect in THP1wt cells (Figure S6). Thus, enzymatic prodrug activation and not the compound itself causes the observed GSH (thiol) depletion. The prodrug 1 b had no cytotoxic effect in both cell lines and also did not show GSH depletion in both cell lines, confirming a correlation between cytotoxicity and GSH‐depletion in THP1‐NTR+ cells after prodrug activation.
Discussion
Inhibition of epigenetic proteins is a promising and emerging strategy in the treatment of cancer. The effect of epigenetic regulators is highly context‐dependent, and as a result, their global inhibition can lead to diverse and undesired side effects. To possibly realise a cell‐type, organ or tissue‐specific inhibition, we developed an enzyme‐prodrug system using NTR and nitroaromatic prodrugs of LSD1 inhibitor 1 a. Together with the newly developed luminescent probe 5, which enables a fast and simple detection of NTR activity in any cell line, our system can be applied with different targeting strategies to selectively inhibit LSD1. By varying the nitroaromatic prodrug moiety, the prodrugs were optimised to be stable in THP1wt cells and to release the LSD1 inhibitor in presence of the prodrug‐activating enzyme NTR, thus reaching a sufficient selectivity window in vitro and in THP1 cells. Prodrug 1 f using 2‐nitro‐N‐methyl imidazole (9) as prodrug moiety showed the best properties in our studies with isolated NTR as well as in cellular experiments. This result is in accordance with literature on prodrugs for other targets, where substrates masked with 9 were recently found to be reduced fastest by NTR, followed by 5‐nitrofuranyl, 5‐nitrothiophenyl (8) and considerably slower the most commonly used 4‐nitrobenzyl substrates.28 Gruber et al. subsequently demonstrated the applicability of NTR for cell‐specific chemical delivery by the attachment of 9 to the hydroxy group of a cAMP analogue and to the secondary amine of an NMDA receptor antagonist, the latter via a carbamate linker.28 With our enzyme‐prodrug system, we were able to support a broad applicability of NTR in such prodrug approaches and confirm the favourable properties of the 2‐nitro‐N‐methyl imidazolyl group (9) as an optimised prodrug moiety for NTR‐mediated release.
Additionally, we showed that 2‐fluoro substitution on the benzyl ring such as in 1 c resulted in an increased NTR‐mediated conversion in comparison to the simple nitrobenzyl in 1 b, an effect also described for a nitroreductase from T. brucei.68 The fluorine substitution likely favours an accelerated fragmentation of the hydroxylamine intermediate, an impact already described for electron‐donating substituents in the 2‐position of the 4‐nitrobenzyl moiety.81 Overall, the order of potency and selectivity for NTR‐positive cells indicates a relationship between the rate of nitro group reduction and the one‐electron reduction potential [E(1)] of the nitroaromatic groups. Hay et al. discussed the complexity of this relationship for the NfsB enzyme and Nivinskas et al. for the related oxygen‐insensitive nitroreductase from Enterobacter cloacae.26, 82 We could confirm a correlation, nevertheless, the activation is probably also dependent on other factors such as binding affinity or leaving group characteristics of the prodrug molecule.
All activated prodrugs, except 1 e and 1 f, showed an impaired fragmentation in the HPLC assay. The released amine 1 a could directly form an adduct with the fragmentation side product, the Michael acceptor, thereby reducing the detectable 1 a amount in the assay. This adduct formation was observed for LSD1 inhibitor prodrug Q‐PAC (Figure 1) that releases a QM as a side product.6 The nitrobenzyl prodrugs 1 b, 1 c, and 1 d release an AQM, which could also react with the released amine 1 a. Studies about the mechanism of reductive activation of the 5‐nitroimidazole containing ronidazole showed that upon reductive metabolism, ronidazole binds to the sulfhydryl group of cysteine residues with a subsequent loss of the carbamate group.60 Other nucleophiles such as water are also supposed to bind to the 4‐position of reduced 5‐nitroimidazoles to induce carbamate loss and drug release.59, 60 Therefore, the fragmentation of 5‐nitroimidazole prodrug 1 g could be significantly slower compared with the other prodrugs that rather fragment spontaneously after reduction.
In the cellular CD86‐based assay for LSD1 inhibition, only low nanomolar compound concentrations are needed for the induction of CD86‐positive THP1‐NTR+ cells. In this concentration range, all prodrugs except 1 d reach the same level of CD86‐positive THP1 cells as 1 a, here indicating a complete fragmentation of the prodrugs after enzymatic reduction. Apparently, the released inhibitor does not react with intermediates formed after prodrug reduction at these low concentrations, making it available for LSD1 inhibition. Furthermore, the different in vitro reactivity of the NTR with prodrugs is negligible for the cellular CD86‐assay due to elongated incubation time and enzyme stability. At higher prodrug concentrations, as in the cellular CFU assay, we observed impaired fragmentation, as already shown in the in vitro assay with recombinant NTR. The EC50 of the LSD1 inhibitor 1 a in the CFU assay was not reached by any prodrug in the NTR‐expressing cells, indicating that the LSD1 inhibitor 1 a is not quantitatively released under these conditions. One possibility is that the released drug is scavenged by the AQM side product, which was observed in the in vitro assay, thereby impeding the efficacy of the prodrugs in the CFU assay.
Throughout all experiments, 1 d showed no relevant fragmentation, probably because of the unfavourable destabilization of the arising benzylic cation by the CF3 group. Therefore, 1 d and in general nitroaromatics with electron‐withdrawing groups at the benzylic position could be used as negative controls to possibly obtain activated intermediates such as the nitroso and hydroxylamine that do not further fragment. With the negative controls 2 c and 2 f, derived from inactive inhibitor 2 a, it is possible to distinguish for the first time the effects from the released inhibitor and the electrophilic side product as always both molecules are present after enzymatic reduction of self‐immolative nitroaromatic prodrugs. Hulsman et al. demonstrated that, contrary to initial assumptions, the antitumour effect of the hybrid drug nitric oxide‐donating aspirin does not derive from the released NO or aspirin, but solely from the QM side product.79 This example emphasises that negative controls are important to avoid a false understanding of mechanisms, distinguishing between effects from the released drug and undesired effects from the side products. In many studies on NTR prodrugs, the effect of the formed Michael acceptor is largely neglected. Mostly potent cytotoxic agents were released so far, thereby impeding the specific evaluation of cytotoxic effects originated from the side product. As the released LSD1 inhibitor 1 a and the negative control 2 a are not cytotoxic per se, we could evaluate the effects of the released Michael acceptor of nitrobenzyl prodrugs for the first time. To our knowledge, we are the first to describe GSH depletion by the AQM formed by the fluorinated p‐nitrobenzyl prodrug moiety. We also observed GSH depletion by fragmentation products of 2‐nitroimidazole, an effect already investigated by Bérubé et al..83 From the prodrug 1 b with a p‐nitrobenzyl alcohol moiety GSH depletion and cytotoxicity was not observed. As we showed that prodrug 1 b gets activated rather slowly in vitro, compared with the fluorinated derivative 1 c or the 2‐nitroimidazole substituted prodrug 1 f, we hypothesise that the cells can counteract the slow release of the Michael acceptor without induction of apoptosis or necrosis. In addition to GSH, other cellular nucleophiles such as DNA may serve as reaction partners for the released Michael acceptor which may also contribute to cytotoxicity.
The negative controls 2 c and 2 f furthermore helped us to prove that the released LSD1 inhibitor 1 a is responsible for increased CD86 level and reduced colony formation of THP1‐NTR+ cells after prodrug treatment. In the CD86‐based assay, the negative controls were inactive at nanomolar concentrations relevant for our enzyme‐prodrug system. As the released negative control 2 a is not active on LSD1 or cytotoxic, it is possible to show the impact of the released side product of our prodrugs in the CFU assay with THP1‐NTR+ cells. The negative controls 2 c and 2 f reduced the ability of THP1‐NTR+ cells to form colonies, due to the formed cytotoxic side products, yet with reduced potency compared with prodrugs 1 c and 1 f (Figure 6). This additional colony reduction by the prodrugs is caused by the released inhibitor 1 a. The 2‐nitroimidazole prodrug 1 f showed the best selectivity window with dose‐dependent colony reduction from 100 nM–1 μM and no effect in THP1wt up to 2 μM.
The concentration‐dependent effects of negative controls 2 c and 2 f highlight the importance to use an inhibitor with a potency below the side product for such a prodrug approach. When only small amounts of released inhibitor are needed to induce the desired biologic effect, it is more likely that side products or side reactions have little biological relevance. Overall, we could identify a well‐defined concentration range (10–100 nM in the CD86‐based assay) in which only LSD1 inhibition but no cytotoxicity due to the formed side products is reached with prodrug candidates 1 b, 1 c, and 1 f. This allows the selective and specific LSD1 inhibition in NTR‐expressing THP1 cells, enabling further studies on LSD1 and its cellular effects. Our enzyme‐prodrug system can be used as a research tool to elucidate the cell‐specific or organ‐specific role of LSD1 in a heterogeneous environment. Further development for clinical applications is also possible, e. g. by using DEPT techniques to target the NTR to the desired cell‐type, tissue or organ.
Conclusion
This study has identified suitable prodrug candidates of an LSD1 inhibitor for the usage in an NTR‐based enzyme‐prodrug system that are selective for NTR expressing cells. We thereby confirmed the 2‐nitro‐N‐methyl imidazolyl group as favourable prodrug moiety. Detailed analysis of prodrug activation and fragmentation revealed the effect of released LSD1 inhibitor and the cytotoxicity of the formed Michael acceptor derived from the reduced nitroaromatic prodrug moiety. For the first time, the isolated cytotoxicity of these reactive fragments deriving from 2‐nitro‐N‐methyl imidazolyl and 2‐fluoro‐4‐nitrobenzyl moieties was shown and analysed, detecting GSH depletion as one possible mediator of events causing cytotoxicity. Even though these prodrug moieties are in widespread use, their diverse mechanisms of cytotoxicity have not been evaluated well so far, as they have mostly used in conjunction with cytotoxic drugs. Together with our negative controls for both side products (2 c and 2 f) and prodrug activation intermediates (1 d), our system can directly be used as a tool to further study the enzymatic and scaffolding function of LSD1. Possibly the nitroreductase system of prodrugs, probes and vector can also be applied to other targets. Another alternative is to test the nitroaryl prodrugs in hypoxia‐based approaches, in which nitroaromatics are reduced by human oxygen‐sensitive type II nitroreductase selectively in tumour tissue. Furthermore, our enzyme‐prodrug system can be extended by using different GDEPT approaches to target the NTR gene towards other cancer cells for intracellular activation. The most widely used transfection methods for gene therapy are viral vectors.1 The emerging variety of non‐viral targeting devices will enable the direct use of our enzyme‐prodrug system to test and establish these vehicles, such as liposomes and polymeric nanoparticles.84, 85 Both literature data86 and our studies in this manuscript with THP1 cells indicate that there is enough NADH to achieve activation intracellularly. In contrast, the dependency on the cofactor NADH may limit the use of approaches that directly target the NTR protein (e. g. as an antibody conjugate) towards the surface of cancer cells, as NADH has a very short half‐life in plasma. In this case, the addition of more stable NADH analogues, such as reduced nicotinic acid riboside, together with the targeted NTR should enable its use also for approaches that rely on extracellular delivery.87 Our luminescent NTR probe can be used as a primary and simple tool to evaluate cell‐selectivity and specificity in such new applications. Overall, these promising results encourage further application of our enzyme‐prodrug system to target LSD1 or other epigenetic or signal transduction inhibitors specifically in cancer cells where their function is aberrant, thereby minimising off‐target toxicity to non‐tumour cells.
Experimental Section
General procedures. The reactions were carried out in glassware under inert (nitrogen) atmosphere. Used reagents and solvents were purchased from commercial sources and used without further purification. Reactions were monitored by thin‐layer chromatography (TLC) performed with Merck alumina plates coated with silica gel 60 F254 (layer thickness: 0.2 mm) and analysed under UV light (254 nm) or revealed using ninhydrin as a staining agent for primary and secondary amines. Yields were not optimised. Flash column chromatography was performed on a Biotage® Isolera Prime/One purification system using pre‐packed silica gel columns (40–60 μM) from Biotage (SNAP) or Telos and the purifications were followed by TLC. NMR spectroscopy and mass spectrometry were used for product identification. 1H and 13C NMR spectral data were recorded on a Bruker Advance II+ 400 MHz spectrometer using as solvents [D6]DMSO and CDCl3. Chemical shifts (δ) are referenced to a residual solvent peak, note: st‐m=stereoisomerism‐derived multiplet. The 1H and 13C assignment of new compounds resulted from 2D experiments and was numbered according to the IUPAC system and abbreviated as follows: B=benzyl, Cy=cyclopropyl, P=phenyl, Py=pyridinyl, I=imidazolyl and T=thiophenyl. 13C signals marked with (*) are only detected in HSQC and HMBC spectra. Mass spectra were recorded on an Advion expression CMS mass spectrometer (LRMS: low‐resolution MS) and on a Thermo Scientific Exactive mass spectrometer (HRMS) using ASAP® (Atmospheric Solids Analysis Probe; aka APCI: Atmospheric Pressure Chemical Ionization) and electrospray ionization (ESI) as ion sources. GC‐MS analyses were carried out on an Agilent 6890 N Network GC system equipped with a 5973 Network Mass Selective Detector (both Agilent Technologies, Santa Clara, USA) and a DB‐5 ms column (length=30 m, diameter=0.25 mm, film=0.25 μm; Agilent Technologies). A carrier gas (helium) flow of 1 mL min−1 was used. The injection volume was 1 μL with a split ratio of 41.7 : 1 at an injector temperature of T injector=250 °C. The temperature of the ion source was T ion source=230 °C. Following temperature program (column oven) was applied: 0–3 min: 60 °C; 3–14 min: linear increase to 280 °C; 14–19 min: 280 °C. HPLC analysis was performed to determine the purity of all final compounds on an Agilent Technologies 1260 Infinity system using UV detection at 210 nm and a Phenomenex Kinetex 5u XB‐C18 100 Å 250×4.60 mm column. Eluent A was water containing 0.05 % TFA and eluent B was acetonitrile containing 0.05 % TFA. Linear gradient conditions were as follows: 0–4 min: A/B (90 : 10); 4–29 min: linear increase to 100 % of B; 29–31 min: 100 % B; 31–40 min: A/B (90 : 10). All final compounds displayed a chemical purity of >95 % at the wavelength of 210 nm. The HPLC analysis of isomer distributions were performed on an Agilent Technologies HP 1100 chromatography system equipped with a photodiode array detector measuring an UV absorbance at 210 nm. The different methods (chiral‐M1 – chiral‐M7) used are described in the Supporting Information (S2–S3). The stereochemical descriptors R and S are complemented with (*) to show their interchangeability, for example, that R*S* represents both RS and SR isomers.
General procedure for reductive amination. The procedure described by Schulz‐Fincke et al. was applied.62
trans‐N‐((2‐Methoxypyridin‐3‐yl) methyl)‐2‐phenylcyclopropan‐1‐amine (1 a): Colourless oil; yield 55 % (450 mg, 1.77 mmol). R f=0.18 (CH/EtOAc 7 : 3); 1H NMR (400 MHz, [D6]DMSO): δ=8.03 (dd, 3 J H,H=5.0 Hz, 4 J H,H=1.9 Hz, 1H), 7.67–7.62 (m, 1H), 7.24–7.18 (m, 2H), 7.13–7.07 (m, 1H), 7.01–6.97 (m, 2H), 6.93 (dd, 3 J H,H=7.2 Hz, 3 J H,H=5.0 Hz, 1H), 3.81 (s, 3H), 3.73 (s, 2H), 2.80 (br s,1H), 2.23 (ddd, 3 J cis=7.1, 3 J trans=4.1, 3 J trans=3.1 Hz, 1H), 1.81 (ddd, 3 J cis=9.1, 3 J trans=5.7, 3 J trans=3.1 Hz, 1H), 1.01 (ddd, 3 J cis=9.1, 2 J H,H=4.8, 3 J trans=4.1 Hz, 1H), 0.93 ppm (ddd, 3 J cis=7.1, 3 J trans=5.7, 2 J H,H=4.8 Hz, 1H); 13C NMR (101 MHz, [D6]DMSO): δ=161.5, 144.9, 142.9, 137.5, 128.5, 125.8, 125.5, 123.3, 117.2, 53.4, 47.0, 42.1, 25.0, 17.3 ppm; LRMS (APCI): m/z (%) 255.2 (100) [M+H]+; HPLC t R=14.096 min, 97.5 %; HPLC (chiral‐M3) t R=4.923 min (49.4 %), 5.399 min (50.6 %).
(1S*,2S*,3R*)‐N‐((2‐Methoxypyridin‐3‐yl) methyl)‐2‐methyl‐3‐phenylcyclo propan‐1‐amine (2 a): Colourless oil; yield 39 % (193 mg, 0.719 mmol). R f=0.35 (CH/EtOAc 7 : 3); 1H NMR (400 MHz, [D6]DMSO): δ=8.03 (dd, 3 J H,H=5.0 Hz, 4 J H,H=1.9 Hz, 1H), 7.65 (dd, 3 J H,H=7.3 Hz, 4 J H,H=1.9 Hz, 1H), 7.22–7.18 (m, 2H), 7.11–7.06 (m, 1H), 6.97–6.92 (m, 3H), 3.81 (s, 3H), 3.73 (m, 2H), 2.66–2.61 (br s, 1H), 2.30 (dd, 3 J cis=6.9, 3 J trans=3.4 Hz, 1H), 1.44 (dd, 3 J trans=4.9, 3 J trans=3.4 Hz, 1H), 1.24–1.14 ppm (m, 4H); 13C NMR (101 MHz, [D6]DMSO): δ=161.5, 145.0, 143.4, 137.6, 128.5, 125.7, 125.3, 123.4, 117.2, 53.4, 47.4, 46.0, 31.7, 23.8, 12.2 ppm; LRMS (APCI) m/z (100) 269.4 [M+H]+; HPLC t R=14.466 min, 95.4 %; HPLC (chiral‐M7) t R=5.922 min (49.0 %), 6.208 min (51.0 %).
General procedure for the synthesis of prodrugs 1 b–g and negative controls 2 c and 2 f: For the activation of amine 1 a or 2 a, triphosgene (0.5 equiv) was dissolved in CH2Cl2 (1 mL per 0.3 mmol) at 0 °C using an ice‐bath. The addition of pyridine (2.2 equiv) afforded a yellow suspension to which a solution of the amine (1.0 equiv) in CH2Cl2 (1 mL per 0.6 mmol) was added over 15 min. The resulting reddish solution was stirred for 20 min on ice and was then allowed to adjust to RT. After completion of the reaction, the reaction mixture was treated with 1 M HCl aq. and extracted with CH2Cl2. The combined organic layers were washed with brine, dried over Na2SO4, filtered and concentrated in vacuo to yield the carbamoyl chloride as a yellow oil. For following carbamate formation, the respective carbamoyl chloride (1 equiv) was immediately dissolved in CH2Cl2 (0.5 mL/0.1 mmol) and pyridine (1.5 equiv) was added. The corresponding alcohol (1.0 equiv) was dissolved in CH2Cl2 (0.25 mL/0.1 mmol) and treated with NaH (60 % dispersion in mineral oil, 1.0 equiv). For compounds 1 f, 1 g and 2 f, THF was additionally used as solvent. In the case that the alcohol was still present after 16 h, more NaH was added until gas development stopped. After consumption of starting material, the reaction mixture was quenched by addition of 1 M HCl aq. An appropriate amount of CH2Cl2 was added and the organic layer was washed with 1 M HCl aq. and brine (2 ×), dried over Na2SO4, filtered and evaporated. For subsequent column chromatography, the composition of the mobile phase was adjusted to the compound properties. Synthesis of prodrug 1 e differed, starting with activation of the alcohol 8 to carbonate 11 and subsequent coupling with 1 a, as described below.
4‐Nitrobenzyl((2‐methoxypyridin‐3‐yl)methyl)((1S*,2R*)‐2‐phenylcyclo propyl)carbamate (1 b): Colourless oil; yield 66 % (107 mg, 0.247 mmol). R f=0.68 (CH/EtOAc 1 : 1); 1H NMR (400 MHz, [D6]DMSO): δ=8.20–8.10 (m, 2H; B‐3 and B‐5), 8.09–8.05 (m, 1H; Py‐6), 7.61–7.42 (m, 3H; B‐2, B‐6 and Py‐4), 7.27–7.17 (m, 2H; P‐3 and P‐5), 7.17–7.11 (m, 1H; P‐4), 7.11–6.98 (m, 2H; P‐2 and P‐6), 6.98–6.91 (m, 1H; Py‐5), 5.35–5.17 (st‐m, 2H; OCH2), 4.56–4.40 (st‐m, 2H; NCH 2), 3.83 (s, 3H; CH 3), 2.92–2.73 (m, 1H; Cy‐1), 2.34–2.25 (m, 1H; Cy‐2), 1.38–1.28 (m, 1H; Cy‐3b), 1.27–1.18 ppm (m, 1H; Cy‐3a); 13C NMR (101 MHz, [D6]DMSO): δ=160.7 (Py‐2), 156.2 (C=O), 146.8 (B‐4), 145.2 (Py‐6), 144.5 (B‐1), 140.6 (P‐1), 136.4 (Py‐4), 128.1 (B‐2 and B‐6), 128.0 (P‐3 and P‐5), 125.9 (P‐2 and P‐6), 125.7 (P‐4), 123.3 (B‐3 and B‐5), 120.0 (Py‐3), 116.9 (Py‐5), 65.4 (OCH2), 53.1 (CH3), 45.8 (NCH2), 40.1* (Cy‐1), 25.9 (Cy‐2), 16.4 ppm (Cy‐3); LRMS (ESI) m/z (%) 434.1 (43) [M+H]+, 456.1 (100) [M+Na]+; HRMS (ESI): m/z calcd for C24H24O5N3 +: 434.1710 [M+H]+; found: 434.1715; HPLC t R=26.282 min, 97.3 %; HPLC (chiral‐M3) t R=15.352 min (49.7 %), 16.283 min (50.3 %).
2‐Fluoro‐4‐nitrobenzyl((2‐methoxypyridin‐3‐yl)methyl)((1S*,2R*)‐2‐phenylcyclopropyl) carbamate (1 c): Colourless oil; yield 43 % (32 mg, 0.071 mmol). R f=0.39 (CH/EtOAc 7 : 3); 1H NMR (400 MHz, [D6]DMSO): δ=8.11 (dd, 3 J H,H=9.9 Hz, 4 J H,H=2.1 Hz, 1H; B‐5), 8.07 (dd, 3 J H,H=5.0 Hz, 4 J H,H=1.6 Hz, 1H; Py‐6), 8.05–7.95 (m, 1H; B‐3), 7.65–7.57 (m, 1H; B‐6), 7.55–7.45 (m, 1H; Py‐4), 7.30–7.12 (m, 3H; P‐3, P‐4 and P‐5), 7.12–6.91 (m, 3H; P‐2, P‐6 and Py‐5), 5.33–5.20 (st‐m, 2H; OCH2), 4.54–4.38 (st‐m, 2H; NCH 2), 3.82 (s, 3H; CH 3), 2.84–2.71 (m, 1H; Cy‐1), 2.26 (ddd, 3 J cis=9.8, 3 J trans=6.5, 3 J trans=3.3 Hz, 1H; Cy‐2), 1.38–1.29 (m, 1H; Cy‐3b), 1.26–1.17 ppm (m, 1H; Cy‐3a); 13C NMR (101 MHz, [D6]DMSO): δ=161.2 (Py‐2), 159.7 (d, 1 J C,F=250.6 Hz; B‐2), 156.6 (C=O), 148.5 (d, 3 J C,F=9.1 Hz; B‐4), 145.7 (Py‐6), 140.9 (P‐1), 136.9 (Py‐4), 131.9 (d, 2 J C,F=14.7 Hz; B‐1), 131.2 (d, 3 J C,F=4.5 Hz; B‐6), 128.5 (P‐3 and P‐5), 126.3 (P‐2 and P‐6), 126.1 (P‐4), 120.4 (Py‐3), 119.9 (d, 4 J C,F=3.4 Hz; B‐5), 117.4 (Py‐5), 111.6 (d, 2 J C,F=26.6 Hz; B‐3), 60.7 (OCH2), 53.5 (CH3), 46.3 (NCH2), 39.6* (Cy‐1), 26.5 (Cy‐2), 16.7 ppm (Cy‐3); 19F NMR (376 MHz, [D6]DMSO): δ=−114.03–−114.13 ppm (m); LRMS (APCI): m/z 452.2 (100) [M+H]+; HRMS (APCI): m/z calcd for C24H23O5N3F+: 452.1616 [M+H]+; found: 452.1617; HPLC t R=26.375 min, 97.8 %; HPLC (chiral‐M3) t R=15.612 min (48.7 %), 16.491 min (51.3 %).
2,2,2‐Trifluoro‐1‐(4‐nitrophenyl)ethyl((2‐methoxypyridin‐3‐yl)methyl) ((1S*,2R*)‐2‐phenyl cyclopropyl) carbamate (1 d): Yellowish oil; yield 48 % (61 mg, 0.122 mmol). R f=0.46 (CH/EtOAc 7 : 3); 1H NMR (400 MHz, [D6]DMSO, 50 °C): δ=8.26 (d, 3 J H,H=8.8 Hz, 1H; B‐3 or B‐5), 8.20 (d, 3 J H,H=8.6 Hz, 1H; B‐3 or B‐5), 8.08 (d, 3 J H,H=4.9 Hz, 1H; Py‐6), 7.78–7.74 (m, 1H; B‐2 or B‐6), 7.68 (d, 3 J H,H=8.6 Hz, 1H; B2 or B‐6), 7.49–7.47 (m, 1H; Py‐4), 7.35–7.23 (m, 2H; P‐3 and P‐5), 7.23–7.15 (m, 1H; P‐4), 7.15–7.08 (m, 2H; P‐2 and P‐6), 6.95–6.90 (m, 1H; Py‐5), 6.62–6.56 (st‐m, 1H; CHCF3), 4.71–4.38 (st‐m, 2H; NCH 2), 3.83–3.77 (st‐m, 3H; CH 3), 2.97–2.84 (m, 1H; Cy‐1), 2.40–2.24 (m, 1H; Cy‐2), 1.44–1.37 (m, 1H; Cy‐3b), 1.36–1.17 ppm (m, 1H; Cy‐3a); 13C NMR (101 MHz, [D6]DMSO, 50 °C): δ=160.7 (Py‐2), 153.8 (C=O), 148.2 (B‐4), 145.4 (Py‐6), 140.1 (st‐m; P‐1), 138.2–138.1 (st‐m; B‐1), 136.8–136.7 (st‐m; Py‐4), 129.0 (B‐2 and B‐6), 127.9 (P‐3 and P‐5), 125.8 (P‐2 and P‐6), 125.7 (P‐4), 123.4 (B‐3 or B‐5), 123.3 (B‐3 or B‐5), 122.8 (q, 1 J C,F=280 Hz; CF3), 119.3 (Py‐3), 116.7 (Py‐5), 71.8–70.8 (m; CHCF3), 52.8 (CH3), 46.1 (NCH2), 39.1 (Cy‐1), 28.8 (Cy‐3), 25.2 ppm (Cy‐2); 19F NMR (376 MHz, [D6]DMSO): δ=−74.66–−75.06 ppm (m); LRMS (APCI) m/z (%) 502.2 (100) [M+H]+; HRMS (ESI): m/z calcd for C25H23O5N3F3 +: 502.1584 [M+H]+; found: 502.1581; HPLC t R=28.260 min, 97.7 %; HPLC (chiral‐M2) t R=11.562 min (7.5 %), 12.804 min (7.6 %), 15.002 min (22.6 %), 16.410 min (62.4 %).
(5‐Nitrothiophen‐2‐yl)methyl((2‐methoxypyridin‐3‐yl)methyl)((1S*,2R*)‐2‐phenylcyclo propyl) carbamate (1 e): Carbonate 11 (78 mg, 0.241 mmol, 1.5 equiv) was dissolved in DMF (0.5 mL) and added dropwise to a solution of amine 1 a (41 mg, 0.160 mmol, 1.0 equiv) and DIPEA (41 μL, 0.241 mmol, 1.5 equiv) in DMF (1.0 mL). The colour of the solution turned from yellow to green. After 17 h, the reaction mixture was diluted with EtOAc (15 mL) and washed with brine (3×10 mL). The organic layer was dried over Na2SO4, filtered and concentrated in vacuo. Purification via column chromatography (10 to 30 % EtOAc in CH over 10 CV on a biotage system, followed by a manual column using CH/THF 9 : 2) afforded 1 e as an orange oil; yield 47 % (33 mg, 0.075 mmol). R f=0.17 (CH/THF 9 : 2); 1H NMR (500 MHz, [D6]DMSO, 70 °C): δ=8.04 (dd, 3 J H,H=5.0 Hz, 4 J H,H=1.8 Hz, 1H; Py‐6), 7.95 (d, 3 J H,H=4.2 Hz, 1H; T‐4), 7.48 (dd, 3 J H,H=7.2 Hz, 4 J H,H=1.8 Hz, 1H; Py‐4), 7.22–7.17 (m, 3H; P‐3, P‐5 and T‐3), 7.14–7.10 (m, 1H; P‐4), 7.06–7.03 (m, 2H; P‐2 and P‐6), 6.90 (dd, 3 J H,H=7.2, 3 J H,H=5.0 Hz, 1H; Py‐5), 5.35–5.29 (st‐m, 2H; OCH2), 4.51 (d, 2 J H,H=16.5 Hz, 1H; NCH aHb), 4.43 (d, 2 J H,H=16.5 Hz, 1H; NCHa Hb), 3.83 (s, 3H; CH 3), 2.74 (ddd, 3 J cis=7.5, 3 J trans=4.4, 3 J trans=3.5 Hz, 1H; Cy‐1), 2.24 (ddd, 3 J cis=9.8, 3 J trans=6.5, 3 J trans=3.5 Hz, 1H; Cy‐2), 1.32 (ddd, 3 J cis=9.8, 2 J H,H=6.0, 3 J trans=4.4 Hz, 1H; Cy‐3b), 1.20 ppm (ddd, 3 J cis=7.5, 3 J trans=6.5, 2 J H,H=6.0 Hz, 1H; Cy‐3a); 13C NMR (126 MHz, [D6]DMSO, 70 °C): δ=160.6 (Py‐2), 155.6 (C=O), 150.6 (T‐5), 147.6 (T‐2), 145.0 (Py‐6), 140.1 (P‐1), 136.4 (Py‐4), 128.9 (T‐4), 127.7 (P‐3 and P‐5), 126.8 (T‐3), 125.8 (P‐2 and P‐6), 125.4 (P‐4), 119.6 (Py‐3), 116.5 (Py‐5), 61.1 (OCH2), 52.6 (CH3), 45.6 (NCH2), 38.8 (Cy‐1), 25.3 (Cy‐2), 15.9 ppm (Cy‐3); LRMS (APCI): m/z (%) 440.1 (100) [M+H]+; HRMS (ESI): m/z calcd for C22H22O5N3S+: 440.1275 [M+H]+; found: 440.1272; HPLC t R=25.816 min, 98.4 %; HPLC (chiral‐M5) t R=9.538 min (49.7 %), 10.544 (50.3 %).
(1‐Methyl‐2‐nitro‐1H‐imidazol‐5‐yl)methyl((2‐methoxypyridin‐3‐yl)methyl) ((1S*,2R*)‐2‐phenylcyclopropyl)carbamate (1 f): Yellowish solid; yield 50 % (83 mg, 0.190 mmol). R f=0.42 (CH/EtOAc 3 : 7); 1H NMR (400 MHz, [D6]DMSO, 50 °C): δ=8.06 (dd, 3 J H,H=4.9 Hz, 4 J H,H=1.6 Hz, 1H; Py‐6), 7.51–7.46 (m, 1H; Py‐4), 7.23 (s, 1H; I‐4), 7.18–7.08 (m, 3H; P‐3, P‐4 and P‐5), 7.00–6.89 (m, 3H; P‐2, P‐6 and Py‐5), 5.26 (d, 2 J H,H=13.0 Hz, 1H; OCHaHb), 5.16 (d, 2 J H,H=13.0 Hz, 1H; OCHa Hb), 4.50 (d, 2 J H,H=16.5 Hz, 1H; NCH aHb), 4.40 (d, 2 J H,H=16.5 Hz, 1H; NCHa Hb), 3.85 (s, 3H; OCH 3), 3.65 (s, 1H; NCH3), 2.73 (ddd, 3 J cis=7.6, 3 J trans=4.5, 3 J trans=3.5 Hz, 1H; Cy‐1), 2.21 (ddd, 3 J cis=9.9, 3 J trans=5.9, 3 J trans=3.5 Hz, 1H; Cy‐2), 1.31 (ddd, 3 J cis=9.9, 2 J H,H=5.9, 3 J trans=4.5 Hz, 1H; Cy‐3b), 1.22–1.17 ppm (m, 1H; Cy‐3a); 13C NMR (101 MHz, [D6]DMSO, 50 °C): δ=161.3 (Py‐2), 156.3 (C=O), 146.5 (I‐2), 145.7 (Py‐6), 140.9 (P‐1), 137.0 (Py‐4), 133.7 (I‐5), 129.0 (I‐4), 128.3 (P‐3 and P‐5), 126.2 (P‐2 and P‐6), 126.1 (P4), 120.5 (Py‐3), 117.3 (Py‐5), 56.6 (OCH2), 53.5 (OCH3), 46.3 (NCH2), 39.7* (Cy‐1), 34.2 (NCH3), 26.4 (Cy‐2), 16.3 ppm (Cy‐3); LRMS (APCI): m/z (%) 438.3 (100) [M+H]+; HRMS (ESI): m/z calcd for C22H24O5N5 +: 438.1772 [M+H]+; found: 438.1769; HPLC t R=22.003 min, 96.5 %; HPLC (chiral‐M6) t R=14.767 min (50.3 %), 18.637 min (49.7 %).
(1‐Methyl‐5‐nitro‐1H‐imidazol‐2‐yl)methyl((2‐methoxypyridin‐3‐yl)methyl) ((1S*,2R*)‐2‐phenylcyclopropyl)carbamate (1 g): Reddish oil; yield 52 % (55 mg, 0.125 mmol). R f=0.44 (CH/EtOAc 3 : 7); 1H NMR (400 MHz, [D6]DMSO): δ=8.10–8.05 (m, 1H; Py‐6), 7.58–7.49 (m, 1H; Py‐4), 7.26–7.02 (m, 4H; I‐4, P‐3, P‐4 and P‐5), 7.00–6.82 (m, 3H; P‐2, P‐6 and Py‐5), 5.26 (d, 2 J H,H=13.3 Hz, 1H; OCHaHb), 5.18 (d, 2 J H,H=13.3 Hz, 1H; OCHa Hb), 4.49 (d, 2 J H,H =16.5 Hz, 1H; NCH aHb), 4.38 (d, 2 J H,H=16.5 Hz, 1H; NCHa Hb), 3.84 (s, 3H; OCH 3), 3.60 (s, 3H; NCH3), 2.74–2.70 (m, 1H; Cy‐1), 2.21 (ddd, 3 J cis=10.1, 3 J trans=6.1, 3 J trans=3.4 Hz, 1H; Cy‐2), 1.31 (ddd, 3 J cis=10.1, 2 J H,H=5.8, 3 J trans=4.8 Hz, 1H; Cy‐3b), 1.24–1.17 ppm (m, 1H; Cy‐3a); 13C NMR (101 MHz, [D6]DMSO): δ=161.1 (Py‐2), 156.4 (C=O), 148.1 (I‐5), 145.6 (Py‐6), 140.9 (P‐1), 139.8 (I‐2), 136.9 (Py‐4), 132.1 (I‐4), 128.2 (P‐3 and P‐5), 126.1 (P‐2, P‐4 and P‐6), 120.4 (Py‐3), 117.4 (Py‐5), 59.4 (OCH2), 53.6 (OCH3), 46.3 (NCH2), 39.7* (Cy‐1), 33.6 (NCH3), 26.9 (Cy‐2), 16.1 ppm (Cy‐3); LRMS (APCI): m/z (%) 438.2 (100) [M+H]+; HRMS (ESI): m/z calcd for C22H24O5N5 +: 438.1772 [M+H]+; found: 438.1770; HPLC t R=22.338 min, 98.1 %; HPLC (chiral‐M1) t R=20.942 min (49.8 %), 21.680 min (50.2 %).
2‐Fluoro‐4‐nitrobenzyl((2‐methoxypyridin‐3‐yl)methyl)((1S*,2S*,3R*)‐2‐methyl‐3‐phenylcyclo propyl)carbamate (2 c): Colourless oil; yield 41 % (62 mg, 0.133 mmol). R f=0.47 (CH/EtOAc 7 : 3); 1H NMR (400 MHz, [D6]DMSO) δ=8.19–8.07 (m, 2H; B‐3 and B‐5), 8.01 (dd, 3 J H,H=5.0 Hz, 4 J H,H=1.9 Hz, 1H; Py‐6), 7.82–7.67 (m, 1H; B‐6), 7.57–7.46 (m, 1H; Py‐4), 7.21–7.14 (m, 2H; P‐3 and P‐5), 7.13–7.07 (m, 1H; P‐4), 7.01–6.91 (m, 2H; P‐2 and P‐6), 6.90–6.83 (m, 1H; Py‐5), 5.37–5.18 (m, 2H; OCH 2), 4.61 (d, 2 J H,H=16.0 Hz, 1H; NCHaHb), 4.41 (d, 2 J H,H=16.0 Hz, 1H; NCHa Hb), 3.71 (s, 3H; OCH 3), 2.85–2.80 (m, 1H; Cy‐1), 1.94 (dd, 3 J trans=6.1, 3 J trans=4.0 Hz, 1H; Cy‐3), 1.53–1.44 (m, 1H; Cy‐2), 1.13 ppm (d, 3 J H,H=6.1 Hz, 3H; CH 3); 13C NMR (101 MHz, [D6]DMSO): δ=161.4 (Py‐2), 159.8 (d, 1 J C,F=251.0 Hz; B‐2), 156.8* (C=O), 148.5 (d, 3 J C,F=9.1 Hz; B‐4), 145.8 (Py‐6), 141.2 (P‐1), 137.9 (Py‐4), 131.9 (d, 2 J C,F=14.5 Hz; B‐1), 131.3 (d, 3 J C,F=4.5 Hz; B‐6), 128.5 (P‐3 and P‐5), 126.2 (P‐2 and P‐6), 126.0 (P‐4), 120.1 (Py‐3 and B‐5), 117.2 (Py‐5), 111.6 (d, 2 J C,F=27.2 Hz; B‐3), 60.7 (OCH2), 53.5 (OCH3), 46.9 (NCH2), 43.9* (Cy‐1), 30.8 (Cy‐3), 24.9 (Cy‐2), 13.1 ppm (CHCH3); 19F NMR (376 MHz, [D6]DMSO): δ=−113.95–−114.03 ppm (m); LRMS (APCI): m/z (%) 466.6 (100) [M+H]+; HRMS (ESI): m/z calcd for C25H25O5N3F+: 466.1773 [M+H]+; found: 466.1770; HPLC t R=27.298 min, 96.5 %. HPLC (chiral‐M3) t R=10.729 min (49.5 %), 11.379 min (50.5 %).
(1‐Methyl‐2‐nitro‐1H‐imidazol‐5‐yl)methyl((2‐methoxypyridin‐3‐yl)methyl) ((1S*,2S*,3R*)‐2‐methyl‐3‐phenylcyclopropyl)carbamate (2 f): Yellowish foam; yield 50 % (74 mg, 0.164 mmol). R f=0.62 (CH/EtOAc 3 : 7); 1H NMR (400 MHz, [D6]DMSO): δ=8.05–7.98 (m, 1H; Py‐6), 7.60–7.38 (m, 1H; Py‐4), 7.34–7.23 (m, 1H; I‐4), 7.21–7.05 (m, 3H; P‐3, P‐4 and P‐5), 6.97–6.79 (m, 3H; P‐2, P‐6 and Py‐5), 5.31–5.19 (st‐m, 2H; OCH 2), 4.55 (d, 2 J H,H=16.0 Hz, 1H; NCHaHb), 4.42 (d, 2 J H,H=16.0 Hz, 1H; NCHa Hb), 3.81–3.68 (m, 6H; OCH 3 and NCH 3), 2.78 (dd, 3 J cis=7.3, 3 J trans=4.0 Hz, 1H; Cy‐1), 1.96–1.87 (m, 1H; Cy‐3), 1.52–1.41 (m, 1H; Cy‐2), 1.18–1.09 (m, 3H; CH 3); 13C NMR (101 MHz, [D6]DMSO): δ=161.3 (Py‐2), 156.8 (C=O), 146.4 (I‐2), 145.8 (Py‐6), 141.3 (P‐1), 137.8 (Py‐4), 133.8 (I‐5), 129.0 (I‐4), 128.4 (P‐3 and P‐5), 126.1 (P‐2 and P‐6), 126.0 (P‐4), 120.1 (Py‐3), 117.2 (Py‐5), 56.5 (OCH2), 53.5 (OCH3), 47.0 (NCH2), 44.0 (Cy‐1), 34.4 (NCH3), 31.3 (Cy‐3), 24.7 (Cy‐2), 13.2 ppm (CHCH3); LRMS (APCI): m/z (%) 452.6 (100) [M+H]+; HRMS (ESI) m/z calcd for C23H26O5N5 +: 452.1928 [M+H]+; found: 452.1927; HPLC t R=22.894 min, 98.2 %; HPLC (chiral‐M4) t R=10.423 min (50.0 %), 13.395 min (50.0 %).
Synthesis of fluorophore 3: (9H‐fluoren‐9‐yl)methyl ((2‐methoxypyridin‐3‐yl)methyl)((1S*,2R*)‐2‐phenylcyclopropyl) carbamate: Amine 1 a (86 mg, 0.34 mmol, 1.0 equiv) was dissolved in acetonitrile (6 mL) and 5 % NaHCO3 aq. (2 mL). Fmoc chloride (86 mg, 0.34 mmol, 1.0 equiv) was added and the solution was stirred for 1 h at RT. Acetonitrile was removed under reduced pressure and the aqueous layer was extracted with EtOAc. The organic layer was washed with brine, dried over Na2SO4, filtered and purified via silica chromatography (10 % to 15 % EtOAc in CH over 10 CV) to afford 3 as a colourless solid; yield 89.4 % (144 mg, 0.30 mmol). R f=0.49 (CH/EtOAc 7 : 3); 1H NMR (400 MHz, [D6]DMSO): δ=8.04 (dd, 3 J H,H=5.0, 4 J H,H=1.9 Hz, 1H; Py‐6), 7.88–7.81 (m, 2H; Fmoc−H‐2 and H‐7), 7.68–7.43 (m, 2H; Fmoc−H‐3 and H‐6), 7.43–7.32 (m, 2H; Fmoc−H‐1 and H‐8), 7.29–7.15 (5H, m, P‐3, P‐5, Py‐4, Fmoc−H‐4 and H‐5), 7.15–6.94 (3H, m, P‐2, P‐4 and P‐6), 6.93–6.84 (m, 1H; Py‐5), 4.62–4.40 (m, 2H; OCH 2), 4.40–4.25 (m, 2H; NCH 2), 4.25–4.18 (m, 1H; Fmoc−H‐9), 3.78 (s, 3H; OCH 3), 2.70–2.64 (m, 1H; Cy‐1), 2.21–2.15 (m, 1H; Cy‐2), 1.28–0.96 ppm (m, 2H; Cy‐3); 13C NMR (101 MHz, [D6]DMSO): δ=161.0 (Py‐2), 156.8 (C=O), 145.5 (Py‐6), 144.3 (Fmoc−C‐8a or C‐9a), 144.1 (Fmoc−C‐8a or C‐9a), 141.23 (Fmoc−C‐4a or C‐4b), 141.16 (Fmoc−C‐4a or C‐4b), 141.1 (P‐1), 136.5 (Py‐4), 128.6 (P‐3 and P‐5), 128.0 (Fmoc−C‐1 or C‐8), 127.9 (Fmoc−C‐1 or C‐8), 127.43 (Fmoc−C‐4 or C‐5), 127.37 (Fmoc−C‐4 or C‐5), 126.2 (P‐2, P‐4 and P‐6), 125.3 (Fmoc−C‐3 and C‐6), 120.6 (Py‐3), 120.45 (Fmoc−C‐2 or C‐7), 120.40 (Fmoc−C‐2 or C‐7), 117.4 (Py‐5), 67.1 (OCH2), 53.5 (OCH3), 47.2 (Fmoc−C9), 46.0 (NCH2), 39.1* (Cy‐3), 26.7 (Cy‐1), 25.5 ppm (Cy‐1); LRMS (APCI): m/z (%) 477.2 (100) [M+H]+; HRMS (ESI): m/z calcd for C31H29N2O3 +: 477.2173 [M+H]+; found: 477.2177; HPLC t R=29.668 min, 99.6 %; HPLC (M‐FLD) t R=11.990 min, 100 %.
Synthesis of luminescent probes 4 and 5: Probe 4 was synthesised using standard Mitsunobu conditions as described and synthesis of probe 5 was performed following the procedures adopted from Mustafa et al..73
6‐((5‐Nitrothiophen‐2‐yl)methoxy)benzo[d]thiazole‐2‐carbonitrile (4): 2‐Cyano‐6‐hydroxybenzothiazole (107 mg, 0.608 mmol, 1.0 equiv), alcohol 8 (101 mg, 0.638 mmol, 1.05 equiv) and PPh3 (167 mg, 0.638 mmol, 1.05 equiv) were dissolved in dry DMF (200 μL) in a sonication bath. During sonication, DIAD (125 μL, 0.638 mmol, 1.05 equiv) was added dropwise over 3 min. After 15 min sonication, the red suspension was dissolved with cyclohexane (500 μL) and directly loaded on a silica column. After purification via silica chromatography (15 % to 50 % EtOAc in CH over 10 CV), the product‐containing fractions were concentrated in vacuo. Crystallization from EtOAc/MeOH/CH (1 : 1 : 1) afforded a brown solid; yield 2.7 % (5.22 mg, 0.016 mmol). R f=0.62 (CH/EtOAc 1 : 1); 1H NMR (400 MHz, [D6]DMSO) δ 8.21 (d, 3 J H,H=9.1 Hz, 1H; H‐4), 8.10 (d, 3 J H,H=4.1 Hz, 1H; T‐4), 8.04 (d, 4 J H,H=2.6 Hz, 1H; H‐7), 7.45 (dd, 3 J H,H=9.1, 4 J H,H=2.6 Hz, 1H; H‐5), 7.39 (d, 3 J H,H=4.1 Hz, 1H; T‐3), 5.55 ppm (s, 2H; OCH2); 13C NMR (101 MHz, [D6]DMSO): δ=158.3 (C‐6 or T‐5), 151.2 (C‐6 or T−C‐5), 148.2 (C‐3a), 147.1 (T‐2), 137.8 (C‐2), 134.9 (C‐7a), 130.2 (T‐4), 127.8 (T‐3), 126.0 (C‐4), 119.1 (C‐5), 113.9 (CN), 106.6 (C‐7), 65.4 ppm (OCH2) ; LRMS (APCI): m/z (%) 318.0 (100) [M+H]+ ; HRMS (ESI): m/z calcd for C13H7O3N3S2+Cl−: 351.9623 [M+Cl]−; found: 351.9619; calcd for C13H6O3N3S2 −: 315.9856 [M−H]−; found: 315.9852; HPLC t R=24.385 min, 97.3 %.
2‐Cyanobenzo[d]thiazol‐6‐yl ((5‐nitrothiophen‐2‐yl)methyl) ethane‐1,2‐diylbis(methyl carbamate) (5): Boc‐protected 12 (178 mg, 0.456 mmol, 1.0 equiv) was dissolved in CH2Cl2 (1 mL), cooled in an ice bath and treated with thioanisol (269 μL, 2.28 mmol, 5.0 equiv), previously diluted with CH2Cl2 (1 mL). TFA (873 μL, 11.4 mmol, 25 equiv) was added dropwise over 5 min while stirred on ice. After 20 min, the ice bath was removed and the slightly yellow mixture was stirred for additional 2 h. The excess TFA was removed by co‐evaporation with toluene to yield an orange oil as twofold TFA salt (242 mg, 0.468 mmol, 103 %) that was used directly for the coupling with 11. Therefore, 11 (443 mg, 1.37 mmol, 3.0 equiv) was dissolved in THF (2 mL), cooled on an ice bath and treated with DIPEA (170 μL, 1.00 mmol, 2.2 equiv). The previously deprotected amine was dissolved in THF (2 mL) and added dropwise to the activated alcohol. After 15 min, the ice bath was removed and the orange solution was stirred for 21 h at RT. The THF was evaporated and the crude was purified by silica chromatography (20 % to 65 % EtOAc in CH over 10 CV) to afford a yellow oil that was further purified by semi‐preparative HPLC (column: Phenomenex Synergi 10u Hydro‐RP 80 Å 250×15.00 mm; flow rate: 2.5 mL/min; eluent A was water containing 0.05 % TFA and eluent B was acetonitrile containing 0.05 % TFA; Linear gradient conditions were as follows: 0–4 min: A/B (30 : 70); 4–29 min: linear increase to 90 % of B; 29–31 min: 90 % B; 31–40 min: A/B (30 : 70)) to yield a colourless oil; yield 1 % (1.5 mg, 0.003 mmol). R f=0.15 (CH/EtOAc 1 : 1); 1H NMR (400 MHz, [D6]DMSO): δ=8.25–8.16 (m, 1H; H‐4), 8.07–7.99 (m, 1H; H‐7), 7.97–7.82 (m, 1H; T‐4), 7.40–7.31 (m, 1H; H‐5), 7.29–7.18 (m, 1H; T‐3), 5.32–5.25 (st‐m, 2H; OCH2), 3.66–3.47 (m, 4H; (CH2)2), 3.11–2.90 ppm (m, 6H; NCH3); 13C NMR (101 MHz, [D6]DMSO): δ=155.8* (CH2OC=O), 153.9* (P−OC=O), 151.1 (C‐6), 150.8* (T‐5), 149.1* (C‐3a), 148.9 (T‐2), 137.0 (C‐2), 136.1 (C‐7a), 129.5–129.3 (st‐m; T‐4), 127.8–127.5 (st‐m; T‐3), 124.9 (C‐4), 123.3 (C‐5), 115.7–115.4 (st‐m; C‐7), 113.3 (CN), 61.1 (OCH2), 46.7–45.8 (st‐m; CH2 CH2), 34.7 (NCH3), 34.6 ppm (NCH3); LRMS (APCI): m/z (%) 115.2 (100) [N(CH3)CH2CH2N(CH3)C=O+H]+, 476.4 (50) [M+H]+; HRMS (ESI): m/z calcd for C19H18N5O6S2 +: 476.0693 [M+H]+; found: 476.0690; HPLC t R=22.239 min, 97.4 %.
Synthesis of nitroaromatic alcohols: For the synthesis of alcohols 6–8, the corresponding acid or aldehyde was reduced as described below. 7 was prepared according to patent literature.64 A five‐step synthesis scheme for 9 has been previously described by O'Connor et al. that was slightly modified as described in the supplemental (Scheme S1).65 Alcohol 10 was synthesised by microwave‐assisted addition of paraformaldehyde to 1‐methyl‐5‐nitroimidazole.
(2‐Fluoro‐4‐nitrophenyl)methanol (6): 2‐Fluoro‐4‐nitrobenzoic acid (592 mg, 3.20 mmol, 1.0 equiv) was dissolved in THF and PyBOP (1.83 g, 3.52 mmol, 1.1 equiv) and DIPEA (653 μL, 3.84 mmol, 1.2 equiv) were added to form an active ester. The resulting yellow solution was stirred 1 h at RT and then NaBH4 (133 mg, 3.52 mmol, 1.1 equiv) was added. The yellow colour disappeared and after 23 h, the solution was concentrated in vacuo. The residue was dissolved in EtOAc (40 mL) and treated with 1 M HCl aq. (20 mL). After 15 min of sonication, the organic layer was washed with 1 M HCl aq. (2×15 mL), sat. NaHCO3 aq. (2×15 mL), and brine (10 mL), dried over Na2SO4, filtered and evaporated yielding the alcohol as a white solid; yield 75 % (408 mg, 2.39 mmol). R f=0.28 (CH/EtOAc 7 : 3); 1H NMR (400 MHz, [D6]DMSO): δ=8.12 (ddd, 3 J H,H=8.5, 4 J H,H=2.2, 5 J H,H=0.6 Hz, 1H), 8.06 (dd, 3 J H,H=10.0, 4 J H,H=2.2 Hz, 1H), 7.79–7.73 (m, 1H), 5.62 (t, 3 J H,H=5.7 Hz, 1H), 4.66 ppm (d, 3 J H,H=5.7 Hz, 2H); 13C NMR (101 MHz, [D6]DMSO): δ=159.0 (d, 1 J C,F=249 Hz), 147.6 (d, 3 J C,F=9.02 Hz), 137.9 (d, 2 J C,F=15.4 Hz), 129.7 (d, 3 J C,F=5.54 Hz), 120.0 (d, 4 J C,F=3.07 Hz), 110.9 (d, 2 J C,F=27.0 Hz), 56.9 ppm (d, 3 J C,F=3.87 Hz); 19F NMR (376 MHz, [D6]DMSO): δ=−116.02–−116.09 ppm (m); GC‐MS: t R=9.716 min; m/z (%) 125 (100) [M−NO2], 171 (50) [M].
2,2,2‐Trifluoro‐1‐(4‐nitrophenyl)ethan‐1‐ol (7): Yellow solid; yield 94 % (1.35 g, 6.10 mmol). R f=0.38 (CH/EtOAc 7 : 3); 1H NMR (400 MHz, [D6]DMSO): δ=8.38–8.21 (m, 2H), 7.80 (d, 3 J H,H=8.7 Hz, 2H), 7.21 (d, 3 J H,H=5.7 Hz, 1H), 5.51–5.39 ppm (m, 1H); 13C NMR (101 MHz, [D6]DMSO): δ=148.6, 140.3, 128.4, 125.0, 123.6, 122.2, 71.8 ppm (q, 1 J C,F=32.4 Hz); 19F NMR (376 MHz, [D6]DMSO): δ=−76.55 ppm (d, 3 J H,F=7.9 Hz); GC‐MS: t R=9.712 min; m/z (%) 152 (100) [M−CF3], 221 (15) [M].
(5‐Nitrothiophen‐2‐yl)methanol (8): To an ice‐cold solution of 5‐nitrothiophene‐2‐carboxaldehyde (1.41 g, 8.96 mmol, 1.0 equiv) in 1,2‐dichloroethane (15 mL) was added sodium triacetoxyborohydride (2.28 g, 10.8 mmol, 1.2 equiv). After 20 min, the ice bath was removed and after 2.5 h stirring at RT, additional sodium triacetoxyborohydride (980 mg, 4.62 mmol, 0.5 equiv) was added. To drive the reaction to completion, NaBH4 (150 mg, 3.97 mmol, 0.44 equiv) was added after 20 h and the suspension was stirred for 30 min. To quench the reaction, 5 % NaHCO3 aq. (20 mL) was added to the reaction mixture cooled in an ice bath. The mixture was extracted with CH2Cl2 (3×15 mL), the organic layers were combined, washed with brine, dried over Na2SO4, filtered and concentrated to afford a brown oil that was used without further purification; yield 96 % (1.37 g, 8.64 mmol). R f=0.42 (CH/EtOAc 1 : 1); 1H NMR (400 MHz, [D6]DMSO): δ=8.03 (d, 3 J H,H=4.2 Hz, 1H), 7.08 (dt, 3 J H,H=4.2 Hz, 4 J H,H=1.1 Hz, 1H), 6.04 (t, 3 J H,H=5.8 Hz, 1H), 4.73 ppm (dd, 3 J H,H=5.8 Hz, 4 J H,H=1.1 Hz, 2H). 13C NMR (101 MHz, [D6]DMSO): δ=158.4, 149.4, 130.6, 123.6, 59.1 ppm; GC‐MS: t R=10.344 min; m/z (%) 113 (100) [M−NO2], 159 (67) [M].
(1‐Methyl‐2‐nitro‐1H‐imidazol‐5‐yl)methanol (9): Yellowish solid; yield 24 % (64 mg, 0.41 mmol) over five steps. R f=0.50 (CH2Cl2/MeOH 9 : 1); 1H NMR (400 MHz, [D6]DMSO): δ=7.12 (d, 4 J H,H=0.6 Hz, 1H), 5.50 (t, 3 J H,H=5.4 Hz, 1H), 4.55 (dd, 3 J H,H=5.4, 4 J H,H=0.6 Hz, 2H), 3.92 ppm (s, 3H); GC‐MS: t R=10.978 min; m/z (%) 157 (100) [M].
(1‐Methyl‐5‐nitro‐1H‐imidazol‐2‐yl)methanol (10): Paraformaldehyde (134 mg, 4.46 mmol, 2.0 equiv) was suspended in H2O (2.0 mL) and 1‐methyl‐5‐nitroimidazole (283 mg, 2.23 mmol, 1.0 equiv) was added to the microwave glass tube. The reaction was performed in a CEM Discover Microwave (2.5 h, 30 W, 130 °C, followed by 4 h, 60 W, 140 °C). Further addition of paraformaldehyde (1.7 equiv. and 2.7 equiv) and subsequent microwave reaction (each time 2.6 h, 60 W, 140 °C) resulted in the formation of the product. The reaction mixture was concentrated in vacuo and purified by column chromatography (3 to 6 % MeOH in CH2Cl2 over 10 CV) to afford a white solid; yield 13 % (45 mg, 0.29 mmol). R f=0.26 (CH2Cl2/MeOH 95 : 5); 1H NMR (400 MHz, [D6]DMSO): δ=8.02 (s, 1H), 5.69 (t, 3 J H,H=5.3 Hz, 1H), 4.57 (d, 3 J H,H=5.3 Hz, 2H), 3.91 ppm (s, 3H); 13C NMR (101 MHz, [D6]DMSO): δ=152.3, 139.2, 131.5, 56.0, 33.3 ppm; GC‐MS t R=10.200 min; m/z (%) 157 (100) [M].
PAINS analysis: Prodrugs 1 b–g and negative controls 2 c and 2 f were tested for known classes of assay interference compounds with the publicly available online tool “False Positive Remover” (www.cbligand.org/PAINS/login.php).88 None of the tested compounds were flagged as PAINS.
Biological evaluation
Peroxidase based LSD1 assay: Determination of enzyme activity and inhibition was performed in an established HRP‐coupled assay system based on the Amplex Red protocol from Invitrogen (BPS Bioscience). The assay was conducted in a white OptiPlate‐384 microtiter plate (PerkinElmer) using a 45 mM HEPES buffer at pH 8.5 containing 40 mM NaCl. For pretesting experiments, 0.01 % Tween20 was added to the buffer in order to avoid precipitation at higher compound concentrations. LSD1 enzyme (8 μL; final concentration 0.045 μg/μL; expressed in Sf9 cells as published elsewhere89), was incubated with inhibitor solutions of varying concentration (2 μL in DMSO; final DMSO concentration 10 %) for 20 min at RT. Demethylation reaction was initiated by the addition of H3 K4(me2)aa1‐20 (10 μL; final concentration 20 μM; sequence: ARTK(me2)QTARKSTGGKAPRKQL; from Peptide Specialty Laboratories GmbH). As control for 0 % LSD1 activity, buffer solution was added instead of peptide solution, whereas for 100 % reference value, DMSO was used without inhibitor. After the plate was incubated for 60 min at RT, the Amplex Red reagent/Horseradish Peroxidase (HRP) mixture (20 μL; final concentration 50 μM Amplex Red reagent (Ampliflu™ Red, Sigma‐Aldrich) and 1 U/mL HRP (Sigma‐Aldrich, P8125) in reaction buffer) were added. Immediately after addition, fluorescence intensity of the forming product resorufin was measured at λ ex=510 nm and λ em=615 nm on a POLARstar Optima microplate reader (BMG Labtech, Germany). Values were blank‐corrected. Inhibition in [%] is in comparison to compound‐free DMSO control and no‐substrate negative control. Inhibition curves were analysed by sigmoidal curve fitting using OriginPro 2018b and IC50 values are given as mean±SD from two independent experiments.
In vitro analysis of prodrug activation and fragmentation: In order to assess the activation of the prodrugs by NTR, the NADH oxidation to NAD+ during the enzymatic reduction is measured. The assay was performed in a white OptiPlate‐384 microtiter plate (PerkinElmer) using a 50 mM KPi buffer at pH 8.0. The NTR (2 μL; final concentration 100 nM; NfsB(N)his expressed in E. coli and purified adapted from Haas et al.90) was added to a solution of compound (8 μL; final concentration 60 μM and 5 % DMSO). After pre‐incubation for 5 min at 37 °C, the kinetic measurement was started by the addition of NADH (10 μL; final concentration 500 μM). The decrease of fluorescence intensity was measured at λ ex=330 nm and λ em=460 nm on a POLARstar Optima microplate reader (BMG Labtech, Germany) at 37 °C and at 37 s intervals. Changes in fluorescence were converted to changes in NADH concentration using a calibration curve for NADH. The values were corrected by the spontaneous NADH oxidation evaluated with the DMSO control and by NADH oxidation by the 1 a scaffold. It was assumed that two equivalents of NADH are used in the reduction (ArNO2 to ArNHOH) and hence 120 μM NADH consumption is equated with 100 % activation of prodrugs. The activation of the prodrugs in [%] is given as mean±SD from two independent experiments and was calculated after 15 min of NTR reaction.
In the following experiment, the fragmentation of activated prodrugs is quantified by derivatisation of the formed LSD1 inhibitor 1 a with FMOC−Cl and subsequent HPLC analysis. After the kinetic measurement, an ice‐cold mixture of ACN/NaHCO3 aq. 250 mM pH 9 (4 : 1; 20 μL) was added to each well and the plate was centrifuged for 1 min at 170 rcf. 40 μL of the reaction mixtures were transferred to reaction tubes and the NTR was fully inactivated at 60 °C for 10 min in a digital dry bath (Labnet). After the tubes were centrifuged for 5 min at 17949 rcf, 20 μL were taken from the supernatant and transferred to a freshly prepared FMOC−Cl solution in ACN (3 μL; final concentration 250 μM) that was stored on ice. The reaction mixture was mixed and incubated for 30 min at RT. To convert the remaining FMOC−Cl after incubation, an aqueous solution of glycine (1 μL; final concentration 250 μM) was added, the tubes were mixed again. After incubation for 20 min at RT, 20 μL of the solutions were transferred in Rotilabo® sample vials (0.1 mL, Roth) and analysed on an Agilent Technologies 1260 Infinity system and a Phenomenex Kinetex 5u XB‐C18 100 Å 250×4.60 mm column. The fluorescence of the formed fluorophore 3 (final concentration 0–25 μM) was measured at λ ex=265 nm and λ em=310 nm. Eluent A was water containing 0.05 % TFA and eluent B was acetonitrile containing 0.05 % TFA. Linear gradient conditions were as follows: 0–10 min: linear increase to 100 % of B; 10–12 min: 100 % B; 12–15 min: A/B (50 : 50). This method is designated as M‐FLD in the compound characterisation part. Signals were corrected by values obtained by performing the same experiment without NTR. The calibration curve was generated by performing the described experimental procedure both with amine 1 a and with 3, resulting in nearly identical calibration curves with R 2=1.000 (from 0.1–25 μM). The calibration curve of derivatised 1 a was used to calculate the concentration of fragmented prodrugs and the obtained values were corrected by the factor “25 μM (theoretical concentration of positive control 1 a)/[calculated concentration of 1 a]”. The conversion of the prodrugs to 1 a in [%] is in comparison to positive control 1 a as 100 % control and is given as mean±SD from two independent experiments.
Analysis of prodrug stability: The fragmentation of prodrugs in KPi buffer and cell medium was analysed using a similar derivatisation protocol as for the in vitro prodrug fragmentation. The prodrugs were diluted to a 50 μM solution with either sterilised 50 mM KPi buffer pH 8.0 or RPMI1640 medium supplemented with 10 % (v/v) FCS, 2 mM L‐glutamine, 1 % Penicillin/Streptomycin with a final DMSO concentration of 10 %. The solutions were transferred to a sterile 96‐well TC‐Plate (Suspension, F, Sarstedt), covered with gas‐permeable sealing foil and kept under CO2 atmosphere (5 %) at 37 °C. After 0 h, 24 h, 3 days and 8 days, 20 μL were removed and treated with aqueous NaHCO3 solution (5 μL; 250 mM, pH 9.0) and freshly prepared FMOC−Cl in ACN (21 μL; final concentration 250 μM for KPi buffer or 1 mM for medium). After incubation for 30 min at RT, aqueous glycine solution was added (2 μL; final concentration 250 μM or 1 mM) and the mixed probe was incubated for additional 20 min at RT. The chromatographic analysis was performed as described for the fragmentation assay. The calibration curve of derivatised 1 a was also generated in medium (R2=0.999) and used to calculate the concentration of fragmented prodrugs in medium. The obtained values were corrected by the factor “20.83 μM (theoretical concentration of positive control 1 a)/[calculated concentration of 1 a]”.
Cell culture: THP1‐NTR+ cells were generated within this project and derive from the THP1 cell line (RRID:CVCL_0006), which was a kind gift of Prof. Lübbert from the University Hospital, Freiburg. Both cell lines were cultivated in RPMI1640 medium supplemented with 10 % (v/v) FCS, 2 mM l‐glutamine, 1 % penicillin/streptomycin at 37 °C in a humidified atmosphere with 5 % CO2.
Cell viability assay: Cells were diluted to 7 ⋅ 104 cells mL−1 and mixed with compounds to a final DMSO concentration of 0.5 % and seeded at 100 μL in 96‐well plates in triplicates. After 72 h incubation, the CellTiter 96® AQueous Non‐Radioactive Cell Proliferation Assay from Promega was performed according to the manufacturer's instructions. Assay plates were measured at 492 nm on a POLARstar Optima microplate reader (BMG Labtech, Germany).
Transfection: The retroviral plasmid was cloned with the nfsb template pGL4.26‐SS‐352, which was a gift from James Collins (Addgene plasmid # 68791).91 For the production of retroviruses, plasmid DNA was introduced into packaging HEK 293GP cells using Turbofect (Thermo Fisher Scientific). 10 μg DNA (8 μg NTR plasmid+2 μg VSV−G) were mixed with 1000 μL of Opti‐MEM I Reduced Serum Medium (Gibco) and 20 μL of Turbofect transfection reagent before 20 min of incubation at RT. After the addition of 7 mL fresh medium onto the 70 % confluent (in 60 cm2 plates) packaging cells, the transfection mixture was added dropwise.
Retroviral infection and selection: 24 h after transfection, the medium was removed and 8 mL fresh medium appropriate for the cells aimed to infect was added. 12 h afterwards, the first harvest of the virus and simultaneously the first round of infection was performed. For this, the medium was collected and filtered through the Acrodisc® 0,45 μm Syringe Filter (PALL Life Sciences). The virus‐producing cells were gently covered in 8 mL fresh medium accordingly to the step before. The harvested and filtered virus was added to the THP‐1 cells: 200 000 cells per well were seeded in 1 mL and covered with 2 mL virus. Infections were performed in 6‐well plates. After the addition of polybrene (Sigma‐Aldrich; 4 μg/mL), the cells were centrifuged for 15 min at 1500 rpm and 30 °C. This procedure was repeated twice every 12 h so that the spin infection was performed three times in total. Infection efficiency was tested via FACS analysis 48 h after the third infection round (ca. 70 % GFP+). Successfully infected cells were selected via the puromycin resistance cassette on the vector (1 μg/mL). The selection process was monitored via FACS analysis until more than 99 % of the cells were GFP‐positive.
Luminescent measurement of NTR activity in THP1 cells: Different cell numbers were spread as triplicates (50 μL each) in white, sterile Cellstar 96 plates (Greiner Bio). Compounds were added to a final concentration of 25 μM in 0.5 % DMSO and incubated for 60 min at 37 °C and 5 % CO2. After incubation, Luciferin Detection Reagent (Promega, V8921) was complemented with 10 mM d‐cysteine and 0.05 % IGEPAL CA‐630 and added in equal volume (50 μL) to the cells. After incubation for 20 min at RT, the luminescent signal was measured at an EnVision 2102 multilabel plate reader (PerkinElmer). The blank signals from DMSO controls were subtracted and the signals from NTR probes were analysed in correlation to the positive signal at the respective cell numbers. The resulting conversion rates were calculated as mean±SD from two independent experiments.
Colony‐forming unit assay: MethoCult H4230 (StemCell Technologies) aliquots, prepared as described by the manufacturer, were supplemented with FCS, IMDM (Iscove's modified Dulbecco's medium; StemCell Technologies) and vehicle or inhibitor solution to a final concentration of 0.5 % DMSO. Cells were added to 100 cells well−1 and aliquoted in 1.1 mL aliquots in duplicates in TC dishes (O35 mm; Sarstedt). TC dishes were placed together with a third dish (O35 mm; Greiner bio‐one) containing sterile water in a TC dish (O100 mm; Sarstedt) and incubated for 10 days in a 5 % CO2 atmosphere at 37 °C. Colonies were counted by a light microscope (Zeiss PrimoVert). Zi values were calculated from Equation (1)
| (1) |
for each assay. For bystander effect experiments, the two cell lines THP1‐NTR+ and THP1wt were mixed (50 %, 75 % THP1‐NTR+ cells) before being added to the MethoCult medium.
Flow cytometry: Cells were treated with compounds to a final DMSO concentration of 0.1 % for 72 h and stained with the antibody APC Mouse Anti‐Human CD86 (BD Bioscience, cat: 555660, lot: 8018951) and 7‐AAD (BD Bioscience). Measurement was done using a CyAn (Beckmann Coulter) with 10000 events per sample. Z i values were calculated from Equation (1), values from DMSO treated cells were set as min(x) and values from cells treated with 500 nM 1 a were set as max(x). For bystander effect experiments, the two cell lines THP1‐NTR+ and THP1wt were mixed (25 %, 50 %, 75 % THP1‐NTR+ cells) before compounds were added.
GSH assay: Cells were diluted to 7 ⋅ 105 cells mL−1, mixed with compounds to a final DMSO concentration of 0.5 % and incubated for 1 h. Cell lysates were obtained by repeating freeze/thaw cycles and centrifugation for 20 min at 4 °C with 16060 rcf. Protein concentration of different samples was normalised after the Pierce BCA Protein Assay Kit (Thermo Scientific), performed according to the manufacturer's instructions. GSH‐levels were quantified with Ellman's reagent (5,5′‐dithiobis‐(2‐nitrobenzoic acid)) as described by Hulsman et al..79 Absorbance was measured at 430 nm on a POLARstar Optima microplate reader (BMG Labtech, Germany).
Conflict of interest
The authors declare no conflict of interest.
Supporting information
As a service to our authors and readers, this journal provides supporting information supplied by the authors. Such materials are peer reviewed and may be re‐organized for online delivery, but are not copy‐edited or typeset. Technical support issues arising from supporting information (other than missing files) should be addressed to the authors.
Supplementary
Acknowledgements
This study was supported by the Deutsche Forschungsgemeinschaft (DFG, German Research Foundation) under Germany's Excellence Strategy (CIBSS – EXC‐2189 – Project ID 390939984). M.J and R.S. received funding from the DFG (SFB 992). R.S. was further supported by grants from the European Research Council (AdGrant 322844) and the DFG (CRC 850, CRC 746, and SCHU688/12‐1).
E.-M. Herrlinger, M. Hau, D. M. Redhaber, G. Greve, D. Willmann, S. Steimle, M. Müller, M. Lübbert, C. C. Miething, R. Schüle, M. Jung, ChemBioChem 2020, 21, 2329.
A previous version of this manuscript has been deposited on a preprint server (https://doi.org/10.26434/chemrxiv.10012937.v1).
References
- 1. Tietze L. F., Schmuck K., Curr. Pharm. Des. 2011, 17, 3527–3547. [DOI] [PubMed] [Google Scholar]
- 2. Choi-Sledeski Y. M., Wermuth C. G. in The Practice of Medicinal Chemistry, 4th ed. (Eds.: C. G. Wermuth, D. Aldous, P. Raboisson, D. Rognan), Academic Press, San Diego, 2015, pp. 657–696. [Google Scholar]
- 3. Daniel K. B., Sullivan E. D., Chen Y., Chan J. C., Jennings P. A., Fierke C. A., Cohen S. M., J. Med. Chem. 2015, 58, 4812–4821. [DOI] [PMC free article] [PubMed] [Google Scholar]
- 4. Delatouche R., Denis I., Grinda M., El Bahhaj F., Baucher E., Collette F., Héroguez V., Grégoire M., Blanquart C., Bertrand P., Eur. J. Pharm. Biopharm. 2013, 85, 862–872. [DOI] [PubMed] [Google Scholar]
- 5.E. D. D. Calder, A. Skwarska, I. N. Mistry, D. Sneddon, S. J. Conway, E. M. Hammond, ChemRxiv Prepr 2019, DOI https://doi.org/10.26434/chemrxiv.9963503.v1.
- 6. Engel M., Gee Y. S., Cross D., Maccarone A., Heng B., Hulme A., Smith G., Guillemin G. J., Stringer B. W., Hyland C. J. T., Ooi L., J. Neurochem. 2019, 149, 535–550. [DOI] [PMC free article] [PubMed] [Google Scholar]
- 7. Zheng S., Guo S., Zhong Q., Zhang C., Liu J., Yang L., Zhang Q., Wang G., ACS Med. Chem. Lett. 2018, 9, 149–154. [DOI] [PMC free article] [PubMed] [Google Scholar]
- 8. Ota Y., Itoh Y., Kaise A., Ohta K., Endo Y., Masuda M., Sowa Y., Sakai T., Suzuki T., Angew. Chem. Int. Ed. 2016, 55, 16115–16118; [DOI] [PubMed] [Google Scholar]; Angew. Chem. 2016, 128, 16349–16352. [Google Scholar]
- 9. Ota Y., Nakamura A., Elboray E. E., Itoh Y., Suzuki T., Chem. Pharm. Bull. 2019, 67, 192–195. [DOI] [PubMed] [Google Scholar]
- 10. Rubio-Ruiz B., Weiss J. T., Unciti-Broceta A., J. Med. Chem. 2016, 59, 9974–9980. [DOI] [PubMed] [Google Scholar]
- 11. Pérez-López A. M., Rubio-Ruiz B., Sebastián V., Hamilton L., Adam C., Bray T. L., Irusta S., Brennan P. M., Lloyd-Jones G., Sieger D., Santamaría J., Unciti-Broceta A., Angew. Chem. Int. Ed. 2017, 56, 12548–12552; [DOI] [PMC free article] [PubMed] [Google Scholar]; Angew. Chem. 2017, 129, 12722–12726. [Google Scholar]
- 12. Jung M., Mini-Rev. Med. Chem. 2001, 1, 399–407. [DOI] [PubMed] [Google Scholar]
- 13. Singh Y., Palombo M., Sinko P. J., Curr. Med. Chem. 2008, 15, 1802–1826. [DOI] [PMC free article] [PubMed] [Google Scholar]
- 14. Eda S., Nasibullin I., Vong K., Kudo N., Yoshida M., Kurbangalieva A., Tanaka K., Nat. Catal. 2019, 2, 780–792. [Google Scholar]
- 15. Tsubokura K., Vong K. K. H., Pradipta A. R., Ogura A., Urano S., Tahara T., Nozaki S., Onoe H., Nakao Y., Sibgatullina R., Kurbangalieva A., Watanabe Y., Tanaka K., Angew. Chem. Int. Ed. 2017, 56, 3579–3584; [DOI] [PubMed] [Google Scholar]; Angew. Chem. 2017, 129, 3633–3638. [Google Scholar]
- 16. Williams E. M., Little R. F., Mowday A. M., Rich M. H., Chan-Hyams J. V. E., Copp J. N., Smaill J. B., Patterson A. V., Ackerley D. F., Biochem. J. 2015, 471, 131–153. [DOI] [PubMed] [Google Scholar]
- 17. Anlezark G. M., Melton R. G., Sherwood R. F., Coles B., Friedlos F., Knox R. J., Biochem. Pharmacol. 1992, 44, 2289–2295. [DOI] [PubMed] [Google Scholar]
- 18. Michael N. P., Brehm J. K., Anlezark G. M., Minton N. P., FEMS Microbiol. Lett. 1994, 124, 195–202. [DOI] [PubMed] [Google Scholar]
- 19. Race P. R., Lovering A. L., Green R. M., Ossor A., White S. A., Searle P. F., Wrighton C. J., Hyde E. I., J. Biol. Chem. 2005, 280, 13256–13264. [DOI] [PubMed] [Google Scholar]
- 20. Zenno S., Koike H., Tanokura M., Saigo K., J. Biochem. 1996, 120, 736–744. [DOI] [PubMed] [Google Scholar]
- 21. Mauger A. B., Somani H. H., Friedlos F., Knox R. J., Burke P. J., J. Med. Chem. 1994, 37, 3452–3458. [DOI] [PubMed] [Google Scholar]
- 22. Hay M. P., Wilson W. R., Denny W. A., Bioorg. Med. Chem. Lett. 1995, 5, 2829–2834. [Google Scholar]
- 23. Tercel M., Denny W. A., Wilson W. R., Bioorg. Med. Chem. Lett. 1996, 6, 2741–2744. [Google Scholar]
- 24. Lee M., Simpson J. E., Woo S., Kaenzig C., Anlezark G. M., Eno-Amooquaye E., Burkeb P. J., Bioorg. Med. Chem. Lett. 1997, 7, 1065–1070. [Google Scholar]
- 25. Hay M. P., Atwell G. J., Wilson W. R., Pullen S. M., Denny W. A., J. Med. Chem. 2003, 46, 2456–2466. [DOI] [PubMed] [Google Scholar]
- 26. Hay M. P., Anderson R. F., Ferry D. M., Wilson W. R., Denny W. A., J. Med. Chem. 2003, 46, 5533–5545. [DOI] [PubMed] [Google Scholar]
- 27. Hay M. P., Sykes B. M., Denny W. A., Wilson W. R., Bioorg. Med. Chem. Lett. 1999, 9, 2237–2242. [DOI] [PubMed] [Google Scholar]
- 28. Gruber T. D., Krishnamurthy C., Grimm J. B., Tadross M. R., Wysocki L. M., Gartner Z. J., Lavis L. D., ACS Chem. Biol. 2018, 13, 2888–2896. [DOI] [PubMed] [Google Scholar]
- 29. Jiang T., Kumar P., Huang W., Kao W., Thompson A. O., Camarda F. M., Laughlin S. T., ChemBioChem 2019, 20, 2222–2226. [DOI] [PubMed] [Google Scholar]
- 30. Mohammad H. P., Barbash O., Creasy C. L., Nat. Med. 2019, 25, 403–418. [DOI] [PubMed] [Google Scholar]
- 31. Xiao Pfister S., Ashworth A., Nat. Rev. Drug Discovery 2017, 16, 241–263. [DOI] [PubMed] [Google Scholar]
- 32. Somervaille T., Salamero O., Montesinos P., Willekens C., Perez Simon J. A., Pigneux A., Recher C., Popat R., Molinero C., Mascaro C., Maes T., Bosch F., Blood 2016, 128, 4060. [Google Scholar]
- 33. Stresemann C., Lyko F., Int. J. Cancer 2008, 123, 8–13. [DOI] [PubMed] [Google Scholar]
- 34. Shi Y., Lan F., Matson C., Mulligan P., Whetstine J. R., Cole P. A., Casero R. A., Shi Y., Cell 2004, 119, 941–953. [DOI] [PubMed] [Google Scholar]
- 35. Metzger E., Wissmann M., Yin N., Müller J. M., Schneider R., Peters A. H. F. M., Günther T., Buettner R., Schüle R., Nature 2005, 437, 436–439. [DOI] [PubMed] [Google Scholar]
- 36. Huang J., Sengupta R., Espejo A. B., Lee M. G., Dorsey J. A., Richter M., Opravil S., Shiekhattar R., Bedford M. T., Jenuwein T., Berger S. L., Nature 2007, 449, 105–108. [DOI] [PubMed] [Google Scholar]
- 37. Wang J., Hevi S., Kurash J. K., Lei H., Gay F., Bajko J., Su H., Sun W., Chang H., Xu G., Gaudet F., Li E., Chen T., Nat. Genet. 2009, 41, 125–129. [DOI] [PubMed] [Google Scholar]
- 38. Kontaki H., Talianidis I., Mol. Cell 2010, 39, 152–160. [DOI] [PubMed] [Google Scholar]
- 39. Adamo A., Sesé B., Boue S., Castaño J., Paramonov I., Barrero M. J., Izpisua Belmonte J. C., Nat. Cell Biol. 2011, 13, 652–659. [DOI] [PubMed] [Google Scholar]
- 40. Foster C. T., Dovey O. M., Lezina L., Luo J. L., Gant T. W., Barlev N., Bradley A., Cowley S. M., Mol. Cell. Biol. 2010, 30, 4851–4863. [DOI] [PMC free article] [PubMed] [Google Scholar]
- 41. Saleque S., Kim J., Rooke H. M., Orkin S. H., Mol. Cell 2007, 27, 562–572. [DOI] [PubMed] [Google Scholar]
- 42. Kerenyi M. A., Shao Z., Hsu Y.-J., Guo G., Luc S., O'Brien K., Fujiwara Y., Peng C., Nguyen M., Orkin S. H., Elife 2013, 2, e00633. [DOI] [PMC free article] [PubMed] [Google Scholar]
- 43. Wu J., Hu L., Du Y., Kong F., Pan Y., Onco. Targets. Ther. 2015, 8, 2565. [DOI] [PMC free article] [PubMed] [Google Scholar]
- 44. Maes T., Mascaró C., Ortega A., Lunardi S., Ciceri F., Somervaille T. C. P., Buesa C., Epigenomics 2015, 7, 609–626. [DOI] [PubMed] [Google Scholar]
- 45. McGrath J. P., Williamson K. E., Balasubramanian S., Odate S., Arora S., Hatton C., Edwards T. M., O'Brien T., Magnuson S., Stokoe D., Daniels D. L., Bryant B. M., Trojer P., Cancer Res. 2016, 76, 1975–1988. [DOI] [PubMed] [Google Scholar]
- 46. Ishikawa Y., Gamo K., Yabuki M., Takagi S., Toyoshima K., Nakayama K., Nakayama A., Morimoto M., Miyashita H., Dairiki R., Hikichi Y., Tomita N., Tomita D., Imamura S., Iwatani M., Kamada Y., Matsumoto S., Hara R., Nomura T., Tsuchida K., Nakamura K., Mol. Cancer Ther. 2017, 16, 273–284. [DOI] [PubMed] [Google Scholar]
- 47. Vinyard M. E., Su C., Siegenfeld A. P., Waterbury A. L., Freedy A. M., Gosavi P. M., Park Y., Kwan E. E., Senzer B. D., Doench J. G., Bauer D. E., Pinello L., Liau B. B., Nat. Chem. Biol. 2019, 15, 529–539. [DOI] [PMC free article] [PubMed] [Google Scholar]
- 48. Takagi S., Ishikawa Y., Mizutani A., Iwasaki S., Matsumoto S., Kamada Y., Nomura T., Nakamura K., Cancer Res. 2017, 77, 4652–4662. [DOI] [PubMed] [Google Scholar]
- 49. McAllister T. E., England K. S., Hopkinson R. J., Brennan P. E., Kawamura A., Schofield C. J., J. Med. Chem. 2016, 59, 1308–1329. [DOI] [PubMed] [Google Scholar]
- 50. Yang M., Culhane J. C., Szewczuk L. M., Jalili P., Ball H. L., Machius M., Cole P. A., Yu H., Biochemistry 2007, 46, 8058–8065. [DOI] [PubMed] [Google Scholar]
- 51. Mimasu S., Sengoku T., Fukuzawa S., Umehara T., Yokoyama S., Biochem. Biophys. Res. Commun. 2008, 366, 15–22. [DOI] [PubMed] [Google Scholar]
- 52. Ghosh A. K., Brindisi M., J. Med. Chem. 2015, 58, 2895–2940. [DOI] [PMC free article] [PubMed] [Google Scholar]
- 53. Alouane A., Labruère R., Le Saux T., Schmidt F., Jullien L., Angew. Chem. Int. Ed. 2015, 54, 7492–509; [DOI] [PubMed] [Google Scholar]; Angew. Chem. 2015, 127, 7600–7619. [Google Scholar]
- 54. Papot S., Tranoy I., Tillequin F., Florent J., Gesson J., Curr. Med. Chem. Agents 2002, 2, 155–185. [DOI] [PubMed] [Google Scholar]
- 55.N. Guibourt, A. Ortega Munoz, J. Castro-Palomino Laria, WO2010084160, 2010.
- 56. Hay M. P., Wilson W. R., Denny W. A., Bioorg. Med. Chem. 2005, 13, 4043–4055. [DOI] [PubMed] [Google Scholar]
- 57. Carl P. L., Chakravarty P. K., Katzenellenbogen J. A., J. Med. Chem. 1981, 24, 479–480. [DOI] [PubMed] [Google Scholar]
- 58. Hay M. P., Wilson W. R., Denny W. A., Tetrahedron 2000, 56, 645–657. [Google Scholar]
- 59. Sinhababu K., Thakker D. R., Adv. Drug Delivery Rev. 1996, 19, 241–273. [Google Scholar]
- 60. Alvaro R. F., Wislocki P. G., Miwa G. T., Li A. Y. H., Chem.-Biol. Interact. 1992, 82, 21–30. [DOI] [PubMed] [Google Scholar]
- 61. Borch R. F., Liu J., Schmidt J. P., Marakovits J. T., Joswig C., Gipp J. J., Mulcah§ R. T., J. Med. Chem. 2000, 43, 2258–2265. [DOI] [PubMed] [Google Scholar]
- 62. Schulz-Fincke J., Hau M., Barth J., Robaa D., Willmann D., Kürner A., Haas J., Greve G., Haydn T., Fulda S., Lübbert M., Lüdeke S., Berg T., Sippl W., Schüle R., Jung M., Eur. J. Med. Chem. 2018, 144, 52–67. [DOI] [PubMed] [Google Scholar]
- 63. Binda C., Valente S., Romanenghi M., Pilotto S., Cirilli R., Karytinos A., Ciossani G., Botrugno O. A., Forneris F., Tardugno M., Edmondson D. E., Minucci S., Mattevi A., Mai A., J. Am. Chem. Soc. 2010, 132, 6827–6833. [DOI] [PubMed] [Google Scholar]
- 64.V. L. Narayanan, E. A. Sausville, G. Kaur, R. K. Varma, WO9943636 (A2), 1999.
- 65. O'Connor L. J., Cazares-Körner C., Saha J., Evans C. N. G., Stratford M. R. L., Hammond E. M., Conway S. J., Nat. Protoc. 2016, 11, 781–794. [DOI] [PubMed] [Google Scholar]
- 66. Hameed S., Bharatham P. N., Katagihallimath N., Sharma S., Nandishaiah R., Shanbhag A. P., Thomas T., Narjari R., Sarma M., Bhowmik P., Amar P., Ravishankar R., Jayaraman R., Muthan K., Subbiah R., Ramachandran V., Balasubramanian V., Datta S., Sci. Rep. 2018, 8, 1–18. [DOI] [PMC free article] [PubMed] [Google Scholar]
- 67. Puente B., Garcia M. A., Hernandez E., Bregante M. A., Perez S., Pablo L., Prieto E., J. Chromatogr. Sci. 2011, 49, 745–752. [DOI] [PubMed] [Google Scholar]
- 68. Yang Y., Voak A., Wilkinson S. R., Hu L., Bioorg. Med. Chem. Lett. 2012, 22, 6583–6586. [DOI] [PubMed] [Google Scholar]
- 69. Elmes R. B. P., Chem. Commun. 2016, 52, 8935–8956. [DOI] [PubMed] [Google Scholar]
- 70. Feng P., Zhang H., Deng Q., Liu W., Yang L., Li G., Chen G., Du L., Ke B., Li M., Anal. Chem. 2016, 88, 5610–5614. [DOI] [PubMed] [Google Scholar]
- 71. Zhou W., Leippe D., Duellman S., Sobol M., Vidugiriene J., O'Brien M., Shultz J. W., Kimball J. J., Dibernardo C., Moothart L., Bernad L., Cali J., Klaubert D. H., Meisenheimer P., ChemBioChem 2014, 15, 670–675. [DOI] [PubMed] [Google Scholar]
- 72. Li Z., Gao X., Shi W., Li X., Ma H., Chem. Commun. 2013, 49, 5859. [DOI] [PubMed] [Google Scholar]
- 73. Mustafa D., Ma D., Zhou W., Meisenheimer P., Cali J. J., Bioconjugate Chem. 2016, 27, 87–101. [DOI] [PubMed] [Google Scholar]
- 74. Maiques-Diaz A., Spencer G. J., Lynch J. T., Ciceri F., Williams E. L., Amaral F. M. R., Wiseman D. H., Harris W. J., Li Y., Sahoo S., Hitchin J. R., Mould D. P., Fairweather E. E., Waszkowycz B., Jordan A. M., Smith D. L., Somervaille T. C. P., Cell Rep. 2018, 22, 3641–3659. [DOI] [PMC free article] [PubMed] [Google Scholar]
- 75. Lynch J. T., Cockerill M. J., Hitchin J. R., Wiseman D. H., Somervaille T. C. P., Anal. Biochem. 2013, 442, 104–106. [DOI] [PubMed] [Google Scholar]
- 76. Maes T., Mascaró C., Tirapu I., Estiarte A., Ciceri F., Lunardi S., Guibourt N., Perdones A., Lufino M. M. P., Somervaille T. C. P., Wiseman D. H., Duy C., Melnick A., Willekens C., Ortega A., Martinell M., Valls N., Kurz G., Fyfe M., Castro-Palomino J. C., Buesa C., Cancer Cell 2018, 33, 495–511. [DOI] [PubMed] [Google Scholar]
- 77. Smitheman K. N., Severson T. M., Rajapurkar S. R., McCabe M. T., Karpinich N., Foley J., Pappalardi M. B., Hughes A., Halsey W., Thomas E., Traini C., Federowicz K. E., Laraio J., Mobegi F., Ferron-Brady G., Prinjha R. K., Carpenter C. L., Kruger R. G., Wessels L., Mohammad H. P., Haematologica 2019, 104, 1156–1167. [DOI] [PMC free article] [PubMed] [Google Scholar]
- 78. Mohammad H. P., Smitheman K. N., Kamat C. D., Soong D., Federowicz K. E., Van Aller G. S., Schneck J. L., Carson J. D., Liu Y., Butticello M., Bonnette W. G., Gorman S. A., Degenhardt Y., Bai Y., McCabe M. T., Pappalardi M. B., Kasparec J., Tian X., McNulty K. C., Rouse M., McDevitt P., Ho T., Crouthamel M., Hart T. K., Concha N. O., McHugh C. F., Miller W. H., Dhanak D., Tummino P. J., Carpenter C. L., Johnson N. W., Hann C. L., Kruger R. G., Cancer Cell 2015, 28, 57–69. [DOI] [PubMed] [Google Scholar]
- 79. Hulsman N., Medema J. P., Bos C., Jongejan A., Leurs R., Smit M. J., De Esch I. J. P., Richel D., Wijtmans M., J. Med. Chem. 2007, 50, 2424–2431. [DOI] [PubMed] [Google Scholar]
- 80. Higuchi Y., J. Cell. Mol. Med. 2004, 8, 455–464. [DOI] [PMC free article] [PubMed] [Google Scholar]
- 81. Hay M. P., Sykes B. M., Denny W. A., O'Connor C. J., J. Chem. Soc. Perkin Trans. 1 1999, 2759–2770. [Google Scholar]
- 82. Nivinskas H., Koder R. L., Anusevičius Ž., Šarlauskas J., Miller A.-F., Čenas N., Arch. Biochem. Biophys. 2001, 385, 170–178. [DOI] [PubMed] [Google Scholar]
- 83. Bérubé L. R., Farah S., McClelland R. A., Rauth A. M., Int. J. Radiat. Oncol. 1992, 22, 817–820. [DOI] [PubMed] [Google Scholar]
- 84. Roacho-Perez J. A., Gallardo-Blanco H. L., Sanchez-Dominguez M., Garcia-Casillas P., Chapa-Gonzalez C., Sanchez-Dominguez C. N., Mol. Med. Rep. 2018, 17, 1413–1420. [DOI] [PubMed] [Google Scholar]
- 85. Rai R., Alwani S., Badea I., Polymers (Basel). 2019, 11, 745. [DOI] [PMC free article] [PubMed] [Google Scholar]
- 86. Da Veiga Moreira J., Hamraz M., Abolhassani M., Bigan E., Pérès S., Paulevé L., Nogueira M. L., Steyaert J. M., Schwartz L., Metabolites 2016, 6, 33. [DOI] [PMC free article] [PubMed] [Google Scholar]
- 87. Knox R. J., Friedlos F., Jarman M., Davies L. C., Goddard P., Anlezark G. M., Melton R. G., Sherwood R. F., Biochem. Pharmacol. 1995, 49, 1641–1647. [DOI] [PubMed] [Google Scholar]
- 88. Baell J. B., Holloway G. A., J. Med. Chem. 2010, 53, 2719–2740. [DOI] [PubMed] [Google Scholar]
- 89. Willmann D., Lim S., Wetzel S., Metzger E., Jandausch A., Wilk W., Jung M., Forne I., Imhof A., Janzer A., Kirfel J., Waldmannm H., Schüle R., Buettner R., Int. J. Cancer 2012, 131, 2704–2709. [DOI] [PubMed] [Google Scholar]
- 90. Haas J., Schätzle M. A., Husain S. M., Schulz-Fincke J., Jung M., Hummel W., Müller M., Lüdeke S., Chem. Commun. 2016, 52, 5198–5201. [DOI] [PubMed] [Google Scholar]
- 91. Slomovic S., Collins J. J., Nat. Methods 2015, 12, 1085–1090. [DOI] [PubMed] [Google Scholar]
Associated Data
This section collects any data citations, data availability statements, or supplementary materials included in this article.
Supplementary Materials
As a service to our authors and readers, this journal provides supporting information supplied by the authors. Such materials are peer reviewed and may be re‐organized for online delivery, but are not copy‐edited or typeset. Technical support issues arising from supporting information (other than missing files) should be addressed to the authors.
Supplementary