

Abstract
Background
Drug trials for male‐pattern hair loss (MPHL) did not investigate hair cycling.
Materials and Methods
Male‐pattern hair loss volunteers (n = 22) took oral finasteride 1 mg daily with randomly either MTS5% or control lotion (1 mL/d). After 12 months on oral drug, 14 were randomized for a dose‐effect study of topical minoxidil 2% or 5%. Each 3‐month “on‐lotion” was followed by a 3‐month “off‐lotion.”
Results
Exogen release and anagen initiation from pre‐existing but functionally deficient follicles occurred mainly during combined dug treatment. Anagen initiation by topical minoxidil 5% could not be maintained by oral finasteride. As compared with control males, the compound index of hair growth raised from 30% at baseline up to 60% within 3 months of combined drug regimen which is better than oral drug only (no change) but still far beyond normalization of productivity (considered as 100%). There was no obvious transformation of miniaturized hair follicles into terminal hair‐producing follicles, and the activation of miniaturized hair follicles was not clinically relevant (slow growth and short duration of anagen).
Conclusions
Benefit with oral finasteride and topical 5% minoxidil (1 mL, 1 per day) resulted from initiation of anagen in deficient terminal follicles without increased growth rates.
Keywords: androgenetic alopecia, clinical trial, combined drug treatment, FDA‐approved drug, finasteride, hair growth, male‐pattern hair loss, miniaturized hair, minoxidil 5, vellus hair follicle
1. INTRODUCTION
While quality of clinical trial methodology was rated less than optimal by S3 and Cochrane reviews,1, 2 a lot of speculation on the intensity, mechanisms and clinical relevance of the hair regrowth process arose while ignoring potential confounders.3, 4
Besides major clinical studies involving a large number of male‐pattern hair loss sufferers (MPHL) over many years funded by industry testing single‐drug treatments either for FDA filing or for marketing support, there were only rare studies or clinical cases with combined medical treatments like finasteride with topical minoxidil. The oral drug given together with the recommended regimen of topical minoxidil lotion (2× per day) suggested a clinical benefit qualified as synergistic5, 6, 7 but the hair loss after weaning of topical minoxidil was not prevented by continued oral intake finasteride.7 Unfortunately, none of the aforementioned studies produced detailed quantitative dynamics of scalp hair follicle cycling in MPHL. Hence, the quantification of the reported recovery from the initially defective scalp coverage by defective hair follicles with improved productivity from drug treatments (either combined or not) remains largely unknown from the pharmacodynamics’ perspective.
A non‐invasive imaging method (NIM) initially named phototrichogram (PTG) evolved by adding contrast enhancement (CE‐PTG). The precision was equal to complete serial sectioning of scalp biopsies including tracking of empty anagen follicles.8 More recently, we completed the CE‐PTG employing a patented hair extraction procedure where the loosely attached elements would be specifically removed. The exogen collection (CE‐PTG‐EC) allowed separation of the non‐growing hair sub‐population into two sub‐groups: catagen‐telogen that remain firmly attached to the scalp follicles (anchorage forces being a function of the diameter) from the exogen release at the completion of the hair cycle.9 By adding the growth rate to diameter of individual hair fibres,10 a broader functional picture could be given employing an integrated approach of hair cycling in vivo.
With this technology at hand, we wished to describe specific drug‐induced changes of hair cycling and also establish whether a number of combinations of topical lotions along with oral drug intake would produce some measurable benefit that might be useful to the clinician and to the patient.
In order to gain clinically relevant insight in numerical data, we wished to present hair regrowth data in relation to normal male scalp productivity. This innovative approach might, at least theoretically, offer a valuable perspective of clinical normalization induced by drug treatment. Finally, the data on combined drug treatment challenge the so‐called “reversal hypothesis”: if any, there were only marginal changes in miniaturized follicles in MPHL sufferers even with the most efficient combined medical treatment, and those changes were considered as clinically non‐relevant.
2. MATERIAL AND METHODS
2.1. Study population
2.1.1. Controls
Male controls participated in a basic study on seasonal variability of hair productivity using a minimum of twice a week mild shampoo. A hair shampoo was recommended on the morning of the test days. Data were generated using exactly the same investigative imaging protocol and have been published elsewhere.11 These data served as a historical control.
2.1.2. Trialists
A hair grooming protocol similar to the one described for healthy male controls was used throughout studies involving male‐patterned hair loss (MPHL) panellists.
A pool of potential volunteers known to be in good physical and mental health showing a characteristic moderately progressing MPHL was informed that they would receive, free of charge, all drugs together with a mild shampoo to be used regularly during the trial and every morning of planned clinical visits.
Volunteers were informed that they were free to withdraw from the trial at any time. All participants would receive during the complete trial period 1 mg finasteride pills (Propecia®; Merck & Cie) to be taken daily as an oral drug approved on the EU market for treating hair loss in men with MPHL. There were 22 male subjects (19‐40 years of age) who agreed to be become part of these assays.
2.1.3. Exclusion criteria
Exclusion criteria included significant abnormalities on screening physical examination, prior surgical correction of scalp hair loss, use of known medical treatment (other than the per‐trial delivered test compounds) for hair loss like topical minoxidil or finasteride including other 5a‐reductase inhibitors or using other known efficacious compounds during the last 6 months before inclusion or during the trial where repeat clinical rating and images would be taken according to protocol. Hair loss involving causes other than androgenetic alopecia or substantial alterations in hairstyle or dyeing of the hair within the timeframe of the study would lead to exclusion from the database.
2.1.4. Compliance
Blisters with oral drugs and preweighed containers with topical solutions were collected and weighed at regular intervals in order to evaluate compliance. Knowing human volunteers’ impact, a threshold of 90% would be rated as excellent.
2.2. Study design and trial management
After due information of the Institutional ethics committee, the timelines of all combinations of oral and topical drug were explained and informed consent was duly collected from a pool of volunteers. All would receive the oral drug during the total duration of the assay.
2.2.1. Phase A. Placebo‐controlled randomized topical lotions with oral drug treatment
Phase A#1: Panellists (n = 22) were informed that during the first 3 months of oral drug, they would also apply once a day a topical lotion. After blinded coded randomization, the “on‐topical” period started with the delivery of standard containers with either minoxidil (industrial preparation at 5% in a hydroalcoholic vehicle with propylene glycol [PG]) or control lotions (the same vehicle containing the same proportion of PG).
Phase A#2: While staying on oral drug, panellists entered a 3‐month‐long “off‐topical” period and a follow‐up visit was planned at the end of the “off‐topical” (6 months after entering the trial).
Phase A#3: The volunteers would receive oral drug only for a new period of 6 months such that after 12 months at least on oral drug treatment and a period of 9 months without application of lotions they might enter phase B.
2.2.2. Phase B. Randomized dose‐range study of minoxidil 2% vs 5% in combination with oral drug
Phase B#1: After 12 months on oral treatment and 9 months after the last application of lotions according to study protocol, 14 subjects entered a randomization process of topicals. After a new baseline visit (ie, at 12 months on oral drug), phase B#1 comprised a monthly observation during 3 months of the dose response to minoxidil 2% or minoxidil 5% lotion (blinded coded randomization; lotion to be applied from standard containers 1 mL once a day) and monthly clinical and imaging investigations (months 13, 14 and 15).
Phase B#2: After this dose‐effect study “on‐topical,” subjects would be monitored monthly without application of topical lotions during the next 3 months (“off‐topical” at months 16, 17 and 18) to evaluate the weaning of the lotions while maintaining oral drug only.
2.3. Imaging technology
2.3.1. Global Images
The clinical aspect of the top of the head was recorded using an original standardized stereotactic headgear and positioning device including appropriate lightening, such that standard images would be taken at fixed angle and distance together with a range of colours as reported earlier.11, 12 These images were used for the expert rating of changes on a seven‐point scale (range from greatly decreased (−3) to no change (0) and up to greatly increased (+3)).11, 12
2.3.2. Contrast‐enhanced phototrichogram with exogen collection (CE‐PTG‐EC)
The CE‐PTG‐EC procedure would be used repeatedly all along the trial period on the region of interest (ROI) selected at baseline screening procedure. Imaging used a CCD camera equipped with Dermlight™ and without entering into the detailed protocol, the typical sequence consisted on a first visit (t0) of clipping of the scalp hair, dying of the clipped spot, and imaging . The CE‐PTG‐EC sequence was completed with a new image captured 2 days later (t2), immediately after a second hair dye session. The ROI was subject to non‐invasive extraction of the shedding hair employing a specific validated exogen removal process.9
2.4. Hair counts and measurement of productivity with functional hair parameters
Unless specifically mentioned, absolute numbers were used and will be given throughout the paper.
Reference values for healthy control males were published earlier.11
2.4.1. Exogen hair counts
The non‐invasively entrapped exogen hair were examined under a stereomicroscope at 40× magnification and reported as units/cm2.
2.4.2. Hair growth parameters
Source images were grouped by a lot of 3 at the same time: once given a randomized number, they were processed by qualified technicians. A field located in the centre of the image was outlined and secured that exactly the same follicular units would be analysed in the ROI throughout the study. As the surface differed from subject to subject, absolute data were converted as units/cm2.
2.4.3. Quality control
The accuracy of hair diameters and stubble length has been checked repeatedly during the assay using calibrated images. Technicians were blinded to patient, treatment and time throughout the study. From those and other test‐retest images, variability was less than 3%.10, 11
2.4.4. Hair analysis and generation of hair growth data
A customized software was used to perform computer‐assisted image analysis (CAIA) on processed images. After the perfect overlay of each calibrated individual fibre at t0 and at t2, the CAIA generated a large number of hair parameters.
In the fixed pool of targeted follicular openings, we measured hair diameter and growth. The increase in length of individual hair fibres was established on stubbles at t0 and t2. By dividing the increase in length by the exact time elapsed between t0 and t2, we measured linear hair growth rate as µm/24 h (LHGR).
2.4.5. Hair diameter
Each hair fibre was calibrated using rulers within the range from <20 to ≥100 µm.
This served for creating the following categories, where “a” and “b” being obviously produced by miniaturized hair follicles:
Nano‐hair with a diameter <20 µm. No growth staging was attempted on nano‐hair.
Vellus‐like hair was any hair thicker than a nano‐hair with a diameter ≤30 µm.
Intermediate hair was any hair with a diameter ≥40 and <60 µm.
Terminal hair was any hair ≥60 µm.
As the diameter threshold for vellus hair definition may vary between observers from the USA (30 µm) or EU (40 µm) and for the sake of clarity, the data in the tables will mention along with the presently described threshold or limits of diameter (≥20, ≥30, ≥40 µm or ≥50 µm, etc…).
2.4.6. Linear hair growth rate defines anagen growth staging
As with diameters, there was also a threshold for growth staging. Anagen was distinct from non‐growing stages (catagen‐telogen) based on distribution of elongation per time unit as measured at the scalp surface, that is linear growth rates (LHGR, µm/24 h) observed in male controls.10, 11
2.4.7. Compound index of hair growth
Productivity can be measured as it relates to growth within each thickness category. Therefore, we multiplied the diameter of each individual fibre by its linear growth rate. Summation of productivity calculated in each individual hair was grouped into one single value for all growing hair in the field. The interest of the calculation (see next section for details) of a single cumulative value was that it represented the coverage of scalp by hair within the clipped area, that is an analytical estimate of coverage. This was considered as a possible objective approach from the pharmacodynamics perspective as it would circumvent possible interference by styling that depends on patient and hairdresser in the context of global imaging.
2.5. Pharmacodynamics of hair regrowth and clinical relevance
2.5.1. Clinical meaning of analytical data
Compound index of hair growth (CIHG; µm2/d × cm2) reflects the fraction of scalp area under investigation that would be covered by daily hair growth. Calculation was the sum encompassing all diameter classes (classes taken one by one along with their own LHGR from 20 to ≥100 µm):
Average value of CIHG in MPHL can be expressed in regard to the average in control group (100%).
In order to estimate the clinical relevance of scalp hair growth parameters, we compared the baseline values of our panellists (m0) with those of 33 CE‐PTG‐EC analyses in healthy male controls.
Amongst other advantages, this would express the changes on drug in terms that can be understood by patients in terms of normalization. During treatment, one could report all data at once like: “How close to normal did your scalp produce hair at baseline? How well or how fast did the drug treatments bring your scalp hair closer to normal productivity? Does it fluctuate or remain stable over time” as it puts changes in a clinical perspective instead of explaining a host of abstract parameters (hair count, growth stage, diameter, various ratios, etc) that may be “statistically significant” improved or not.
2.5.2. Tracking on a “hair‐to‐hair basis”
A follow‐up study was planned in a limited subsample of follicular units in a few subjects on active combined drugs. The study required identification of identical follicular units over time bearing individual or more hair fibres at some stage. Monitoring started from the supposed maximal effect moving back in time during the “on‐topical” phase from m3 to m2 and m1 ending with baseline visits m0 and m‐1. The aim was to observe diameter along with linear hair growth rates of a sample larger than 100 hair fibres. Terminal hair and miniaturized hair tracked at exactly the same spot in repeat CE‐PTG‐EC images would be classified as hard evidence. In case of less than perfect overlay or small shift between follicular openings or in case of several hair fibres sprouting the same opening, the observation would be considered as blurred by “uncertainties.”
2.6. Statistical analysis
After completion of the study, all data were checked and frozen before sending as coded treatments to the independent statistical analysis unit. There were no missing data points.
The baseline hair variables for phase A were the values recoded at m0, that is at the end of the no‐treatment run‐in period. Baseline served for testing changes induced during the oral drug in combination with a placebo lotion or a minoxidil (5%, 1× per day) during the initial “on‐topical” period.
A new baseline before entering the phase B was established at month 12 just before entering the dose‐effect study of 2% vs 5% minoxidil associated after a 1 year on oral drug intake.
Hypothesis for variations of hair counts or functional hair parameters as changes versus baseline employed ANOVA. P values <.05 would be considered for qualifying a statistically significant difference, and relevance of ANOVA was confirmed in the context of multiple comparisons by Dunnett's test, for example between the topical treatment groups (phase A: 7 on MTS‐5% and 15 on control lotion or phase B: 7 on MTS‐5% and 7 on MTS‐2%).
Student's t test was used to evaluate statistical significance of baseline value in the MPHL group vs healthy male controls. The most synthetic parameter CIHG was also expressed in MPHL as a % of healthy males in order to put changes recorded with the analytical data into a clinically perspective, that is return to normal values.
3. RESULTS
3.1. Study population, compliance, drug and quality control
From the initial pool of subjects, 22 MPHL volunteers completed phase A and 14 entered and completed phase B.
The compliance with drug intake and application of topical lotions was measured and rated excellent: average oral intake during phases A and B, respectively, showed 0.98 and 1 pill/d (SD: A = 0.03, B = 0.06), while average lotion application during phases A and B, respectively, was 0.898 and 0.987 mL/d (SD: A = 0.03, B = 0.19). While 48 h was a theoretical option, the real time between t0 and t2 imaging sessions required for a complete CE‐PTG‐EC record was 48.14 h ± 2.34 (mean ± SD).
The maintenance of ROI and the quality of images was considered excellent (100%). Hence, paired images with a perfect overlay of t0 and t2 at all test sessions allowed exhaustive sampling of the same population of hair follicles in the ROI throughout the study. Accordingly, all hair growth parameters could be correctly generated for each individual participant at all planned visits.
3.2. Global imaging
Under the provision of maintenance of stable hairstyle by the hairdresser, global images typically reflected clinically perceivable changes as illustrated in Figure 1.
Figure 1.
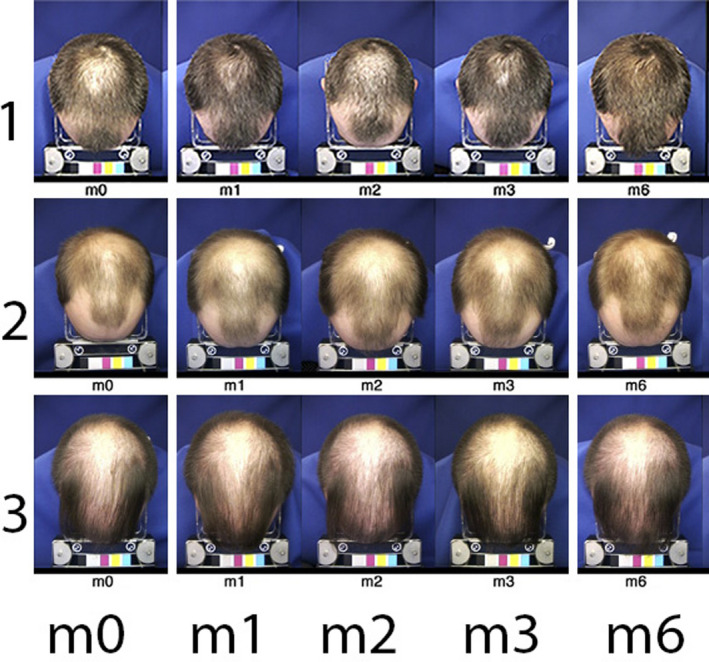
Global views of top of the head (Colour figure can be viewed at wileyonlinelibrary.com). Typical standardized images of the top of the head of subjects n° 1, 2 and 3. The timeline appears at the bottom line from baseline visit (m0) with treatment related aspects after 1, 2 or 3 mo (m1, m2 and m3, respectively) on combined oral finasteride and topical treatment with 5% minoxidil, that is during “on‐topical” or at the end of the 3‐mo “off‐topical” period (m6). From images at m3, subject n° 1 was rated as a good responder (moderately increased, +2), while subjects 2 and 3 were considered as less responsive (expert score no change 0 for subject n° 2 or slightly decreased −1 for subject n° 3). The measurement of productivity in the groups will be detailed in the next sections (along with other figures and/or tables). Global images taken at m6 show coverage that seems equal to/or better than the one recorded at m3 when topical applications of MTS5% ceased. As will be detailed later, the analysis after weaning (3‐mo period “off‐topical”; m6) showed all subjects had statistically significant shifts from anagen into telogen. In the group, we noted a decrease in total hair counts ranging between −7% and −25% from baseline density or −24% to −48% from m3. A dramatic change heralding hair shedding to follow rapidly, a shift that was un‐suspected from the global images[Colour figure can be viewed at wileyonlinelibrary.com]
3.3. Hair counts and functional parameters
3.3.1. Baseline characteristics of MPHL vs controls
Table 1 shows baseline hair parameters derived from the CE‐PTG‐EC images in the healthy male controls versus MPHL panellists as illustrated in Figure 2 (m0 t0 and m0 t2). The differences between healthy males and MPHL sufferers indicate clear‐cut deficiencies in the latter group as from the 12 displayed parameters, 10 showed a statistically significant difference between these two groups (P ≤ .0005). The relative percentages highlight the decreased scalp hair follicle performances with severe thinning and shortening of the anagen phase.
Table 1.
Controls and MPHL scalp hair structural and/or functional parameters
| Units | Parameter | Controls (Nl; n = 33) | MPHL (n = 22) | MPHL as % Nl | |||
|---|---|---|---|---|---|---|---|
| Mean | SD | Mean | SD | P | |||
| n/cm2 | Nano‐hair <20 µm | 4 | 4 | 30 | 18 | *** | 816 |
| n/cm2 | Anagen ≥20 µm | 227 | 47 | 101 | 50 | *** | 45 |
| Telogen ≥20 µm | 37 | 23 | 115 | 53 | *** | 309 | |
| n/cm2 | Anagen ≥30 µm | 221 | 47 | 84 | 48 | *** | 38 |
| Telogen ≥30 µm | 32 | 23 | 56 | 34 | *** | 172 | |
| n/cm2 | Anagen ≥40 µm | 206 | 40 | 67 | 45 | *** | 33 |
| Telogen ≥40 µm | 25 | 21 | 26 | 17 | 103 | ||
| n/cm2 | Anagen ≥50 µm | 189 | 33 | 57 | 43 | *** | 30 |
| Telogen ≥50 µm | 22 | 20 | 15 | 11 | 67 | ||
| n/cm2 | Exogen | 1 | 1 | 10 | 7 | *** | 780 |
| LHGR | Hair diameter (D; µm) | ||||||
| µm/24 h | 30 µm ≤ D < 60 µm | 319 | 32 | 260 | 38 | *** | 82 |
| µm/24 h | D ≥ 60 µm | 380 | 34 | 340 | 53 | *** | 90 |
The first columns show units applicable to a range of hair structural or functional parameters. These parameters appear in the next column along with thinnest hair (nano‐hair <20 µm) followed by thicker ones separated into anagen (bold) and telogen (italic) (with limits of diameters ≥20 µm up to ≥50 µm) and exogen hair ending with linear hair growth rates described according to a range of diameters (LHGR, µm/24 h; D between 30 and 60 µm or over 60 µm). Statistics (average and standard deviation respectively mean and SD) of absolute values are given next and appear, respectively, for data recorded in healthy males (controls; Nl; n = 33) comparatively with baseline values recorded at month 0 in panellists (MPHL; n = 22) followed by P values. With the exception of densities of intermediate‐terminal telogen (diameters ≥40 and ≥50 µm), all differences were statistically significant (***P values ≤.0005). The last column displays the average values in MPHL as a percentage of averages found in controls (MPHL as % Nl), and the variations reflect shortening of the duration of anagen phases when thinner hair categories are included.
Figure 2.
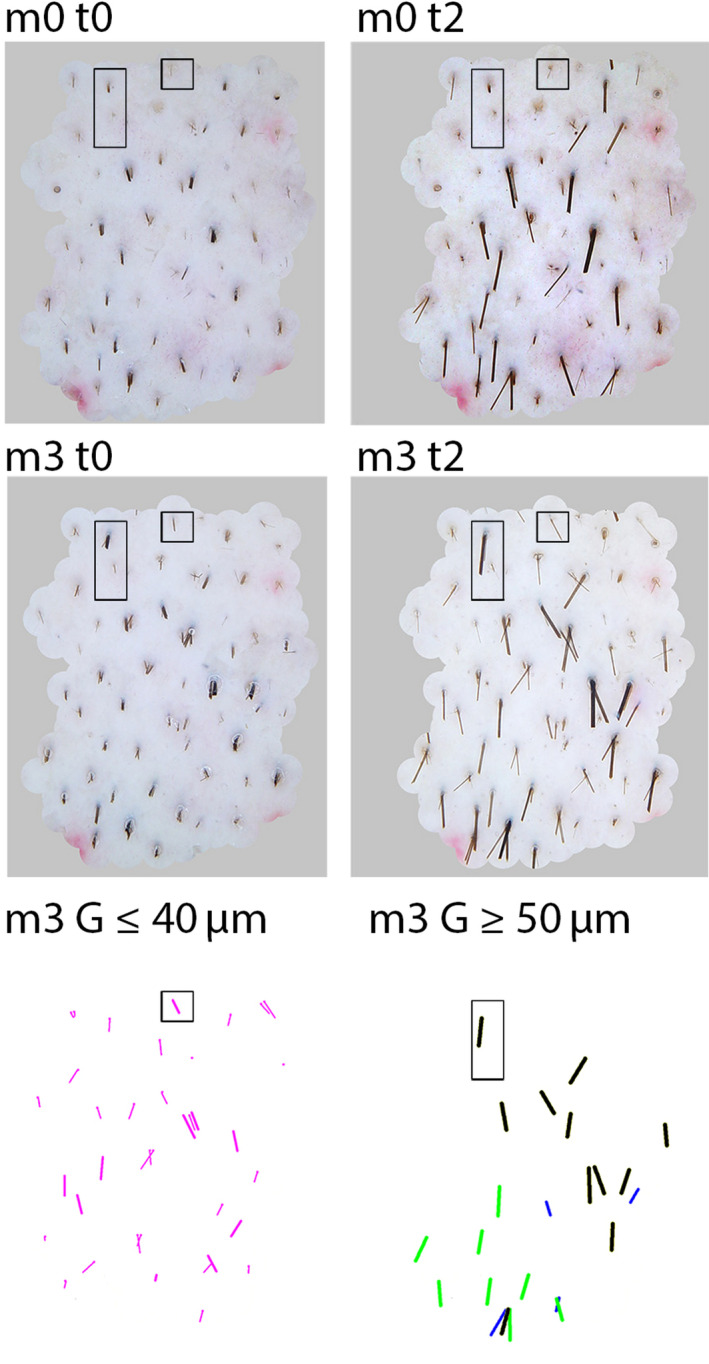
From combined static images to dynamic structural and functional figures (Colour figure can be viewed at wileyonlinelibrary.com). CE‐PTG‐EC images taken at baseline immediately after clipping (m0 t0) and 48 h later (m0 t2) are shown in the top panels in comparison with the same sites after 3 mo (m3 t0 and m3 t2) of combined treatment, that is oral finasteride (1 mg/d) and topical lotion containing minoxidil 5% (1 mL/d). The rectangle and square outline 2 interesting fibres. The square shows a target with a miniaturized non‐growing hair at baseline but growing at m3, while the rectangle outlines a field with a terminal 80‐µm hair, telogen at baseline (m0 t0 and t2) and anagen on the images taken at m3 (m3 t0 and m3 t2). From the combination of the 2 latter, the processed images for CAIA show growth at m3 G in the 2 bottom panels where all thinning hair (left; diameter ≤40 µm) and thicker intermediate‐terminal hair (right; diameter ≥50 µm) are shown separately. Comparing the length of fibres ≤40 µm (bottom left) and ≥50 µm (bottom right), one clearly observes longer fibres in the latter reflecting obviously faster growth. Even amongst the intermediate‐terminal fibres (bottom right only), the thickest ones (≥70 µm; black lines) appear longer than the smaller (50 and 60 µm diameter; paler lines). The targets will be used as a tutorial illustrating the process for individual hair follicle follow‐up (square for fibre #01 and rectangle for fibre #02 shown further in Figure 5) and a more extended analysis (Figure 6)[Colour figure can be viewed at wileyonlinelibrary.com]
3.3.2. Hair parameters at baseline and changes after combined drug treatment
Hair parameters were not statistically significantly different in the 2 test groups (MTS vs control) before entering the “on‐topical” of phase A (baseline, m0; Table 2).
Table 2.
The data in first two columns show units applicable to a range of hair parameters like in Table 1, and the 3rd column separates the two treatment groups (minoxidil 5% topical solution; MTS (n = 7) vs control lotion (n = 15)). Table displays first thinnest hair data (nano‐hair <20 µm) followed by thicker hair data separated into anagen (bold) and telogen (italic) and finally shedding or exogen hair and lastly growth rates (LHGR) of thinner and thicker hair fibres
| Units | Parameter | Group topical | No‐treatment | On‐topical | Off‐topical 3 mo | |||||||||
|---|---|---|---|---|---|---|---|---|---|---|---|---|---|---|
| Baseline (m0) | Change from baseline m0 | Change from m0 | Change from m3 | |||||||||||
| m1 | m2 | m3 | m6 vs m0 | m6 vs m3 | ||||||||||
| Mean | SD | P | P | P | P | P | ||||||||
| n/cm2 | Nano‐hair <20 µm | MTS | 34.7 | 26 | −2.2 | −5.1 | −8.4 | −18.6 | * | −10.1 | ||||
| Control | 23.9 | 6.1 | 3.4 | −3.6 | 4 | 2 | −1.9 | |||||||
| n/cm2 | Anagen ≥20 µm | MTS | 128.8 | 65 | −1.9 | 57.5 | * | 81.2 | *** | −29.6 | −110.8 | *** | ||
| Control | 96.7 | 44.7 | 0.8 | 11 | 5.5 | −4 | −9.5 | |||||||
| Telogen ≥20 µm | MTS | 104.5 | 36.3 | −6.6 | −15.2 | −33.2 | * | 47.7 | * | 80.9 | *** | |||
| Control | 108.1 | 52.1 | −9.8 | −0.4 | −5.2 | 7.4 | 12.6 | |||||||
| n/cm2 | Anagen ≥30 µm | MTS | 108.5 | 61.9 | 0 | 46.4 | * | 68.5 | ** | −22.5 | −91 | *** | ||
| Control | 79.8 | 44.8 | 3.4 | 4.8 | 6.5 | −3.8 | −10.2 | |||||||
| Telogen ≥30 µm | MTS | 67.4 | 40 | 2.7 | −10.3 | −14.4 | 53.1 | * | 67.5 | * | ||||
| Control | 41.7 | 13.8 | 1 | 4.1 | 2.4 | 9.9 | 7.5 | |||||||
| n/cm2 | Anagen ≥40 µm | MTS | 82.4 | 57 | −1.7 | 36.6 | * | 57.7 | ** | −12.6 | −70.3 | *** | ||
| Control | 69.2 | 48 | 1.3 | 2.2 | 1.9 | −2.3 | −4.3 | |||||||
| Telogen ≥40 µm | MTS | 34.8 | 19.9 | −2 | −5.1 | −5 | * | 40.9 | * | 45.8 | ** | |||
| Control | 20.4 | 10.9 | −2.4 | 1.2 | 4.5 | 4.4 | 0 | |||||||
| n/cm2 | Anagen ≥50 µm | MTS | 68 | 50.6 | −0.9 | 26.9 | 44.2 | ** | −8.7 | −52.8 | ** | |||
| Control | 60.8 | 49.3 | 2.9 | 3.3 | 1.5 | −1.9 | −3.4 | |||||||
| Telogen ≥50 µm | MTS | 21.3 | 10.9 | −0.2 | −2.4 | ‐5 | * | 26.6 | * | 31.6 | ** | |||
| Control | 12.8 | 10.6 | −1.3 | −1.3 | 4 | 1.4 | −2.6 | |||||||
| n/cm2 | Exogen | MTS | 10.143 | 5.24 | 6.57 | 15 | * | −0.29 | 2.29 | 2.57 | ||||
| Control | 11.53 | 8.77 | 2 | 1.99 | 2.19 | 1.72 | −0.47 | |||||||
| LHGR | Hair diameter (D; µm) | |||||||||||||
| µm/24 h | 30 µm ≤ D < 60 µm | MTS | 256.2 | 53.3 | −13.9 | −11.7 | 19.1 | 2.2 | −16.9 | |||||
| Control | 267.5 | 41.5 | −20.5 | −7.8 | 7.6 | −34.9 | −42.5 | |||||||
| µm/24 h | D ≥ 60 µm | MTS | 369 | 39.2 | −56.3 | −45.1 | −64.5 | −50.9 | 13.5 | |||||
| Control | 351.7 | 64.9 | −20.4 | 7.7 | 14.1 | −33.9 | −48.1 | |||||||
Descriptive statistics of absolute values (mean and SD) are shown at baseline before drug administration (m0) and there were no statistically significant differences between MTS and control lotion groups at baseline. Changes from baseline recorded during the 3 mo of combined drug administration (oral finasteride during “on‐topical” period; m1, m2 and m3) are shown each month and are followed by a display of P values *≤.05, **≤.005, ***≤.0005. The last columns show changes during maintenance of oral drug intake after weaning of topicals (“off‐topical” 3 mo) as compared either to baseline (change from m0; m6 vs m0) or to the last topical applications (change from m3; m6 vs m3), and each time point is followed by the P values. At m3 in the group applying the topical lotion containing MTS5%, there were significant increases in anagen hair in all classes of diameter and decreases in all telogen hair counts (except those grouping diameters ≥30 µm) indicating recruitment of scalp hair follicles into the growth phase. Of note is that all absolute anagen increases exceeded absolute telogen decreases suggesting recruitment of dormant‐empty hair follicles. The collection of exogen hair raised as from m1 but statistically significantly peaked at m2. There was no modification in LHGR. After weaning of topicals but maintenance of oral drug intake, all telogen counts significantly increased as compared to baseline (m6 vs m0), while all anagen counts dropped and all telogen increased at m6 in comparison with m3 (m6 vs m3). The “post‐minoxidil rebound” is reflected by increased resting hair (m6 vs m3 and m6 vs m0). Oral drug with control lotion did not statistically significantly fluctuate during the 6‐mo follow‐up.
During phase A, there were a series of statistically significant variations indicating a positive effect of the combination of oral finasteride with once‐a‐day topical minoxidil 5% as compared to oral drug with control lotions where no change from baseline was observed (Table 2 and Figure 3).
Figure 3.
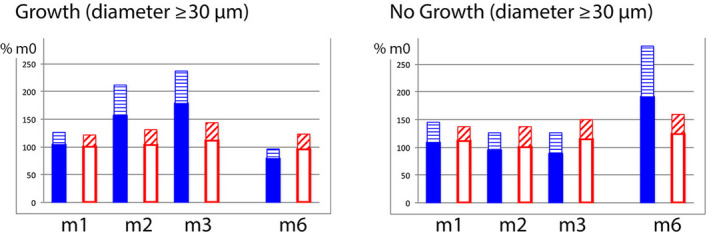
Growing and non‐growing hair pool on oral drug treatment during and after topical lotions. In order to illustrate changes on combined treatment, we calculated absolute values at tx (m1, m2, m3 or m6) relative to baseline values (m0; considered as 100%; Colour figure can be viewed at wileyonlinelibrary.com). The two panels show growing (left; average anagen) and non‐growing (right; average catagen‐telogen) hair with a diameter ≥30 µm. The combined drug group with 5% minoxidil lotion (plain bars) reflects increased average growth as compared with the combined drug group applying control lotion (empty bars). The hatched bar appearing on top reflects standard deviation. Interestingly, the variations in anagen/telogen occur specifically during treatment or after the weaning of topical MTS 5% with no evidence that the duration of telogen would be significantly affected. Indeed, there was no change in catagen‐telogen fraction (m1, m2 and m3 in the panel on the right) until after withdrawal of topical minoxidil with completion of the catagen‐telogen phase (m6). This indicates that the regression wave from growth to rest will not be prevented by oral intake of finasteride alone, that it represents a “rebound” phenomenon and that it will turn soon in a major hair shedding phase after the 3rd month post‐MTS 5%[Colour figure can be viewed at wileyonlinelibrary.com]
Changes in hair follicle performance in the minoxidil 5% lotion were an early specific and statistically significant completion of the exogen release (m2), initiation of anagen (m2 and m3) and lastly, at m3, a reduction of telogen. The latter results from the combined efflux of exogen and follicular influx into anagen. Maintenance in anagen results in a depletion of the usual entry into telogen associated with a short anagen phase and as a consequence leads to decreased telogen counts.
The values indicate earlier statistical significance for improvement of growth when diameter categories included the miniaturized hair as from m2 followed by intermediate and finally the terminal hair as from m3.
Of note is that the growth induction (increased anagen hair counts) rapidly numerically exceeded the reduction in telogen hair counts. This dynamic phenomenon is consistent with recruitment of dormant follicular units into an active hair productivity. This was observed for all diameter categories as well during the first “on‐topical” assay (phase A) as during the second “on‐topical” assay (phase B). The latter also points to the fact that even after 12 months on oral finasteride, all possible units were not optimized in terms of production as can be easily drawn from Table 3.
Table 3.
MPHL scalp hair structural and/or functional parameters after the first 12 months on oral drug treatment.
| Units | Parameter | Group Topical | Finasteride | On‐topical | Off‐topical | |||||||||||
|---|---|---|---|---|---|---|---|---|---|---|---|---|---|---|---|---|
| Baseline (m12) | Change from baseline m12 | Change from baseline m12 | ||||||||||||||
| m13 | m14 | m15 | m16 | m17 | m18 | |||||||||||
| Mean | SD | P | P | P | Off‐m1 | P | Off‐m2 | P | Off‐m3 | P | ||||||
| n/cm2 | Nano‐hair <20 µm | MTS 2% | 36 | 19 | −2 | −3 | −1 | −13 | ** | −6 | −8 | ** | ||||
| MTS 5% | 39 | 26 | 3 | −8 | −8 | −4 | −8 | 0 | ||||||||
| n/cm2 | Anagen ≥20 µm | MTS 2% | 77 | 90 | 19 | 48 | 42 | 23 | 4 | 8 | ||||||
| MTS 5% | 85 | 64 | 14 | 61 | 51 | 21 | −5 | −1 | ||||||||
| Telogen ≥20 µm | MTS 2% | 125 | 81 | −18 | −38 | −22 | 10 | 8 | 11 | |||||||
| MTS 5% | 145 | 57 | −21 | −50 | −28 | −6 | 13 | 4 | ||||||||
| n/cm2 | Anagen ≥30 µm | MTS 2% | 72 | 54 | 18 | 40 | 41 | 24 | 3 | 4 | ||||||
| MTS 5% | 77 | 31 | 10 | 54 | 54 | 23 | −2 | −3 | ||||||||
| Telogen ≥30 µm | MTS 2% | 94 | 60 | −26 | −36 | −19 | 7 | 7 | −4 | |||||||
| MTS 5% | 110 | 56 | −21 | −45 | −31 | −7 | 17 | 9 | ||||||||
| n/cm2 | Anagen ≥40 µm | MTS 2% | 63 | 53 | 14 | 28 | 33 | 17 | 2 | 0 | ||||||
| MTS 5% | 62 | 32 | 6 | 31 | 42 | 23 | 3 | −3 | ||||||||
| Telogen ≥40 µm | MTS 2% | 43 | 30 | −9 | −16 | −6 | 10 | 10 | 8 | |||||||
| MTS 5% | 56 | 32 | −8 | −23 | −18 | −2 | 19 | 22 | * | |||||||
| n/cm2 | Anagen ≥50 µm | MTS 2% | 58 | 52 | 8 | 16 | 27 | 11 | 1 | −2 | ||||||
| MTS 5% | 52 | 32 | 4 | 19 | 24 | 18 | 1 | −4 | ||||||||
| Telogen ≥50 µm | MTS 2% | 21 | 14 | −4 | −6 | 0 | 12 | 10 | 9 | |||||||
| MTS 5% | 25 | 17 | −5 | −12 | −7 | 2 | 12 | 13 | ||||||||
| n/cm2 | Exogen | MTS 2% | 7 | 5 | 1 | 1 | 0 | 2 | 3 | 0 | ||||||
| MTS 5% | 9 | 4 | 11 | * | 5 | * | 3 | 4 | 12 | * | 10 | * | ||||
| LHGR | Hair diameter (D; µm) | |||||||||||||||
| µm/24 h | 30 µm ≤ D < 60 µm | MTS 2% | 215 | 46 | 7 | 8 | 4 | 14 | 14 | 11 | ||||||
| MTS 5% | 229 | 29 | −4 | −2 | −11 | −6 | −2 | −6 | ||||||||
| µm/24 h | D ≥ 60 µm | MTS 2% | 297 | 79 | 11 | 10 | 10 | 13 | 1 | −13 | ||||||
| MTS 5% | 304 | 57 | −8 | 3 | −7 | −18 | −33 | −12 | ||||||||
The first 2 columns display parameters like in Tables 1and 2, and the 3rd column splits data according to the randomized double‐blind dose‐range study (2% vs 5% minoxidil topical solution, MTS; each group n = 7; anagen appears in bold as opposed to telogen). The new baseline was established as all participants complied with oral intake of finasteride (1 mg/d for 1 y; m12) before entering the 3‐month “on‐topical” (change from m12; m13, m14, m15, next column P values) followed by a monthly visit during the 3 mo of weaning lotion while staying on oral drug (“off‐topical”; change from baseline m12 recorded at m15; m16, m17, m18, respectively, off‐m1, off‐m2 and off‐m3, next column P values). As no statistically significant differences did exist between m0 and m12 baselines, we considered that the groups, though smaller, were similar to those at entry into the trial (Table 1). Generally, anagen counts increased and telogen decreased during the m13‐m15 “on‐topical” period but changes did not reach statistical differences. Exogen release peaked statistically significantly at m13 and m14, that is within the 2 mo of application of the MTS 5%. Exogen was also released significantly during weaning from the MTS 5% application, for example m17 and m18 which was after 2‐ and 3‐mo weaning. Average values of LHGR were not significantly modified after m12 by re‐introduction of the combined treatment regimen.
The telogen hair counts did not show major variations relative to baseline except for a “rebound phenomenon,” that is higher counts at m6 vs m0 (Table 2, Figure 4) and at m18 vs m12 (Table 3).
Figure 4.
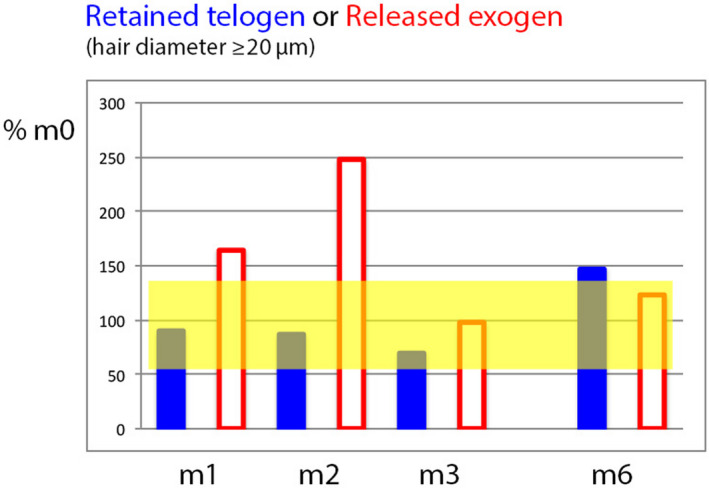
Relative telogen and exogen counts during and after combined active (oral finasteride + topical minoxidil 5%) drug treatment in MPHL (Colour figure can be viewed at wileyonlinelibrary.com). This graph shows how the non‐growing hair fraction in MPHL can be split into telogen (firmly anchored to the follicle; plain bars) and exogen hair (progressive detachment from the old telogen hair follicle; empty bars). Data were expressed relative to baseline telogen or exogen hair counts where m0 data represent 100%. The paler area shows the range between maximum and minimum (calculated from average ±2SD of telogen and exogen which had almost the same % range). Compared to the range of data recorded at baseline, MPHL telogen hair counts remained rather stable (m1, m2) until a decrease occurred at m3. This results from a 2‐edged mechanism: on the one hand side, precocious completion of the exogen phase results in the gradual exhaustion of telogen pool (empty bars especially at m1 and m2 returning to baseline values at m3) combined on the other hand side by maintenance of roots in anagen which depletes the usual high‐rate influx into telogen in MPHL. At 6 mo (m6), that is 3 mo on finasteride without active lotion, the weaning of minoxidil is associated with a rebound phenomenon (telogen exceeds the range found at baseline) as compared to the control lotions (data in Table 2 displayed in Figure 3) where telogen at m6 stay within the baseline range. The exogen is not yet accomplished at m6 but will result in shedding in the near future[Colour figure can be viewed at wileyonlinelibrary.com]
From Tables 2 and 3, we conclude that oral finasteride alone did not maintain the productivity initiated during the 3 months of combined actives and what appeared clear at the end of the weaning phase (m3; phase A#3) recurred as from the first month “off‐topical” (m16 after withdrawal of the weaker 2% MTS and m17 of the stronger 5% MTS) and finally became statistically significantly different from the m12 baseline i.e. at m2‐m3 of phase B#2 after withdrawal of MTS 5% with increased telogen along with a significant increase of exogen hair release (m17 and m18).
Interestingly, the average growth rate of scalp hair in MPHL was lower at baseline and affected all diameter categories in comparison with LHGR of healthy males (Table 1). Overall linear growth rates on drug treatment (whatever the combination and duration) were not statistically significantly modified on the various drug regimens tested in these assays (Tables 2 and 3).
However, we were triggered by transiently statistically significantly increased values of LHGR in some hair fibre categories (eg, 20, 30 and 40 µm diameters) during the first 2 months of combined drug treatment (data not shown). For example, the influx of new 30‐µm hair into the anagen phase showed increased LHGR (P = .0064) from their baseline LHGR of 232 µm/24 h to 258 and 263 µm/24 h, respectively, at m1 and m2; this relative increase of 11% and 14% returned back to baseline levels at m3, while panellists were still on combined application of MTS 5% and oral intake of finasteride. At m3, LHGR was 246 µm/24 h. This peculiar aspect should not to interpreted as “increased growth rates on minoxidil” as will be illustrated in a further section dealing with tracking of individual hair fibres.
3.3.3. Tracking on a “hair‐to‐hair basis”
A follow‐up study in two subjects on combined drugs allowed identification of 53 follicular units bearing a total of 126 individual hair fibres. Monitoring started with individual hair characterization at m3. For each hair, we tracked backwards in time from m3 to m2 and m1 during the “on‐topical” phase and ended tracking with baseline images (m0 and m‐1). A total of 630 observation points were collected over the pre defined 5 time points.
Terminal hair grew mostly from pre‐existing terminal hair (eg anagen or telogen, occasionally completing exogen just before entering the “on‐topical” phase). It appeared that about 4%‐5% of miniaturized hair might transform into thicker hair: there were five miniaturized hair at baseline visits that were located at the same spot in CE‐PTG‐EC images showing later on a terminal hair. There were also seven other miniaturized hair had to be classified as “uncertainties” mainly because of small shift between various hair fibres growing from the same opening (sometimes up to four fibres per opening). Finally, there were also 75 miniaturized hair that stayed miniaturized at the end of combined drug treatment (m3). Accordingly, around 85% of miniaturized remain unaffected in terms of diameter by the combined treatment.
Hence, MTS effect is mainly due to accelerated re‐launching miniaturized and terminal anagen from non‐productive, that is telogen, exogen or empty scalp follicles. Their structural characteristics remained stable under treatment except for induced‐prolonged anagen with either miniaturized or terminal hair.
If the design or the technology cannot absolutely rule out the “reversal hypothesis,” we herein produced enough evidence to consider that, if at all happening, reactivation remains a minor (4%‐5%) or an uncertain (7%) event. In the latter situation, the re‐activated hair follicles showed limited growth potential with slower growth rates and/or short duration of anagen. Clinicians quoted these as “peach‐fuzz” or “minoxidil hair.”
The fate of some follicles pertaining to this pool of structurally miniaturized and functionally incompetent in comparison with terminal hair “roots” is illustrated in Figures 5 and 6.
Figure 5.
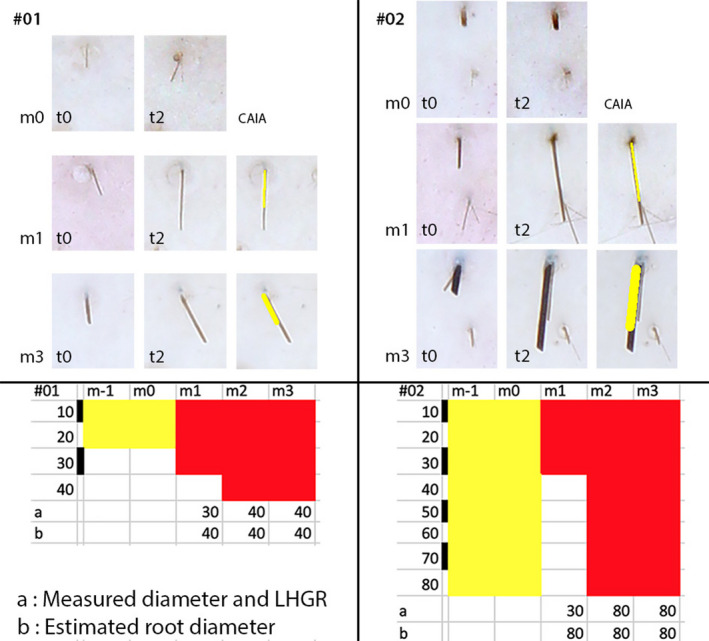
Measured diameter and growth rate at the scalp surface compared to the estimated root diameter from surface growth rates (Colour figure can be viewed at wileyonlinelibrary.com). The diameter and linear growth rate (LHGR measured on images taken of the scalp surface) are from the inserts appearing in Figure 2 (square with a miniaturized hair (#01; panels on the left) and rectangle (#02; panels on the right)). The selected fibres are shown at baseline (m0 t0 and m0 t2) after 1 mo on combined finasteride and minoxidil 5% topical lotion (m1 t0 and m1 t2) and at the end of the combined treatment (m3 t0 and m3 t2). For m1 and m3, we also display the overlay used to make LHGR measurements by CAIA (paler field placed on top of the fibre). Typically, the length reflects growth rate of miniaturized hair shown in #01 (see CAIA m1 and m3) which is shorter than the length appearing in #02. The terminal hair follicle produces initially a fibre with a diameter similar to a miniaturized hair (#02, m1) but at a higher growth rate (typically LHGR of a 80‐µm hair). The full expression of this follicle appears not only at m3 but was already present at m2 as shown in the bottom tabular presentation. Therefore, the LHGR measured at the surface reflects the diameter of the hair within the root of the follicle. At the bottom, the tabular display summarizes the 5‐mo follow‐up of those miniaturized and terminal follicles (respectively, #01 and #02) and the scale bar for hair diameter is shown with a step of 10 µm from 10 to 40 µm or even 80 µm (respectively, below #01 on the left and below #02 on the right). On the bottom left, #01 the line beginning under “a” shows that the 20 µm telogen at baseline (m‐1 and m0) entered anagen first as a 30‐µm hair at m1. Then, it enlarged up to a 40 µm diameter and stayed anagen growing at a rate typical for a 40 µm follicle at m2 and 3 (as shown in “b”). Hence, the root thickness can be derived from the speed of growth seen at the surface. On the bottom right, #02 “a” shows that the 80 µm resting hair, telogen at baseline (m‐1 and m0), entered anagen first as a 30‐µm hair at m1. The growing tip appeared later as an 80‐µm fibre at m2 and 3. The growth rates measured in “a” at m1 were, however, already typical of an 80‐µm hair root as indicated in “b.” This hypothesis is being confirmed by the diameter and growth rates appearing at the scalp surface during m2 and m3. The method detailed herein will be used for illustrating the study of 8 individual hair in another subject (Figure 6) and also for establishing dynamics of 126 individual hair fibres (see results section)[Colour figure can be viewed at wileyonlinelibrary.com]
Figure 6.
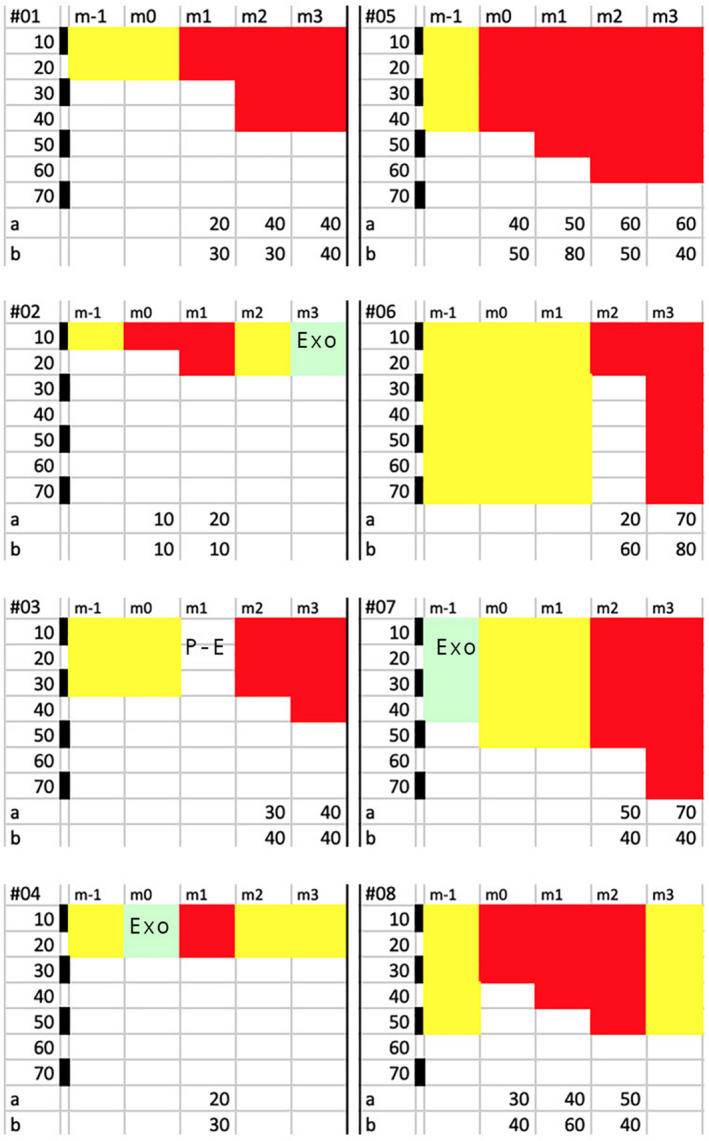
Individual hair follow‐up before and during combined drug treatments (oral finasteride with 5% minoxidil topical lotion; Colour figure can be viewed at wileyonlinelibrary.com). The top line displays the 5‐mo follow‐up period (m‐1 to m3) during which the 8 individual hair fibres (#01 to #08) will be tracked with diameter and growth stages (catagen‐telogen (paler hue), exogen (EXO or Post‐Exo (P‐E) ) or anagen (darker hues). For each hair fibre, the top row shows the 5 timelines (from m‐1 to m3), while the bottom rows (appearing as “a” or “b”) displays the category of diameter that was actually measured (a; µm) or the root diameter that would be derived from the measured linear growth rates (b; µm). Backwards monitoring started at the end of combined oral finasteride and topical minoxidil period. After examining follicular openings at month 3 (m3), we tracked the individual fibre moving back in time (m2, m1) until baseline (m‐1 and m0). Each panel illustrates the results of follow‐up made on miniaturized hair fibres (left; #01 to #04) and terminal ones (right; #05 to #08). Each field shows on its extreme left a calibration bar (black and white spaces; each 10 µm as labelled µm from 10 to 70 µm) that helps dealing with the measured hair diameter (appearing as “a” at the bottom line a for each hair #01 to #08). Most of the miniaturized hair seen at the scalp surface grew at rates consistent with productivity of miniaturized follicles (#01‐#04), while a variety of LHGR was observed in the terminal hair (see initial anagen phases of hair #06 and #08). The complexity of the phenomenon deserves a specific comment on fibre‐to‐fibre basis, while follicles were on combined drug regimen: #01: Telogen at baseline (20 µm; m‐1 and m0) evolves into anagen 20‐µm and 40‐µm hair with a growth rate consistent with miniaturized hair (#01 b LHGR similar to 30‐µm to 40‐µm hair follicle). #02: Telogen (10 µm; m‐1) that enters anagen (10‐20 µm; m0‐m1) growing at a very slow rate (#02b LHGR usually found in thinnest fibres with a 10 µm diameter). Anagen shows a short growth period as it enters telogen (m2) and proceeds into exogen (m3) while on combined drugs. #03: Telogen (30 µm) turning into an empty opening (P‐E i.e. Post‐Exogen at m1) and regrows a 30‐ to 40‐µm hair on drugs with a growth rate usually found in a hair follicle capable of growing a 40‐µm hair (#03b). #04: After 1 mo in telogen hair (m‐1), hair turns into exogen (m0) and the follicle grows a very thin anagen hair (20 µm; m1) with a LHGR (#04b equal to LHGR found in a 30‐µm hair) before returning into a non‐productive phase (m2, m3) while on combined drugs. #05: Telogen (40 µm) rapidly turns into anagen (40‐50 µm during m0 and m1, 60 µm at m2 and m3). The growth rate is consistent with a terminal follicle (“b” points to a growth range from a hair follicle between 50‐ and 80‐µm hair) before slowing down at m3 (the 40 µm LHGR indicates defective function). #06: Telogen hair (70 µm) gives way to initial 20‐µm anagen fibre with a growth rate equal to a 60‐µm hair follicle (m2). One month later, the diameter exhibits its full thickness (70 µm). #07: At m‐1, the 40 µm exogen gave rise to a telogen hair (50 µm) probably reflecting an uncertainty (duration of anagen less than 1 mo?). On combined drug, the intermediate‐terminal anagen (50 and 70 µm at m2 and m3, respectively) grew at suboptimal LHGR (#07b equal to a LHGR usually found in a 40‐µm hair follicle) highlighting defective productivity. #08: Telogen (50 µm) hair is replaced before drug by anagen (30 µm) with increasing diameter during drug treatment (m1, m2) and faster growth (equal to a 60‐µm hair follicle, m1). In “b,” there is clear‐cut slowing down (40 µm, m2) reflecting entry into catagen and proceeding into telogen (obvious at m3) while on combined drug regimen[Colour figure can be viewed at wileyonlinelibrary.com]
3.3.4. Clinical relevance of analytical data
Since the early 80, hair count methods have been criticized because they would not reflect the clinical perception by external observers or by the patients themselves. A range of clinical patterns and questionnaires was proposed as “new tools,” but none was calibrated or validated before use. Therefore, herein we innovate and propose two different approaches.
Firstly, we present MTS 5% and oral drug‐induced changes relative to the maximum possible level of normalization (Table 4). It is clear from the description of intermediate‐terminal hair (diameter ≥40 and ≥50 µm) there is only a marginal move from the deficient baseline towards normal values as anagen proportions increased from 40% to 68% (≥40 µm) and from 36% to 59% (≥50 µm). However, when all hair with a diameter ≥20 µm were considered, the anagen counts moved from 57% at baseline to 93% of normal anagen hair counts after 3 months on combined drugs. This illustrates that the miniaturized hair follicles are a major contributor to the therapeutic response. In terms of duration (or length of scalp hair), the latter may suffer from their short maximal length (2‐3 cm). Hence as opposed to rather impressive counts of growing elements, their production might be of little clinical or cosmetic relevance.
Table 4.
Entire values of hair parameters in the combined oral finasteride and topical minoxidil 5% (same group as in Table 2; n = 7; MPHL) recorded at baseline (no‐treatment baseline; m0) and after 3 mo of combined drug treatment (MPHL on‐topical; change m3 vs m0) followed by healthy male controls (Normal males; n = 33) and finally by MPHL values expressed relative to the values recorded in healthy males (MPHL as % of Normals; Nl = 100%) at m0, baseline and at m3 on combined drugs (Fin + MTS)
| Units | Parameter |
MPHL (n = 7) Group topical |
MPHL | MPHL on‐topical | Controls | MPHL as % of normals | |||||
|---|---|---|---|---|---|---|---|---|---|---|---|
| No‐treatment | Change m3 vs m0 | Normal males (n = 33) | At m0 | At m3 | |||||||
| Baseline (m0) | P | Baseline | Fin + MTS | ||||||||
| Mean | SD | ABS | Mean | SD | |||||||
| n/cm2 | Nano‐hair <20 µm | MTS‐5% | 35 | 26 | −8 | 26 | 4 | 4 | 944 | 716 | |
| n/cm2 | Anagen ≥20 µm | MTS‐5% | 129 | 65 | 81 | *** | 210 | 227 | 47 | 57 | 93 |
| Telogen ≥20 µm | MTS‐5% | 105 | 36 | −33 | * | 71 | 37 | 23 | 281 | 192 | |
| n/cm2 | Anagen ≥30 µm | MTS‐5% | 109 | 62 | 69 | ** | 177 | 221 | 47 | 49 | 80 |
| Telogen ≥30 µm | MTS‐5% | 67 | 40 | −14 | 53 | 32 | 23 | 207 | 163 | ||
| n/cm2 | Anagen ≥40 µm | MTS‐5% | 82 | 57 | 58 | ** | 140 | 206 | 40 | 40 | 68 |
| Telogen ≥40 µm | MTS‐5% | 35 | 20 | −5 | * | 30 | 25 | 21 | 137 | 118 | |
| n/cm2 | Anagen ≥50 µm | MTS‐5% | 68 | 51 | 44 | ** | 112 | 189 | 33 | 36 | 59 |
| Telogen ≥50 µm | MTS‐5% | 21 | 11 | −5 | * | 16 | 22 | 20 | 95 | 73 | |
| n/cm2 | Exogen | MTS‐5% | 10 | 5 | 0 | 10 | 1 | 1 | 792 | 769 | |
| LHGR | Hair diameter (D; µm) | ||||||||||
| µm/24 h | 30 µm ≤ D <60 µm | MTS‐5% | 256 | 53 | 19 | 275 | 319 | 32 | 80 | 86 | |
| µm/24 h | D ≥ 60 µm | MTS‐5% | 369 | 39 | −65 | 305 | 380 | 34 | 97 | 80 | |
At baseline, the anagen hair densities (bold) ranged from 57% to 36% of controls, while telogen densities ranged from 281% to 95% depending on the diameter categories (from ≥20 µm till ≥50 µm). Nano‐hair and exogen hair counts exceeded 7‐fold control values (respectively, 944% and 792%). When values recorded after 3 mo of combined drug treatment are displayed (last column) in regard to baseline performance of MPHL subjects, the therapeutic result (improvement) may seem encouraging (almost doubling of anagen for diameters including 20‐ and 30‐µm hair). However, taking into account only the terminal hair (diameter ≥50 µm), the persistent slow growth rates and the rather moderate changes of anagen/telogen, point to short duration of anagen which is disappointing from the clinical perspective. The trend for slowing down of LHGR in intermediate‐terminal hair (dropping from 97% of controls at baseline to 80% at m3) points towards reactivation of functionally deficient hair follicles. Therefore, new approaches are being developed aiming at an objective parameter that might have more consistent clinical relevance (see Figure 7 based on the methodology detailed in Figures 5 and 6).
Secondly, in the present experimental approach, all single hair data were grouped and converted into a compound productivity index as detailed in the Material and Methods section. Accordingly, MPHL CIHG values recorded at baseline and during the “on‐topical” lotion (phase A#1) are displayed in Figure 7 relative to CIHG found in controls males (average of n = 33 = 100%). The CIHG doubles at month 3, and it objectively reflects the transient improvement in the group on combined oral and topical treatment. However, the peak responses barely exceed 60% of the average “normal” productivity. It is interesting to note that global photographs (Figure 1) also suggest a stable mass of hair at m6 as compared to m3 images, while at the root level a substantial shift took place from anagen to telogen (Table 2) along with a drastic 50% reduction from the peak productivity at month 3 (Figure 7) heralding a substantial hair shedding about to begin after completion of exogen processing. These fluctuations occurred only during the combined drug regimen and point to the “stabilizing effect” of finasteride and the “boosting” effects of minoxidil.
Figure 7.
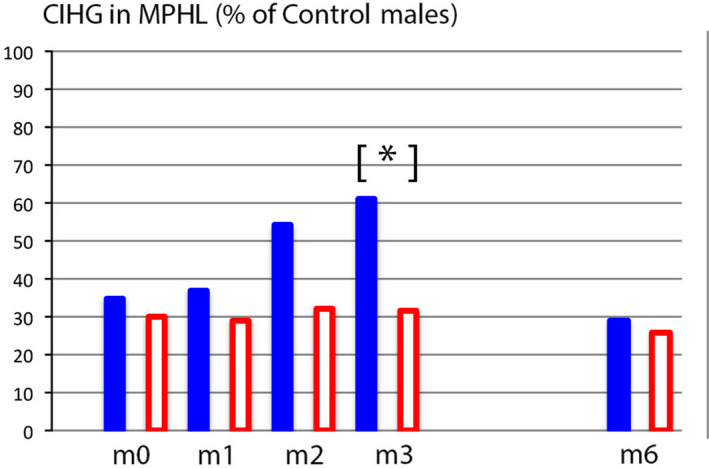
A single parameter quantifies scalp hair growth in MPHL relative to healthy male controls (Colour figure can be viewed at wileyonlinelibrary.com). The average compound index of hair growth (CIHG) in MPHL (n = 22) is expressed as a percentage of mean CIHG recorded in healthy males (% of control males; controls = 100%). Baseline values (m0) indicate that MPHL patients that will be treated by minoxidil 5% solution (plain blue bars; n = 7) have equal levels to those that will receive a control solution (empty bars; n = 15). The baseline production levels found in MPHL groups does not exceed 35% of controls. On drug treatment (m1‐m3), the productivity in the group using combination of finasteride with topical minoxidil 5% (plain bars) reached a statistically significant peak value versus the group on oral drug in combination with a control lotion (empty bars) that reaches statistical significance at m3 (*P ≤ .05). After weaning of topicals, the CIHG values return to pretreatment levels. Finasteride alone (during its association with a control solution or after its interruption) does not significantly vary over time (from m0 to m6). From this graphic display and from our source data (unpublished controls’ CIHG) suggest that MPHL scalp would be covered at 100% within 75 d as compared to 25 d in controls[Colour figure can be viewed at wileyonlinelibrary.com]
4. DISCUSSION
The validated CE‐PTG‐EC—an exhaustive non‐invasive method—has never been used previously in clinical‐experimental assays with recognized active drugs available on the market. We monitored all hair growth parameters in a pool of hair follicles. The pool was identical from baseline throughout 18 months, while panellists were taking oral finasteride using a double‐blind placebo‐controlled protocol during short periods “on” or “off” topical lotion. We report the rapid response of competent follicles to the 5% minoxidil lotion. The once‐a‐day regimen provides evidence that clinical response is the cumulative result of the following sequence of events: precipitation of telogen follicles through exogen, anagen initiation in pre‐existing but functionally deficient terminal and miniaturized follicles. Deficient follicles means increased proportion in telogen as the result of shorter anagen duration with slower growth rates but keeping the capacity to rapidly transit into exogen with old hair fibre release which indirectly reflects competence for anagen initiation.13 While anagen duration improves as long as the topical minoxidil is “on,”14 there was no improvement of rates of linear growth neither on combined drug treatment or with oral drug only. The lack of increased growth rates is contrary to the speculative views held from less exhaustive analytical approaches.15, 16 In the combined drug treatment, the increased average number of anagen hair counts always exceeded the reduction of telogen which indicates that dormant follicles were re‐activated. This finding confirms our previous publications and also supports the view that the contribution of miniaturized hair was considered as clinically non‐significant as neither hair diameter nor growth rates did substantially improve when measured on a follicle‐to‐follicle basis.17, 18, 19 The same observations remained valid when panellists were already 12 months on oral finasteride and the dynamic improvements were restricted to the actual duration of daily topical application of minoxidil. Lotion dosed at 2% appeared less efficient (slower action and less intense changes) than 5% when subjects started the topical regimen which keeps in line with the classical pharmacodynamics’ knowledge.14 Efficacy induced early exogen release in combination with anagen initiation, and we recorded the first signs of weaning within 1 month after interruption of the once‐a‐day topical application. Therefore, if clinicians and/or patients are not satisfied after one year on oral finasteride, improvement can still be obtained by adding a 1 per day course of topical minoxidil at 5%, but warning should be provided that both drugs need to be maintained for efficacy. After some statistical processing from which we deduced that oral finasteride and minoxidil finally were almost equivalent in terms of efficacy and that the propylene glycol in control lotions would not induce increased hair counts,4 the present data now provide properly controlled information to be taken into account by clinicians on top of the more classical exclusive EBM options in favour of monotherapy, that is finasteride or minoxidil. The need or dogma for the latter as a topical lotion to be applied 2 per day for efficacy needs also a substantial revision.14, 20, 21
One of the salient findings was that characterization of a specific pool of hair follicles that were repeatedly recorded over time allowed an exhaustive study and a precise measurement of drug effects on the long term avoiding the edge effects or other confounders that may happen with less targeted approaches.
The possibility of grouping all data from the analytical approach into a single measure like CIHG appears not only to correlate with and explain what clinicians perceive on examining global images but also to measure “non‐visible” fluctuations. CE‐PTG‐EC and drastic reduction of CIHG objectivates entry in telogen within 3 months after dropping the application of topical actives , a phenomenon that remains un‐noticed on global photographs while hair‐cycle dynamic measurements predict acute shedding in the weeks to come. As CIHG reflects productivity we intend to re‐investigate its predictive potential and clinical relevance in relation with therapeutic responses (management of chemotherapy or hair transplantation surgery and alike).
Finally, tracking of follicular competence with a time related “hair‐to‐hair” approach confirms our vision that reversal of miniaturized is not a major contributor to the clinical improvement. Indeed, the follow‐up of a number of vellus hair on finasteride initiated our research during the 9017 and was already confirmed by a larger statistical evaluation of personal and published data on males and females.22 The evidence was completed by larger number of about 300 miniaturized hair follicles monitored during a long‐term study with finasteride18 and in the present study with its combined use with 5% or 2% minoxidil lotions. With these landmarks generated from a “patient‐to‐bench” perspective, we may hope that more efficacious compounds and procedures will be offered as future improvements obtained from a “bench‐to‐bed” approach.23
5. CONCLUSION
From our exhaustive study, topical minoxidil first accelerates transit through the exogen phase without otherwise affecting the duration of telogen and this early effect comes along with initiation of anagen. The influx is characterized by the rapid appearance of finer tips of fast‐growing fibres emerging from terminal follicles. These early events reflect at the scalp surface reactivation of pre‐existing resting‐dormant terminal hair follicles. Not all functional capacities are perfectly restored as reflected by the average slower growth rate in MPHL (untreated and treated) as compared with healthy controls. After combined drug regimen, that is oral finasteride with a once‐a‐day topical lotion, the effects induced by minoxidil rapidly vanish within the first month of interruption of the topical applications and may result in a hereto unreported rebound phenomenon with massive transition of the minoxidil‐induced follicles into telogen‐exogen.
ACKNOWLEDGEMENTS
The work was exclusively performed at and financially supported by Skinterface (Tournai and Brussels, Belgium). All drugs were commercially available (finasteride 1 mg pills; Propecia™, Merck & Cie, NY, USA; minoxidil 5% in a 33% prospylene glycol hydro‐alcoholic base), and control lotions were compounded at the test location. Mrs Véronique Ronsse managed art work from the source documents. Statistical analysis was performed at Atlanstat (44405 Rézé, France).
Van Neste D. Placebo‐controlled dose‐effect studies with topical minoxidil 2% or 5% in male‐patterned hair loss treated with oral finasteride employing an analytical and exhaustive study protocol. Skin Res Technol. 2020;26:542–557. 10.1111/srt.12827
REFERENCES
- 1. Kanti V, Messenger A, Dobos G, et al. Evidence‐based (S3) guideline for the treatment of androgenetic alopecia in women and in men. JEADV. 2018;32:11‐22. [DOI] [PubMed] [Google Scholar]
- 2. van Zuuren EJ, Fedorowicz Z, Schoones J. Interventions for female pattern hair loss. Cochrane Database Syst Rev. 2016;5:CD007628. [DOI] [PMC free article] [PubMed] [Google Scholar]
- 3. Rushton HD, Norris DM, Van Neste D. Hair regrowth in male and female pattern hair loss does not involve the conversion of vellus hair to terminal hair. Where does the regrowth originate? Exp Dermatol. 2016;25:475‐494. [DOI] [PubMed] [Google Scholar]
- 4. Rushton DH, Van Neste DJ. Lessons from the past: avoiding placebo generated increased hair counts. Int J Trichol. 2019;11:144‐146. [DOI] [PMC free article] [PubMed] [Google Scholar]
- 5. Hu R, Xu F, Sheng Y, et al. Combined treatment with oral finasteride and topical minoxidil in male androgenetic alopecia: a randomized and comparative study in Chinese patients. Dermatol Ther. 2015;28:303‐308. [DOI] [PubMed] [Google Scholar]
- 6. Khandpur S, Suman M, Reddy BS. Comparative efficacy of various treatment regimens for androgenetic alopecia in men. J Dermatol. 2002;29:489‐498. [DOI] [PubMed] [Google Scholar]
- 7. Tosti A, Iorizzo M, Vincenzi C. Finasteride treatment may not prevent telogen effluvium after minoxidil withdrawal. Arch Dermatol. 2003;139:1221‐1222. [DOI] [PubMed] [Google Scholar]
- 8. Van Neste D. Contrast enhanced phototrichogram (CE‐PTG): an improved non‐invasive technique for measurement of scalp hair dynamics in androgenetic alopecia – validation study with histology after transverse sectioning of scalp biopsies. Eur J Dermatol. 2001;4:326‐331. [PubMed] [Google Scholar]
- 9. Van Neste D, Leroy T, Conil S. Exogen hair characterization in human scalp. Skin Res Technol. 2007;13:436‐443. [DOI] [PubMed] [Google Scholar]
- 10. Van Neste D. Why care about LHGR? A study using in vivo imaging and computer‐assisted image analysis after manual processing (CAIAMP) in unaffected male controls and men with MPHL. Eur J Dermatol. 2014;24(5):568‐576. [DOI] [PubMed] [Google Scholar]
- 11. Van Neste D. Photographic techniques and quantification of hair growth in measuring the skin In: Humbert P, Maibach H, Fanian F, Agache P, eds. Measuring the Skin. Berlin: Springer International Publishing; 2015:1‐21. 10.1007/978-3-319-26594-0_107-1 [DOI] [Google Scholar]
- 12. Van Neste D. Photographic techniques and quantification of hair growth in TRICHOLOGY: Diseases of pilosebaceous follicle. 2017 Eds Camacho F, Tosti A, Randall V, Grupo PV, Aula Médica SL. Édition : 3, 2017, ISBN‐10: 8478856137–ISBN‐13: 978–8478856138.
- 13. Higgins CA, Westgate GE, Jahoda CAB. From telogen to exogen: mechanisms underlying formation and subsequent loss of the hair club fiber. J Investig Dermatol. 2009;129:2100‐2108. [DOI] [PubMed] [Google Scholar]
- 14. Messenger AG, Rundegren J. Minoxidil: mechanisms of action on hair growth. Br J Dermatol. 2004;150:186‐194. [DOI] [PubMed] [Google Scholar]
- 15. Price VH, Menefee E. Quantitative estimation of hair growth: comparative changes in weight and hair count with 5% and 2% minoxidil, placebo and no treatment In Van Neste D, Randall VA, eds. Hair research for the next millenium. Amsterdam: Elsevier Science B.V.; 1996:67‐711. [Google Scholar]
- 16. Price VH, Menefee E, Sanchez M, Ruane P, Kaufman KD. Changes in hair weight and hair count in men with androgenetic alopecia after treatment with finasteride, 1 mg, daily. J Am Acad Dermatol. 2002;46:517‐523. [DOI] [PubMed] [Google Scholar]
- 17. Van Neste D. Natural scalp hair regression in preclinical stages of male androgenetic alopecia and its reversal by finasteride. Skin Pharmacol Physiol. 2006;19:168‐176. [DOI] [PubMed] [Google Scholar]
- 18. Van Neste D. Viable terminal scalp hair follicles constitute a necessary and sufficient biological end‐organ that conditions clinical efficacy of finasteride in males with male pattern hair loss without implying reversal of miniaturized follicles. Skin Res Technol. 2019;25:701‐711. [DOI] [PubMed] [Google Scholar]
- 19. Van Neste D. Maintenance of optimised hair growth from viable terminal scalp hair follicles at baseline with oral finasteride in male pattern hair loss and first evidence of a ‘drug‐dependency’ and a post‐finasteride ‘rebound effect’. Skin Res Technol. 2019;25:712‐719. [DOI] [PubMed] [Google Scholar]
- 20. Olsen EA. Current and novel methods for assessing efficacy of hair growth promoters in pattern hair loss. J Am Acad Dermatol. 2003;48(2):253‐262. [DOI] [PubMed] [Google Scholar]
- 21. Varothai S, Bergfeld WF. Androgenetic alopecia: an evidence‐based treatment update. Am J Clin Dermatol. 2014;15:217‐230. [DOI] [PubMed] [Google Scholar]
- 22. Rushton HD, Norris MD, Van Neste D. Hair regrowth in male and female pattern hair loss does not involve the conversion of vellus hair to terminal hair. Exp Dermatol. 2016;25:475‐494. [DOI] [PubMed] [Google Scholar]
- 23. Pantelireis N, Higgins CA. A bald statement – current approaches to manipulate miniaturisation focus only on promoting hair growth. Exp Dermatol. 2018;27(9):959‐965. [DOI] [PubMed] [Google Scholar]