

Abstract
Dramatic coral loss has significantly altered many Caribbean reefs, with potentially important consequences for the ecological functions and ecosystem services provided by reef systems. Many studies examine coral loss and its causes—and often presume a universal decline of ecosystem services with coral loss—rather than evaluating the range of possible outcomes for a diversity of ecosystem functions and services at reefs varying in coral cover. We evaluate 10 key ecosystem metrics, relating to a variety of different reef ecosystem functions and services, on 328 Caribbean reefs varying in coral cover. We focus on the range and variability of these metrics rather than on mean responses. In contrast to a prevailing paradigm, we document high variability for a variety of metrics, and for many the range of outcomes is not related to coral cover. We find numerous “bright spots,” where herbivorous fish biomass, density of large fishes, fishery value, and/or fish species richness are high, despite low coral cover. Although it remains critical to protect and restore corals, understanding variability in ecosystem metrics among low‐coral reefs can facilitate the maintenance of reefs with sustained functions and services as we work to restore degraded systems. This framework can be applied to other ecosystems in the Anthropocene to better understand variance in ecosystem service outcomes and identify where and why bright spots exist.
Keywords: Caribbean, coral cover, coral reefs, ecosystem function, ecosystem services, reef fish
Dramatic coral loss has significantly altered Caribbean reefs, and coral loss is predicted to result in broad declines in ecosystem services. We evaluate 10 key ecosystem metrics, relating to a variety of different reef services and functions, using data from 328 Caribbean reefs varying in coral cover. Our results document high variability for a variety of metrics and suggest that “bright spots”—sites where these metrics are comparatively high (i.e., 90th percentile)—can occur where coral cover is low. Notably, bright spots for many metrics related to fish communities are more likely at medium than high coral cover sites.
![]()
1. INTRODUCTION
Human activities in the Anthropocene are altering ecosystems, causing significant differences from their predecessors in species composition, community structure, and ecological function. Examples of such altered ecosystems include regenerating forests dominated by non‐native trees, grassland, and shrubland systems replacing forests due to human alteration of fire regimes, and the ongoing tropicalization of temperate marine ecosystems (Hobbs et al., 2006; Vergés et al., 2014). Some ecosystem changes are so dramatic, persistent, and widespread that recovery to previous states appears unlikely, creating a pressing need to understand the ecological functions and ecosystem services provided by altered systems (Hobbs et al., 2014). However, evaluations of ecological function are often overlooked, with reductions in functions and services assumed to result from the shift to a new ecosystem state. This is true for coral reefs, diverse ecosystems that are undergoing dramatic alterations due to climate change, overfishing, disease, pollution, sedimentation, and food web disruption, as well as interactions among these stressors (Hughes et al., 2017). Reef building corals are the foundation species of tropical reefs, but many reefs have experienced dramatic losses of hard corals. In the case of the Caribbean, live coral cover has declined from 50%–60% to 10%–20% or lower in recent decades (Gardner, Côté, Gill, Grant, & Watkinson, 2003; Jackson, Donovan, Cramer, & Lam, 2014). As live coral declines, reefs lose topographic complexity and undergo major changes in community composition that can result in declining ecological functions and compromised ecosystem services (Alvarez‐Filip et al., 2011; Graham et al., 2014; Rogers et al., 2015). Yet, the full implications of these changes for the diverse range of potential ecosystem services provided by reefs—including food provision, coastal protection, tourism, recreational opportunities, and aesthetic and cultural value—have not been thoroughly investigated (Woodhead, Hicks, Norström, Williams, & Graham, 2019).
Numerous studies seek to better understand historical states of tropical reefs, address the drivers of coral declines, and consider how corals and coral reef ecosystems might be better conserved or restored (Hughes et al., 2017; Jackson et al., 2014; Pandolfi et al., 2003). Similarly, reef management and restoration initiatives often focus on coral cover. For example, some use coral propagation, gardening, and outplanting to slow or reverse the trajectory of decline (Ladd, Miller, Hunt, Sharp, & Burkepile, 2018), while others focus on protecting herbivorous fishes with the intent that increased grazing will facilitate coral recovery by removing the seaweeds that compete with corals (Steneck, Mumby, MacDonald, Rasher, & Stoyle, 2018). To meet recovery goals, these efforts should be continued, but it is also critical to understand the variance in ecosystem states and the ranges of services currently provided on “degraded” (i.e., coral depauperate) reefs. The few studies that assess a broad array of functions and services for low‐coral states tend to assume or predict an overall decline in services (e.g., Mumby et al., 2008; Pratchett, Hoey, & Wilson, 2014; Rogers et al., 2015), despite limited empirical data to support some of these expectations. As one example, many studies presume that reef‐based tourism will suffer following coral decline (e.g., Rogers et al., 2015; Yee, Carriger, Bradley, Fisher, & Dyson, 2015). However, many tourists may not distinguish living hard coral from dead coral, soft corals, or other benthic invertebrates, and may care more about non‐coral attributes like water clarity, fish diversity, and the presence of large fishes (Gill, Schuhmann, & Oxenford, 2015; Uyarra et al., 2005). Furthermore, while there is a growing body of research acknowledging that reefs of the future will likely lack historic analogs (Hughes et al., 2017), there is still a focus on hard corals as the sole foundation taxon. A better understanding of the ecosystem functions and services provided by reefs that have lost significant hard coral and may be dominated by other species (e.g., macroalgae, sponges, or gorgonians) will enable more effective management into the future.
Here we examine 10 ecosystem metrics, relating to different ecosystem functions and services, under varying levels of coral cover at 328 sites across the Caribbean. We use data collected by the Atlantic and Gulf Rapid Reef Assessment (AGRRA) between 2011 and 2015 at forereef sites that currently have or historically have had abundant hard coral (AGRRA, 2018). In contrast to coral reef research that tends to focus on mean responses to coral loss, we assess the range and variability in these metrics across reefs with low (<10%), intermediate (10%–20%), and high (>20%) coral cover. Few sites in our dataset have coral cover higher than 30%, thus we recognize that our “high” cover category is modest relative to many historical Caribbean reefs. Nevertheless, within the range of coral cover observed in the present‐day Caribbean, we test whether lower coral cover results in declining means and/or changes to the variability of ecosystem metrics among reefs.
Based on a prevailing paradigm in the coral reef literature, our expectation was that various ecosystem metrics would decline in mean value on low coral cover reefs, but we did not have strong a priori predictions for changes in variance. In contrast to these expectations, our results suggest that “bright spots”—sites where these metrics are comparatively high—can occur where coral cover is low. Given that Caribbean reefs have experienced earlier and often greater coral loss than other coral reef systems such as those in the Indo‐Pacific (Jackson, 1997; Roff & Mumby, 2012), it may be a harbinger of changes to come for other reefs, or coastal systems in general. Therefore, lessons learned in the Caribbean could facilitate greater preservation of bright spots in other regions or ecosystems. As the Earth faces accelerated ecosystem change, there is a need to explore the variability in ecosystem services provided by altered ecosystems. Insights arising from such efforts may allow management to enhance bright spots and limit loss of key services.
2. MATERIALS AND METHODS
2.1. Ecosystem metrics
There are a wide variety of ecosystem processes on coral reefs that contribute to the maintenance of biodiversity and the delivery of benefits to people (i.e., ecosystem services; reviewed by Moberg & Folke, 1999; Mumby et al., 2008; Yee et al., 2015). Services are rarely measured directly, but we identify metrics that can be calculated from available survey data and are related to a number of important coral reef ecological functions and ecosystem services (Table 1; Figure S1). These metrics are incomplete proxies for the functions and services we are aiming to assess (e.g., fish species richness as one attribute of value to SCUBA and snorkel tourists) and most of them are related to more than one important ecological function or ecosystem service (Figure S1). Nevertheless, collectively they provide a useful if imperfect indicator for potential ecosystem services and functions at a site. These metrics include:
vertical relief, a component of ecosystem structure underlying a variety of services including habitat provision and predation refuge for fishes (Graham & Nash, 2013) and coastal protection (Ferrario et al., 2014);
calcareous macroalgal cover, a key contributor to sand and sediment production including for adjacent beaches (Lidz & Hallock, 2000);
coral recruit density, a proxy for coral recruitment rates, and also important for reef recovery potential (Hughes et al., 2019);
coral calcification rate, which can contribute to growth of reef structure, sand production, coastal protection, and reef recovery potential (Ferrario et al., 2014; González‐Barrios & Álvarez‐Filip, 2018; Perry et al., 2013);
mean coral species richness, which captures components of biodiversity as an endpoint unto itself and as an important supporting service (Moberg & Folke, 1999), including facilitating coral growth and survivorship (Clements & Hay, 2019) and influencing the value of dive tourism (Uyarra, Watkinson, & Côté, 2009);
herbivorous fish biomass, as a partial indicator for herbivory, because herbivores, by suppressing macroalgal overgrowth of the reef, can facilitate coral recruitment, growth, and survivorship (Hughes et al., 2007; Mumby, 2006) and improve the aesthetic value of the reef;
potential fishery value, assessed as the potential market value of fish on surveyed reefs, as one key component of benefits from fisheries (Mumby et al., 2008);
density of large fish, which contributes to the value of dive tourism (Gill et al., 2015) and may increase fishery value as fishers often target and/or receive higher prices for larger fish (Graham, Dulvy, Jennings, & Polunin, 2005);
parrotfish bioerosion rate, which is positively related to sand production and negatively related to net reef accretion (Hubbard & Dullo, 2016; Perry et al., 2013); and
mean fish species richness, which captures components of biodiversity as an endpoint unto itself and acts as an important supporting service (Moberg & Folke, 1999), including enhancing reef resilience (Burkepile & Hay, 2008), influencing the value of dive tourism and the aesthetic value of the reef (Williams & Polunin, 2002) and supporting fisheries productivity (Duffy, Lefcheck, Stuart‐Smith, Navarrete, & Edgar, 2016).
TABLE 1.
Ecosystem metrics examined in this study. All data from AGRRA (2018) unless otherwise specified
| Metric | Description |
|---|---|
| Vertical relief | Measured as the difference, in cm, between the highest structure (coral or reef rock) and the lowest point in the underlying substratum within a 1m diameter (measured every 5 m and averaged over a 30 m transect) |
| Calcareous macroalgae cover | Percent cover of erect calcareous macroalgae (e.g., Halimeda spp., Galaxaura spp., etc.) |
| Coral recruit density | In individuals/m2, counting all hard coral colonies less than 4 cm in diameter (identified to genus) |
| Coral calcification rate | In kg CaCO3 m−2 year−1, applying species‐specific calcification rates from González‐Barrios and Álvarez‐Filip (2018) to coral cover data from AGRRA surveys |
| Coral species richness | The number of coral species encountered on each transect (10 m2), with transect densities averaged over a site |
| Herbivore biomass | In g/m2, using species‐specific fish biomass data from AGRRA surveys and summing biomass estimates across all fish species known principally to be herbivores (as classified by Paddack et al., 2009; see their table S2) |
| Potential fishery value | In USD/m2, using species‐specific fish biomass data from AGRRA surveys and multiplying those biomass numbers by species‐specific price estimates (shown in Table S1) |
| Density of large fish | In individuals/m2, counting all fish greater than 40 cm in size |
| Parrotfish bioerosion rate | In kg m−2 year−1, applying species‐ and size‐specific parrotfish bioerosion rates from Ruttenberg et al. (2019) to parrotfish recorded in AGRRA surveys |
| Fish species richness | The number of fish species encountered on each transect (60 m2), with transect densities averaged over a site |
Abbreviation: AGRRA, Atlantic and Gulf Rapid Reef Assessment.
2.2. Dataset description
We used reef monitoring data from the AGRRA version 5 surveys, collected between 2011 and 2015 (AGRRA, 2018). We chose this dataset because it is relatively comprehensive in measuring a range of components of reef ecosystems. It also has broad coverage across the Caribbean surveying consistent reef habitats (e.g., forereef), and data are collected by scientists using a standardized protocol (available at www.agrra.org). Data were downloaded from the AGRRA website and were filtered to include only sites in forereef habitats between 3 and 20 m in depth that were surveyed with at least six fish transects and at least four benthic transects. This resulted in 328 sites across the Caribbean that were sampled between 2011 and 2015 (Figure 1).
FIGURE 1.
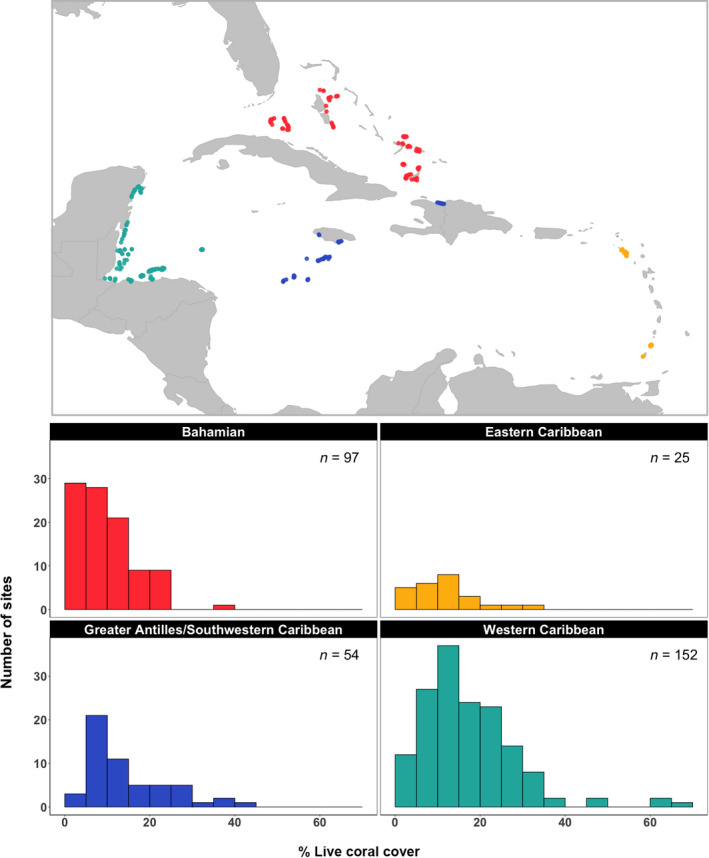
Map of Atlantic and Gulf Rapid Reef Assessment survey sites included in this analysis and histograms of mean site‐level percent live coral cover within each ecoregion
The Atlantic and Gulf Rapid Reef Assessment surveys benthic organisms (crustose coralline algae [CCA], macroalgae, corals, sessile invertebrates) and ecologically and/or commercially important reef fish species, and documents attributes of reef condition (e.g., reef structure, coral health). Fish and coral taxa are identified to species (or occasionally to genera), while other components are grouped at higher taxonomic levels (e.g., sponges), with 93 fish taxa and 76 coral taxa reported across all surveys analyzed in this study. Coral recruits/juveniles (i.e., individuals <4 cm diameter) are counted and reef vertical relief (i.e., vertical height of the tallest coral or reef rock above the lowest point in the underlying substratum) is measured.
To reduce the influence of extreme outliers in the fish biomass data from AGRRA, we identified species that had individual observations (i.e., a single species, size and count record on an individual transect) greater than the 99th biomass quantile for all fish observations (n = 54 species). For these species, we capped the biomass of each observation to the 99th quantile from all individual observations for that species in the entire dataset (Donovan et al., 2018). This led to our capping approximately 0.7% (660 out of 96,147) of the observations. These observations were not removed but were adjusted so that they are still large values without influencing the site averages as strongly as they would otherwise. In particular, this reduced the influence of data input errors and of rare, large groups of roaming or aggregating species, such as Sphyraena barracuda, which can constitute a large proportion of biomass in certain transects while not representing individuals that are permanent residents of the surveyed reef. We also calculated macroalgal cover (for Figure S5) for the AGRRA data by summing percent cover across calcareous macroalgae, fleshy macroalgae, and mixed macroalgae. Coral species richness and fish species richness were computed as species richness per transect, with transects measuring corals and fishes over a standardized area (10 and 60 m2, respectively). Transect richness values were then averaged for each site. This procedure standardized richness estimates to a fixed sampling effort and was necessary because sites varied in the number of transects surveyed.
To estimate parrotfish bioerosion rates, we applied species‐ and size‐specific estimates of bioerosion rates from Ruttenberg, Adam, Duran, and Burkepile (2019) to the AGRRA parrotfish observations at each site. These estimates were derived from field behavioral observations of 10 parrotfish species in the Florida Keys, United States, with the bioerosion rate for each fish of a given size class calculated as bite rate multiplied by bite volume, multiplied by the probability of leaving a scar, and by bulk density of reef carbonate, with the latter terms derived from the literature (Ruttenberg et al., 2019).
To estimate coral calcification rates, we applied species‐specific estimates of mean calcification rates (in kg CaCO3 m−2 year−1) from González‐Barrios and Álvarez‐Filip (2018; see their table 2) to mean cover estimates (in m2) from AGRRA. González‐Barrios and Álvarez‐Filip (2018) estimated calcification rates for the 47 most common scleractinian coral species in the Caribbean, covering most of the corals observed in the AGRRA coral dataset. Occasionally corals were recorded at the genus‐level in AGRRA; in such case we calculated an average calcification rate across all species in that genus (González‐Barrios & Álvarez‐Filip, 2018). The few species of corals present in AGRRA for which we did not have calcification estimates (<0.003 percent cover) were excluded from this analysis.
To determine the fishery value of the reef fish assemblages measured at the AGRRA sites, we used fishery statistics from Puerto Rico that provided an estimate of value in USD per pound of fish landed by species or by family. We extracted annual, island‐wide, ex‐vessel values for all species and families for which data were available from the period 2007 to 2011 from Matos‐Caraballo (2012). Because some groups were not valued in all years, we used the maximum annual value for each species (or for each family for species that lacked species‐specific values). We did not include species or families that did not appear in this dataset (Matos‐Caraballo, 2012); some of these omitted species are occasionally caught, but they have little or no value and are considered “trash fish” in Puerto Rico. While some of these species may have value on other Caribbean islands, the value is likely low, particularly since most of these species are small or unpalatable. We then used these value data (Table S1) to calculate the potential fishery value of the fish assemblage at each AGRRA site based on the biomass of each species. Ideally, we would have had price data from local and/or export markets in each location, but such data are non‐existent or buried in grey literature across the Caribbean. Puerto Rico is centrally located in the Caribbean, has an extensive and diverse reef fish fishery, and is unique in having a well‐documented time series of catch and value data.
2.3. Analyses
We examined whether lower coral cover results in declining means and/or changes to the variability of ecosystem metrics among reefs (Figure 2). We calculated 10 metrics related to different aspects of reef functions and services (Figure S1), using the AGRRA data described above (Table 1). For many analyses, we binned sites into three categories of live coral cover: (a) low: <10% cover; (b) medium: 10%–20% cover; and (c) high: >20% cover. These categories were defined based on the distribution of coral cover across all of the sites in the dataset (Figure 1); although 20% is still quite low relative to historical coral cover for many sites in the region, mean coral cover across all our sites was 14.36% (n = 328; ±10%), and about a quarter of the sites (n = 79) have coral cover greater than 20%. We confirmed the robustness of our results to these categories by examining patterns using an alternative set of coral cover thresholds (Figure S7). Our qualitative conclusion—that most metrics can be high at sites with low coral cover—did not appear to be sensitive to the coral cover categories that we used. We also show the relationships between each metric and coral cover on a continuous scale (Figure S8). We do not focus our analysis around the continuous results because we were most interested in examining variability in metrics across different levels of coral cover rather than trying to identify predictive relationships. Furthermore, coral cover explained a very low percentage of the variability for most of these metrics (Figure S8).
FIGURE 2.
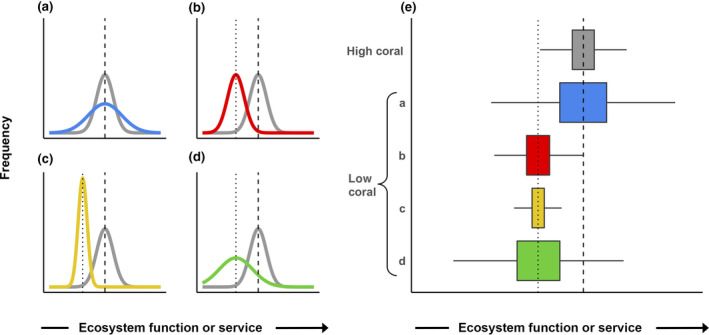
A priori hypotheses about different ecosystem patterns observed on high and low coral cover reefs. (a)–(d) Shifted distributions relative to a high‐coral state (gray). At low coral cover, relative values may have equal mean and increased variance (a; blue), decreased mean and equal variance (b; red), decreased mean and decreased variance (c; yellow), or decreased mean and increased variance (d; green). (e) Distributions from (a) to (d) as boxplots. These alternative hypotheses are not a complete set, as some services could also potentially increase with declining coral cover. Furthermore, we represent hypotheses based on comparisons of high and low coral cover for simplicity, although our empirical analyses focused on three coral cover categories to better capture variation in coral cover across the Caribbean
We also binned sites by low (<40 cm), medium (40–80 cm), and high (>80 cm) vertical relief. These categories were defined based on the distribution of vertical reef relief across all sites in our dataset. Using these definitions, about a third of the sites had low vertical relief and a little less than a quarter had high relief. These categories allowed us to evaluate, for example, whether relict structure from dead coral is associated with higher ecosystem metrics at sites with low live coral cover. We categorized sites based on protection status using the information provided in AGRRA for a subset of the sites (n = 219) that noted whether surveys were conducted within marine protected areas (MPAs) to evaluate if protection status could confound our results. Lastly, we examined patterns separately for just the Western Caribbean and the Bahamian ecoregions sampled in 2011. These represented the two region‐year combinations for which we had the largest sample sizes, allowing us to evaluate the role of coral cover in the absence of regional and interannual variability. For example, we did not test for an association of the response variables with physical gradients like sea surface temperature or productivity; examining patterns at the ecoregional scale should partially control for variation in these physical factors.
We evaluated how each of the 10 metrics (Figure 3; Table 2) was associated with a variety of predictor variables using linear mixed effects models (LMERs) in the R package “lme4” (Bates, Maechler, Bolker, & Walker, 2015). We assumed a Gaussian family (normal distribution) for response variables in all models. For data that needed to be transformed to meet assumptions of normality (all variables except density of large fish, fish species richness, and coral species richness), we used an inverse hyperbolic sine transformation. Estimates from the linear model were then back‐transformed in order to calculate effect sizes. We treated ecoregion and year as categorical random effects, depth as a continuous fixed effect, and coral cover category (low, medium, high) as a categorical fixed effect. For the LMER examining MPA status (Figure S2), MPA status (yes or no) was included as a fixed effect in addition to the effects included in the main model (i.e., ecoregion, year, depth, coral cover). For the LMERs focused on individual ecoregions sampled in a single year (Figures S3 and S4), we removed ecoregion and year as random effects.
FIGURE 3.
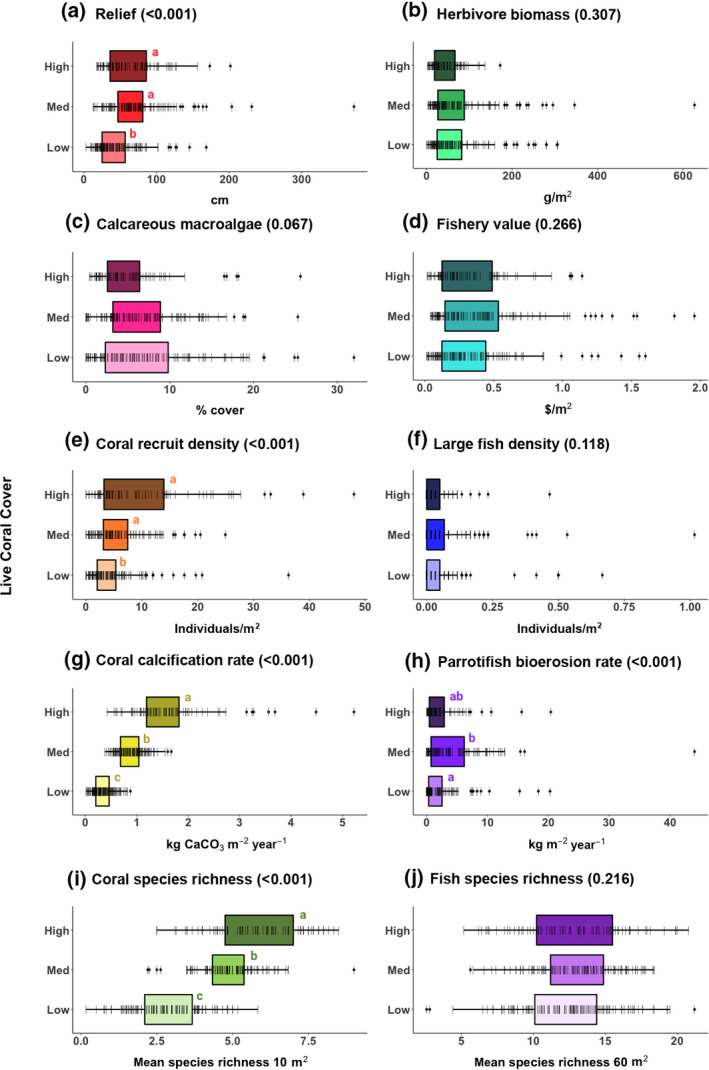
Distribution of 10 metrics, by three categories of mean percent live coral cover. High coral cover is defined as >20%, medium is 10%–20%, and low is <10%. Data from AGRRA (2018; number of sites for high, medium, low coral cover: a–g, i, j, n = 79, 120, 129; h, n = 65, 104, 103). Lines represent individual data points. P‐value from linear mixed effects model results (Table 2) shown in parentheses after panel title, with results of Tukey's post hoc test shown by letters next to boxes (coral categories sharing a letter are not significantly different from one another)
TABLE 2.
Results of linear mixed effects models (LMER) and generalized linear mixed effect models (GLMER) testing the effect of coral cover categories (low, medium, high) on the 10 metrics; and results of chi‐squared tests examining whether sites in the 90th or 75th percentile for each metric are distributed in coral cover categories proportional to the number of sites in each category. Shading corresponds to significance level (blue) and effect size (green)
| Response | LMER a | GLMER b | LMER (1° grid cell effect) c | Chi‐squared (90th percentile) | Chi‐squared (75th percentile) | |||
|---|---|---|---|---|---|---|---|---|
| p‐value | Effect size | p‐value | Effect size | p‐value | Effect size | p‐value | p‐value | |
| Vertical relief | <.001 | 0.794 (medium‐large) | <.001 | 0.671 (medium) | <.001 | 0.711 (medium‐large) | .048 | <.001 |
| Calcareous macroalgae cover | .067 | 0.171 (small) | .106 | 0.172 (small) | .366 | 0.169 (small) | .120 | .074 |
| Coral recruit density | <.001 | 0.500 (medium) | <.001 | 0.714 (medium‐large) | <.001 | 0.540 (medium) | <.001 | <.001 |
| Coral calcification rate | <.001 | 2.384 (large) | <.001 | 2.562 (large) | <.001 | 3.052 (large) | <.001 | <.001 |
| Coral species richness | <.001 | 2.774 (large) | <.001 | 2.784 (large) | <.001 | 2.487 (large) | <.001 | <.001 |
| Herbivore biomass | .307 | 0.031 (small) | .071 | 0.148 (small) | .408 | 0.029 (small) | .015 | .074 |
| Potential fishery value d | .266 | 0.124 (small) | .594 | 0.016 (small) | .260 | 0.043 (small) | .382 | .521 |
| Density of large fish | .118 | 0.206 (small) | .061 | 0.059 (small) | .273 | 0.087 (small) | .040 | .593 |
| Parrotfish bioerosion rate d | <.001 | 0.114 (small) | .001 | 0.082 (small) | .001 | 0.101 (small) | .016 | .039 |
| Fish species richness | .216 | 0.251 (small) | .211 | 0.251 (small) | .002 | 0.698 (medium‐large) | .900 | .298 |
LMER with ecoregion and year as random effects and depth and coral cover category as fixed effects.
See Table S2 in the Supporting Information for model details.
LMER with 1° grid cells and year as random effects and depth and coral cover category as fixed effects, except for vertical relief model where year was also a fixed effect to avoid a boundary error.
Data violate normality assumptions of LMER.
To verify the robustness of our main results (i.e., Figure 3), we reran analyses using two alternative statistical approaches. First, we used generalized mixed effects models (GLMERs) that allowed us to avoid the data transformations necessary to meet the normality assumptions of LMERs, using the R package “glmmTMB” (Brooks et al., 2017). The GLMERs included depth as a fixed effect and ecoregion and year as random effects (in a few cases, GLMERs including ecoregion and year would not converge and the random effects were omitted; Table S2). For response variables that are zero‐inflated, we implemented hurdle models, two‐part models that specify one process for zero counts and use a GLMER to model positive counts. We account for the zero‐inflation with a binary logit model, estimating the extra probability a site has a zero. We assumed this probability is equal for all sites, rather than modeling it as a function of other covariates such as depth or coral cover. Here we report the p‐values and effect sizes based on the effect of coral cover in the GLMER portion of the model. Details of the GLMER model type, assumed distributions, and results are summarized in Table S2.
Our second alternative statistical approach relied on LMER models but accounted for spatial variation on a much smaller scale. Instead of treating ecoregion as a random effect, we assigned sites to 1° grid cells, and treated the cells as a categorical random effect; this resulted in 33 occupied cells, with the majority of cells containing between four and 15 sites. We then reran the LMER models with this grid cell random effect instead of the ecoregion effect. For comparison, the results of all three statistical approaches are presented in Table 2.
Significance values were obtained by running an ANOVA on each of the models; the Type II Wald chi‐square test statistic was used for all variables. To determine effect size of coral cover category on each response variable, we calculated the pooled standard deviation, factoring in only ecoregion, year, and coral cover category, since depth is a continuous variable. We took the difference between the high and low coral estimates of the mixed effects model and divided it by the pooled standard deviation for each response variable. We calculated the pooled standard deviation by calculating variance within each ecoregion by year and by coral cover category combination and taking the square root of the average variance. This method is comparable to calculating Cohen's d, whereby an effect size <0.2 is considered small, an effect size of ~0.5 is considered medium, and an effect size >0.8 is considered large (Cohen, 1988).
Lastly, we assessed whether “bright spots,” defined as sites in the 90th percentile or 75th percentile for each of our 10 metrics, are more common for some coral cover categories. We did this by performing chi‐squared tests to determine whether bright spots are distributed in the three coral cover categories (low, medium, high) proportional to the number of sites in each category. All statistics were run in R (R Core Team, 2018).
3. RESULTS
We find that numerous ecosystem metrics are statistically indistinguishable on reefs with low versus high coral cover. Metrics relating to the fish community—herbivore biomass, fishery value, density of large fishes, parrotfish bioerosion rate, and fish species richness—are similar between low and high coral cover sites across the Caribbean (Figure 3; Table 2). When controlling for a smaller spatial scale (i.e., 1° grid cells), the effect of coral cover was still non‐significant for these metrics, except for a positive effect on fish species richness (Table 2). There is also no indication that a relationship between coral cover and herbivore biomass, fishery value, density of large fishes, or fish species richness is being obscured by some sites being located inside MPAs (Figure S2). Additionally, the distribution of sampling across Caribbean ecoregions and years does not seem to confound our results, which are maintained if ecoregions with sufficient samples sizes for a single year are analyzed in isolation (Figures S3 and S4). Lastly, variance for all metrics (Figure 3) is high for all observed levels of coral cover (i.e., Figure 2a).
We examine the “bright spots” for these metrics, defined first as sites that fall within the 90th percentile for each metric. High fishery value and high fish species richness sites are not disproportionally common in any of the three coral cover categories, while high herbivore biomass and sites with high densities of large fish are actually less common within high‐coral sites than expected by chance (Table 2; Figure 4). If we expand our definition of “bright spots” to include sites that fall within the 75th percentile for each metric, sites with high fishery value, high herbivore biomass, high density of large fish, and high fish species richness are distributed across the coral cover categories as expected by chance (Table 2).
FIGURE 4.
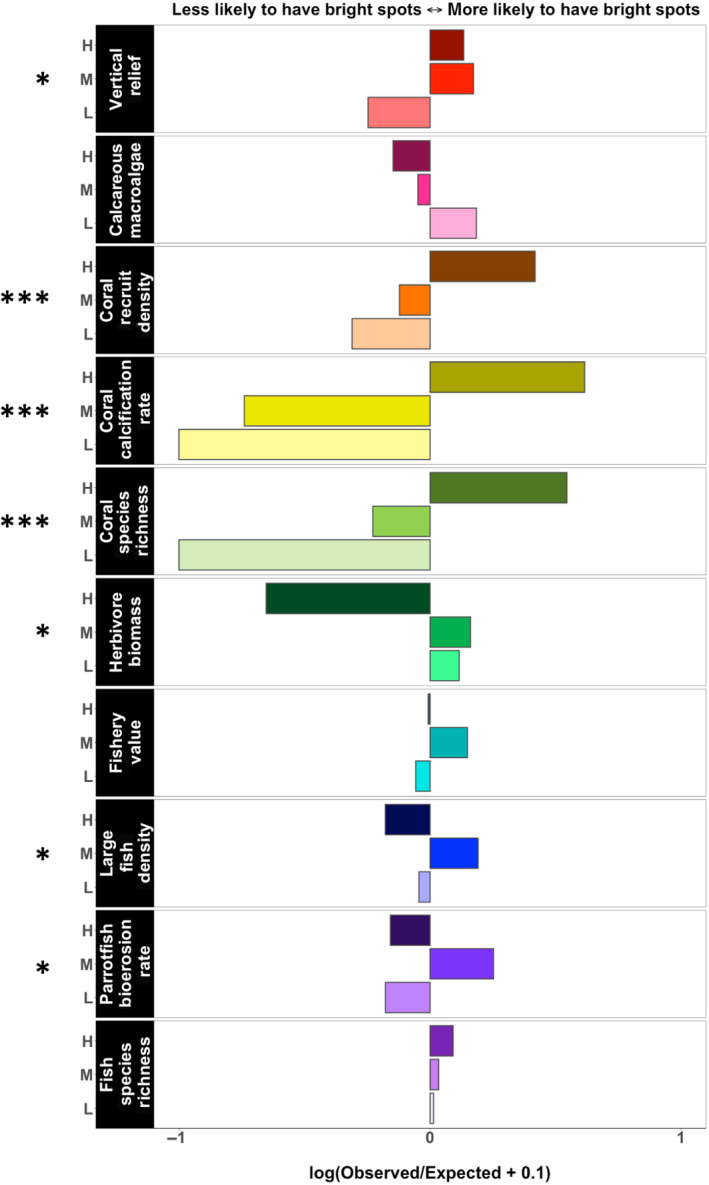
Log of observed by expected site count ratios for the sites in the 90th percentile for each metric. Values of this ratio greater than zero indicate that “bright spots” were more likely to occur in a coral category than expected by chance alone, and vice versa. H, M, L indicates high, medium, and low coral cover sites. Expected site counts are from chi‐squared tests, with the stars at the left showing the significance thresholds for these chi‐squared tests (see Table 2). To account for the two instances where the expected count was zero, we used log (ratio + 0.1) for all metrics
Some of the metrics we examine are tightly linked to live coral cover. Vertical relief, coral recruit density, coral calcification rate, and coral species richness—all indicators of various aspects of coral presence—are positively associated with coral cover (Table 2), with lower values on average at sites with low versus high coral cover (Figure 3). In particular, the relationships between coral cover and coral recruit density and coral calcification rate are strongly positive (Table 2; Figure 4), and these two metrics also exhibit lower variance at low‐coral sites (i.e., Figure 2c).
Although reef structure, as measured by vertical relief, has a significant association with coral cover, the range of vertical relief values almost fully overlap between low‐ and high‐coral sites (Figure 3). Examining the bright spots, we find the highest relief sites (i.e., those in the 90th percentile) are only marginally more common in high and medium versus low coral cover sites (Figure 4). This weaker relationship may result from a delay between coral death and structural loss. Overall macroalgal cover is lower at high coral cover sites (Figure S5), a possibly trivial result given that AGRRA benthic surveys do not account for layering of organisms. Because percent cover cannot exceed 100%, when coral cover increases, space remaining for other organisms must decline. However, when examining cover of only calcareous macroalgae, there is no relationship with coral cover (Figure 3c). Both total macroalgal cover and cover of calcareous macroalgae vary dramatically at low‐coral sites (Figure S5; Figures 2d and 3c).
Given that some indicators show comparable ranges of variation in low‐ and high‐coral sites, it is possible that these attributes are more dependent on structural relief (which corals, either live or as remnant skeletons, provide) rather than specifically on live coral. Therefore, we also examine the range of metric values at sites with similar coral cover that vary across three levels of vertical relief. When examining low coral sites, some indicators are positively associated with higher vertical relief, including coral calcification rate, coral recruitment, coral species richness, and herbivore biomass (Figure 5). Other indicators do not differ across the three vertical relief categories (fishery value, density of large fishes, and cover of calcareous macroalgae) or have the highest values at medium relief (coral and fish species richness; Figure 5). Furthermore, the highest overall individual values for fishery value, herbivore biomass, density of large fishes, and coral recruitment are observed at medium and/or low relief sites (Figure 5). In contrast, within only high coral cover sites, herbivore biomass, fish richness, and fishery value are all associated with higher relief (Figure S6).
FIGURE 5.
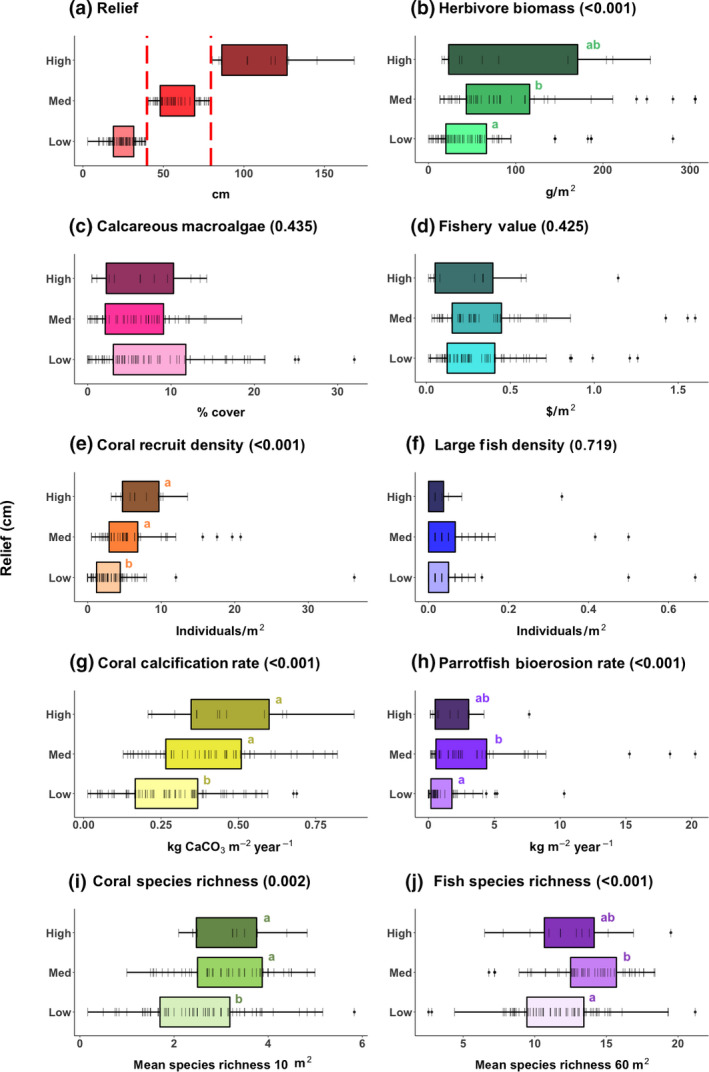
Distribution of 10 metrics, for low coral cover sites (<10% live coral cover) only (n = 129), by three categories of vertical relief. Relief categories are indicated by the red dashed lines in (a). Data for all plots from AGRRA (2018; number of sites for high, medium, low coral cover: a–g, i, j, n = 12, 49, 68; h, n = 11, 40, 52). Lines represent individual data points. P‐value from linear mixed effects model (LMER) results shown in parentheses after panel title, with results of Tukey's post hoc test shown by letters next to boxes (relief categories sharing a letter are not significantly different from one another). For these LMERs, ecoregion was switched to a fixed effect for parrotfish bioerosion, coral calcification, and fish species richness, and year was switched to a fixed effect for coral species richness to avoid boundary errors
4. DISCUSSION
4.1. Ecosystem functions and services on low‐coral reefs
We examined data from over 300 sites throughout the Caribbean, where many coral reefs have low coral cover, and thus may provide a window into the future for reef ecosystems as coral declines globally. We document a surprising degree of variability in ecosystem metrics for low‐coral reefs that have often been lumped into a single “degraded” category. In the coral reef literature, a common paradigm is that many ecological functions and ecosystem services are strongly influenced by coral cover and the structural complexity provided by hard corals (Graham & Nash, 2013; Mumby et al., 2008; Rogers, Blanchard, & Mumby, 2014; Rogers et al., 2015). For some reef functions, such as coral recruitment, coral calcification, coral species richness, and vertical relief, there is a clear mechanistic link with coral cover. Thus, the positive relationships we document with these metrics are not surprising and are well aligned with the previous work (Alvarez‐Filip et al., 2011; Hubbard & Dullo, 2016; Perry et al., 2013).
However, we find a surprisingly poor correlation with coral cover for numerous non‐coral ecosystem metrics, including herbivorous fish biomass, density of large fishes, fishery value, and fish species richness. In fact, sites with high values (i.e., “bright spots”) for this set of indicators are equally likely to be sites with low versus high coral cover. Critically, we find that various ecological states are possible in the absence of high coral cover, not all of which are characterized by high macroalgal cover (Bruno, Sweatman, Precht, Selig, & Schutte, 2009; Norström, Nyström, Lokrantz, & Folke, 2009; Table S3). Our results suggest that other factors that are generally not measured by monitoring programs—and therefore omitted from our analyses—may have as large or larger influence on these metrics as does coral cover. These factors include wave exposure, water quality, habitat structure, larval supply, habitat connectivity, fishing pressure, as well as many others. Our results support and expand on previous efforts to identify bright spots for various reef attributes (Cinner et al., 2016; Mora, 2008; Valdivia, Cox, & Bruno, 2017), and align with a growing corpus of research questioning the strength of connections between coral cover and several important reef functions (Bruno, Côté, & Toth, 2019; Robinson et al., 2019; Russ, Questel, Rizzari, & Alcala, 2015).
The discordance between some of our results and the body of literature that has found or presumed stronger linkages between coral cover and ecosystem services could be explained in part by the scarcity of empirical tests for some indicators, such as for fishery value and density of large fishes. However, it is also possible that some mechanistic relationships that once existed for Caribbean reefs no longer hold, following the dramatic losses of coral cover that became obvious in the 1980s (Hughes, 1994; Jackson et al., 2014). Previous reef studies documented strong relationships between coral cover and fish abundance, biomass, and diversity (Luckhurst & Luckhurst, 1978; Risk, 1972). However, corals and fishes may be experiencing asymmetrical effects of various stressors. For example, corals may be more heavily impacted by climate change and disease, whereas fish may be more impacted by fishing. If these drivers show different spatial patterns of intensity, this could obscure or overwhelm previously observed linkages between coral cover and fish communities. Additionally, reefs have changed not only in their coral cover but also in their coral species composition. There may be important differences among coral species in the services that they provide based on their size, architectural complexity, physiological tolerances, and robustness to physical disturbances. In particular, the Caribbean has only two species of large, fast‐growing branching corals, both in the genus Acropora. These Acropora species dominated previous Caribbean reefs, and could have played an important role in fish species diversification (Bellwood, Goatley, & Bellwood, 2017) and as a complex habitat to support fish recruitment and survival (Huntington, Miller, Pausch, & Richter, 2017). However, acroporids have become incredibly rare throughout most of the Caribbean (Cramer et al., 2020; Jackson et al., 2014). It is possible that previously documented relationships between fish metrics and coral cover may have depended on cover of Acropora, rather than on cover of corals in general.
Although coral reefs worldwide are facing an array of threats, the Caribbean is at the leading edge of this trajectory of decline as a result of the region's smaller size, lower diversity, lower resilience, and higher historical levels of human impacts (Jackson, 1997; Roff & Mumby, 2012). Indeed, much of the degradation of Caribbean reefs predates the 10 years of data we analyze, and has been ongoing for decades if not centuries (Cramer et al., 2020; Pandolfi et al., 2003). Fishing activity has significantly modified trophic structure and reduced fish abundance across the region, with direct and indirect impacts on fish community composition (Paddack et al., 2009) and intensities of fish grazing (Hay, 1984), both of which influence reef resilience and function (Burkepile & Hay, 2008). Despite the known influence of fishing in the region, we did not find an effect of MPAs, a result that aligns with previous observations that many Caribbean MPAs are not well enforced and thus may afford little protection from fishing (Mora et al., 2006).
Significant losses of major reef‐building corals has led to a shifting baseline, as emphasized by the fact that our “high” coral cover category is >20%, whereas Caribbean reefs only a few decades ago regularly had >50% coral cover (Gardner et al., 2003; Jackson et al., 2014). Furthermore, as discussed, the two Caribbean Acropora species have transitioned from dominant producers of topographic complexity to being listed as critically endangered (IUCN, 2019), leaving no species in the region that plays a similar structural or ecological role. Thus, while we find that some metrics are comparable between low‐ and high‐coral sites, these metrics may represent compromised performance across all coral cover classes when viewed from a historical perspective. Additionally, given that much of the coral degradation is basin‐wide, high‐coral sites may have impaired function for metrics reliant on connectivity between sites (e.g., larval dispersal) because of a lack of healthy source communities. Despite these complexities, the long history of coral loss in the Caribbean may serve as a useful predictor of possible changes to other reef systems. By understanding the drivers of the variance we find in ecosystem metrics in the Caribbean, management strategies may be better targeted to achieve bright spots in reef systems globally.
4.2. Future research and management
The variability we document among coral depauperate reefs highlights the subjectivity in defining ecosystem degradation (Hobbs, 2016), and the previously underappreciated value of some low‐coral reefs. Future work in coral reef systems focused on better understanding the factors underlying this variability, including closer scrutiny of the bright spots, is likely to pay major dividends. Coral reef management, conservation, and restoration may need to adopt new approaches to better guide low‐coral states in a positive direction, including defining success in terms independent of historical baselines. Determining where bright spots occur and the degree to which they are dependent on coral cover or other conditions will help to identify management actions that can maintain ecological functions and services on degrading reefs. In particular, the bright spots associated with high densities of large fishes and high fishery value may suggest new management strategies for enhancing food security for human populations that depend on reef ecosystems for food and livelihoods, such as protecting and enhancing the non‐coral benthic community found at low‐coral reefs.
The bright spots we document on “degraded” reefs may be supported by a range of distinct low‐coral community types, including those typified by sponges, gorgonians, macroalgae, or CCA (Table S3), each with different implications for ecosystem functions and services (Bell et al., 2018; Cruz et al., 2015; Wulff, 2016). Erect sponges and gorgonians provide three‐dimensional structure, influence hydrodynamics, boost the aesthetic value of reefs, and can be an important source of natural products. Sponges can also adhere living corals to the reef frame and stabilize coral rubble; protect biogenic carbonate from bioerosion; filter water and influence seawater chemistry; and provide habitat and food for other organisms (Wulff, 1984, 2012, 2016). A few species of CCA can facilitate coral recruitment (Ritson‐Williams, Arnold, & Paul, 2016) and some can also cement and stabilize coral rubble, contribute to net reef accretion, and help maintain reef structure in the absence of live coral. Importantly, the benthic taxa that dominate reefs in the absence of hard coral are rarely included in large‐scale monitoring programs, except as rough percent cover measurements at a coarse taxonomic resolution. Thus, because our study relies on commonly collected monitoring data, there are numerous important ecosystem services that we are either unable to assess (e.g., water filtration, bioprospecting) or can only examine with imperfect proxy data (e.g., fishery value) and/or data for a subset of the key components of that function or service (e.g., coastal protection, tourism value). To predict ecosystem function and services more accurately at low‐coral reefs, there is a need for manipulative experiments to test hypothesized mechanisms between coral cover and services; more comprehensive monitoring data including more finely resolved information on benthic taxa; and improved mechanistic assessments of ecosystem services.
Our results do not argue that we should abandon the “coral” in coral reefs, since live coral creates complex, self‐renewing structure that is able to recover following disturbances and respond to sea level rise (Greer, Jackson, Curran, Guilderson, & Teneva, 2009). Reversing declines in reef‐building corals via addressing climate change; effective reef management including well‐enforced MPAs, coral restoration, and facilitation of coral recruitment (Dixson, Abrego, & Hay, 2014; Kuffner et al., 2006); or more novel approaches to speed coral adaptation (van Oppen et al., 2017), all merit attention. Given that some functions and services are more dependent on physical structure than on coral per se, in addition to the costs and challenges associated with coral restoration, it has been proposed that preservation of relict reef structure or construction of artificial structure may be more relevant and practical in some areas than restoring the coral (Kuffner & Toth, 2016). For example, reducing biological or geochemical causes of structural erosion may be reasonable management targets, and future studies could assess the value of limiting heterotrophic bioeroders (e.g., via reduced nutrient inputs; Ward‐Paige, Risk, Sherwood, & Jaap, 2005), and/or the net impacts of excavating parrotfish on corals (i.e., the relative contribution of bioerosion versus grazing effects that reduce competition from algae). Additionally, strategic deployment of artificial structures can rapidly enhance the function of low‐coral reefs for coastal protection, fish habitat, and tourism value (Kirkbride‐Smith, Wheeler, & Johnson, 2013; Reguero, Beck, Agostini, Kramer, & Hancock, 2018).
4.3. The future for reefs of the Anthropocene
Looking forward, we expect that some of the bright spots (i.e., sites with high levels of some metrics) that we identify at low‐coral sites may decline as reef structure is degraded both by intense events (e.g., hurricanes) and chronic processes (e.g., bioerosion). In part, this may be because some of the bright spots we identified at low‐coral reefs are supported by the relic structure from dead coral. Although in our analysis one source of bioerosion from parrotfish does not vary with coral cover (Figure 3h), carbonate budgets are likely negative for most of the low‐coral sites (Perry et al., 2013). Negative carbonate budgets indicate that hard relief will flatten over time (Alvarez‐Filip et al., 2011), with implications for the long‐term delivery of structure‐dependent reef services. However, some indicators that were not associated with coral cover also did not differ across levels of vertical reef relief (e.g., fishery value and density of large fishes; Figure 5), suggesting that even as structure erodes, some bright spots may remain, particularly if they can benefit from the non‐coral benthic community that persists or develops after coral loss. Fully disentangling the effects of live coral cover from those of structural complexity will require manipulative experimentation and repeated sampling over time, data that were not available for our study.
Coral reef ecosystems also need to contend with the intensifying effects of climate change and other anthropogenic stressors. Bleaching events tightly linked to ocean warming are becoming more common, more severe, and more widespread (Hughes et al., 2017). Bleaching and coral mortality decrease calcification, making it harder for reefs to maintain relief and structure relative to water depth (Blanchon & Shaw, 1995). At the same time, ocean acidification increases bioerosion and carbonate dissolution rates while decreasing the quality of new calcium carbonate laid down by corals and other calcifying organisms (Von Euw et al., 2017). Climate change will also affect reef communities through effects on species interactions, behavior (e.g., Dixson et al., 2014), and physiology, with often unpredictable net effects across communities and ecosystems. Thus, we caution that while our analyses demonstrate that modern low‐coral reefs may maintain some functions and services, it is difficult to predict the consequences of continued global change. Such consequences may depend in part on whether reef management to enhance or preserve bright spots can lessen the impact of global change on certain ecosystem services.
Although we focus our analysis and inferences on the Caribbean, which has experienced major changes over the last several decades, coral loss is a global concern. The higher diversity (including higher diversity of acroporid corals and herbivores) of the Indo‐Pacific may provide greater scope for resilience (Roff & Mumby, 2012), but some Indo‐Pacific reefs also are experiencing rapid and large‐scale coral losses (Hughes et al., 2017, 2019). Lessons learned from studies of low diversity and more degraded Caribbean reefs may be increasingly valuable for global management of the reefs of tomorrow. The study of all types of ecosystems, in both terrestrial and aquatic realms, would benefit from more attention to changes in ecological function and ecosystem services and from a focus on variance instead of changes in means. In the Anthropocene, we are faced with challenging decisions about how to invest limited resources for conservation, management, and restoration, and those resources can be deployed more strategically as we begin to understand the range of ecosystem service outcomes possible from impacted ecosystems.
AUTHOR CONTRIBUTION
S.E.L., A.R., S.J.M., and M.E.H. conceived the research; all authors designed the research; A.K.D., S.D.M., A.R., M.K.D., and J.F.S. analyzed the data; and S.E.L. wrote the paper with contributions from all authors.
Supporting information
Supplementary Material
ACKNOWLEDGEMENTS
We thank the Atlantic Gulf Rapid Reef Assessment (AGRRA) contributors and data managers for data. We thank J. Wulff, K. Hill, J. Lang, J. Gove, N. Tolimieri, J. Cinner, and several anonymous referees for helpful feedback on the manuscript. This contribution is a product of the 2018 Mote Research Working Group, held in Tallahassee, Florida and made possible by the William R. and Lenore Mote Eminent Scholar Chair in Marine Biology endowment at Florida State University.
Lester SE, Rassweiler A, McCoy SJ, et al. Caribbean reefs of the Anthropocene: Variance in ecosystem metrics indicates bright spots on coral depauperate reefs. Glob Change Biol. 2020;26:4785–4799. 10.1111/gcb.15253
DATA AVAILABILITY STATEMENT
All data analyzed in this study are available from the sources cited.
REFERENCES
- AGRRA . (2018). Atlantic and Gulf Rapid Reef Assessment (AGRRA): An online database of AGRRA coral reef survey data. Retrieved from http://agrra.org [Google Scholar]
- Alvarez‐Filip, L. , Gill, J. A. , Dulvy, N. K. , Perry, A. L. , Watkinson, A. R. , & Côté, I. M. (2011). Drivers of region‐wide declines in architectural complexity on Caribbean reefs. Coral Reefs, 30(4), 1051–1060. 10.1007/s00338-011-0795-6 [DOI] [Google Scholar]
- Bates, D. , Maechler, M. , Bolker, B. , & Walker, S. (2015). Fitting linear mixed‐effects models using lme4. Journal of Statistical Software, 67(1), 1–48. 10.18637/jss.v067.i01 [DOI] [Google Scholar]
- Bell, J. J. , Rovellini, A. , Davy, S. K. , Taylor, M. W. , Fulton, E. A. , Dunn, M. R. , … Webster, N. S. (2018). Climate change alterations to ecosystem dominance: How might sponge‐dominated reefs function? Ecology, 99, 1920–1931. 10.1002/ecy.2446 [DOI] [PubMed] [Google Scholar]
- Bellwood, D. R. , Goatley, C. H. R. , & Bellwood, O. (2017). The evolution of fishes and corals on reefs: Form, function and interdependence. Biological Reviews, 92(2), 878–901. 10.1111/brv.12259 [DOI] [PubMed] [Google Scholar]
- Blanchon, P. , & Shaw, J. (1995). Reef drowning during the last deglaciation: Evidence for catastrophic sea‐level rise and ice‐sheet collapse. Geology, 23(1), 4–8. [DOI] [Google Scholar]
- Brooks, M. E. , Kristensen, K. , van Benthem, K. J. , Magnusson, A. , Berg, C. W. , Nielsen, A. , … Bolker, B. M. (2017). glmmTMB balances speed and flexibility among packages for zero‐inflated generalized linear mixed modeling. The R Journal, 9, 400 10.3929/ethz-b-000240890 [DOI] [Google Scholar]
- Bruno, J. F. , Côté, I. M. , & Toth, L. T. (2019). Climate change, coral loss, and the curious case of the parrotfish paradigm: Why don't marine protected areas improve reef resilience? Annual Review of Marine Science, 11(1), 307–334. 10.1146/annurev-marine-010318-095300 [DOI] [PubMed] [Google Scholar]
- Bruno, J. F. , Sweatman, H. , Precht, W. F. , Selig, E. R. , & Schutte, V. G. W. (2009). Assessing evidence of phase shifts from coral to macroalgal dominance on coral reefs. Ecology, 90(6), 1478–1484. 10.1890/08-1781.1 [DOI] [PubMed] [Google Scholar]
- Burkepile, D. E. , & Hay, M. E. (2008). Herbivore species richness and feeding complementarity affect community structure and function on a coral reef. Proceedings of the National Academy of Sciences of the United States of America, 105(42), 16201–16206. 10.1073/pnas.0801946105 [DOI] [PMC free article] [PubMed] [Google Scholar]
- Cinner, J. E. , Huchery, C. , MacNeil, M. A. , Graham, N. A. J. , McClanahan, T. R. , Maina, J. , … Mouillot, D. (2016). Bright spots among the world's coral reefs. Nature, 535, 416–419. 10.1038/nature18607 [DOI] [PubMed] [Google Scholar]
- Clements, C. S. , & Hay, M. E. (2019). Biodiversity enhances coral growth, tissue survivorship and suppression of macroalgae. Nature Ecology & Evolution, 3(2), 178–182. 10.1038/s41559-018-0752-7 [DOI] [PMC free article] [PubMed] [Google Scholar]
- Cohen, J. (1988). Statistical power analysis for the behavioral sciences. New York, NY: Routledge. [Google Scholar]
- Cramer, K. L. , Jackson, J. B. C. , Donovan, M. K. , Greenstein, B. J. , Korpanty, C. A. , Cook, G. M. , & Pandolfi, J. M. (2020). Widespread loss of Caribbean acroporid corals was underway before coral bleaching and disease outbreaks. Science Advances, 6(17), eaax9395 10.1126/sciadv.aax9395 [DOI] [PMC free article] [PubMed] [Google Scholar]
- Cruz, I. C. S. , Loiola, M. , Albuquerque, T. , Reis, R. , de Anchieta, C. C. , Nunes, J. , … Creed, J. C. (2015). Effect of phase shift from corals to zoantharia on reef fish assemblages. PLoS One, 10(1), e0116944 10.1371/journal.pone.0116944 [DOI] [PMC free article] [PubMed] [Google Scholar]
- Dixson, D. L. , Abrego, D. , & Hay, M. E. (2014). Chemically mediated behavior of recruiting corals and fishes: A tipping point that may limit reef recovery. Science, 345(6199), 892–897. 10.1126/science.1255057 [DOI] [PMC free article] [PubMed] [Google Scholar] [Retracted]
- Donovan, M. K. , Friedlander, A. M. , Lecky, J. , Jouffray, J.‐B. , Williams, G. J. , Wedding, L. M. , … Selkoe, K. A. (2018). Combining fish and benthic communities into multiple regimes reveals complex reef dynamics. Scientific Reports, 8(1), 16943 10.1038/s41598-018-35057-4 [DOI] [PMC free article] [PubMed] [Google Scholar]
- Duffy, J. E. , Lefcheck, J. S. , Stuart‐Smith, R. D. , Navarrete, S. A. , & Edgar, G. J. (2016). Biodiversity enhances reef fish biomass and resistance to climate change. Proceedings of the National Academy of Sciences of the United States of America, 113(22), 6230–6235. 10.1073/pnas.1524465113 [DOI] [PMC free article] [PubMed] [Google Scholar]
- Ferrario, F. , Beck, M. W. , Storlazzi, C. D. , Micheli, F. , Shepard, C. C. , & Airoldi, L. (2014). The effectiveness of coral reefs for coastal hazard risk reduction and adaptation. Nature Communications, 5, 3794 10.1038/ncomms4794 [DOI] [PMC free article] [PubMed] [Google Scholar]
- Gardner, T. A. , Côté, I. M. , Gill, J. A. , Grant, A. , & Watkinson, A. R. (2003). Long‐term region‐wide declines in Caribbean corals. Science, 301(5635), 958–960. 10.1126/science.1086050 [DOI] [PubMed] [Google Scholar]
- Gill, D. A. , Schuhmann, P. W. , & Oxenford, H. A. (2015). Recreational diver preferences for reef fish attributes: Economic implications of future change. Ecological Economics, 111, 48–57. 10.1016/j.ecolecon.2015.01.004 [DOI] [Google Scholar]
- González‐Barrios, F. J. , & Álvarez‐Filip, L. (2018). A framework for measuring coral species‐specific contribution to reef functioning in the Caribbean. Ecological Indicators, 95, 877–886. 10.1016/j.ecolind.2018.08.038 [DOI] [Google Scholar]
- Graham, N. A. J. , Cinner, J. E. , Norström, A. V. , & Nyström, M. (2014). Coral reefs as novel ecosystems: Embracing new futures. Current Opinion in Environmental Sustainability, 7(Supplement C), 9–14. 10.1016/j.cosust.2013.11.023 [DOI] [Google Scholar]
- Graham, N. , Dulvy, N. , Jennings, S. , & Polunin, N. (2005). Size‐spectra as indicators of the effects of fishing on coral reef fish assemblages. Coral Reefs, 24(1), 118–124. 10.1007/s00338-004-0466-y [DOI] [Google Scholar]
- Graham, N. A. J. , & Nash, K. L. (2013). The importance of structural complexity in coral reef ecosystems. Coral Reefs, 32(2), 315–326. 10.1007/s00338-012-0984-y [DOI] [Google Scholar]
- Greer, L. , Jackson, J. E. , Curran, H. A. , Guilderson, T. , & Teneva, L. (2009). How vulnerable is Acropora cervicornis to environmental change? Lessons from the early to middle Holocene. Geology, 37(3), 263–266. 10.1130/G25479A.1 [DOI] [Google Scholar]
- Hay, M. E. (1984). Patterns of fish and urchin grazing on Caribbean coral reefs: Are previous results typical? Ecology, 65(2), 446–454. 10.2307/1941407 [DOI] [Google Scholar]
- Hobbs, R. J. (2016). Degraded or just different? Perceptions and value judgements in restoration decisions. Restoration Ecology, 24(2), 153–158. 10.1111/rec.12336 [DOI] [Google Scholar]
- Hobbs, R. J. , Arico, S. , Aronson, J. , Baron, J. S. , Bridgewater, P. , Cramer, V. A. , … Zobel, M. (2006). Novel ecosystems: Theoretical and management aspects of the new ecological world order. Global Ecology and Biogeography, 15(1), 1–7. 10.1111/j.1466-822X.2006.00212.x [DOI] [Google Scholar]
- Hobbs, R. J. , Higgs, E. , Hall, C. M. , Bridgewater, P. , Chapin, F. S. , Ellis, E. C. , … Yung, L. (2014). Managing the whole landscape: Historical, hybrid, and novel ecosystems. Frontiers in Ecology and the Environment, 12(10), 557–564. 10.1890/130300 [DOI] [Google Scholar]
- Hubbard, D. K. , & Dullo, W. (2016). The changing face of reef building In Hubbard D. K., Rogers C. S., Lipps J. H., & Stanley G. D., Jr. (Eds.), Coral reefs at the crossroads (pp. 127–154). The Netherlands: Springer; 10.1007/978-94-017-7567-0 [DOI] [Google Scholar]
- Hughes, T. P. (1994). Catastrophes, phase shifts, and large‐scale degradation of a Caribbean coral reef. Science, 265(5178), 1547–1551. 10.1126/science.265.5178.1547 [DOI] [PubMed] [Google Scholar]
- Hughes, T. P. , Barnes, M. L. , Bellwood, D. R. , Cinner, J. E. , Cumming, G. S. , Jackson, J. B. C. , … Scheffer, M. (2017). Coral reefs in the Anthropocene. Nature, 546, 82–90. 10.1038/nature22901 [DOI] [PubMed] [Google Scholar]
- Hughes, T. P. , Kerry, J. T. , Baird, A. H. , Connolly, S. R. , Chase, T. J. , Dietzel, A. , … Woods, R. M. (2019). Global warming impairs stock–recruitment dynamics of corals. Nature, 568(7752), 387–390. 10.1038/s41586-019-1081-y [DOI] [PubMed] [Google Scholar]
- Hughes, T. P. , Rodrigues, M. J. , Bellwood, D. R. , Ceccarelli, D. , Hoegh‐Guldberg, O. , McCook, L. , … Willis, B. (2007). Phase shifts, herbivory, and the resilience of coral reefs to climate change. Current Biology, 17(4), 360–365. 10.1016/j.cub.2006.12.049 [DOI] [PubMed] [Google Scholar]
- Huntington, B. E. , Miller, M. W. , Pausch, R. , & Richter, L. (2017). Facilitation in Caribbean coral reefs: High densities of staghorn coral foster greater coral condition and reef fish composition. Oecologia, 184(1), 247–257. 10.1007/s00442-017-3859-7 [DOI] [PubMed] [Google Scholar]
- IUCN . (2019). The IUCN Red List of Threatened Species. Version 2019‐2. Retrieved from http://www.iucnredlist.org [Google Scholar]
- Jackson, J. B. C. (1997). Reefs since Columbus. Coral Reefs, 16(1), S23–S32. 10.1007/s003380050238 [DOI] [Google Scholar]
- Jackson, J. , Donovan, M. , Cramer, K. , & Lam, W. (2014). Status and trends of Caribbean coral reefs: 1970–2012. Gland, Switzerland: Global Coral Reef Monitoring Network, IUCN. [Google Scholar]
- Kirkbride‐Smith, A. E. , Wheeler, P. M. , & Johnson, M. L. (2013). The relationship between diver experience levels and perceptions of attractiveness of artificial reefs – Examination of a potential management tool. PLoS One, 8(7), e68899 10.1371/journal.pone.0068899 [DOI] [PMC free article] [PubMed] [Google Scholar]
- Kuffner, I. B. , & Toth, L. T. (2016). A geological perspective on the degradation and conservation of western Atlantic coral reefs. Conservation Biology, 30(4), 706–715. 10.1111/cobi.12725 [DOI] [PubMed] [Google Scholar]
- Kuffner, I. B. , Walters, L. J. , Becerro, M. A. , Paul, V. J. , Ritson‐Williams, R. , & Beach, K. S. (2006). Inhibition of coral recruitment by macroalgae and cyanobacteria. Marine Ecology Progress Series, 323, 107–117. 10.3354/meps323107 [DOI] [Google Scholar]
- Ladd, M. C. , Miller, M. W. , Hunt, J. H. , Sharp, W. C. , & Burkepile, D. E. (2018). Harnessing ecological processes to facilitate coral restoration. Frontiers in Ecology and the Environment, 16(4), 239–247. 10.1002/fee.1792 [DOI] [Google Scholar]
- Lidz, B. H. , & Hallock, P. (2000). Sedimentary petrology of a declining reef ecosystem, Florida reef tract (U.S.A.). Journal of Coastal Research, 16(3), 675–697. http://www.jstor.org/stable/4300079 [Google Scholar]
- Luckhurst, B. E. , & Luckhurst, K. (1978). Analysis of the influence of substrate variables on coral reef fish communities. Marine Biology, 49(4), 317–323. 10.1007/bf00455026 [DOI] [Google Scholar]
- Matos‐Caraballo, D. (2012). Puerto Rico/NMFS Cooperative Fisheries Statistics Program April 2007–September 2012. NA07NMF4340039. Puerto Rico Department of Natural and Environmental Resources; Retrieved from https://estadisticas.pr/files/Inventario/publicaciones/DRNA_CommercialFisheriesStatistics_2007‐2011_0.pdf [Google Scholar]
- Moberg, F. , & Folke, C. (1999). Ecological goods and services of coral reef ecosystems. Ecological Economics, 29(2), 215–233. 10.1016/S0921-8009(99)00009-9 [DOI] [Google Scholar]
- Mora, C. (2008). A clear human footprint in the coral reefs of the Caribbean. Proceedings of the Royal Society B: Biological Sciences, 275(1636), 767–773. 10.1098/rspb.2007.1472 [DOI] [PMC free article] [PubMed] [Google Scholar]
- Mora, C. , Andréfouët, S. , Costello, M. J. , Kranenburg, C. , Rollo, A. , Veron, J. , … Myers, R. A. (2006). Coral reefs and global network of marine protected areas. Science, 312, 1750–1751. [DOI] [PubMed] [Google Scholar]
- Mumby, P. J. (2006). The impact of exploiting grazers (Scaridae) on the dynamics of Caribbean coral reefs. Ecological Applications, 16(2), 747–769. 10.1890/1051-0761(2006)016[0747:tioegs]2.0.co;2 [DOI] [PubMed] [Google Scholar]
- Mumby, P. J. , Broad, K. , Brumbaugh, D. R. , Dahlgren, C. P. , Harborne, A. R. , Hastings, A. , … Sanchirico, J. (2008). Coral reef habitats as surrogates of species, ecological functions, and ecosystem services. Conservation Biology, 22(4), 941–951. 10.1111/j.1523-1739.2008.00933.x [DOI] [PubMed] [Google Scholar]
- Norström, A. V. , Nyström, M. , Lokrantz, J. , & Folke, C. (2009). Alternative states on coral reefs: Beyond coral–macroalgal phase shifts. Marine Ecology Progress Series, 376, 295–306. 10.3354/meps07815 [DOI] [Google Scholar]
- Paddack, M. J. , Reynolds, J. D. , Aguilar, C. , Appeldoorn, R. S. , Beets, J. , Burkett, E. W. , … Côté, I. M. (2009). Recent region‐wide declines in Caribbean reef fish abundance. Current Biology, 19(7), 590–595. 10.1016/j.cub.2009.02.041 [DOI] [PubMed] [Google Scholar]
- Pandolfi, J. M. , Bradbury, R. H. , Sala, E. , Hughes, T. P. , Bjorndal, K. A. , Cooke, R. G. , … Jackson, J. B. C. (2003). Global trajectories of the long‐term decline of coral reef ecosystems. Science, 301(5635), 955–958. 10.1126/science.1085706 [DOI] [PubMed] [Google Scholar]
- Perry, C. T. , Murphy, G. N. , Kench, P. S. , Smithers, S. G. , Edinger, E. N. , Steneck, R. S. , & Mumby, P. J. (2013). Caribbean‐wide decline in carbonate production threatens coral reef growth. Nature Communications, 4, 1402 10.1038/ncomms2409 [DOI] [PMC free article] [PubMed] [Google Scholar]
- Pratchett, M. S. , Hoey, A. S. , & Wilson, S. K. (2014). Reef degradation and the loss of critical ecosystem goods and services provided by coral reef fishes. Current Opinion in Environmental Sustainability, 7, 37–43. 10.1016/j.cosust.2013.11.022 [DOI] [Google Scholar]
- R Core Team . (2018). R: A language and environment for statistical computing. R Foundation for Statistical Computing; Retrieved from https://www.R‐project.org/ [Google Scholar]
- Reguero, B. G. , Beck, M. W. , Agostini, V. N. , Kramer, P. , & Hancock, B. (2018). Coral reefs for coastal protection: A new methodological approach and engineering case study in Grenada. Journal of Environmental Management, 210, 146–161. 10.1016/j.jenvman.2018.01.024 [DOI] [PubMed] [Google Scholar]
- Risk, M. J. (1972). Fish diversity on a coral reef in the Virgin Islands. Atoll Research Bulletin, 153, 1–4. 10.5479/si.00775630.153.1 [DOI] [Google Scholar]
- Ritson‐Williams, R. , Arnold, S. N. , & Paul, V. J. (2016). Patterns of larval settlement preferences and post‐settlement survival for seven Caribbean corals. Marine Ecology Progress Series, 548, 127–138. 10.3354/meps11688 [DOI] [Google Scholar]
- Robinson, J. P. W. , Wilson, S. K. , Robinson, J. , Gerry, C. , Lucas, J. , Assan, C. , … Graham, N. A. J. (2019). Productive instability of coral reef fisheries after climate‐driven regime shifts. Nature Ecology & Evolution, 3(2), 183–190. 10.1038/s41559-018-0715-z [DOI] [PubMed] [Google Scholar]
- Roff, G. , & Mumby, P. J. (2012). Global disparity in the resilience of coral reefs. Trends in Ecology & Evolution, 27(7), 404–413. 10.1016/j.tree.2012.04.007 [DOI] [PubMed] [Google Scholar]
- Rogers, A. , Blanchard, J. L. , & Mumby, P. J. (2014). Vulnerability of coral reef fisheries to a loss of structural complexity. Current Biology, 24(9), 1000–1005. 10.1016/j.cub.2014.03.026 [DOI] [PubMed] [Google Scholar]
- Rogers, A. , Harborne, A. R. , Brown, C. J. , Bozec, Y. M. , Castro, C. , Chollett, I. , … Mumby, P. J. (2015). Anticipative management for coral reef ecosystem services in the 21st century. Global Change Biology, 21(2), 504–514. 10.1111/gcb.12725 [DOI] [PubMed] [Google Scholar]
- Russ, G. R. , Questel, S.‐L.‐A. , Rizzari, J. R. , & Alcala, A. C. (2015). The parrotfish–coral relationship: Refuting the ubiquity of a prevailing paradigm. Marine Biology, 162(10), 2029–2045. 10.1007/s00227-015-2728-3 [DOI] [Google Scholar]
- Ruttenberg, B. I. , Adam, T. C. , Duran, A. , & Burkepile, D. E. (2019). Identity of coral reef herbivores drives variation in ecological processes over multiple spatial scales. Ecological Applications, 29, e01893 10.1002/eap.1893 [DOI] [PubMed] [Google Scholar]
- Steneck, R. S. , Mumby, P. J. , MacDonald, C. , Rasher, D. B. , & Stoyle, G. (2018). Attenuating effects of ecosystem management on coral reefs. Science Advances, 4(5), eaao5493 10.1126/sciadv.aao5493 [DOI] [PMC free article] [PubMed] [Google Scholar]
- Uyarra, M. C. , Cote, I. M. , Gill, J. A. , Tinch, R. R. T. , Viner, D. , & Watkinson, A. R. (2005). Island‐specific preferences of tourists for environmental features: Implications of climate change for tourism‐dependent states. Environmental Conservation, 32(1), 11–19. 10.1017/S0376892904001808 [DOI] [Google Scholar]
- Uyarra, M. C. , Watkinson, A. R. , & Côté, I. M. (2009). Managing dive tourism for the sustainable use of coral reefs: Validating diver perceptions of attractive site features. Environmental Management, 43(1), 1–16. 10.1007/s00267-008-9198-z [DOI] [PubMed] [Google Scholar]
- Valdivia, A. , Cox, C. E. , & Bruno, J. F. (2017). Predatory fish depletion and recovery potential on Caribbean reefs. Science Advances, 3(3), e1601303 10.1126/sciadv.1601303 [DOI] [PMC free article] [PubMed] [Google Scholar]
- van Oppen, M. J. H. , Gates, R. D. , Blackall, L. L. , Cantin, N. , Chakravarti, L. J. , Chan, W. Y. , … Putnam, H. M. (2017). Shifting paradigms in restoration of the world's coral reefs. Global Change Biology, 23(9), 3437–3448. 10.1111/gcb.13647 [DOI] [PubMed] [Google Scholar]
- Vergés, A. , Steinberg, P. D. , Hay, M. E. , Poore, A. G. B. , Campbell, A. H. , Ballesteros, E. , … Wilson, S. K. (2014). The tropicalization of temperate marine ecosystems: Climate‐mediated changes in herbivory and community phase shifts. Proceedings of the Royal Society B: Biological Sciences, 281(1789). 10.1098/rspb.2014.0846 [DOI] [PMC free article] [PubMed] [Google Scholar]
- Von Euw, S. , Zhang, Q. , Manichev, V. , Murali, N. , Gross, J. , Feldman, L. C. , … Falkowski, P. G. (2017). Biological control of aragonite formation in stony corals. Science, 356(6341), 933–938. 10.1126/science.aam6371 [DOI] [PubMed] [Google Scholar]
- Ward‐Paige, C. A. , Risk, M. J. , Sherwood, O. A. , & Jaap, W. C. (2005). Clionid sponge surveys on the Florida Reef Tract suggest land‐based nutrient inputs. Marine Pollution Bulletin, 51(5), 570–579. 10.1016/j.marpolbul.2005.04.006 [DOI] [PubMed] [Google Scholar]
- Williams, I. D. , & Polunin, N. V. C. (2002). Differences between protected and unprotected reefs of the western Caribbean in attributes preferred by dive tourists. Environmental Conservation, 27(4), 382–391. 10.1017/S0376892900000436 [DOI] [Google Scholar]
- Woodhead, A. J. , Hicks, C. C. , Norström, A. V. , Williams, G. J. , & Graham, N. A. J. (2019). Coral reef ecosystem services in the Anthropocene. Functional Ecology, 33(6), 1023–1034. 10.1111/1365-2435.13331 [DOI] [Google Scholar]
- Wulff, J. (2012). Ecological interactions and the distribution, abundance, and diversity of sponges. Advances in Marine Biology, 61, 274–344. 10.1016/B978-0-12-387787-1.00003-9 [DOI] [PubMed] [Google Scholar]
- Wulff, J. (2016). Sponge contributions to the geology and biology of reefs: Past, present, and future In Hubbard D. K., Rogers C. S., Lipps J. H., & Stanley J. G. D. (Eds.), Coral reefs at the crossroads (pp. 103–126). The Netherlands: Springer; 10.1007/978-94-017-7567-0_5 [DOI] [Google Scholar]
- Wulff, J. L. (1984). Sponge‐mediated coral reef growth and rejuvenation. Coral Reefs, 3(3), 157–163. 10.1007/bf00301960 [DOI] [Google Scholar]
- Yee, S. H. , Carriger, J. F. , Bradley, P. , Fisher, W. S. , & Dyson, B. (2015). Developing scientific information to support decisions for sustainable coral reef ecosystem services. Ecological Economics, 115, 39–50. 10.1016/j.ecolecon.2014.02.016 [DOI] [Google Scholar]
Associated Data
This section collects any data citations, data availability statements, or supplementary materials included in this article.
Supplementary Materials
Supplementary Material
Data Availability Statement
All data analyzed in this study are available from the sources cited.