

Abstract
Regulatory T cells (Treg) play a critical role in immune tolerance. The scarcity of Treg therapy clinical trials in humans has been largely due to the difficulty in obtaining sufficient Treg numbers. We performed a preclinical investigation on the potential of mesenchymal stromal cells (MSCs) to expand Treg in vitro to support future clinical trials. Human peripheral blood mononuclear cells from healthy donors were cocultured with allogeneic bone marrow‐derived MSCs expanded under xenogeneic‐free conditions. Our data show an increase in the counts and frequency of CD4+ CD25high Foxp3+ CD127low Treg cells (4‐ and 6‐fold, respectively) after a 14‐day coculture. However, natural Treg do not proliferate in coculture with MSCs. When purified conventional CD4 T cells (Tcon) are cocultured with MSCs, only cells that acquire a Treg‐like phenotype proliferate. These MSC‐induced Treg‐like cells also resemble Treg functionally, since they suppress autologous Tcon proliferation. Importantly, the DNA methylation profile of MSC‐induced Treg‐like cells more closely resembles that of natural Treg than of Tcon, indicating that this population is stable. The expression of PD‐1 is higher in Treg‐like cells than in Tcon, whereas the frequency of PDL‐1 increases in MSCs after coculture. TGF‐β levels are also significantly increased MSC cocultures. Overall, our data suggest that Treg enrichment by MSCs results from Tcon conversion into Treg‐like cells, rather than to expansion of natural Treg, possibly through mechanisms involving TGF‐β and/or PD‐1/PDL‐1 expression. This MSC‐induced Treg population closely resembles natural Treg in terms of phenotype, suppressive ability, and methylation profile.
Keywords: cell‐ and tissue‐based therapy, DNA methylation, mesenchymal stromal cells, regulatory T lymphocytes
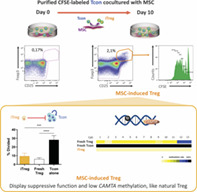
Coculture in vitro of purified human conventional CD4 T cells (Tcon) with mesenchymal stromal cells (MSCs) induces a population of regulatory T cells (Treg). MSC‐induced Treg (iTreg) express CD25 and Foxp3, proliferate in culture, suppress Tcon proliferation such as fresh Treg, and display low levels of DNA methylation in CAMTA1, more closely resembling fresh Treg than the Tcon they arose from.
Significance statement.
Regulatory T cells (Treg) have been increasingly recognized for their application in the treatment of chronic inflammatory diseases. However, Treg are very scarce and may need to be expanded in vitro to obtain clinically relevant numbers. The induction of Treg from conventional CD4 T cells (Tcon) is particularly appealing due to the abundance of this population. However, the stability and functional ability of induced Treg need to be thoroughly ensured prior to clinical application. Mesenchymal stromal cells (MSCs) have been suggested to recruit Treg in vitro, although the underlying mechanisms are so far poorly understood. This study demonstrates for the first time that MSCs are able to induce functional Treg through epigenetic modification of human Tcon in vitro. These data suggest that MSC‐induced Treg have a potential application as a cellular therapy in clinical settings where immune tolerance is compromised.
1. INTRODUCTION
Regulatory T cells (Treg) are a key population in immune tolerance and their potential use in the treatment of chronic inflammatory diseases has been increasingly investigated. In allogeneic hematopoietic stem cell transplantation (allo‐HSCT), lower Treg counts are associated with the development of chronic graft vs host disease (cGVHD). 1 , 2 Adoptive immunotherapy with donor Treg has been reported to successfully prevent GVHD after allo HSCT. 3 , 4 , 5 Our group is currently coordinating a Horizon 2020‐funded consortium, TREGeneration, in which parallel phase I/II clinical trials are assessing the safety and efficacy of donor Treg infusion in patients with steroid‐refractory cGVHD (www.tregeneration.eu). Nevertheless, adoptive Treg therapy in humans still presents many challenges, particularly the difficulty in obtaining sufficient numbers of clinical grade Treg. Due to the paucity of Treg in the peripheral blood, the expansion of these cells in vitro has been investigated as a strategy to increase Treg yield. 3 , 6
Like Treg, mesenchymal stromal cells (MSCs) also constitute an important immunoregulatory population. MSCs are multipotent progenitor cells able to differentiate into diverse mesodermal lineages that can be isolated from a wide range of adult and fetal tissues. 7 MSCs play a suppressive role by inhibiting both innate and adaptive immune responses. 8 Previous studies suggest that MSC‐mediated immunomodulation may be partly driven by Treg induction and/or expansion. 9 , 10 , 11 , 12 , 13 However, these reports have not assessed Treg yield in terms of absolute counts, 10 , 13 nor characterized the resulting Treg‐like cells in detail. 9 , 11 , 12 Thus far, the potential of MSCs to recruit Treg has been poorly understood.
In the present study, we sought to determine whether MSCs are able to induce and/or expand Treg in vitro, as well as the mechanisms of Treg enrichment by MSCs.
2. MATERIALS AND METHODS
2.1. Cell isolation
Peripheral blood mononuclear cells (PBMC) were isolated by Ficoll‐Hypaque density gradient (Amersham Pharmacia Biotech) from peripheral blood of healthy volunteers, after informed consent with the approval of the Ethics Committee of Lisbon Academic Medical Centre.
CD4 T cells were negatively selected using the EasySep Human CD4+ T‐cell enrichment kit (StemCell Technologies), stained for CD3, CD4, CD25, and CD127, and subsequently sorted into Treg and Tcon cells using a FACSAria flow cytometer (BD Biosciences).
2.2. Human bone marrow MSC cultures
Bone marrow (BM) MSCs used in this study are part of the cell bank of the Stem Cell Engineering Research Group, iBB‐Institute for Bioengineering and Biosciences at Instituto Superior Técnico. BM aspirates were obtained from healthy donors after written informed consent with the approval of the Ethics Committee of Instituto Português de Oncologia Francisco Gentil, Lisboa, Portugal. BM MSCs were isolated, as previously described, 14 and cryopreserved. BM MSCs expressed their characteristic immunophenotype, being positive for CD73, CD90, and CD105, and negative for CD31, CD34, CD45, and CD80. BM MSCs were thawed and seeded at 3000 cells/cm2 using StemPro MSC SFM XenoFree medium on tissue culture flasks precoated with CELLstartCTS (Life Technologies), as described elsewhere. 7 For these studies, BM MSCs within passages 4 to 6 from five donors (both male and female; aged 26‐60 years) were used.
2.3. Coculture of MSCs and lymphocyte populations
Cells were cultured in RPMI 1640 (Invitrogen) supplemented with 10% heat‐inactivated human AB serum (Sigma‐Aldrich), 100 U/mL penicillin, 100 mg/mL streptomycin, and 2 mM L‐glutamine (Invitrogen), in the presence or absence of recombinant human IL‐2 (10 U/mL; Peprotech). MSCs and PBMC (1.6 × 10⁶ per well) or purified T‐cell populations (3 × 10⁶ total lymphocytes per well) were cultured in six‐well plates at 37°C and 5% CO2 in a humidified atmosphere. Supernatants were collected and fresh culture medium was added every 3 to 4 days.
2.4. Phenotypic analysis
Cells were stained with the following antihuman monoclonal antibodies: PD‐L1 (130021) Alexa Fluor 488 (R&D Systems); PD1 (EH12.1) BB515, CD15s (CSLEX1) PE‐CF594 (BD Horizon); GITR (621) PE (Biolegend); CD25 (M‐A251) PE‐CY7 (BD Pharmingen); CD3 (OKT3) PerCPCY5.5; CD4 (RPAT4) APC; CD127 (eBioRDR5) APCeFlour780 (eBioscience).
Intracellular staining for Bcl‐2 (Bcl‐2/100) FITC, Ki67 (20Raj1) FITC and FoxP3 (PCH101) e450 (eBioscience) was performed using fixation and permeabilization reagents from eBioscience. Samples were acquired on an LSR Fortessa flow cytometer (BD Biosciences) after fixation with 1% formaldehyde (Sigma‐Aldrich). Data were analyzed using FlowJo9.
2.5. Suppression assay
Fresh autologous Treg, Tcon, and CD4neg PBMC were purified by FACSorting. Tcon were labeled with 0.5 μM CellTrace CFSE cell proliferation kit (ThermoFisher). CFSE Tcon responder cells (1.5‐2.5 × 10⁴ per well) were plated with different suppressor populations at 1:0, 8:1, 4:1, 2:1, and 1:1 responder to suppressor ratios in 96‐well round bottom plates. Cells were activated with the Treg suppression inspector kit (Miltenyi Biotec) at a 1:1 bead‐to‐cell ratio for 4 days before acquisition.
2.6. Cytokine quantification in culture supernatants
Supernatants were collected at different time points of MSC coculture. Cytokine levels were quantified by ELISA or multiplex analysis: human indoleamine 2,3‐dioxygenase (IDO) ELISA kit (Sunred Biological Technology); DetectX Prostaglandin E2 EIA kit (Arbor Assays); human TGF‐β single‐plex HDR assay chemiluminescent; IL‐10, TNF‐α, and IFN‐γ Q‐Plex multiplex ELISA arrays (Quansys). Image analysis was performed using the Q‐View Imager. Samples were tested undiluted in duplicate. Levels of luminescent or pixel intensity units were measured by the Q‐View Software. Assays were performed and analyzed by tebu‐bio.
2.7. Isolation of genomic DNA and bisulphite conversion
Genomic DNA (gDNA) from Treg and Tcon was isolated with the Quick‐gDNA MiniPrep kit (Zymo Research). Bisulphite (BS) conversion of gDNA from all cell populations was performed at the same time with EZ DNA methylation lightning kit (Zymo Research).
TSDR and CAMTA1 gene regions were amplified with nonmethylation‐, BS DNA‐, strand‐specific forward (Fw) and reverse (Rev) primers and cloned into pGEM‐T Easy vector (Promega) via NcoI and NsiI restriction sites, as previously described. 15 Plasmid DNAs from 22 to 24 clones were isolated using plasmid NZYMiniprep kit (NZYtech) and 20 to 22 positive clones were sequenced using reverse SP6 primer: 5′‐GTGACACTATAGAATACTC‐3′ (Stabvida). Sequences (AB1 files containing chromatograms) were aligned to each gene region's reference sequence using SeqMan software (DNA Star Lasergene 8). All nonmethylated cytosines (C) were identified by the presence of a thymidine (T) in BS‐converted sequences, whereas methylated C (mC) were identified by a C. Efficiency of BS conversion was confirmed by conversion of non‐CpG C to T. The percentage of methylation in each CpG position was determined by defining the proportion of mC in the total of 20. As both gene regions were amplified from the same BS DNA template, the methylation differences reflect the average methylation status of the cell population.
2.8. Statistical analysis
Statistical analysis was performed using GraphPad Prism 7 (GraphPad Software). Data are presented as mean with SE of mean. Statistical analysis was performed using one‐ or two‐way analysis of variance (ANOVA), or paired t test, as appropriate. P values <.05 were considered significant.
3. RESULTS
3.1. MSC coculture increases counts and frequency of Treg‐like cells
We investigated the ability of MSCs to support Treg survival and/or expansion in MSC+PBMC cocultures. We cocultured PBMC from healthy donors with allogeneic BM‐derived MSCs expanded under xenogeneic‐free conditions, in the presence or absence of IL‐2. As a control, we cultured PBMC alone, with or without IL‐2. We first compared two MSC:PBMC ratios (1:5 and 1:3) and found that MSC:PBMC 1:3 was the optimal ratio in terms of Treg yield for most of the donors tested (data not shown).
At each time point, we assessed the frequency and absolute counts of different lymphocyte populations by flow cytometry, particularly of CD4+ CD25high Foxp3+ CD127low Treg and CD4+ CD25− Foxp3− conventional CD4 T cells (Tcon) (Figure 1). We found that MSCs at a 1:3 ratio induce an approximately 6‐fold increase in the frequency of Treg within T cells compared to PBMC cultured alone (Figure 1A,B; P < .0001). Importantly, Treg counts also dramatically increased in the presence of MSCs, both compared to PBMC cultured alone (P = .0003) and to day 0 (P = .0035) (Figure 1C). In contrast, the frequency and counts of Tcon (Figures 1D,E), as well as the frequency of CD8 T cells (Figure 1F), were not increased in the presence of MSCs. In fact, total cell numbers decreased in MSC+PBMC cocultures (Figure 1G). Hence, MSC coculture appears to specifically increase Treg levels.
FIGURE 1.

MSC+PBMC cocultures increase the absolute counts and frequency of Treg cells. A, Representative dot‐plots of CD25 and Foxp3 expression within CD4 T cells at days 0, 7, and 14 of PBMC alone (top panel) and MSC:PBMC 1:3 cocultures (bottom panel). Frequency of regulatory (Treg, CD4+ CD25bright IL7R− Foxp3+) (B), conventional CD4 (Tcon, CD4+ CD25− Foxp3−) (D), and CD8 T cells (CD4−) (F) was assessed by flow cytometry within CD3+ T cells before and after culture (n = 4 for each culture condition). Viable cell counts were assessed with a hemocytometer before and after culture. Absolute counts of Treg (C), Tcon (E), and total cells (G) are shown (n = 4 for each culture condition). Graphs show mean values plus or minus SEM. Statistical analysis was performed using two‐way ANOVA (**P < .01, ***P < .001, ****P < .0001 between PBMC alone and MSC:PBMC 1:3)
3.2. MSC coculture does not induce Treg proliferation
We then assessed if the increase in Treg counts observed in MSC+PBMC cocultures was due to Treg expansion. We evaluated cell proliferation by Ki67 expression (Figure 2A‐C). In the absence of IL‐2, we found only negligible levels of proliferation within Treg (Figure 2A,B) and Tcon (Figure 2C), even in the presence of MSCs, which can be explained by the fact that MSCs are a suppressive population. This repression was overcome by the addition of IL‐2 (Figure 2A‐C). The lack of Treg proliferation suggests that MSCs increase the Treg pool by converting Tcon into induced Treg (iTreg), rather than by expanding natural Treg (nTreg).
FIGURE 2.
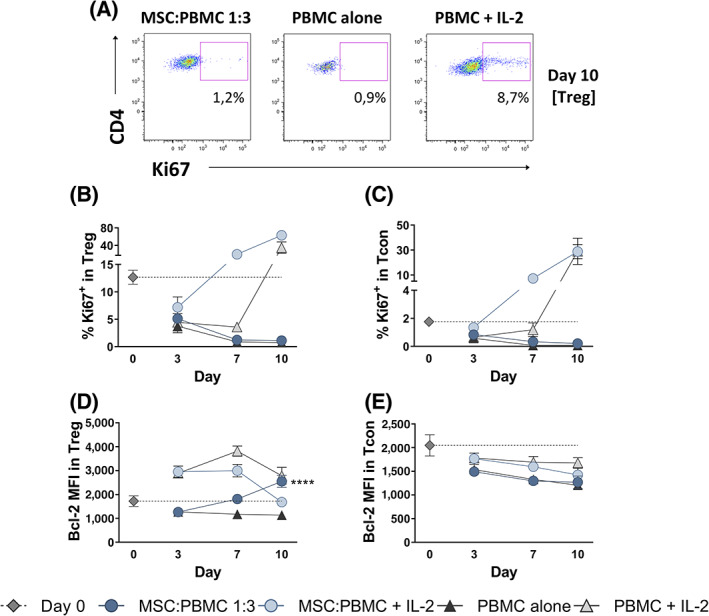
MSC+PBMC coculture does not induce Treg proliferation in the absence of IL‐2. A, Representative dot‐plots of Ki67 expression within Treg cells (CD3+ CD4+ Foxp3+) at day 10 of MSC:PBMC 1:3, PBMC alone and PBMC with IL‐2 cultures. Frequency of Ki67+ cells (B,C) and Bcl‐2 median fluorescence intensity (MFI) (D,E) were assessed by flow cytometry within Tcon (CD3+ CD4+ Foxp3−) and Treg (CD3+ CD4+ Foxp3+) cells before and after culture (n = 4 for each culture condition). Graphs show mean values plus or minus SEM. Statistical analysis was performed using two‐way ANOVA (****P < .0001 between PBMC alone and MSC:PBMC 1:3)
We also investigated if the MSC‐induced increase in Treg numbers was associated with preferential cell survival by assessing the levels of the antiapoptotic protein Bcl‐2 (Figure 2D,E). MSC coculture increased the levels of Bcl‐2 within Treg (Figure 2D; P < .0001), but not within Tcon (Figure 2E), further suggesting a preferential impact of MSCs in Treg survival.
3.3. MSCs induce Tcon to acquire a Treg‐like phenotype
Given that Treg are increased but do not proliferate in the presence of MSCs, we hypothesized that Treg enrichment might be driven by Tcon acquiring a Treg‐like phenotype. To determine the mechanism by which MSCs increase the numbers of Treg‐like cells, purified Tcon (CD3+ CD4+ CD25−) were labeled with CFSE. These CFSE Tcon were then remixed with the remaining autologous nonlabeled PBMC, allowing us to track the phenotype and proliferation of Tcon cells during MSC+PBMC coculture. On day 0, all CFSE+ cells in the coculture were CD3+ CD4+ CD25− Foxp3− (Figure 3A). On day 10, a CD3+ CD4+ CD25+ Foxp3+ population was clearly observable within the CFSE+ gate (Figure 3A). Gating on these induced Treg‐like cells, CFSE dilution revealed they were proliferating (Figure 3A). These results show that MSCs induce a population of Tcon to acquire a Treg‐like phenotype, while proliferating.
FIGURE 3.

MSC coculture induces Tcon to acquire a Treg‐like phenotype, while proliferating. A, Tcon (CD3+ CD4+ CD25−) cells were purified by FACSorting, labeled with CFSE and remixed with the remaining autologous nonlabeled PBMC. These PBMC containing CFSE Tcon were cocultured with MSCs. On day 10, CD25+ Foxp3+ cells were found within the CFSE+ gate. Further gating within these CFSE+ Treg‐like cells showed they were proliferating. Representative dot‐plots are shown. B,C, CD4+ T cells were purified by magnetic cell separation and labeled with CFSE. B, CFSE Treg (CD3+ CD4+ CD25bright CD127low) cells were purified by FACSorting, remixed with autologous nonlabeled CD4neg PBMC, and cultured with or without MSCs. On day 10, gating on CD25+ Foxp3+ cells showed they were not proliferating. C, CFSE Tcon (CD3+ CD4+ CD25−) cells were purified by FACSorting, remixed with autologous nonlabeled CD4neg PBMC, and cultured with or without MSCs. On day 10, gating on CD25+ Foxp3+ cells showed these Treg‐like cells were proliferating, but not the cells that maintained a CD25− Foxp3− Tcon phenotype. Representative dot‐plots are shown. B,C, Graphs show the mean frequency of Treg (CD25+ CD127− Foxp3+) cells within CD4 T cells before and after culture, plus or minus SEM (n = 4 for each culture condition)
To further clarify this issue, we cocultured MSCs with either purified CFSE‐labeled Treg (Figure 3B) or Tcon (Figure 3C). CD4+ T cells were labeled with CFSE, and then purified into Treg (CD3+ CD4+ CD25bright CD127low) and Tcon (CD3+ CD4+ CD25−) by FACSorting. Each population was separately remixed with autologous unlabeled CD4neg PBMC and cultured with or without MSCs, so that the only CD4+ T cells present in culture on day 0 were either CFSE Treg (Figure 3B) or CFSE Tcon (Figure 3C). On day 10 of CFSE Treg coculture with MSCs, the CFSE+ population maintained the CD25+ Foxp3+ phenotype, showing brighter levels of CD25 and Foxp3 expression than on day 0 (Figure 3B; average fold increase in CD25 and Foxp3 MFI within CD4 T cells relative to day 0: 1.4 ± 0.2 and 1.3 ± 0.2, respectively). However, CFSE labeling remained unchanged, revealing that Treg do not proliferate in MSC coculture (Figure 3B). The frequency of CD25+ CD127− Foxp3+ cells within CD4 T cells remained very similar to that observed on day 0 throughout the culture period, in the presence or absence of MSCs (Figure 3B). These data show that nTreg are maintained but not expanded by MSC coculture. As for CFSE Tcon, we again observed the induction of a proliferating Treg‐like population and the consequent increase in the frequency of CD25+ CD127− Foxp3+ cells during coculture with MSCs (Figure 3C). In contrast, when we gated on the CFSE+ cells that maintained a CD25− Foxp3− Tcon phenotype, we found that these cells do not proliferate (Figure 3C). Therefore, Treg enrichment by MSCs appears to be due to induction of Treg‐like cells from Tcon, rather than to Treg expansion.
3.4. Treg‐like cells induced by MSCs are suppressive
To determine if MSC‐induced Treg‐like cells also resemble Treg in terms of functional ability, we performed suppression assays. We cocultured PBMC, purified Tcon or purified Treg with MSCs, and FACSorted the resulting Treg‐like populations on day 10 (Figure 4A). The Treg population obtained after PBMC+MSC coculture, Treg (PBMC+MSC), encompasses both preexisting nTreg and MSC‐induced Treg‐like cells. The CD25high CD127low population purified after Tcon+MSC coculture consists exclusively of MSC‐induced Treg‐like cells: iTreg (Tcon+MSC). The Treg cells isolated after Treg+MSC coculture are nTreg: nTreg (Treg+MSC). We also tested the suppressive ability of the untouched cocultures, straight out of the well. These unsorted cocultures comprise all the cell types present in culture, including MSCs. The suppressive ability of the unsorted cocultures (Figure 4B) and of the Purified Treg‐like cells (Figure 4C) was assessed in suppression assays using autologous fresh Tcon labeled with CFSE as responder cells. As a positive control, we used autologous fresh Treg.
FIGURE 4.

MSC‐induced Treg‐like cells are suppressive. Total PBMC, purified Tcon (CD3+ CD4+ CD25−), plus CD4neg PBMC or purified Treg (CD3+ CD4+ CD25bright CD127low) plus CD4neg PBMC were cocultured with MSCs. A, Representative dot‐plots showing the unsorted cocultures (green gates) and the FACSorted CD25bright CD127low cells (red gates) from these cocultures on day 10. The suppressive function of either the unsorted cocultures (B) or of FACSorted CD25bright CD127low cells (C) was tested using autologous CFSE‐labeled fresh Tcon as responder cells. D, Frequency of divided fresh Tcon responder cells in the presence of different suppressor populations (unsorted PBMC+MSC n = 6; Treg purified from PBMC+MSC cocultures n = 7; unsorted Tcon+MSC n = 5; induced Treg cells purified from Tcon+MSC cocultures n = 4; unsorted Treg+MSC n = 6; natural Treg purified from Treg+MSC cocultures n = 5; fresh autologous Treg n = 7) at a 1:1 ratio. Graphs show the mean frequency of divided cells plus or minus SEM. Statistical analysis was performed using one‐way ANOVA followed by Dunnett's multiple comparisons test (***P < .001, ****P < .0001)
We observed a significant suppression of Tcon proliferation by all unsorted cocultures (Figure 4D, % divided cells at 1:1 Tcon:Treg ratio compared to Tcon alone, one‐way ANOVA followed by Dunnett's multiple comparisons analysis, P < .0001). Purified Treg‐like populations significantly suppressed autologous Tcon proliferation in a similar degree to that observed with fresh Treg (P < .0001): Treg (PBMC+MSC) P < .0001; iTreg (Tcon+MSC) P = .0002; nTreg (Treg+MSC) P < .0001 (Figure 4D). Thus, MSC‐induced Treg‐like cells are suppressive.
3.5. MSC‐induced Treg are epigenetically similar to nTreg
We next investigated whether the DNA methylation profile of MSC‐induced Treg resembles that of nTreg or of the Tcon they arose from. For that purpose, we purified CD25+ Foxp3+ Treg‐like cells induced from Tcon+MSC coculture (iTreg), and compared them to fresh nTreg and fresh Tcon from the same donor. The Treg‐specific demethylated region (TSDR) of the FOXP3 locus has been reported to be demethylated in nTreg, and mostly methylated in iTreg and Tcon cells. 16 , 17 , 18 , 19 We first analyzed the methylation status of 15 CpG sites within both the coding and template strands of the 700 bp region covering the TSDR in iTreg purified after Tcon+MSC coculture, as well as in fresh nTreg and fresh Tcon from the same donor. In all donors analyzed (two male, one female), we found no differences in methylation among fresh Tcon, fresh nTreg, and iTreg. Both coding and template strands had the average methylation levels for CpG 1 to 15 of 100% in all cell populations (data not shown). Since no differences were detected between our cell populations, we sought an alternative to TSDR methylation analysis.
CAMTA1 (calmodulin‐binding transcription activator 1) has been shown by us and others to distinguish Tcon from Treg subsets in both male and female donors. 15 , 16 In particular, CpG 2 and 11 are strikingly more demethylated in Treg. 15 We assessed the methylation status of 13 CpG sites within the 470 bp CAMTA1 intronic region 3 in fresh nTreg, fresh Tcon, and iTreg (Figure 5). MSC‐induced Treg‐like cells (iTreg) displayed a methylation pattern similar to that of fresh nTreg (Figure 5A). The average difference in the frequency of methylation for each CpG revealed higher levels of methylation in fresh Tcon compared to fresh nTreg and iTreg, whereas fresh nTreg and iTreg displayed no major differences (Figure 5B). Focusing on CpG 2 and 11, these sites were consistently more demethylated in fresh nTreg and in iTreg than in fresh Tcon (Figure 5C). The average difference in the frequency of methylation of CpG 2 and 11 between fresh nTreg and iTreg was significantly lower than the difference between fresh Tcon and nTreg (P = .035), and that between fresh Tcon and iTreg (P = .0216; Figure 5D). Hence, the epigenetic profile of MSC‐induced Treg‐like cells more closely resembles that of nTreg than of Tcon.
FIGURE 5.

MSC‐induced Treg‐like cells resemble natural Treg epigenetically. Fresh Tcon (CD3+ CD4+ CD25−) and nTreg (CD3+ CD4+ CD25bright CD127low) were purified by FACSorting. Purified Tcon plus CD4neg PBMC were cocultured with MSCs. On day 10, Treg‐like cells (iTreg, CD25bright CD127low) were FACSorted from Tcon+MSC cocultures. A, The methylation status of 13 CpG sites within the CAMTA1 intronic region 3 was analyzed on the coding DNA strand on fresh nTreg, fresh Tcon, and iTreg samples from three different donors. B,The average difference in the frequency of methylation for each CpG was calculated between fresh Tcon and fresh nTreg, between fresh Tcon and iTreg, and between fresh nTreg and iTreg: Δ (Tcon − nTreg), Δ (Tcon − iTreg), and Δ (nTreg − iTreg), respectively. Graphs show the frequency of methylation (C) and the average difference in the frequency of methylation (D) within CpGs 2 and 11 for each donor. Statistical analysis was performed using paired t test (*P < .05, **P < .01)
3.6. PD‐1/PDL‐1 levels increase after MSC coculture
To better understand the mechanism of Treg induction by MSCs, we analyzed the expression of functional markers associated with Treg induction/expansion. CD15s expression identifies activated and highly suppressive Foxp3high effector Treg cells. 20 The basal frequency of CD15s+ cells was significantly higher in fresh Treg than in fresh Tcon (Figure 6A; P < .0001). After MSC coculture, natural and induced Treg displayed a similar frequency of CD15s+ cells, which was higher than that observed in the cells that maintained a Tcon phenotype (Figure 6A). GITR (glucocorticoid‐induced tumor necrosis factor‐related receptor) is constitutively expressed at high levels on Treg and activated effector T cells. 21 , 22 In mice, GITR engagement enhances Treg proliferation in vitro and in vivo. 23 , 24 We did not observe any significant differences in GITR expression between Treg (natural or induced) and Tcon, before and after MSC coculture (Figure 6B). Programmed death‐1 (PD‐1) and PD‐1 ligand (PDL‐1) interaction is critical for the conversion of Tcon into Treg cells, as well as for the maintenance and function of iTreg. 25 , 26 PD‐1 basal levels were similar in fresh Treg and Tcon (Figure 6C). After MSC coculture, iTreg expressed higher PD‐1 levels than nTreg and the cells that remained Tcon (Figure 6C; P = .0221 and P = .0062, respectively). We also analyzed the expression of PDL‐1 on MSCs before and after culture. The frequency of PDL‐1‐expressing cells significantly increased in MSCs after coculture with PBMC, but not when MSCs were cultured alone (Figure 6D; P = .0483). These results suggest a role for the PD‐1/PDL‐1 pathway in the induction of Treg‐like cells in MSC cocultures.
FIGURE 6.

Treg‐like cells express functional markers associated with Treg induction/expansion. Purified Treg or Tcon plus CD4neg PBMC were cocultured with MSCs. The frequency of CD15s (A, n = 6), GITR (B, n = 4), and PD‐1 (C, n = 6) expressing cells was determined by flow cytometry within Treg and Tcon before (fresh Treg, fresh Tcon) and after 10 days of MSC coculture. Analysis was performed by gating on Treg (CD3+ CD4+ CD25bright CD127low) cells from Treg plus MSC cocultures (nTreg [Treg+MSC]) or from Tcon plus MSC cocultures (iTreg [Tcon+MSC]), as well as on Tcon from Tcon plus MSC cocultures (Tcon [Tcon+MSC]). The frequency of PDL‐1 expressing cells (D, n = 3) was assessed on fresh MSCs (day 0) and after a 10‐day culture alone (MSC alone) or with PBMC (PBMC+MSC). Graphs show mean values plus or minus SEM. Statistical analysis was performed using one‐way ANOVA followed by Tukey's multiple comparisons test (*P < .05, **P < .01, ****P < .0001)
3.7. TGF‐β levels increase in the presence of MSCs
We quantified cytokine levels in MSC coculture supernatants to determine which cytokines are potentially involved in the conversion of Tcon into Treg‐like cells. Supernatants were collected at different time points from MSC+PBMC cocultures or PBMC cultured alone. We found that the levels of the regulatory cytokines TGF‐β (Figure 7A; P = .0005) and IL‐10 (Figure 7B) were increased in the presence of MSCs. In contrast, the levels of the proinflammatory cytokines TNF‐α (Figure 7C) and IFN‐γ (Figure 7D) were lower in MSC+PBMC than in PBMC alone supernatants. We also quantified the levels of cytokines associated with MSC function. However, we observed no major differences in the levels of PGE‐2 (Figure 7E) and IDO (Figure 7F) between the supernatants of PBMC cultured alone or with MSCs. The increased levels of TGF‐β in MSC cocultures suggest that this cytokine may be involved in the induction of Treg‐like cells.
FIGURE 7.

Supernatant levels of anti‐inflammatory cytokines increase in MSC cocultures. PBMC were cultured alone or with MSCs for 14 days. Supernatants were collected at different time points and the levels of the anti‐inflammatory cytokines TGF‐β (A) and IL‐10 (B), the proinflammatory cytokines TNF‐α (C) and IFN‐γ (D), and the MSC cytokines PGE‐2 (E) and IDO (F) were quantified by single or multiplex ELISA array. Graphs show mean values plus or minus SEM (n = 4). Statistical analysis was performed using two‐way ANOVA (***P < .001 between PBMC alone and MSC:PBMC 1:3)
4. DISCUSSION
The present study investigated the potential of MSCs to expand Treg in vitro. We found that cocultures of human PBMC with allogeneic BM‐derived MSCs specifically increase the numbers and frequency of CD4+ CD25high Foxp3+ CD127low Treg‐like cells. We further observed that this increase in Treg after MSC coculture is mainly due to the induction and expansion of a Treg‐like population from Tcon, rather than to nTreg expansion.
Previous reports on MSC‐induced Treg have not differentiated between preexisting nTreg and the induced Treg population, and thus have not adequately demonstrated that MSC‐induced Treg are functional. 11 , 27 , 28 Of note, Engela et al 29 have reported that adipose tissue‐derived MSCs (ASCs) induce a functional Treg population with a predominantly methylated TSDR in mixed lymphocyte reactions. However, their starting population contained nTreg, which likely persisted after culture and thus contaminated the supposed ASC‐induced Treg population. Our study demonstrates for the first time that human MSCs induce a functional Treg‐like population from purified Tcon through epigenetic modification.
We further found that the unsorted MSC cocultures are also suppressive. This may be an important feature for the translation of MSC‐induced Treg into adoptive cellular therapy protocols, as it could bypass the need to purify Treg after coculture. It is possible that the MSCs present in these unsorted cocultures also contribute to the observed suppression. Like Treg, MSCs have also been recognized for their potential application in the treatment of chronic inflammatory diseases. Although the vast majority of MSC clinical trials in the GVHD setting have only addressed acute GVHD, 30 MSC infusion has also been reported to improve clinical response in cGVHD. 31 However, preliminary results from a phase III clinical trial showed no significant improvement of cGvHD. 30 Hence, the outcome of MSC therapy in cGVHD remains to be adequately determined. The coadministration of MSCs and Treg might have the potential to constitute a more effective cellular therapy approach by harnessing the suppressive capacity of both these immunomodulatory populations.
The mechanisms by which MSCs increase the frequency of cells with a Treg phenotype have not been fully elucidated by previous studies. There are contradictory reports on whether this MSC‐mediated effect is dependent on cell contact 27 , 28 , 32 or not. 9 , 10 , 11 , 33 Different mechanisms have been proposed to play a role, such as TGF‐β, 11 , 27 IL‐2, 29 Notch‐1, 34 heme oxygenase‐1 (HO‐1), 35 and HLA‐G5 secretion. 32 To address this issue, we assessed the expression of functional markers that are associated with Treg induction and/or expansion. After Tcon coculture with MSCs, MSC‐induced Treg expressed higher levels of PD‐1 and CD15s than the cells that maintained a Tcon phenotype. MSC coculture has been shown to increase the frequency of PD‐1‐expressing cells on activated Treg, which appeared to be coupled to an enhanced suppressive ability. 36 We found that MSC‐induced Treg are suppressive, which might be related to the upregulation of PD‐1 and CD15s. Interestingly, the frequency of MSCs expressing PDL‐1 also increased after coculture. PD‐L1 has been reported to be involved in MSC‐mediated immunomodulation. 37 In cocultures of cardiac stem/progenitor cells with HLA‐mismatched PBMC, the increase in the frequency of Treg cells has been shown to be PD‐L1‐dependent. 38 As for the cytokines that might mediate the induction of Treg by MSCs, the significantly higher levels of TGF‐β observed in MSC cocultures indicate it may play a role in this process. TGF‐β–induced Treg have been suggested to be less stable than nTreg, likely due to epigenetic regulation. The potential therapeutic application of MSC‐induced Treg‐like cells would hinge on these cells being epigenetically stable. Hence, we investigated the DNA methylation profile of MSC‐induced Treg‐like cells.
Stable Foxp3 expression, as well as lineage commitment and suppressive function of Treg, has been associated with DNA demethylation of the promoter and TSDR regions of the FOXP3 locus. 39 This pattern has been proposed as a molecular marker that could help distinguish Treg from Tcon. 16 , 39 , 40 However, since FOXP3 is encoded on the X chromosome (Xp11.23), most studies have used male donors so as to circumvent the artifacts of X‐chromosome inactivation. We have previously demonstrated that hypomethylation of CpG sites in four FOXP3 gene regions, the CAMTA1 intronic region and the FUT7 promoter can be used to distinguish Treg subsets, based on CD45RA and CD15s expression, and Tcon cells in both male and female donors. 15 Importantly, this work reported for the first time a strand‐bias methylation profile for TSDR in donors of both genders, in which the coding strand is fully methylated in both Tcon and Treg cells, whereas the template strand follows the previously described methylation pattern with the TSDR being more demethylated in Treg subsets and mostly methylated in Tcon. 15 In light of these results, we analyzed the TSDR methylation pattern in both strands and assessed the methylation of CAMTA1 as an additional molecular marker to help distinguish Treg from Tcon. We found that the TSDR was fully methylated in both the coding and template strands from fresh Treg, fresh Tcon, and induced Treg‐like cells from both male and female donors. We performed this epigenetic analysis in bulk Treg and not on purified Treg subsets, which may explain why both strands were fully methylated within TSDR. First, CD45RA+CD15s− naive Treg, which have the most demethylated profile within TSDR, only account for approximately 20% of the Treg pool. Therefore, the chances of amplifying a demethylated strand within a bulk Treg sample are very slim. Second, PCR and cloning bias have been reported to result in the preferential quantification of either methylated or the unmethylated DNA, 41 , 42 which could favor the amplification of methylated strands within the more abundant non‐naïve Treg cells. Since TSDR analysis did not reveal any epigenetic differences between the cell populations, we also assessed the methylation status of CAMTA1. Treg‐like cells displayed a CAMTA1 methylation pattern that more closely resembled that of fresh Treg than that of the fresh Tcon they arose from. In particular, CpG 2 and 11 were consistently more demethylated in both fresh Treg and induced Treg‐like cells than in fresh Tcon. We have demonstrated that these two CpG positions are the ones that best distinguish Treg from Tcon. 15 Of note, CpG 2 and 11 in CAMTA1 are immediately adjacent to the predicted binding sites of the transcription factors Foxp3, TFII‐I, and YY‐I. 15 This close proximity may be critical for the generation and stability of MSC‐induced Treg‐like cells.
5. CONCLUSION
In summary, we demonstrate that human BM MSCs induce a Treg‐like population from purified Tcon, which is functionally suppressive and displays a DNA methylation profile that closely resembles that of nTreg. MSCs induce the generation of this Treg‐like population possibly through mechanisms involving TGF‐β and/or PD‐1/PDL‐1. Our data shed new light into the origin, functional potential, and stability of MSC‐induced Treg‐like cells, which are key features for their potential applicability in the clinical setting.
CONFLICT OF INTEREST
The authors declared no potential conflicts of interest.
AUTHOR CONTRIBUTIONS
R.I.A.: conception and design, collection and assembly of data, data analysis and interpretation, manuscript writing; E.M.: epigenetic analysis; A.F.‐P., C.L.S., J.M.S.C.: MSC isolation and expansion, manuscript review; A.I.S.V.: flow cytometry support; J.F.L.: conception and design, final approval of manuscript.
ACKNOWLEDGMENTS
This project received funding from: Fundação para a Ciência e Tecnologia, Portugal, under the Harvard Medical School‐Portugal Program project Induction of Immune Tolerance in Human Allogeneic Hematopoietic Stem Cell Transplantation (HMSP‐ICT/0001/2011) and UID/BIM/50005/2019, project funded by Fundação para a Ciência e a Tecnologia (FCT)/Ministério da Ciência, Tecnologia e Ensino Superior (MCTES) through Fundos do Orçamento de Estado. We also acknowledge the funding received from POR Lisboa 2020 through the project PRECISE – Accelerating progress toward the new era of precision medicine (project no. 16394).
Azevedo RI, Minskaia E, Fernandes‐Platzgummer A, et al. Mesenchymal stromal cells induce regulatory T cells via epigenetic conversion of human conventional CD4 T cells in vitro. Stem Cells. 2020;38:1007–1019. 10.1002/stem.3185
Funding information Fundação para a Ciência e a Tecnologia (FCT)/Ministério da Ciência, Tecnologia e Ensino Superior (MCTES); Fundação para a Ciência e Tecnologia, Portugal
DATA AVAILABILITY STATEMENT
The data that support the findings of this study are available from the corresponding author upon reasonable request.
REFERENCES
- 1. Matsuoka K, Kim HT, McDonough S, et al. Altered regulatory T cell homeostasis in patients with CD4+ lymphopenia following allogeneic hematopoietic stem cell transplantation. J Clin Invest. 2010;120:1479‐1493. [DOI] [PMC free article] [PubMed] [Google Scholar]
- 2. Soares MV, Azevedo RI, Ferreira IA, et al. Naive and stem cell memory T cell subset recovery reveals opposing reconstitution patterns in CD4 and CD8 T cells in chronic graft vs host disease. Front Immunol. 2019;10:334. [DOI] [PMC free article] [PubMed] [Google Scholar]
- 3. Brunstein CG, Miller JS, Cao Q, et al. Infusion of ex vivo expanded T regulatory cells in adults transplanted with umbilical cord blood: safety profile and detection kinetics. Blood. 2011;117:1061‐1070. [DOI] [PMC free article] [PubMed] [Google Scholar]
- 4. Brunstein CG, Miller JS, McKenna DH, et al. Umbilical cord blood‐derived T regulatory cells to prevent GVHD: kinetics, toxicity profile, and clinical effect. Blood. 2016;127:1044‐1051. [DOI] [PMC free article] [PubMed] [Google Scholar]
- 5. Di Ianni M, Falzetti F, Carotti A, et al. Tregs prevent GVHD and promote immune reconstitution in HLA‐haploidentical transplantation. Blood. 2011;117:3921‐3928. [DOI] [PubMed] [Google Scholar]
- 6. Hoffmann P, Eder R, Boeld TJ, et al. Only the CD45RA+ subpopulation of CD4+CD25high T cells gives rise to homogeneous regulatory T‐cell lines upon in vitro expansion. Blood. 2006;108:4260‐4267. [DOI] [PubMed] [Google Scholar]
- 7. Simões IN, Boura JS, dos Santos F, et al. Human mesenchymal stem cells from the umbilical cord matrix: successful isolation and ex vivo expansion using serum‐/xeno‐free culture media. Biotechnol J. 2013;8:448‐458. [DOI] [PubMed] [Google Scholar]
- 8. Bassi EJ, Aita CAM, Câmara NOS. Immune regulatory properties of multipotent mesenchymal stromal cells: where do we stand? World J Stem Cells. 2011;3:1‐8. [DOI] [PMC free article] [PubMed] [Google Scholar]
- 9. Najar M, Rouas R, Raicevic G, et al. Mesenchymal stromal cells promote or suppress the proliferation of T lymphocytes from cord blood and peripheral blood: the importance of low cell ratio and role of interleukin‐6. Cytotherapy. 2009;11:570‐583. [DOI] [PubMed] [Google Scholar]
- 10. Crop MJ, Baan CC, Korevaar SS, Ijzermans JNM, Weimar W, Hoogduijn MJ. Human adipose tissue‐derived mesenchymal stem cells induce explosive T‐cell proliferation. Stem Cells Dev. 2010;19:1843‐1853. [DOI] [PubMed] [Google Scholar]
- 11. Melief SM, Schrama E, Brugman MH, et al. Multipotent stromal cells induce human regulatory T cells through a novel pathway involving skewing of monocytes toward anti‐inflammatory macrophages. Stem Cells. 2013;31:1980‐1991. [DOI] [PubMed] [Google Scholar]
- 12. Ivanova‐Todorova E, Bochev I, Dimitrov R, et al. Conditioned medium from adipose tissue‐derived mesenchymal stem cells induces CD4+FOXP3+ cells and increases IL‐10 secretion. J Biomed Biotechnol. 2012;295167 10.1155/2012/295167. [DOI] [PMC free article] [PubMed] [Google Scholar]
- 13. Di Ianni M, Del Papa B, De Ioanni M, et al. Mesenchymal cells recruit and regulate T regulatory cells. Exp Hematol. 2008;36:309‐318. [DOI] [PubMed] [Google Scholar]
- 14. Dos Santos F, Andrade PZ, Boura JS, Abecasis MM, da Silva CL, Cabral JM. Ex vivo expansion of human mesenchymal stem cells: a more effective cell proliferation kinetics and metabolism under hypoxia. J Cell Physiol. 2010;223:27‐35. [DOI] [PubMed] [Google Scholar]
- 15. Minskaia E, Saraiva BC, Soares MMV, et al. Molecular markers distinguishing T cell subtypes with TSDR strand‐bias methylation. Front Immunol. 2018;9:2540. [DOI] [PMC free article] [PubMed] [Google Scholar]
- 16. Baron U, Floess S, Wieczorek G, et al. DNA demethylation in the human FOXP3 locus discriminates regulatory T cells from activated FOXP3(+) conventional T cells. Eur J Immunol. 2007;37:2378‐2389. [DOI] [PubMed] [Google Scholar]
- 17. Kim H‐P, Leonard WJ. CREB/ATF‐dependent T cell receptor–induced FoxP3 gene expression: a role for DNA methylation. J Exp Med. 2007;204:1543‐1551. [DOI] [PMC free article] [PubMed] [Google Scholar]
- 18. Ruan Q, Kameswaran V, Tone Y, et al. Development of Foxp3(+) regulatory t cells is driven by the c‐Rel enhanceosome. Immunity. 2009;31:932‐940. [DOI] [PMC free article] [PubMed] [Google Scholar]
- 19. Polansky JK, Kretschmer K, Freyer J, et al. DNA methylation controls Foxp3 gene expression. Eur J Immunol. 2008;38:1654‐1663. [DOI] [PubMed] [Google Scholar]
- 20. Miyara M, Chader D, Sage E, et al. Sialyl Lewis x (CD15s) identifies highly differentiated and most suppressive FOXP3high regulatory T cells in humans. Proc Natl Acad Sci. 2015;112:7225‐7230. [DOI] [PMC free article] [PubMed] [Google Scholar]
- 21. Shimizu J, Yamazaki S, Takahashi T, Ishida Y, Sakaguchi S. Stimulation of CD25+CD4+ regulatory T cells through GITR breaks immunological self‐tolerance. Nat Immunol. 2002;3:135‐142. [DOI] [PubMed] [Google Scholar]
- 22. Krausz LT, Bianchini R, Ronchetti S, Fettucciari K, Nocentini G, Riccardi C. GITR‐GITRL system, a novel player in shock and inflammation. Sci World J. 2007;7:533‐566. [DOI] [PMC free article] [PubMed] [Google Scholar]
- 23. Igarashi H, Cao Y, Iwai H, et al. GITR ligand‐costimulation activates effector and regulatory functions of CD4+ T cells. Biochem Biophys Res Commun. 2008;369:1134‐1138. [DOI] [PubMed] [Google Scholar]
- 24. Liao G, Nayak S, Regueiro JR, et al. GITR engagement preferentially enhances proliferation of functionally competent CD4+CD25+FoxP3+ regulatory T cells. Int Immunol. 2010;22:259‐270. [DOI] [PMC free article] [PubMed] [Google Scholar]
- 25. Francisco LM, Salinas VH, Brown KE, et al. PD‐L1 regulates the development, maintenance, and function of induced regulatory T cells. J Exp Med. 2009;206:3015‐3029. [DOI] [PMC free article] [PubMed] [Google Scholar]
- 26. Amarnath S, Mangus CW, Wang JCM, et al. The PDL1‐PD1 axis converts human Th1 cells into regulatory T cells. Sci Transl Med. 2011;3:111‐120. [DOI] [PMC free article] [PubMed] [Google Scholar]
- 27. English K, Ryan JM, Tobin L, Murphy MJ, Barry FP, Mahon BP. Cell contact, prostaglandin E(2) and transforming growth factor beta 1 play non‐redundant roles in human mesenchymal stem cell induction of CD4+CD25(high) forkhead box P3+ regulatory T cells. Clin Exp Immunol. 2009;156:149‐160. [DOI] [PMC free article] [PubMed] [Google Scholar]
- 28. Prevosto C, Zancolli M, Canevali P, Zocchi MR, Poggi A. Generation of CD4+ or CD8+ regulatory T cells upon mesenchymal stem cell‐lymphocyte interaction. Haematologica. 2007;92:881‐888. [DOI] [PubMed] [Google Scholar]
- 29. Engela AU, Hoogduijn MJ, Boer K, et al. Human adipose‐tissue derived mesenchymal stem cells induce functional de‐novo regulatory T cells with methylated FOXP3 gene DNA. Clin Exp Immunol. 2013;173:343‐354. [DOI] [PMC free article] [PubMed] [Google Scholar]
- 30. Kollar K, Seifried E, Henschler R. Therapeutic potential of intravenously administered human mesenchymal stromal cells. Hamostaseologie. 2011;31:269‐274. [DOI] [PubMed] [Google Scholar]
- 31. Weng JY, Du X, Geng SX, et al. Mesenchymal stem cell as salvage treatment for refractory chronic GVHD. Bone Marrow Transplant. 2010;45:1732‐1740. [DOI] [PMC free article] [PubMed] [Google Scholar]
- 32. Selmani Z, Naji A, Zidi I, et al. Human leukocyte antigen‐G5 secretion by human mesenchymal stem cells is required to suppress T lymphocyte and natural killer function and to induce CD4+CD25highFOXP3+ regulatory T cells. Stem Cells. 2008;26:212‐222. [DOI] [PubMed] [Google Scholar]
- 33. Demircan PC, Sariboyaci AE, Unal ZS, Gacar G, Subasi C, Karaoz E. Immunoregulatory effects of human dental pulp‐derived stem cells on T cells: comparison of transwell co‐culture and mixed lymphocyte reaction systems. Cytotherapy. 2011;13:1205‐1220. [DOI] [PubMed] [Google Scholar]
- 34. Del Papa B, Sportoletti P, Cecchini D, et al. Notch1 modulates mesenchymal stem cells mediated regulatory T‐cell induction. Eur J Immunol. 2013;43:182‐187. [DOI] [PubMed] [Google Scholar]
- 35. Mougiakakos D, Jitschin R, Johansson CC, Okita R, Kiessling R, le Blanc K. The impact of inflammatory licensing on heme oxygenase‐1‐mediated induction of regulatory T cells by human mesenchymal stem cells. Blood. 2011;117:4826‐4835. [DOI] [PubMed] [Google Scholar]
- 36. Yan Z, Zhuansun Y, Chen R, Li J, Ran P. Immunomodulation of mesenchymal stromal cells on regulatory T cells and its possible mechanism. Exp Cell Res. 2014;324:65‐74. [DOI] [PubMed] [Google Scholar]
- 37. Sheng H, Wang Y, Jin Y, et al. A critical role of IFNγ in priming MSC‐mediated suppression of T cell proliferation through up‐regulation of B7‐H1. Cell Res. 2008;18:846‐857. [DOI] [PubMed] [Google Scholar]
- 38. Lauden L, Boukouaci W, Borlado LR, et al. Allogenicity of human cardiac stem/progenitor cells orchestrated by programmed death ligand 1. Circ Res. 2013;112:451‐464. [DOI] [PubMed] [Google Scholar]
- 39. Zheng Y, Josefowicz S, Chaudhry A, Peng XP, Forbush K, Rudensky AY. Role of conserved non‐coding DNA elements in the Foxp3 gene in regulatory T‐cell fate. Nature. 2010;463:808‐812. [DOI] [PMC free article] [PubMed] [Google Scholar]
- 40. Kennedy A, Schmidt EM, Cribbs AP, et al. A novel upstream enhancer of FOXP3, sensitive to methylation‐induced silencing, exhibits dysregulated methylation in rheumatoid arthritis Treg cells. Eur J Immunol. 2014;44:2968‐2978. [DOI] [PubMed] [Google Scholar]
- 41. Grunau C. Bisulfite genomic sequencing: systematic investigation of critical experimental parameters. Nucleic Acids Res. 2001;29:65e‐65e. [DOI] [PMC free article] [PubMed] [Google Scholar]
- 42. Ji L, Sasaki T, Sun X, et al. Methylated DNA is over‐represented in whole‐genome bisulfite sequencing data. Front Genet. 2014;5:341. [DOI] [PMC free article] [PubMed] [Google Scholar]
Associated Data
This section collects any data citations, data availability statements, or supplementary materials included in this article.
Data Availability Statement
The data that support the findings of this study are available from the corresponding author upon reasonable request.