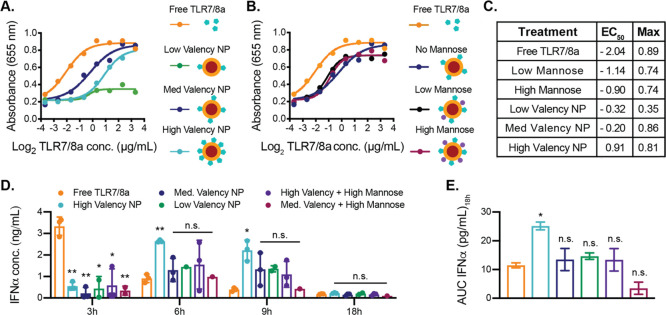
Figure 2.
In vitro and in vivo activity of TLR7/8a NPs. (a, b) Activity graphs across a range of TLR7/8a concentrations (0.08–10 μg/mL) delivered on NPs at different densities, on NPs with or without mannose, or as free TLR7/8a to the RAW-Blue murine macrophage reporter cell line (Invivogen). The absorbance at 655 nm is an output for TLR activation in this cell line. (c) EC50 values (using a log(agonist) vs response) and maximum absorbance values for each activation curve. (d) ELISA analysis of IFNα in serum of C57BL/6 mice 3–18 h after intraperitoneal administration of NP or free TLR7/8a treatments (n = 3). (e) Area-under-the-curve (AUC) of IFNα in serum from 3 to 18 h (n = 3). (d, e) Data depict mean ± standard error of the mean (SEM); values were analyzed by ordinary one-way ANOVA with multiple comparisons to the control group (*p < 0.05, **p < 0.01).

